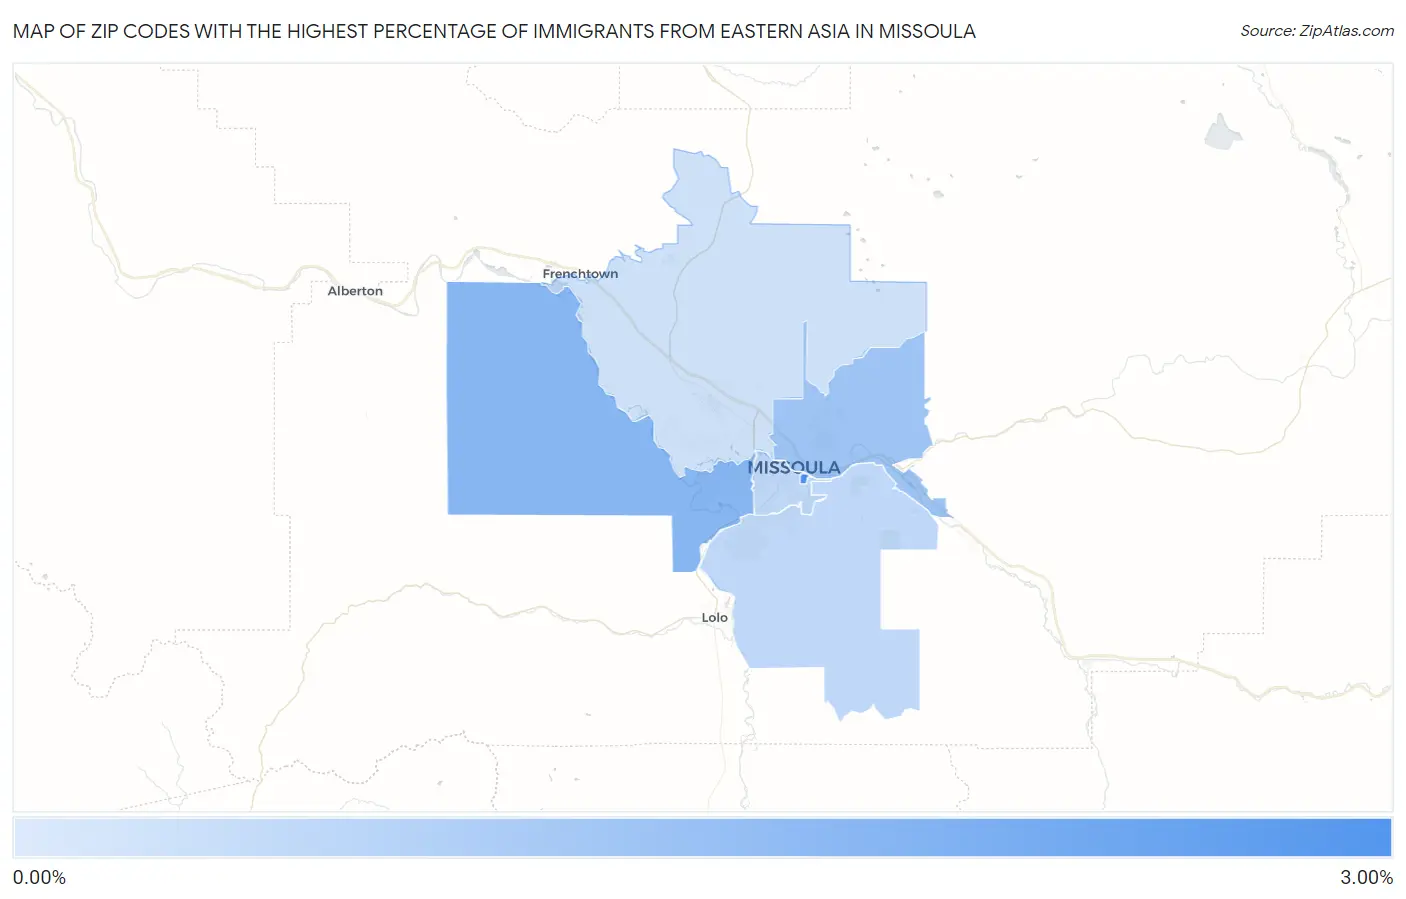
Zip Codes with the Highest Percentage of Immigrants from Eastern Asia in Missoula, MT
RELATED REPORTS & OPTIONS
Eastern Asia
Missoula
Compare Zip Codes
Map of Zip Codes with the Highest Percentage of Immigrants from Eastern Asia in Missoula
0.00%
3.00%
Zip Codes with the Highest Percentage of Immigrants from Eastern Asia in Missoula, MT
| Zip Code | Eastern Asia | vs State | vs National | |
| 1. | 59812 | 2.58% | 0.25%(+2.33)#4 | 1.28%(+1.30)#1,549 |
| 2. | 59804 | 1.45% | 0.25%(+1.21)#7 | 1.28%(+0.177)#2,752 |
| 3. | 59802 | 1.08% | 0.25%(+0.834)#11 | 1.28%(-0.195)#3,636 |
| 4. | 59801 | 0.53% | 0.25%(+0.282)#24 | 1.28%(-0.748)#6,374 |
| 5. | 59803 | 0.52% | 0.25%(+0.274)#25 | 1.28%(-0.755)#6,422 |
| 6. | 59808 | 0.25% | 0.25%(+0.007)#40 | 1.28%(-1.02)#9,417 |
1
Common Questions
What are the Top 5 Zip Codes with the Highest Percentage of Immigrants from Eastern Asia in Missoula, MT?
Top 5 Zip Codes with the Highest Percentage of Immigrants from Eastern Asia in Missoula, MT are:
What zip code has the Highest Percentage of Immigrants from Eastern Asia in Missoula, MT?
59812 has the Highest Percentage of Immigrants from Eastern Asia in Missoula, MT with 2.58%.
What is the Percentage of Immigrants from Eastern Asia in Missoula, MT?
Percentage of Immigrants from Eastern Asia in Missoula is 0.77%.
What is the Percentage of Immigrants from Eastern Asia in Montana?
Percentage of Immigrants from Eastern Asia in Montana is 0.25%.
What is the Percentage of Immigrants from Eastern Asia in the United States?
Percentage of Immigrants from Eastern Asia in the United States is 1.28%.