Zip Codes with the Highest Percentage of Population Employed in Accommodation & Food Services in Missoula, MT
RELATED REPORTS & OPTIONS
Accommodation & Food Services
Missoula
Compare Zip Codes
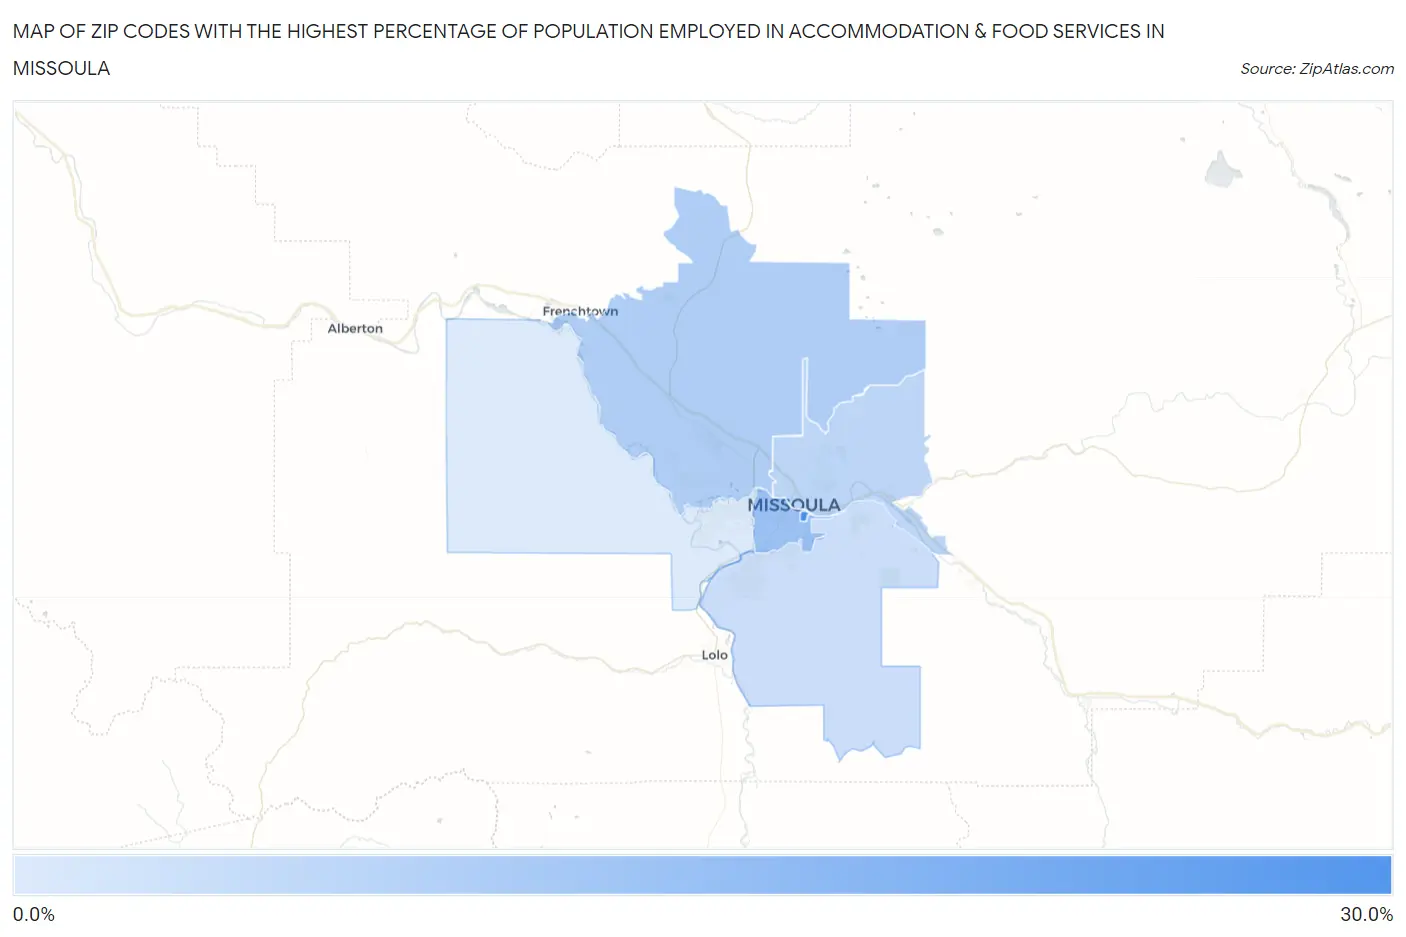
Map of Zip Codes with the Highest Percentage of Population Employed in Accommodation & Food Services in Missoula
0.0%
30.0%
Zip Codes with the Highest Percentage of Population Employed in Accommodation & Food Services in Missoula, MT
| Zip Code | % Employed | vs State | vs National | |
| 1. | 59812 | 25.1% | 8.3%(+16.9)#21 | 6.9%(+18.3)#497 |
| 2. | 59801 | 13.9% | 8.3%(+5.59)#43 | 6.9%(+6.98)#2,012 |
| 3. | 59808 | 11.4% | 8.3%(+3.12)#67 | 6.9%(+4.50)#3,247 |
| 4. | 59802 | 9.9% | 8.3%(+1.59)#86 | 6.9%(+2.98)#4,711 |
| 5. | 59803 | 8.1% | 8.3%(-0.142)#114 | 6.9%(+1.24)#7,584 |
| 6. | 59804 | 5.9% | 8.3%(-2.35)#171 | 6.9%(-0.966)#13,731 |
1
Common Questions
What are the Top 5 Zip Codes with the Highest Percentage of Population Employed in Accommodation & Food Services in Missoula, MT?
Top 5 Zip Codes with the Highest Percentage of Population Employed in Accommodation & Food Services in Missoula, MT are:
What zip code has the Highest Percentage of Population Employed in Accommodation & Food Services in Missoula, MT?
59812 has the Highest Percentage of Population Employed in Accommodation & Food Services in Missoula, MT with 25.1%.
What is the Percentage of Population Employed in Accommodation & Food Services in Missoula, MT?
Percentage of Population Employed in Accommodation & Food Services in Missoula is 12.5%.
What is the Percentage of Population Employed in Accommodation & Food Services in Montana?
Percentage of Population Employed in Accommodation & Food Services in Montana is 8.3%.
What is the Percentage of Population Employed in Accommodation & Food Services in the United States?
Percentage of Population Employed in Accommodation & Food Services in the United States is 6.9%.