Zip Codes with the Highest Percentage of Immigrants from Philippines in Missoula, MT
RELATED REPORTS & OPTIONS
Philippines
Missoula
Compare Zip Codes
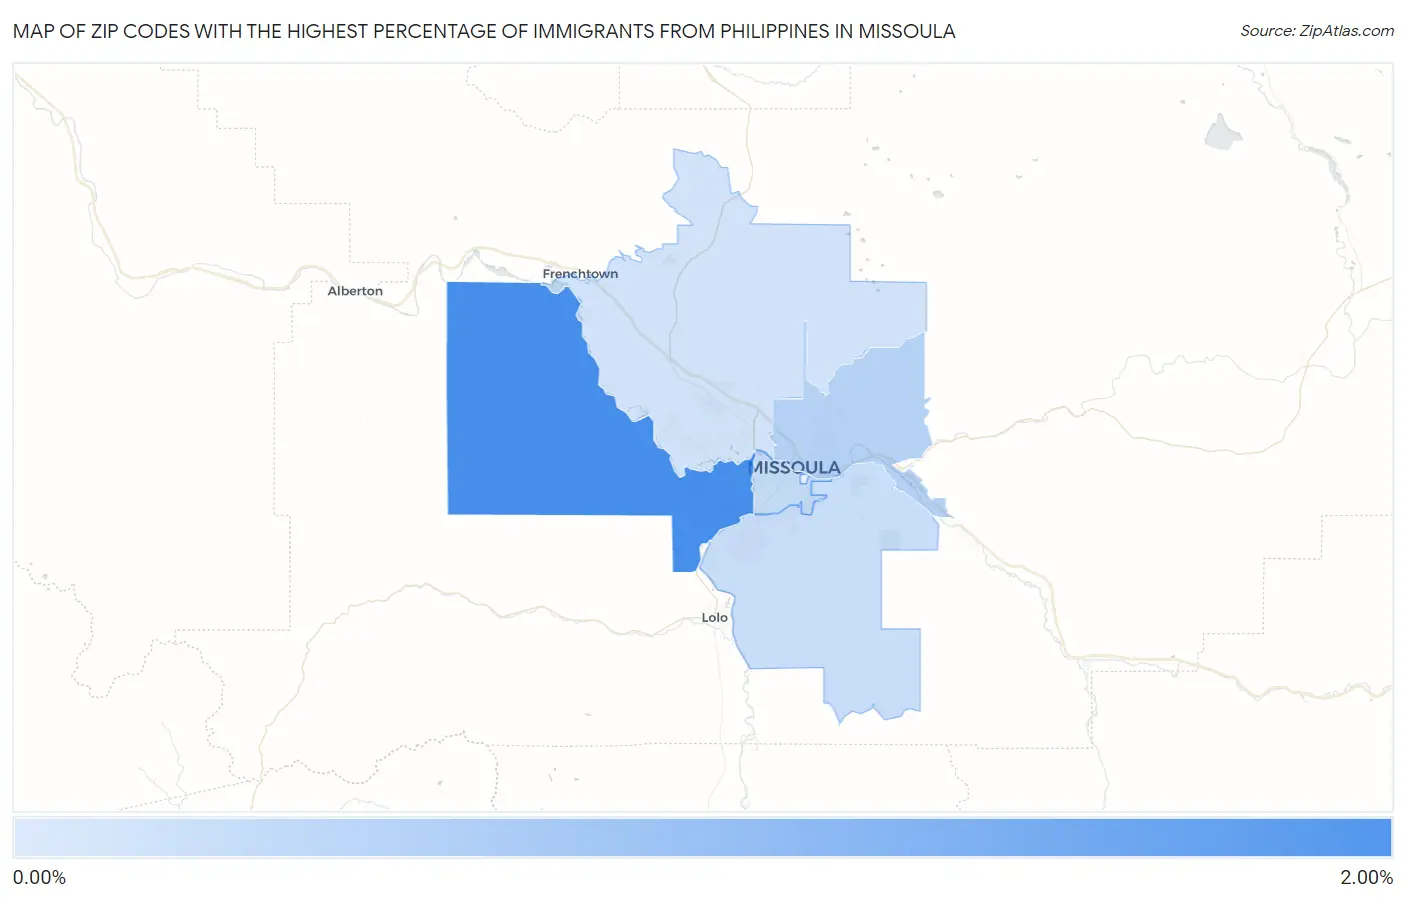
Map of Zip Codes with the Highest Percentage of Immigrants from Philippines in Missoula
0.00%
2.00%
Zip Codes with the Highest Percentage of Immigrants from Philippines in Missoula, MT
| Zip Code | Philippines | vs State | vs National | |
| 1. | 59804 | 1.99% | 0.16%(+1.83)#-1 | 0.60%(+1.39)#0 |
| 2. | 59802 | 0.51% | 0.16%(+0.353)#2 | 0.60%(-0.088)#1,002 |
| 3. | 59801 | 0.31% | 0.16%(+0.153)#3 | 0.60%(-0.288)#1,003 |
| 4. | 59803 | 0.27% | 0.16%(+0.110)#4 | 0.60%(-0.331)#1,004 |
| 5. | 59808 | 0.16% | 0.16%(-0.002)#5 | 0.60%(-0.443)#1,005 |
1
Common Questions
What are the Top 5 Zip Codes with the Highest Percentage of Immigrants from Philippines in Missoula, MT?
Top 5 Zip Codes with the Highest Percentage of Immigrants from Philippines in Missoula, MT are:
What zip code has the Highest Percentage of Immigrants from Philippines in Missoula, MT?
59804 has the Highest Percentage of Immigrants from Philippines in Missoula, MT with 1.99%.
What is the Percentage of Immigrants from Philippines in Missoula, MT?
Percentage of Immigrants from Philippines in Missoula is 0.39%.
What is the Percentage of Immigrants from Philippines in Montana?
Percentage of Immigrants from Philippines in Montana is 0.16%.
What is the Percentage of Immigrants from Philippines in the United States?
Percentage of Immigrants from Philippines in the United States is 0.60%.