Zip Codes with the Highest Percentage of Population Employed in Architecture & Engineering in Billings, MT
RELATED REPORTS & OPTIONS
Architecture & Engineering
Billings
Compare Zip Codes
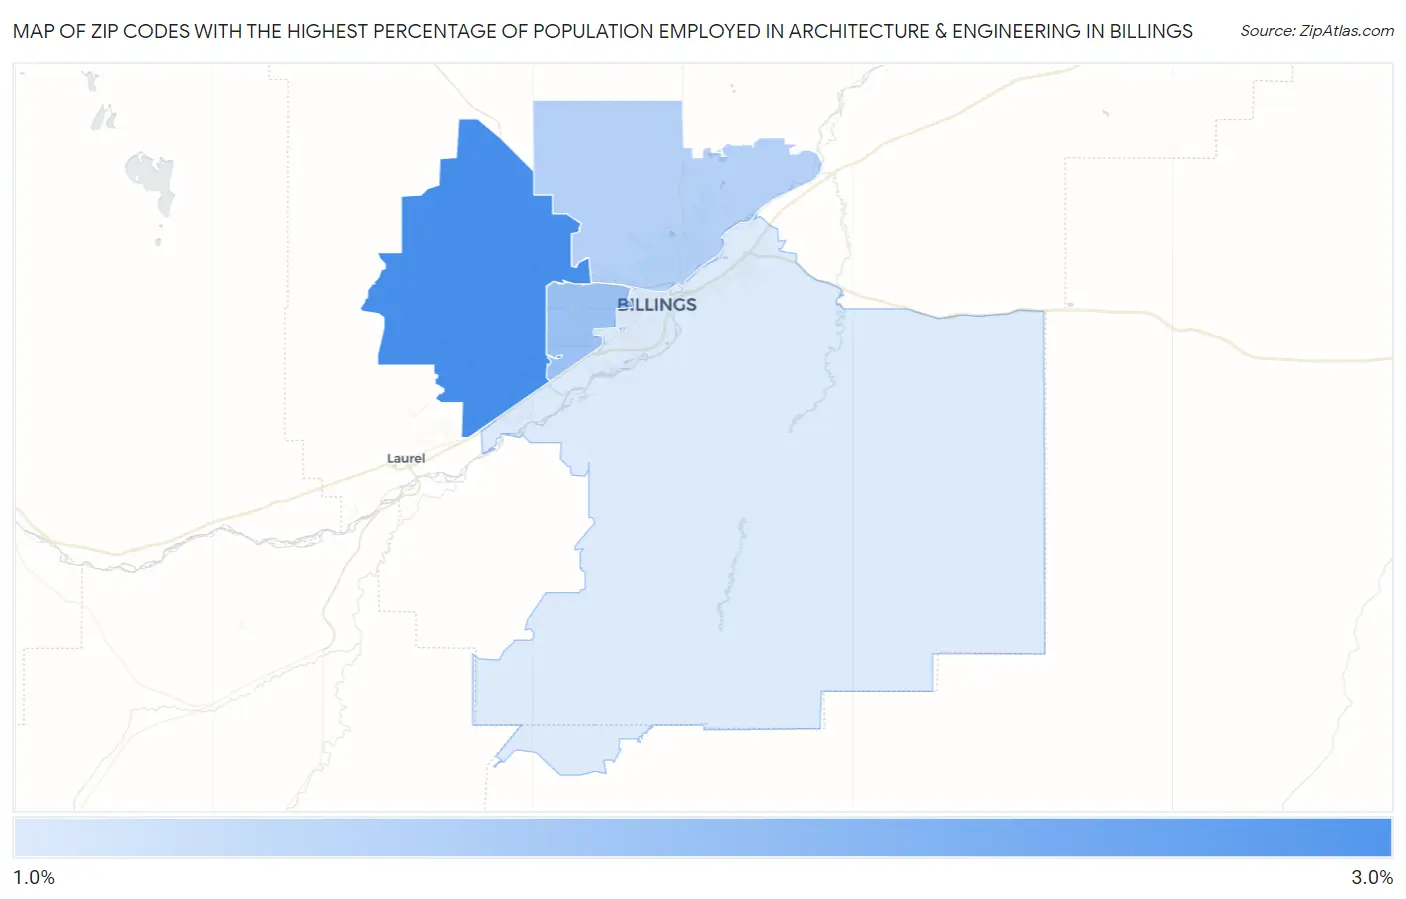
Map of Zip Codes with the Highest Percentage of Population Employed in Architecture & Engineering in Billings
0.0%
3.0%
Zip Codes with the Highest Percentage of Population Employed in Architecture & Engineering in Billings, MT
| Zip Code | % Employed | vs State | vs National | |
| 1. | 59106 | 2.7% | 1.8%(+0.914)#39 | 2.1%(+0.518)#6,300 |
| 2. | 59102 | 1.9% | 1.8%(+0.177)#57 | 2.1%(-0.218)#10,040 |
| 3. | 59105 | 1.7% | 1.8%(-0.063)#71 | 2.1%(-0.458)#11,565 |
| 4. | 59101 | 1.3% | 1.8%(-0.426)#88 | 2.1%(-0.822)#14,120 |
1
Common Questions
What are the Top 3 Zip Codes with the Highest Percentage of Population Employed in Architecture & Engineering in Billings, MT?
Top 3 Zip Codes with the Highest Percentage of Population Employed in Architecture & Engineering in Billings, MT are:
What zip code has the Highest Percentage of Population Employed in Architecture & Engineering in Billings, MT?
59106 has the Highest Percentage of Population Employed in Architecture & Engineering in Billings, MT with 2.7%.
What is the Percentage of Population Employed in Architecture & Engineering in Billings, MT?
Percentage of Population Employed in Architecture & Engineering in Billings is 1.7%.
What is the Percentage of Population Employed in Architecture & Engineering in Montana?
Percentage of Population Employed in Architecture & Engineering in Montana is 1.8%.
What is the Percentage of Population Employed in Architecture & Engineering in the United States?
Percentage of Population Employed in Architecture & Engineering in the United States is 2.1%.