Little Bitterroot Lake, MT
Little Bitterroot Lake Map
Little Bitterroot Lake Overview
104
TOTAL POPULATION
64
MALE POPULATION
40
FEMALE POPULATION
160.00
MALES / 100 FEMALES
62.50
FEMALES / 100 MALES
68.7
MEDIAN AGE
2.1
AVG FAMILY SIZE
1.6
AVG HOUSEHOLD SIZE
$39,038
PER CAPITA INCOME
$103,125
AVG FAMILY INCOME
0.35
INEQUALITY / GINI INDEX
36
LABOR FORCE [ PEOPLE ]
34.6%
PERCENT IN LABOR FORCE
27.8%
UNEMPLOYMENT RATE
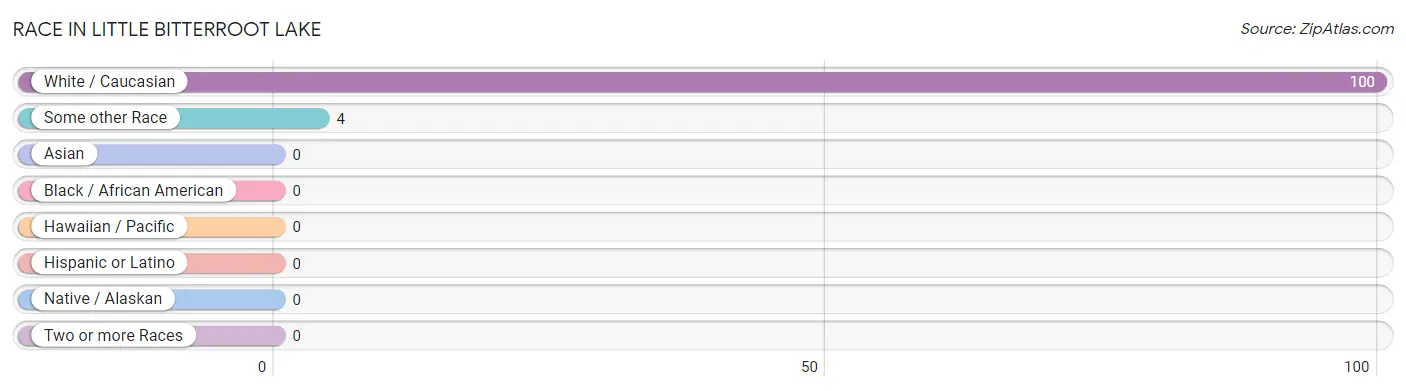
Race in Little Bitterroot Lake
The most populous races in Little Bitterroot Lake are White / Caucasian (100 | 96.2%), and Some other Race (4 | 3.8%).
| Race | # Population | % Population |
| Asian | 0 | 0.0% |
| Black / African American | 0 | 0.0% |
| Hawaiian / Pacific | 0 | 0.0% |
| Hispanic or Latino | 0 | 0.0% |
| Native / Alaskan | 0 | 0.0% |
| White / Caucasian | 100 | 96.2% |
| Two or more Races | 0 | 0.0% |
| Some other Race | 4 | 3.8% |
| Total | 104 | 100.0% |
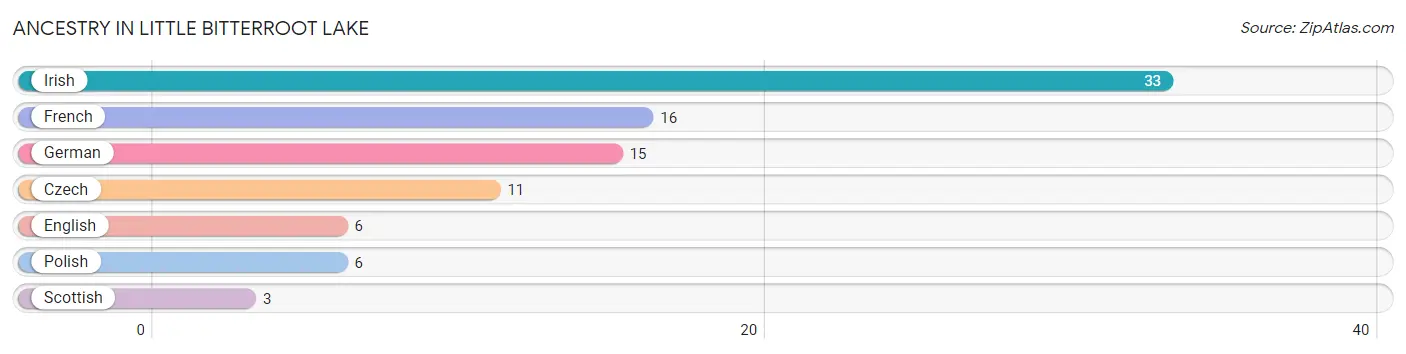
Ancestry in Little Bitterroot Lake
The most populous ancestries reported in Little Bitterroot Lake are Irish (33 | 31.7%), French (16 | 15.4%), German (15 | 14.4%), Czech (11 | 10.6%), and English (6 | 5.8%), together accounting for 77.9% of all Little Bitterroot Lake residents.
| Ancestry | # Population | % Population |
| Czech | 11 | 10.6% |
| English | 6 | 5.8% |
| French | 16 | 15.4% |
| German | 15 | 14.4% |
| Irish | 33 | 31.7% |
| Polish | 6 | 5.8% |
| Scottish | 3 | 2.9% | View All 7 Rows |
Immigrants in Little Bitterroot Lake

| Immigration Origin | # Population | % Population | View All 0 Rows |
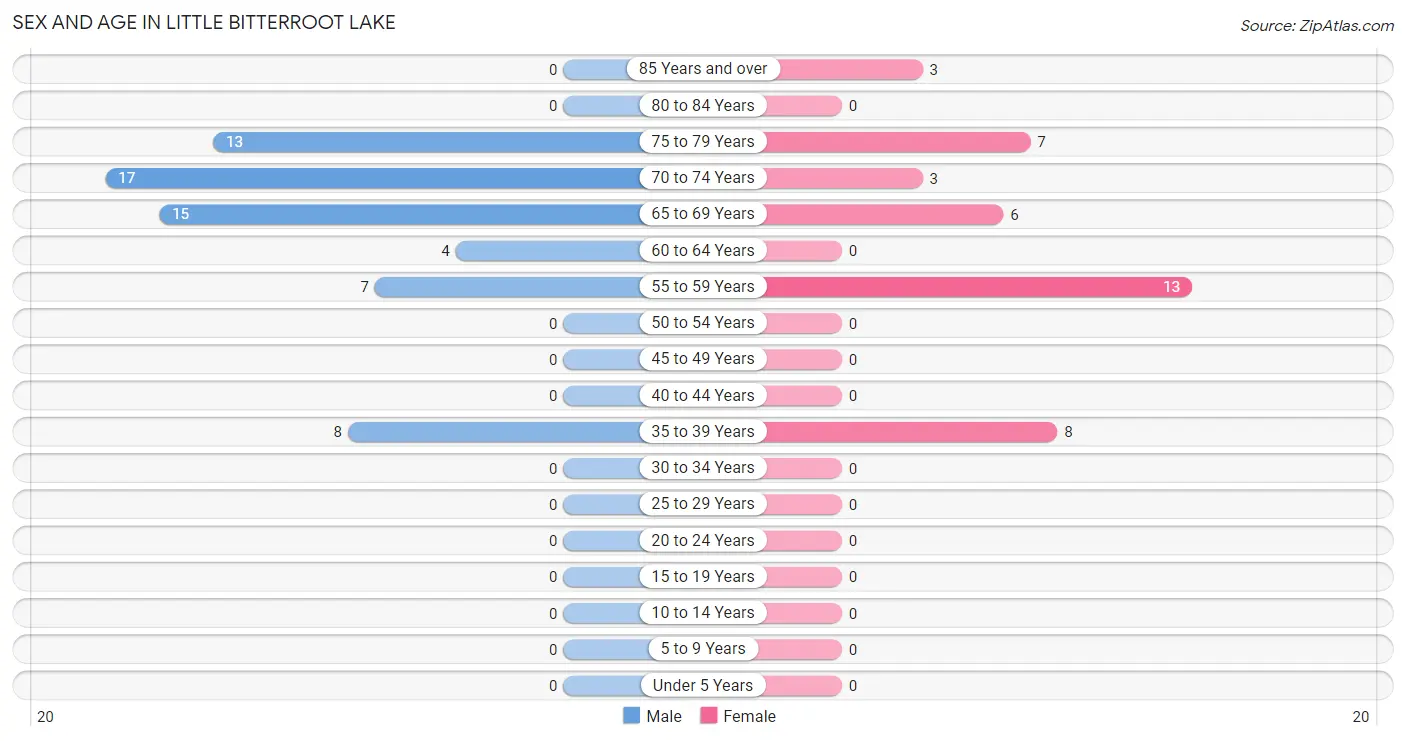
Sex and Age in Little Bitterroot Lake
Sex and Age in Little Bitterroot Lake
The most populous age groups in Little Bitterroot Lake are 70 to 74 Years (17 | 26.6%) for men and 55 to 59 Years (13 | 32.5%) for women.
| Age Bracket | Male | Female |
| Under 5 Years | 0 (0.0%) | 0 (0.0%) |
| 5 to 9 Years | 0 (0.0%) | 0 (0.0%) |
| 10 to 14 Years | 0 (0.0%) | 0 (0.0%) |
| 15 to 19 Years | 0 (0.0%) | 0 (0.0%) |
| 20 to 24 Years | 0 (0.0%) | 0 (0.0%) |
| 25 to 29 Years | 0 (0.0%) | 0 (0.0%) |
| 30 to 34 Years | 0 (0.0%) | 0 (0.0%) |
| 35 to 39 Years | 8 (12.5%) | 8 (20.0%) |
| 40 to 44 Years | 0 (0.0%) | 0 (0.0%) |
| 45 to 49 Years | 0 (0.0%) | 0 (0.0%) |
| 50 to 54 Years | 0 (0.0%) | 0 (0.0%) |
| 55 to 59 Years | 7 (10.9%) | 13 (32.5%) |
| 60 to 64 Years | 4 (6.2%) | 0 (0.0%) |
| 65 to 69 Years | 15 (23.4%) | 6 (15.0%) |
| 70 to 74 Years | 17 (26.6%) | 3 (7.5%) |
| 75 to 79 Years | 13 (20.3%) | 7 (17.5%) |
| 80 to 84 Years | 0 (0.0%) | 0 (0.0%) |
| 85 Years and over | 0 (0.0%) | 3 (7.5%) |
| Total | 64 (100.0%) | 40 (100.0%) |
Families and Households in Little Bitterroot Lake
Median Family Size in Little Bitterroot Lake
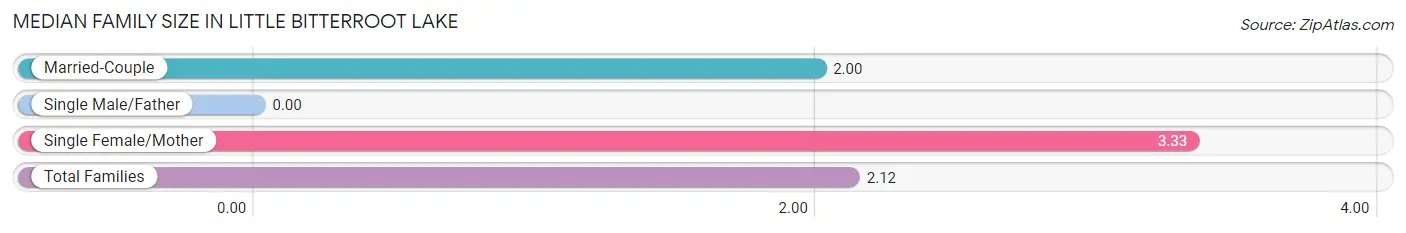
| Family Type | # Families | Family Size |
| Married-Couple | 31 (91.2%) | 2.00 |
| Single Male/Father | 0 (0.0%) | - |
| Single Female/Mother | 3 (8.8%) | 3.33 |
| Total Families | 34 (100.0%) | 2.12 |
Median Household Size in Little Bitterroot Lake
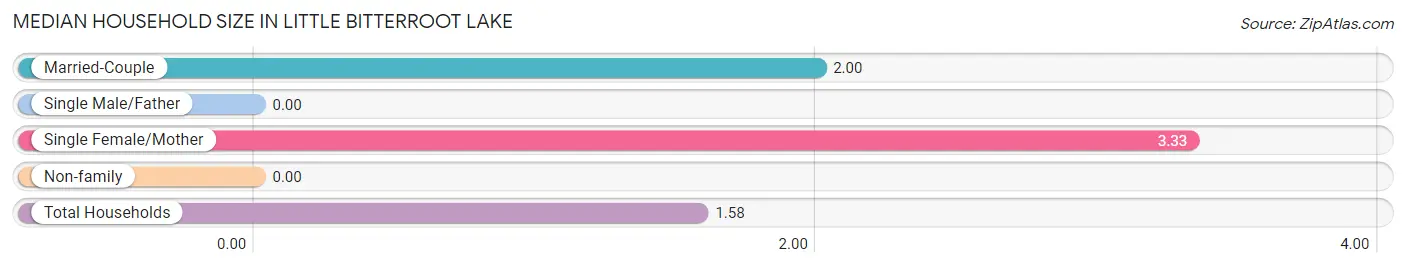
| Household Type | # Households | Household Size |
| Married-Couple | 31 (47.0%) | 2.00 |
| Single Male/Father | 0 (0.0%) | - |
| Single Female/Mother | 3 (4.5%) | 3.33 |
| Non-family | 32 (48.5%) | - |
| Total Households | 66 (100.0%) | 1.58 |
Household Size by Marriage Status in Little Bitterroot Lake
Out of a total of 66 households in Little Bitterroot Lake, 34 (51.5%) are family households, while 32 (48.5%) are nonfamily households. The most numerous type of family households are 2-person households, comprising 34, and the most common type of nonfamily households are 1-person households, comprising 32.
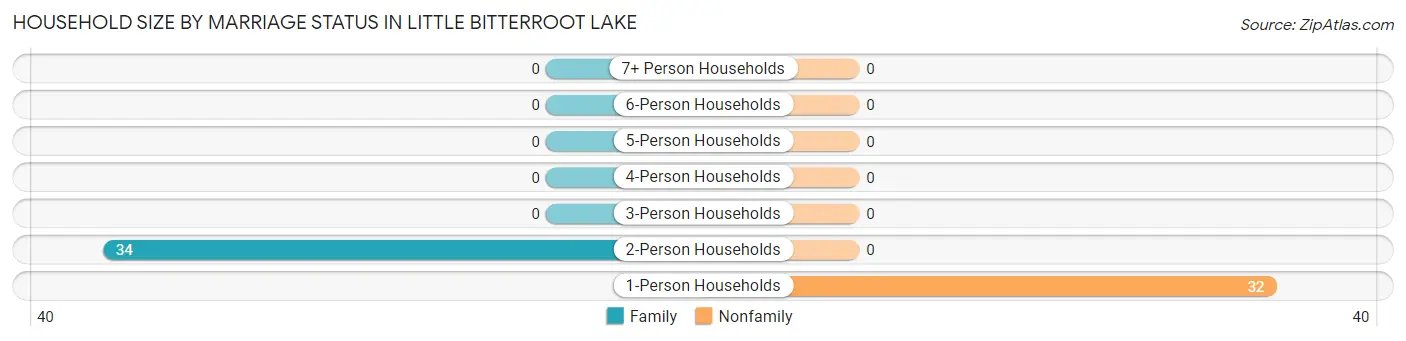
| Household Size | Family Households | Nonfamily Households |
| 1-Person Households | - | 32 (48.5%) |
| 2-Person Households | 34 (51.5%) | 0 (0.0%) |
| 3-Person Households | 0 (0.0%) | 0 (0.0%) |
| 4-Person Households | 0 (0.0%) | 0 (0.0%) |
| 5-Person Households | 0 (0.0%) | 0 (0.0%) |
| 6-Person Households | 0 (0.0%) | 0 (0.0%) |
| 7+ Person Households | 0 (0.0%) | 0 (0.0%) |
| Total | 34 (51.5%) | 32 (48.5%) |
Female Fertility in Little Bitterroot Lake
Fertility by Age in Little Bitterroot Lake
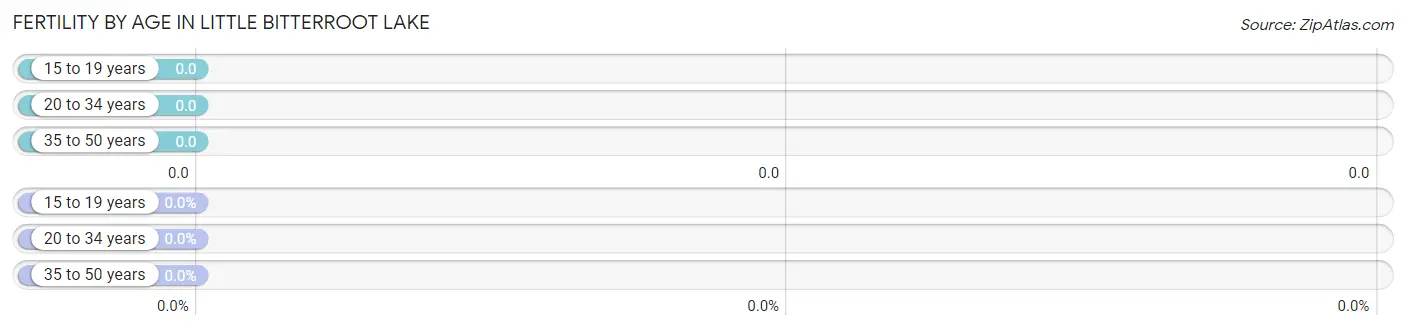
| Age Bracket | Women with Births | Births / 1,000 Women |
| 15 to 19 years | 0 (0.0%) | 0.0 |
| 20 to 34 years | 0 (0.0%) | 0.0 |
| 35 to 50 years | 0 (0.0%) | 0.0 |
| Total | 0 (0.0%) | 0.0 |
Fertility by Age by Marriage Status in Little Bitterroot Lake
| Age Bracket | Married | Unmarried |
| 15 to 19 years | 0 (0.0%) | 0 (0.0%) |
| 20 to 34 years | 0 (0.0%) | 0 (0.0%) |
| 35 to 50 years | 0 (0.0%) | 0 (0.0%) |
| Total | 0 (0.0%) | 0 (0.0%) |
Fertility by Education in Little Bitterroot Lake
| Educational Attainment | Women with Births | Births / 1,000 Women |
| Less than High School | 0 (0.0%) | 0.0 |
| High School Diploma | 0 (0.0%) | 0.0 |
| College or Associate's Degree | 0 (0.0%) | 0.0 |
| Bachelor's Degree | 0 (0.0%) | 0.0 |
| Graduate Degree | 0 (0.0%) | 0.0 |
| Total | 0 (0.0%) | 0.0 |
Fertility by Education by Marriage Status in Little Bitterroot Lake
| Educational Attainment | Married | Unmarried |
| Less than High School | 0 (0.0%) | 0 (0.0%) |
| High School Diploma | 0 (0.0%) | 0 (0.0%) |
| College or Associate's Degree | 0 (0.0%) | 0 (0.0%) |
| Bachelor's Degree | 0 (0.0%) | 0 (0.0%) |
| Graduate Degree | 0 (0.0%) | 0 (0.0%) |
| Total | 0 (0.0%) | 0 (0.0%) |
Income in Little Bitterroot Lake
Income Overview in Little Bitterroot Lake
| Characteristic | Number | Measure |
| Per Capita Income | 104 | $39,038 |
| Median Family Income | 34 | $103,125 |
| Mean Family Income | 34 | $89,388 |
| Median Household Income | 66 | $0 |
| Mean Household Income | 66 | $58,205 |
| Income Deficit | 34 | $0 |
| Wage / Income Gap (%) | 104 | 0.00% |
| Wage / Income Gap ($) | 104 | 100.00¢ per $1 |
| Gini / Inequality Index | 104 | 0.35 |
Earnings by Sex in Little Bitterroot Lake
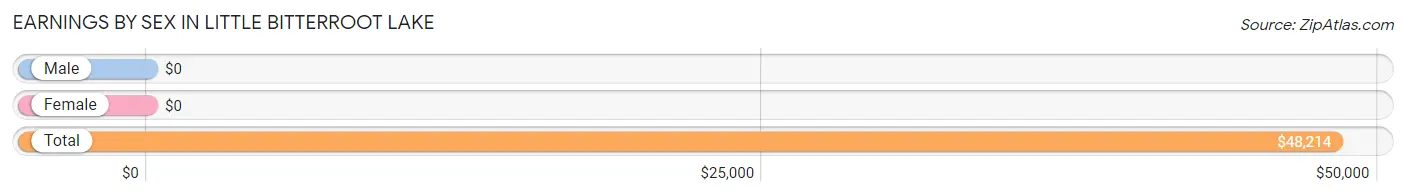
| Sex | Number | Average Earnings |
| Male | 15 (57.7%) | $0 |
| Female | 11 (42.3%) | $0 |
| Total | 26 (100.0%) | $48,214 |
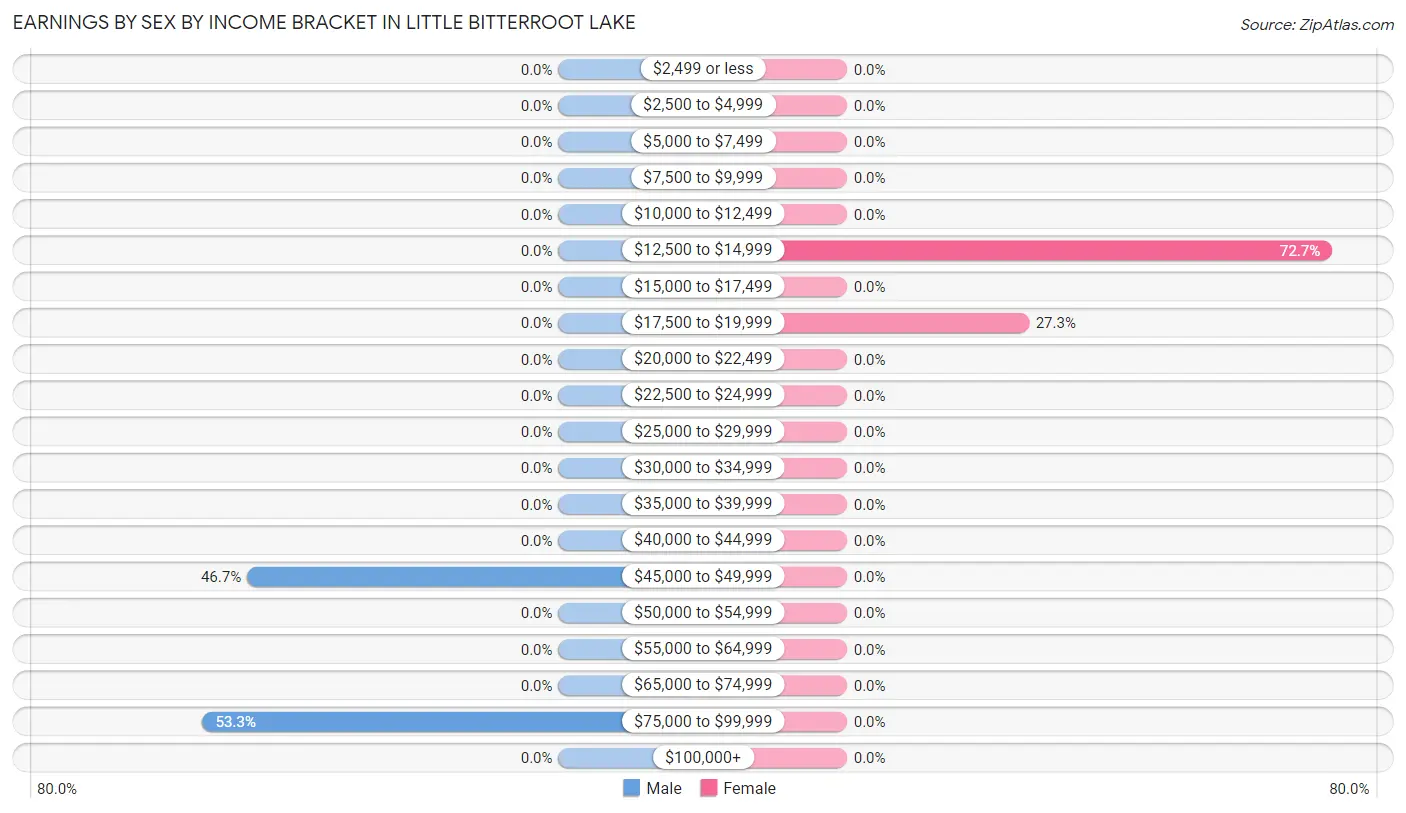
Earnings by Sex by Income Bracket in Little Bitterroot Lake
The most common earnings brackets in Little Bitterroot Lake are $75,000 to $99,999 for men (8 | 53.3%) and $12,500 to $14,999 for women (8 | 72.7%).
| Income | Male | Female |
| $2,499 or less | 0 (0.0%) | 0 (0.0%) |
| $2,500 to $4,999 | 0 (0.0%) | 0 (0.0%) |
| $5,000 to $7,499 | 0 (0.0%) | 0 (0.0%) |
| $7,500 to $9,999 | 0 (0.0%) | 0 (0.0%) |
| $10,000 to $12,499 | 0 (0.0%) | 0 (0.0%) |
| $12,500 to $14,999 | 0 (0.0%) | 8 (72.7%) |
| $15,000 to $17,499 | 0 (0.0%) | 0 (0.0%) |
| $17,500 to $19,999 | 0 (0.0%) | 3 (27.3%) |
| $20,000 to $22,499 | 0 (0.0%) | 0 (0.0%) |
| $22,500 to $24,999 | 0 (0.0%) | 0 (0.0%) |
| $25,000 to $29,999 | 0 (0.0%) | 0 (0.0%) |
| $30,000 to $34,999 | 0 (0.0%) | 0 (0.0%) |
| $35,000 to $39,999 | 0 (0.0%) | 0 (0.0%) |
| $40,000 to $44,999 | 0 (0.0%) | 0 (0.0%) |
| $45,000 to $49,999 | 7 (46.7%) | 0 (0.0%) |
| $50,000 to $54,999 | 0 (0.0%) | 0 (0.0%) |
| $55,000 to $64,999 | 0 (0.0%) | 0 (0.0%) |
| $65,000 to $74,999 | 0 (0.0%) | 0 (0.0%) |
| $75,000 to $99,999 | 8 (53.3%) | 0 (0.0%) |
| $100,000+ | 0 (0.0%) | 0 (0.0%) |
| Total | 15 (100.0%) | 11 (100.0%) |
Earnings by Sex by Educational Attainment in Little Bitterroot Lake
| Educational Attainment | Male Income | Female Income |
| Less than High School | - | - |
| High School Diploma | - | - |
| College or Associate's Degree | - | - |
| Bachelor's Degree | - | - |
| Graduate Degree | - | - |
| Total | - | - |
Family Income in Little Bitterroot Lake
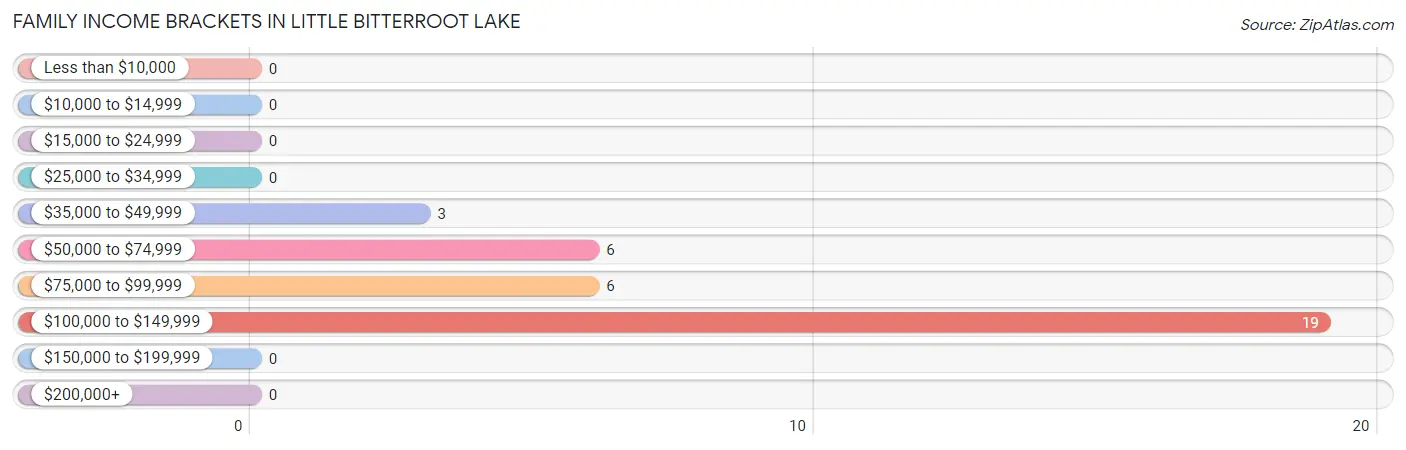
Family Income Brackets in Little Bitterroot Lake
According to the Little Bitterroot Lake family income data, there are 19 families falling into the $100,000 to $149,999 income range, which is the most common income bracket and makes up 55.9% of all families.
| Income Bracket | # Families | % Families |
| Less than $10,000 | 0 | 0.0% |
| $10,000 to $14,999 | 0 | 0.0% |
| $15,000 to $24,999 | 0 | 0.0% |
| $25,000 to $34,999 | 0 | 0.0% |
| $35,000 to $49,999 | 3 | 8.8% |
| $50,000 to $74,999 | 6 | 17.6% |
| $75,000 to $99,999 | 6 | 17.6% |
| $100,000 to $149,999 | 19 | 55.9% |
| $150,000 to $199,999 | 0 | 0.0% |
| $200,000+ | 0 | 0.0% |
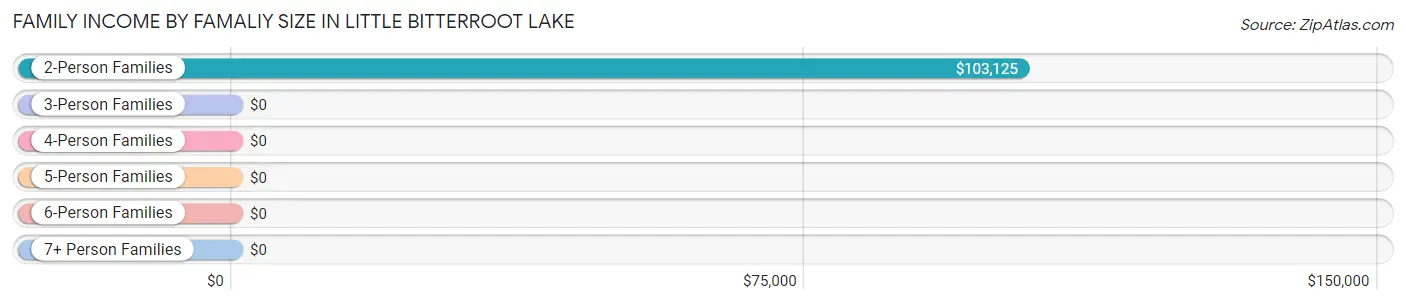
Family Income by Famaliy Size in Little Bitterroot Lake
2-person families (34 | 100.0%) account for the highest median family income in Little Bitterroot Lake with $103,125 per family, while 2-person families (34 | 100.0%) have the highest median income of $51,562 per family member.
| Income Bracket | # Families | Median Income |
| 2-Person Families | 34 (100.0%) | $103,125 |
| 3-Person Families | 0 (0.0%) | $0 |
| 4-Person Families | 0 (0.0%) | $0 |
| 5-Person Families | 0 (0.0%) | $0 |
| 6-Person Families | 0 (0.0%) | $0 |
| 7+ Person Families | 0 (0.0%) | $0 |
| Total | 34 (100.0%) | $103,125 |
Family Income by Number of Earners in Little Bitterroot Lake
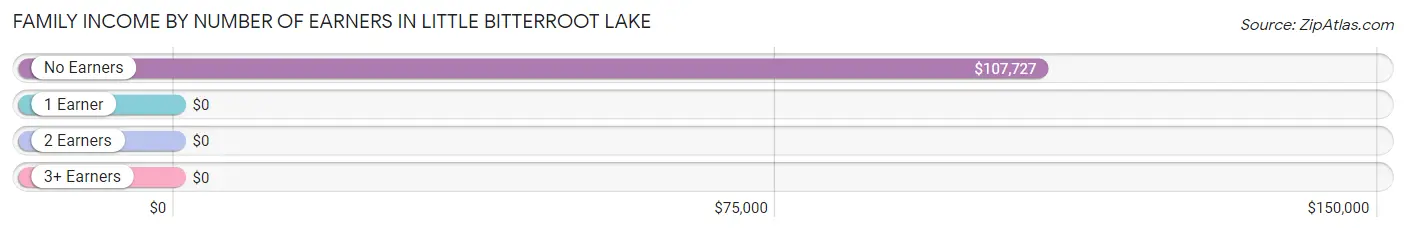
| Number of Earners | # Families | Median Income |
| No Earners | 20 (58.8%) | $107,727 |
| 1 Earner | 6 (17.6%) | $0 |
| 2 Earners | 8 (23.5%) | $0 |
| 3+ Earners | 0 (0.0%) | $0 |
| Total | 34 (100.0%) | $103,125 |
Household Income in Little Bitterroot Lake
Household Income Brackets in Little Bitterroot Lake
With 19 households falling in the category, the $100,000 to $149,999 income range is the most frequent in Little Bitterroot Lake, accounting for 28.8% of all households.
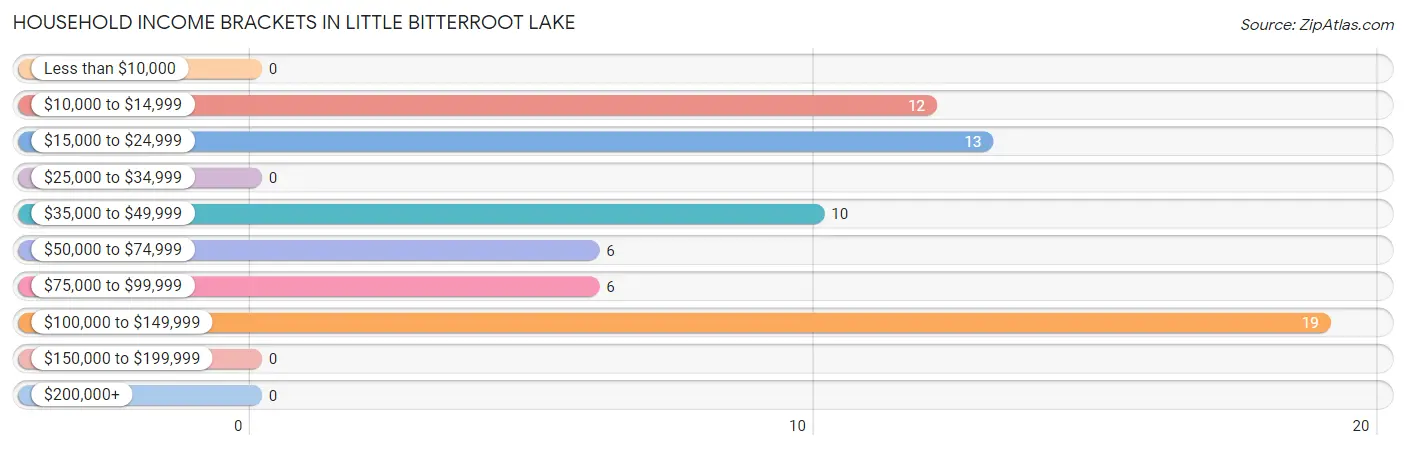
| Income Bracket | # Households | % Households |
| Less than $10,000 | 0 | 0.0% |
| $10,000 to $14,999 | 12 | 18.2% |
| $15,000 to $24,999 | 13 | 19.7% |
| $25,000 to $34,999 | 0 | 0.0% |
| $35,000 to $49,999 | 10 | 15.2% |
| $50,000 to $74,999 | 6 | 9.1% |
| $75,000 to $99,999 | 6 | 9.1% |
| $100,000 to $149,999 | 19 | 28.8% |
| $150,000 to $199,999 | 0 | 0.0% |
| $200,000+ | 0 | 0.0% |
Household Income by Householder Age in Little Bitterroot Lake
| Income Bracket | # Households | Median Income |
| 15 to 24 Years | 0 (0.0%) | $0 |
| 25 to 44 Years | 8 (12.1%) | $0 |
| 45 to 64 Years | 3 (4.5%) | $0 |
| 65+ Years | 55 (83.3%) | $0 |
| Total | 66 (100.0%) | $0 |
Poverty in Little Bitterroot Lake
Income Below Poverty by Sex and Age in Little Bitterroot Lake
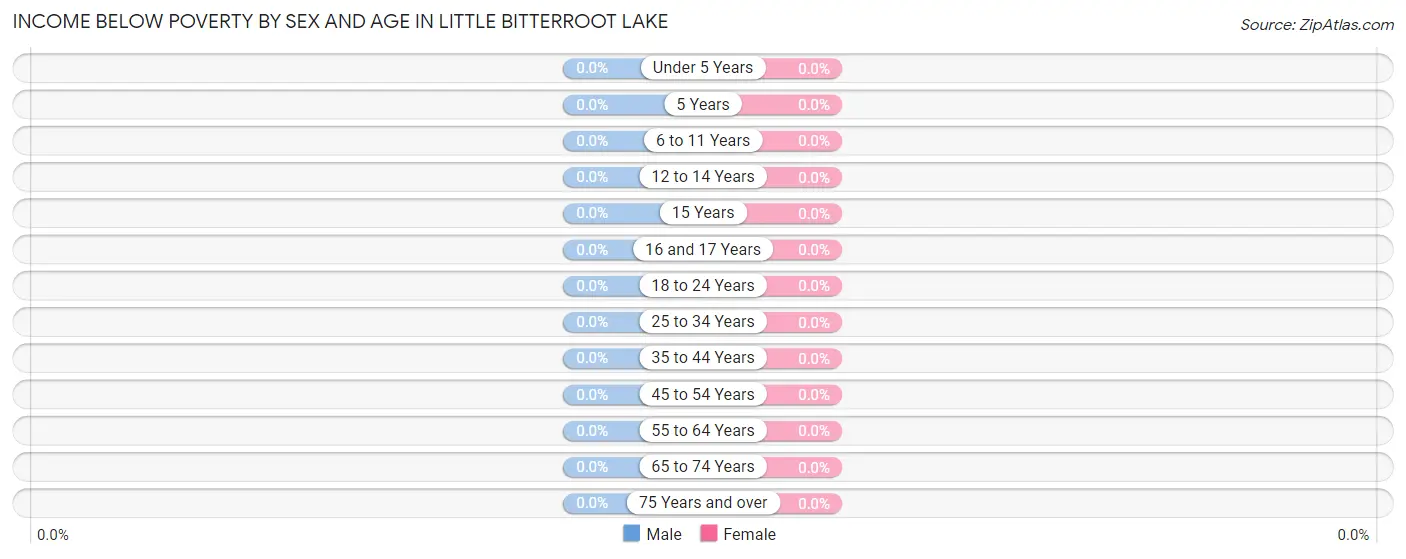
| Age Bracket | Male | Female |
| Under 5 Years | 0 (0.0%) | 0 (0.0%) |
| 5 Years | 0 (0.0%) | 0 (0.0%) |
| 6 to 11 Years | 0 (0.0%) | 0 (0.0%) |
| 12 to 14 Years | 0 (0.0%) | 0 (0.0%) |
| 15 Years | 0 (0.0%) | 0 (0.0%) |
| 16 and 17 Years | 0 (0.0%) | 0 (0.0%) |
| 18 to 24 Years | 0 (0.0%) | 0 (0.0%) |
| 25 to 34 Years | 0 (0.0%) | 0 (0.0%) |
| 35 to 44 Years | 0 (0.0%) | 0 (0.0%) |
| 45 to 54 Years | 0 (0.0%) | 0 (0.0%) |
| 55 to 64 Years | 0 (0.0%) | 0 (0.0%) |
| 65 to 74 Years | 0 (0.0%) | 0 (0.0%) |
| 75 Years and over | 0 (0.0%) | 0 (0.0%) |
| Total | 0 (0.0%) | 0 (0.0%) |
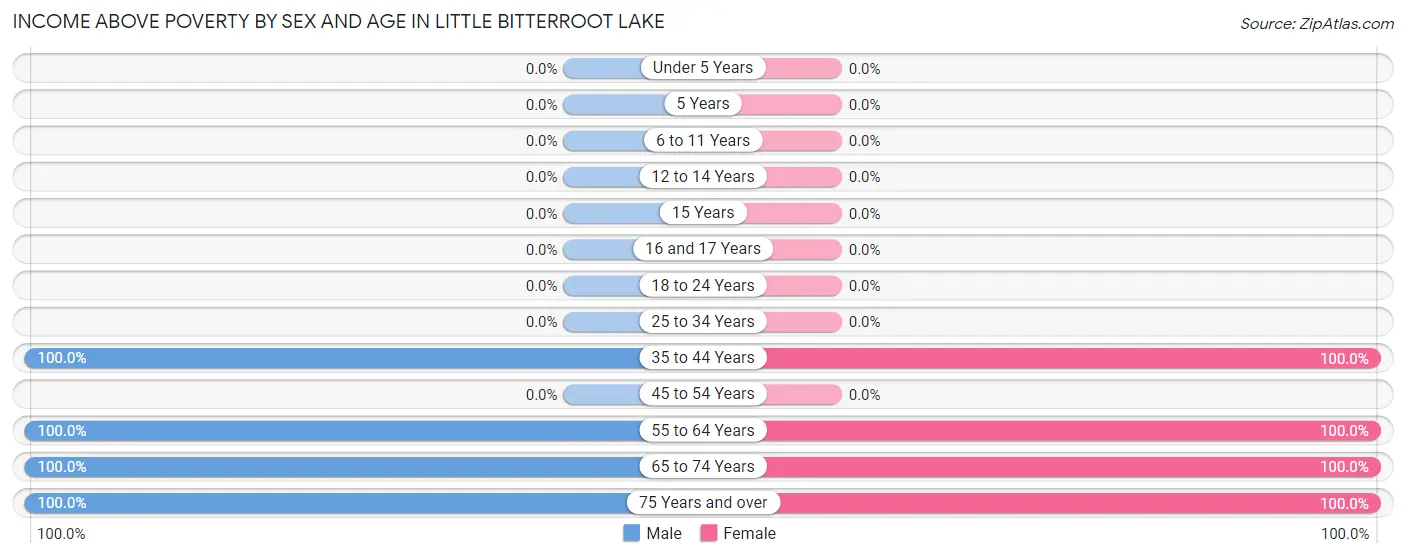
Income Above Poverty by Sex and Age in Little Bitterroot Lake
According to the poverty statistics in Little Bitterroot Lake, males aged 35 to 44 years and females aged 35 to 44 years are the age groups that are most secure financially, with 100.0% of males and 100.0% of females in these age groups living above the poverty line.
| Age Bracket | Male | Female |
| Under 5 Years | 0 (0.0%) | 0 (0.0%) |
| 5 Years | 0 (0.0%) | 0 (0.0%) |
| 6 to 11 Years | 0 (0.0%) | 0 (0.0%) |
| 12 to 14 Years | 0 (0.0%) | 0 (0.0%) |
| 15 Years | 0 (0.0%) | 0 (0.0%) |
| 16 and 17 Years | 0 (0.0%) | 0 (0.0%) |
| 18 to 24 Years | 0 (0.0%) | 0 (0.0%) |
| 25 to 34 Years | 0 (0.0%) | 0 (0.0%) |
| 35 to 44 Years | 8 (100.0%) | 8 (100.0%) |
| 45 to 54 Years | 0 (0.0%) | 0 (0.0%) |
| 55 to 64 Years | 11 (100.0%) | 13 (100.0%) |
| 65 to 74 Years | 32 (100.0%) | 9 (100.0%) |
| 75 Years and over | 13 (100.0%) | 10 (100.0%) |
| Total | 64 (100.0%) | 40 (100.0%) |
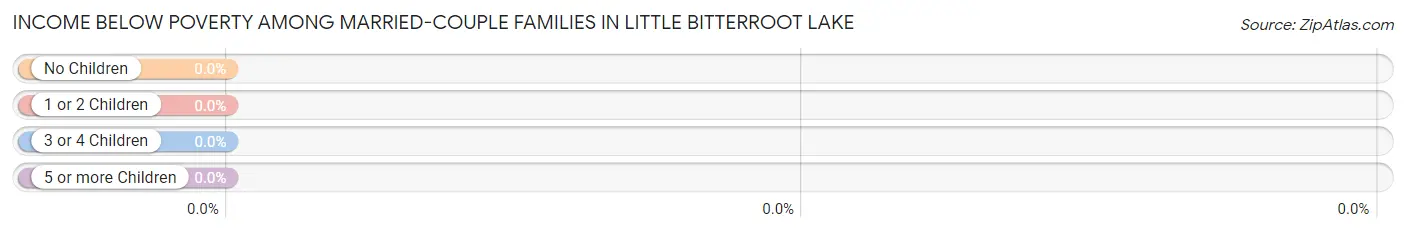
Income Below Poverty Among Married-Couple Families in Little Bitterroot Lake
| Children | Above Poverty | Below Poverty |
| No Children | 31 (100.0%) | 0 (0.0%) |
| 1 or 2 Children | 0 (0.0%) | 0 (0.0%) |
| 3 or 4 Children | 0 (0.0%) | 0 (0.0%) |
| 5 or more Children | 0 (0.0%) | 0 (0.0%) |
| Total | 31 (100.0%) | 0 (0.0%) |
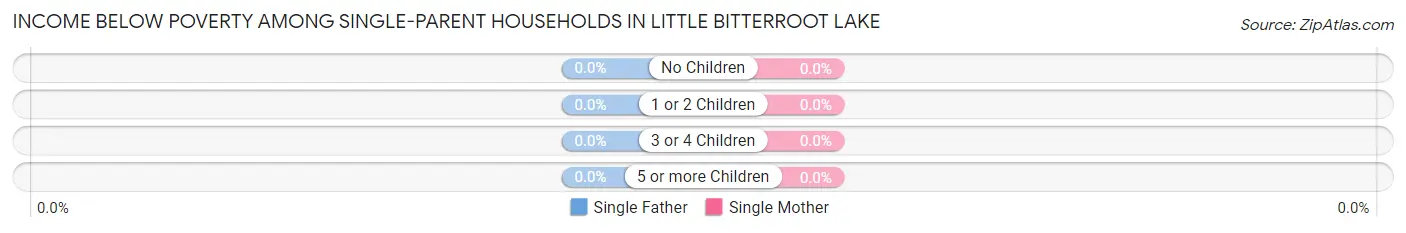
Income Below Poverty Among Single-Parent Households in Little Bitterroot Lake
| Children | Single Father | Single Mother |
| No Children | 0 (0.0%) | 0 (0.0%) |
| 1 or 2 Children | 0 (0.0%) | 0 (0.0%) |
| 3 or 4 Children | 0 (0.0%) | 0 (0.0%) |
| 5 or more Children | 0 (0.0%) | 0 (0.0%) |
| Total | 0 (0.0%) | 0 (0.0%) |
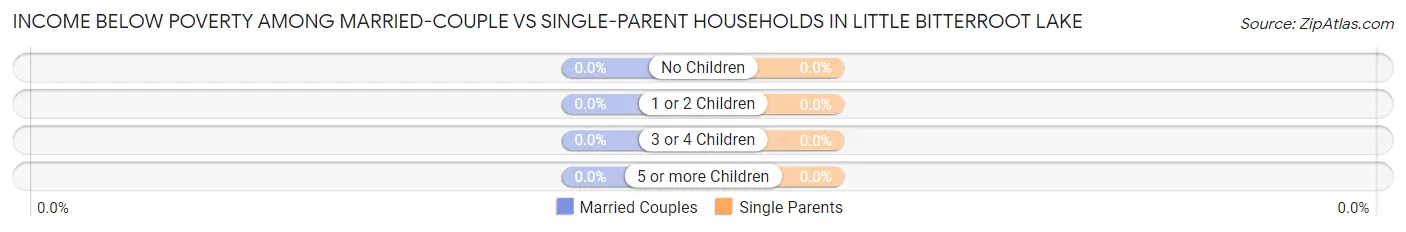
Income Below Poverty Among Married-Couple vs Single-Parent Households in Little Bitterroot Lake
| Children | Married-Couple Families | Single-Parent Households |
| No Children | 0 (0.0%) | 0 (0.0%) |
| 1 or 2 Children | 0 (0.0%) | 0 (0.0%) |
| 3 or 4 Children | 0 (0.0%) | 0 (0.0%) |
| 5 or more Children | 0 (0.0%) | 0 (0.0%) |
| Total | 0 (0.0%) | 0 (0.0%) |
Employment Characteristics in Little Bitterroot Lake
Employment by Class of Employer in Little Bitterroot Lake
Among the 19 employed individuals in Little Bitterroot Lake, private company employees (16 | 84.2%), and not-for-profit organizations (3 | 15.8%) make up the most common classes of employment.
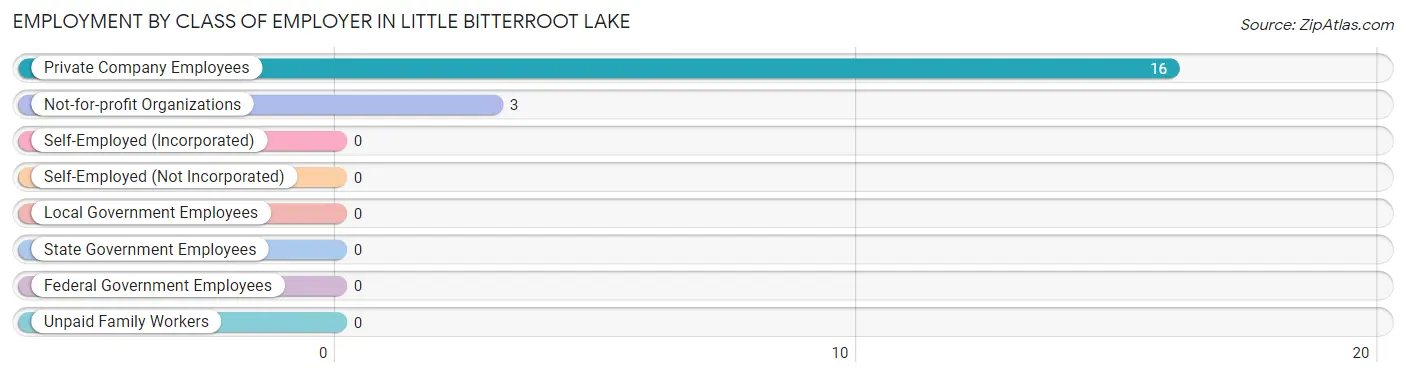
| Employer Class | # Employees | % Employees |
| Private Company Employees | 16 | 84.2% |
| Self-Employed (Incorporated) | 0 | 0.0% |
| Self-Employed (Not Incorporated) | 0 | 0.0% |
| Not-for-profit Organizations | 3 | 15.8% |
| Local Government Employees | 0 | 0.0% |
| State Government Employees | 0 | 0.0% |
| Federal Government Employees | 0 | 0.0% |
| Unpaid Family Workers | 0 | 0.0% |
| Total | 19 | 100.0% |
Employment Status by Age in Little Bitterroot Lake
According to the labor force statistics for Little Bitterroot Lake, out of the total population over 16 years of age (104), 34.6% or 36 individuals are in the labor force, with 27.8% or 10 of them unemployed. The age group with the highest labor force participation rate is 35 to 44 years, with 100.0% or 16 individuals in the labor force. Within the labor force, the 55 to 59 years age range has the highest percentage of unemployed individuals, with 58.8% or 10 of them being unemployed.
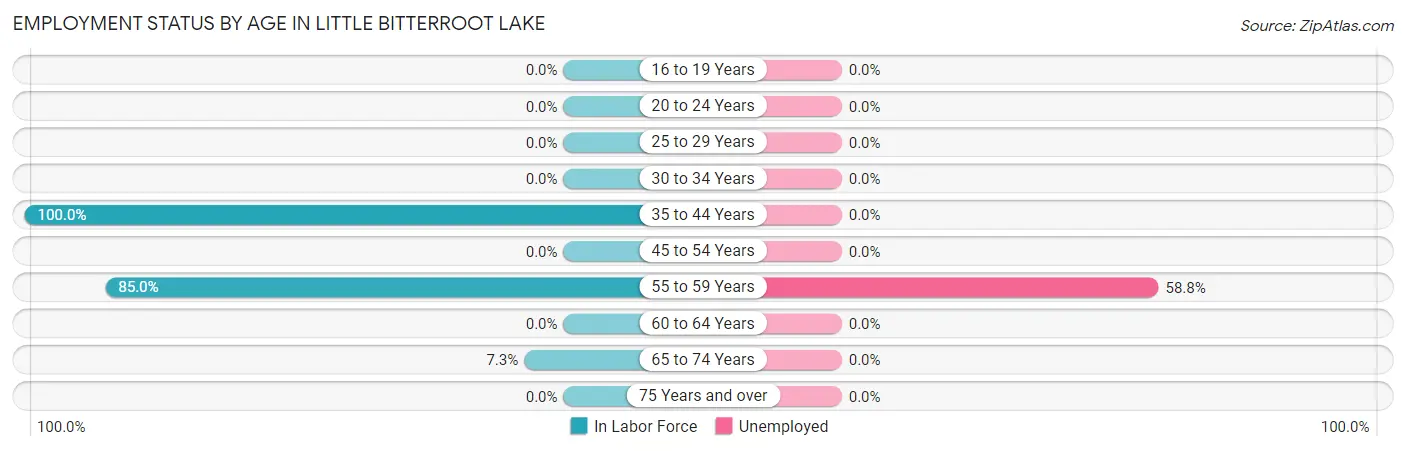
| Age Bracket | In Labor Force | Unemployed |
| 16 to 19 Years | 0 (0.0%) | 0 (0.0%) |
| 20 to 24 Years | 0 (0.0%) | 0 (0.0%) |
| 25 to 29 Years | 0 (0.0%) | 0 (0.0%) |
| 30 to 34 Years | 0 (0.0%) | 0 (0.0%) |
| 35 to 44 Years | 16 (100.0%) | 0 (0.0%) |
| 45 to 54 Years | 0 (0.0%) | 0 (0.0%) |
| 55 to 59 Years | 17 (85.0%) | 10 (58.8%) |
| 60 to 64 Years | 0 (0.0%) | 0 (0.0%) |
| 65 to 74 Years | 3 (7.3%) | 0 (0.0%) |
| 75 Years and over | 0 (0.0%) | 0 (0.0%) |
| Total | 36 (34.6%) | 10 (27.8%) |
Employment Status by Educational Attainment in Little Bitterroot Lake
According to labor force statistics for Little Bitterroot Lake, 82.5% of individuals (33) out of the total population between 25 and 64 years of age (40) are in the labor force, with 30.3% or 10 of them being unemployed. The group with the highest labor force participation rate are those with the educational attainment of bachelor's degree or higher, with 100.0% or 10 individuals in the labor force. Within the labor force, individuals with bachelor's degree or higher education have the highest percentage of unemployment, with 100.0% or 10 of them being unemployed.
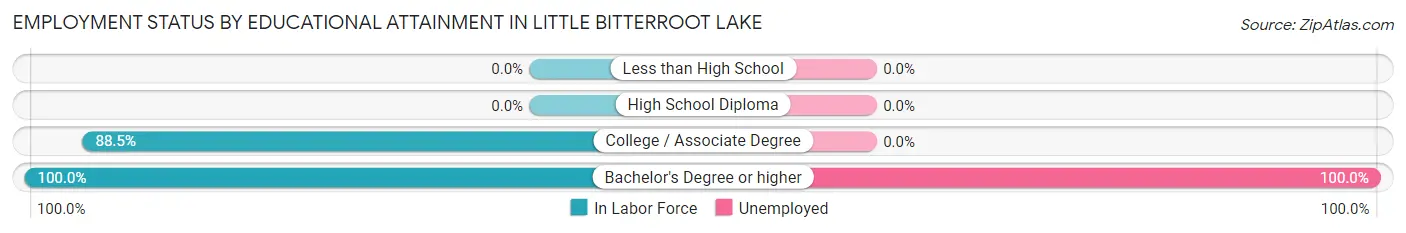
| Educational Attainment | In Labor Force | Unemployed |
| Less than High School | 0 (0.0%) | 0 (0.0%) |
| High School Diploma | 0 (0.0%) | 0 (0.0%) |
| College / Associate Degree | 23 (88.5%) | 0 (0.0%) |
| Bachelor's Degree or higher | 10 (100.0%) | 10 (100.0%) |
| Total | 33 (82.5%) | 12 (30.3%) |
Employment Occupations by Sex in Little Bitterroot Lake
Management, Business, Science and Arts Occupations
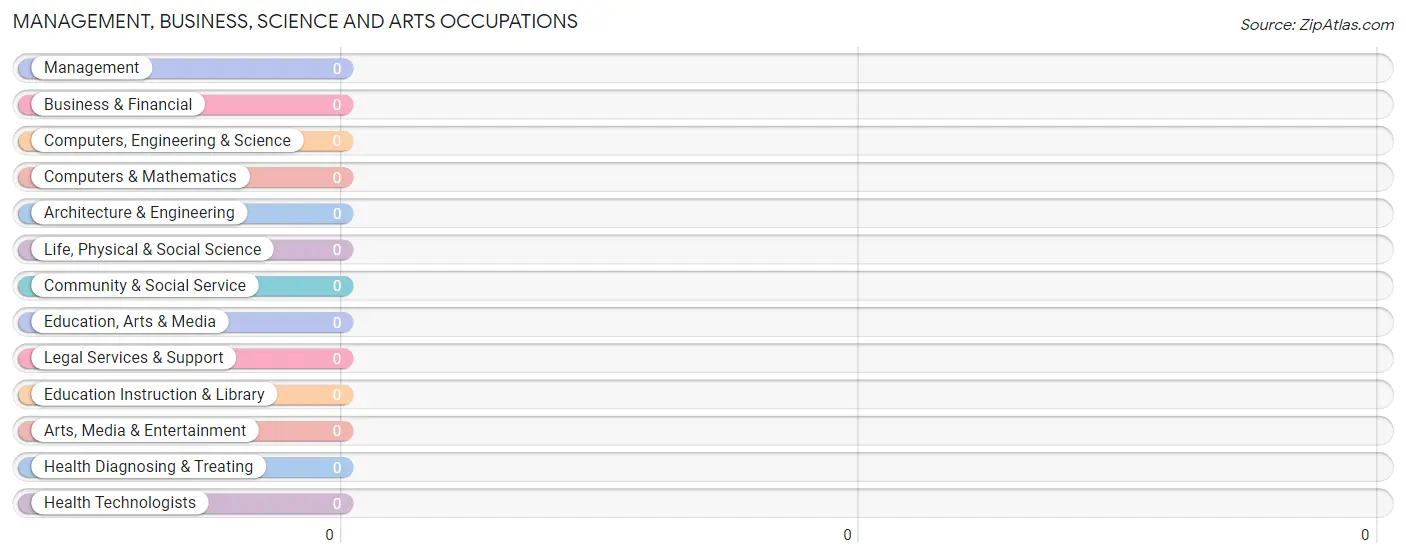
Management, Business, Science and Arts Occupations by Sex
| Occupation | Male | Female |
| Management | 0 (0.0%) | 0 (0.0%) |
| Business & Financial | 0 (0.0%) | 0 (0.0%) |
| Computers, Engineering & Science | 0 (0.0%) | 0 (0.0%) |
| Computers & Mathematics | 0 (0.0%) | 0 (0.0%) |
| Architecture & Engineering | 0 (0.0%) | 0 (0.0%) |
| Life, Physical & Social Science | 0 (0.0%) | 0 (0.0%) |
| Community & Social Service | 0 (0.0%) | 0 (0.0%) |
| Education, Arts & Media | 0 (0.0%) | 0 (0.0%) |
| Legal Services & Support | 0 (0.0%) | 0 (0.0%) |
| Education Instruction & Library | 0 (0.0%) | 0 (0.0%) |
| Arts, Media & Entertainment | 0 (0.0%) | 0 (0.0%) |
| Health Diagnosing & Treating | 0 (0.0%) | 0 (0.0%) |
| Health Technologists | 0 (0.0%) | 0 (0.0%) |
| Total (Category) | 0 (0.0%) | 0 (0.0%) |
| Total (Overall) | 15 (57.7%) | 11 (42.3%) |
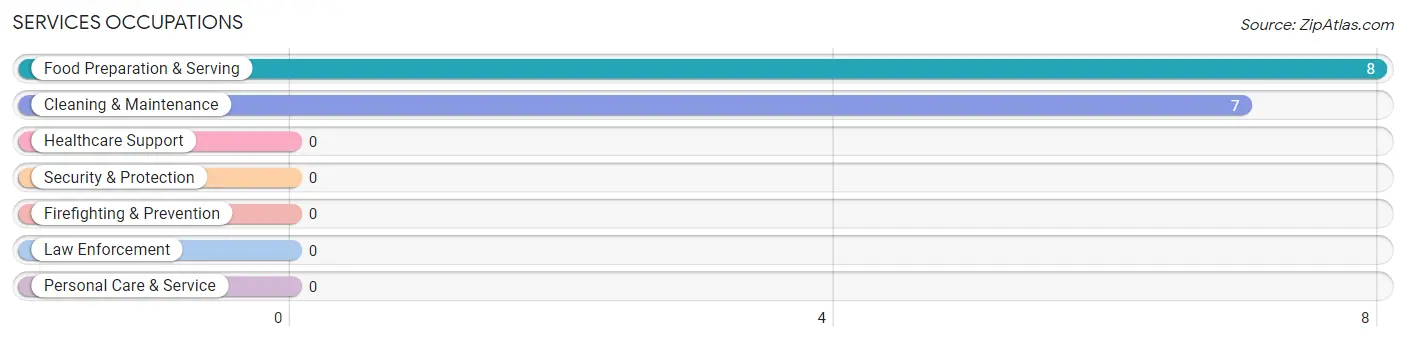
Services Occupations
The most common Services occupations in Little Bitterroot Lake are Food Preparation & Serving (8 | 30.8%), and Cleaning & Maintenance (7 | 26.9%).
Services Occupations by Sex
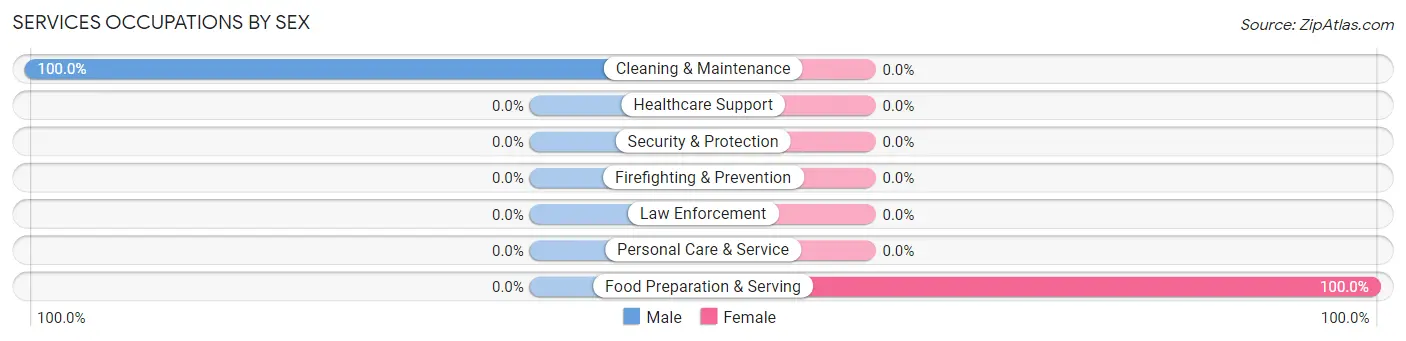
| Occupation | Male | Female |
| Healthcare Support | 0 (0.0%) | 0 (0.0%) |
| Security & Protection | 0 (0.0%) | 0 (0.0%) |
| Firefighting & Prevention | 0 (0.0%) | 0 (0.0%) |
| Law Enforcement | 0 (0.0%) | 0 (0.0%) |
| Food Preparation & Serving | 0 (0.0%) | 8 (100.0%) |
| Cleaning & Maintenance | 7 (100.0%) | 0 (0.0%) |
| Personal Care & Service | 0 (0.0%) | 0 (0.0%) |
| Total (Category) | 7 (46.7%) | 8 (53.3%) |
| Total (Overall) | 15 (57.7%) | 11 (42.3%) |
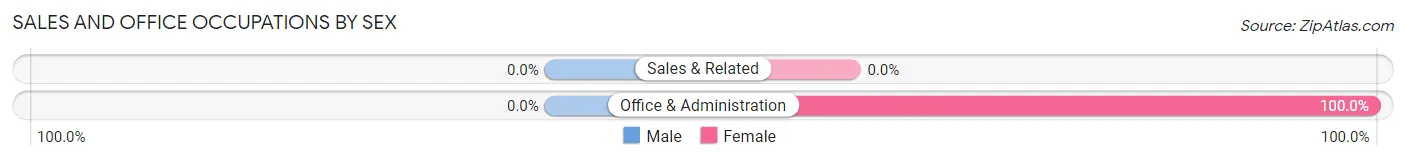
Sales and Office Occupations
The most common Sales and Office occupations in Little Bitterroot Lake are , and Office & Administration (3 | 11.5%).
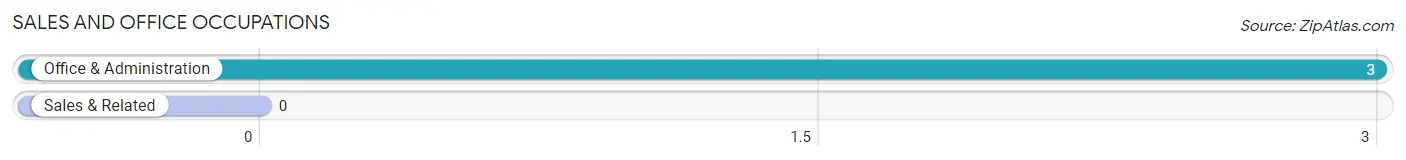
Sales and Office Occupations by Sex
| Occupation | Male | Female |
| Sales & Related | 0 (0.0%) | 0 (0.0%) |
| Office & Administration | 0 (0.0%) | 3 (100.0%) |
| Total (Category) | 0 (0.0%) | 3 (100.0%) |
| Total (Overall) | 15 (57.7%) | 11 (42.3%) |
Natural Resources, Construction and Maintenance Occupations
Natural Resources, Construction and Maintenance Occupations by Sex
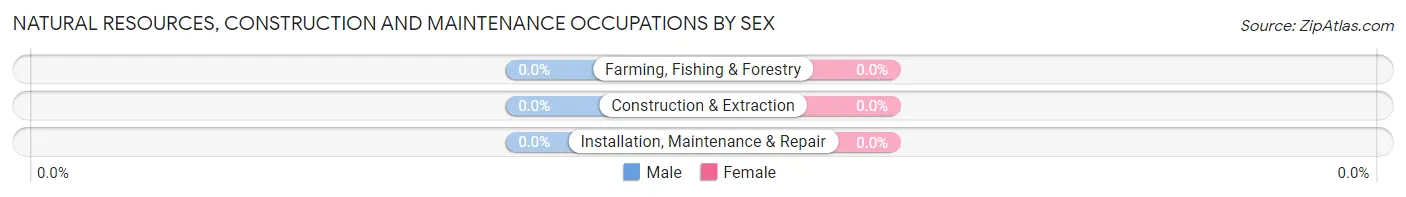
| Occupation | Male | Female |
| Farming, Fishing & Forestry | 0 (0.0%) | 0 (0.0%) |
| Construction & Extraction | 0 (0.0%) | 0 (0.0%) |
| Installation, Maintenance & Repair | 0 (0.0%) | 0 (0.0%) |
| Total (Category) | 0 (0.0%) | 0 (0.0%) |
| Total (Overall) | 15 (57.7%) | 11 (42.3%) |
Production, Transportation and Moving Occupations
The most common Production, Transportation and Moving occupations in Little Bitterroot Lake are , and Transportation (8 | 30.8%).
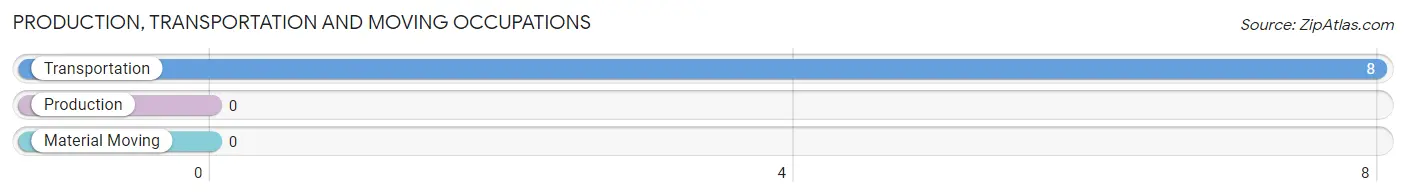
Production, Transportation and Moving Occupations by Sex
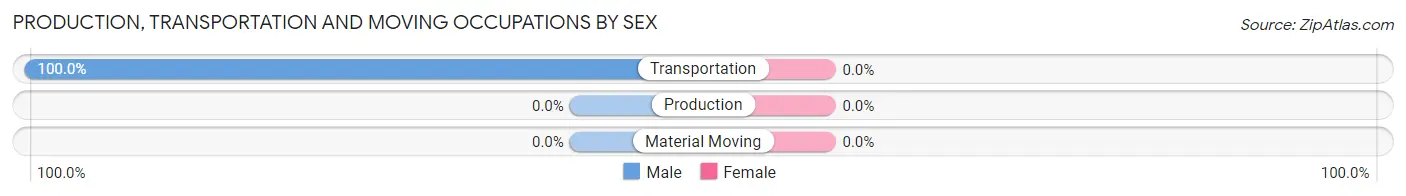
| Occupation | Male | Female |
| Production | 0 (0.0%) | 0 (0.0%) |
| Transportation | 8 (100.0%) | 0 (0.0%) |
| Material Moving | 0 (0.0%) | 0 (0.0%) |
| Total (Category) | 8 (100.0%) | 0 (0.0%) |
| Total (Overall) | 15 (57.7%) | 11 (42.3%) |
Employment Industries by Sex in Little Bitterroot Lake
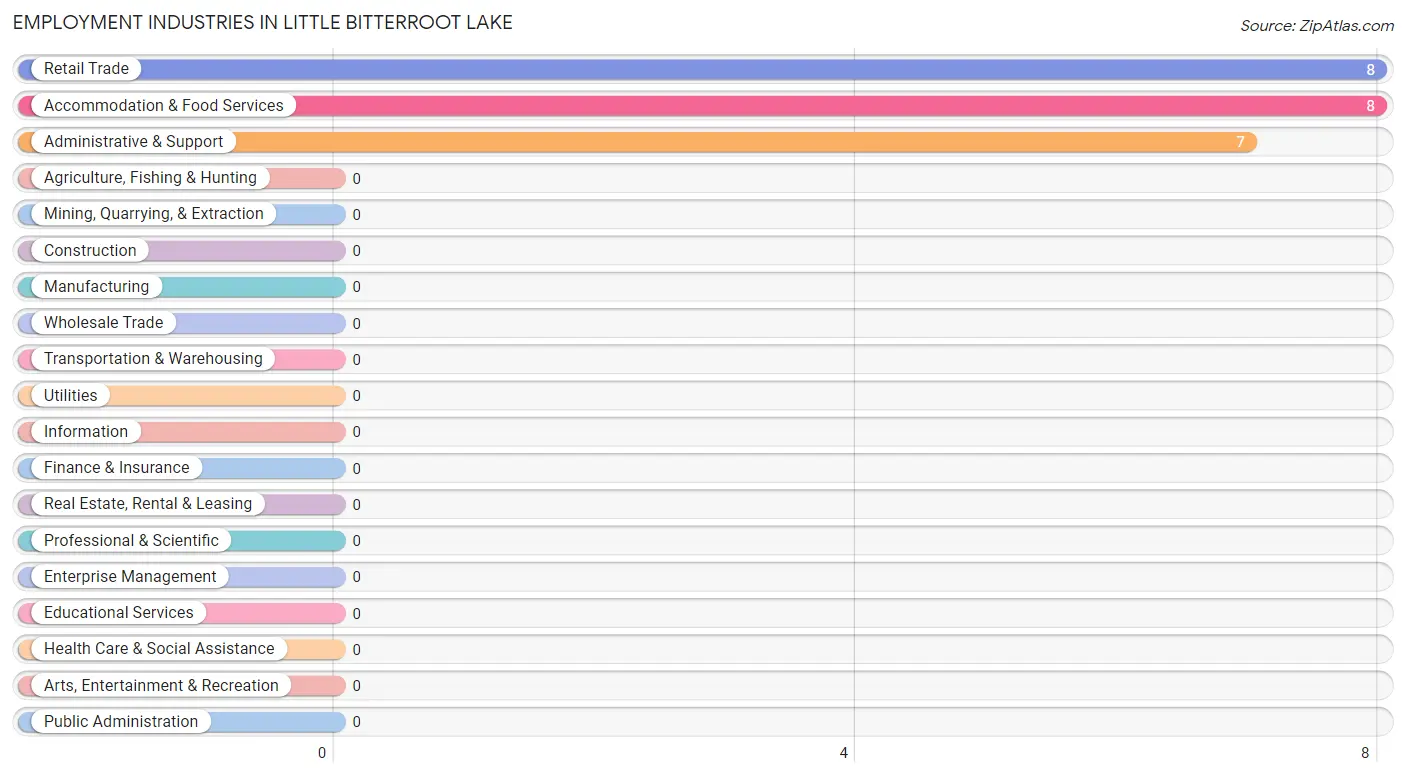
Employment Industries in Little Bitterroot Lake
The major employment industries in Little Bitterroot Lake include Retail Trade (8 | 30.8%), Accommodation & Food Services (8 | 30.8%), and Administrative & Support (7 | 26.9%).
Employment Industries by Sex in Little Bitterroot Lake
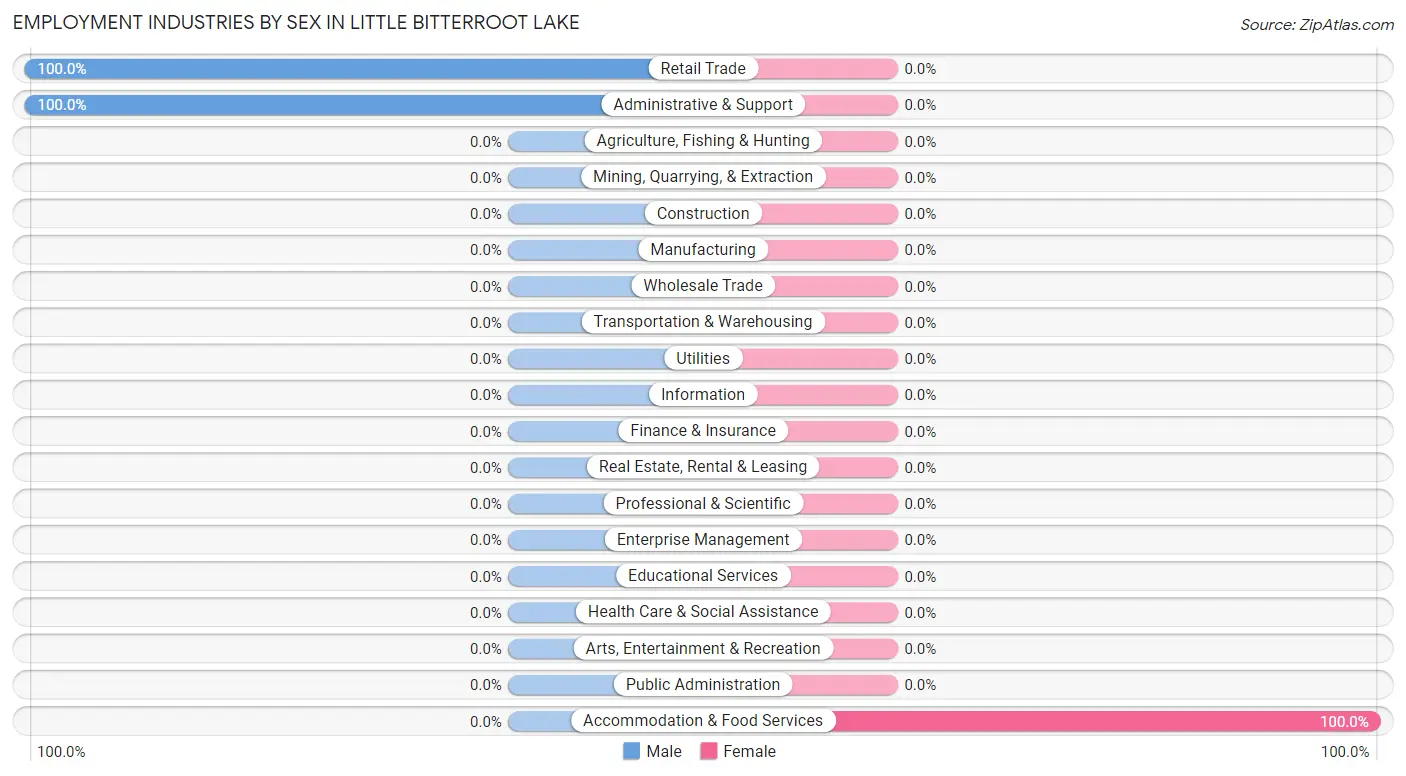
| Industry | Male | Female |
| Agriculture, Fishing & Hunting | 0 (0.0%) | 0 (0.0%) |
| Mining, Quarrying, & Extraction | 0 (0.0%) | 0 (0.0%) |
| Construction | 0 (0.0%) | 0 (0.0%) |
| Manufacturing | 0 (0.0%) | 0 (0.0%) |
| Wholesale Trade | 0 (0.0%) | 0 (0.0%) |
| Retail Trade | 8 (100.0%) | 0 (0.0%) |
| Transportation & Warehousing | 0 (0.0%) | 0 (0.0%) |
| Utilities | 0 (0.0%) | 0 (0.0%) |
| Information | 0 (0.0%) | 0 (0.0%) |
| Finance & Insurance | 0 (0.0%) | 0 (0.0%) |
| Real Estate, Rental & Leasing | 0 (0.0%) | 0 (0.0%) |
| Professional & Scientific | 0 (0.0%) | 0 (0.0%) |
| Enterprise Management | 0 (0.0%) | 0 (0.0%) |
| Administrative & Support | 7 (100.0%) | 0 (0.0%) |
| Educational Services | 0 (0.0%) | 0 (0.0%) |
| Health Care & Social Assistance | 0 (0.0%) | 0 (0.0%) |
| Arts, Entertainment & Recreation | 0 (0.0%) | 0 (0.0%) |
| Accommodation & Food Services | 0 (0.0%) | 8 (100.0%) |
| Public Administration | 0 (0.0%) | 0 (0.0%) |
| Total | 15 (57.7%) | 11 (42.3%) |
Education in Little Bitterroot Lake
School Enrollment in Little Bitterroot Lake
| School Level | # Students | % Students |
| Nursery / Preschool | 0 | 0.0% |
| Kindergarten | 0 | 0.0% |
| Elementary School | 0 | 0.0% |
| Middle School | 0 | 0.0% |
| High School | 0 | 0.0% |
| College / Undergraduate | 0 | 0.0% |
| Graduate / Professional | 0 | 0.0% |
| Total | 0 | 0.0% |
School Enrollment by Age by Funding Source in Little Bitterroot Lake
| Age Bracket | Public School | Private School |
| 3 to 4 Year Olds | 0 (0.0%) | 0 (0.0%) |
| 5 to 9 Year Old | 0 (0.0%) | 0 (0.0%) |
| 10 to 14 Year Olds | 0 (0.0%) | 0 (0.0%) |
| 15 to 17 Year Olds | 0 (0.0%) | 0 (0.0%) |
| 18 to 19 Year Olds | 0 (0.0%) | 0 (0.0%) |
| 20 to 24 Year Olds | 0 (0.0%) | 0 (0.0%) |
| 25 to 34 Year Olds | 0 (0.0%) | 0 (0.0%) |
| 35 Years and over | 0 (0.0%) | 0 (0.0%) |
| Total | 0 (0.0%) | 0 (0.0%) |
Educational Attainment by Field of Study in Little Bitterroot Lake
Visual & performing arts (23 | 50.0%), psychology (11 | 23.9%), computers & mathematics (3 | 6.5%), bio, nature & agricultural (3 | 6.5%), and business (3 | 6.5%) are the most common fields of study among 46 individuals in Little Bitterroot Lake who have obtained a bachelor's degree or higher.
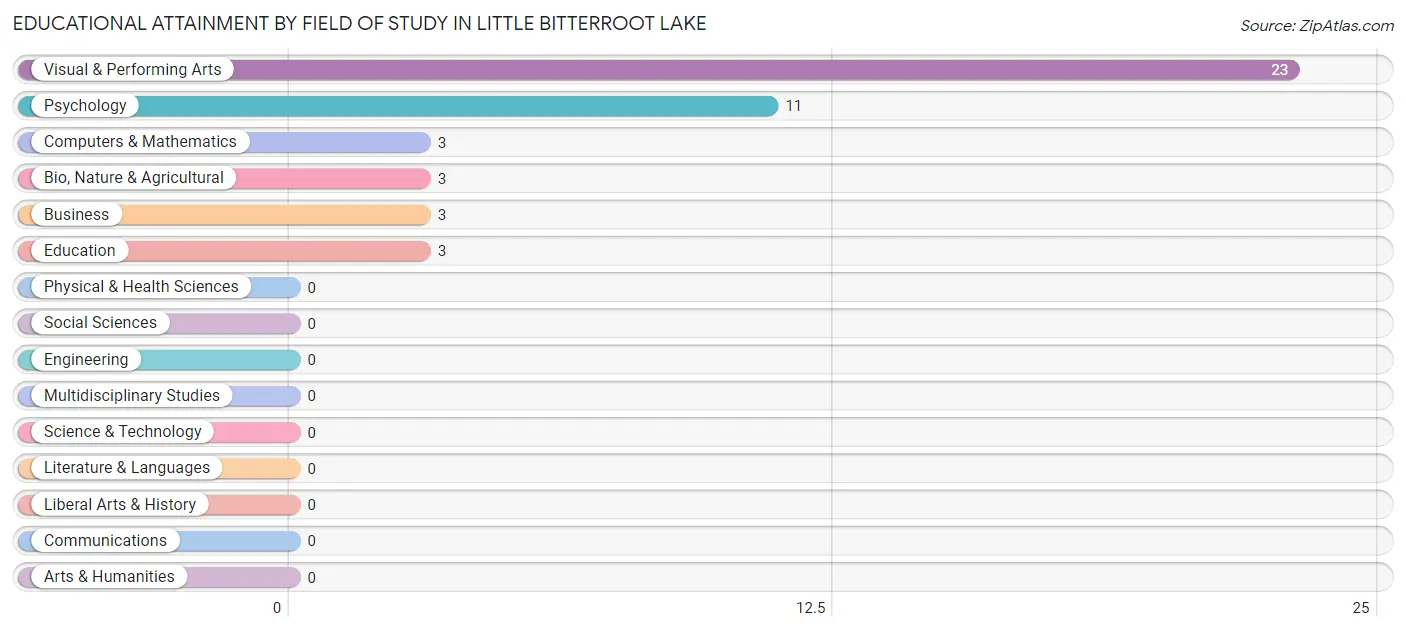
| Field of Study | # Graduates | % Graduates |
| Computers & Mathematics | 3 | 6.5% |
| Bio, Nature & Agricultural | 3 | 6.5% |
| Physical & Health Sciences | 0 | 0.0% |
| Psychology | 11 | 23.9% |
| Social Sciences | 0 | 0.0% |
| Engineering | 0 | 0.0% |
| Multidisciplinary Studies | 0 | 0.0% |
| Science & Technology | 0 | 0.0% |
| Business | 3 | 6.5% |
| Education | 3 | 6.5% |
| Literature & Languages | 0 | 0.0% |
| Liberal Arts & History | 0 | 0.0% |
| Visual & Performing Arts | 23 | 50.0% |
| Communications | 0 | 0.0% |
| Arts & Humanities | 0 | 0.0% |
| Total | 46 | 100.0% |
Transportation & Commute in Little Bitterroot Lake
Vehicle Availability by Sex in Little Bitterroot Lake
The most prevalent vehicle ownership categories in Little Bitterroot Lake are males with 2 vehicles (8, accounting for 100.0%) and females with 2 vehicles (8, making up 72.7%).
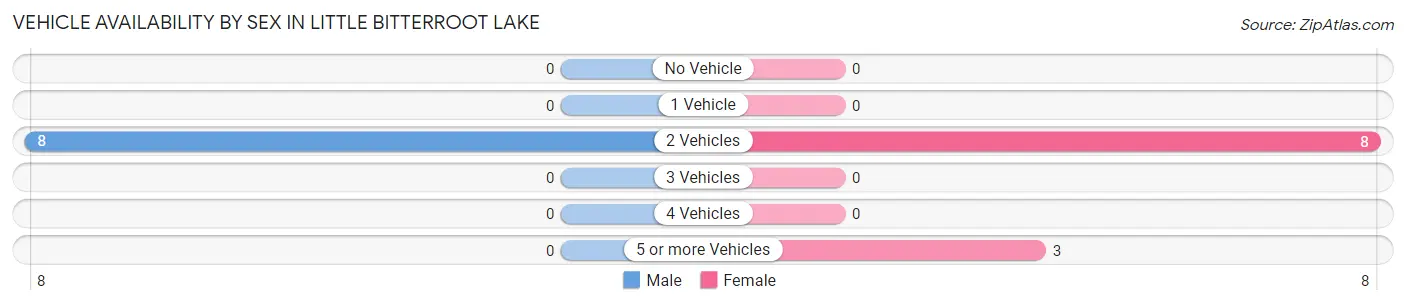
| Vehicles Available | Male | Female |
| No Vehicle | 0 (0.0%) | 0 (0.0%) |
| 1 Vehicle | 0 (0.0%) | 0 (0.0%) |
| 2 Vehicles | 8 (100.0%) | 8 (72.7%) |
| 3 Vehicles | 0 (0.0%) | 0 (0.0%) |
| 4 Vehicles | 0 (0.0%) | 0 (0.0%) |
| 5 or more Vehicles | 0 (0.0%) | 3 (27.3%) |
| Total | 8 (100.0%) | 11 (100.0%) |
Commute Time in Little Bitterroot Lake
The most frequently occuring commute durations in Little Bitterroot Lake are 30 to 34 minutes (8 commuters, 72.7%), 40 to 44 minutes (3 commuters, 27.3%), and less than 5 minutes (0 commuters, 0.0%).
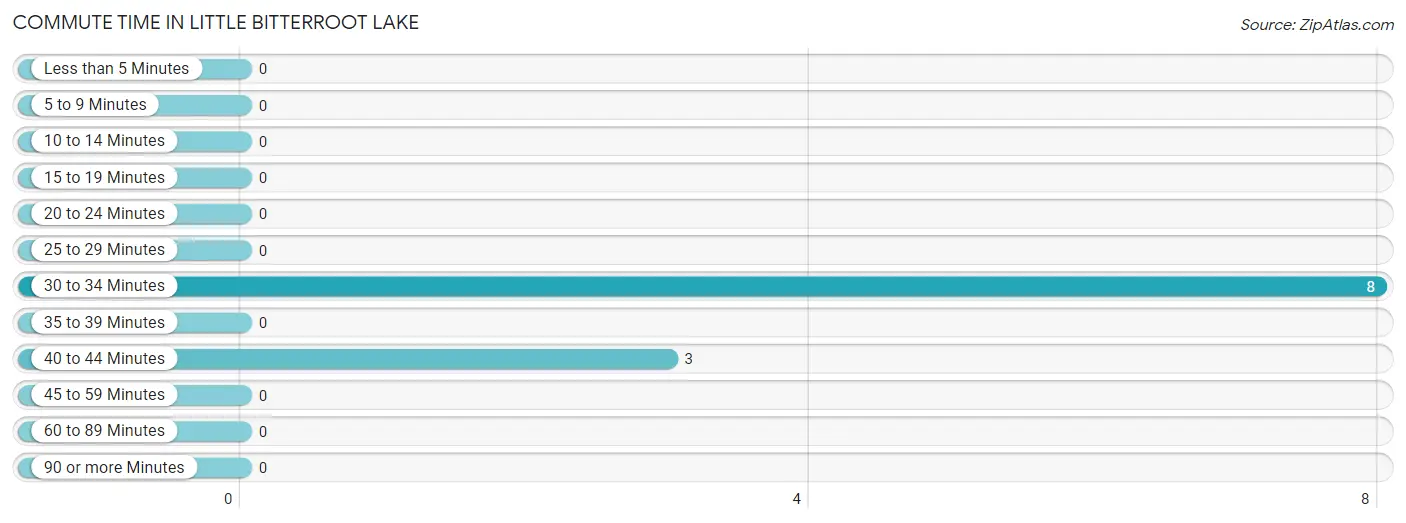
| Commute Time | # Commuters | % Commuters |
| Less than 5 Minutes | 0 | 0.0% |
| 5 to 9 Minutes | 0 | 0.0% |
| 10 to 14 Minutes | 0 | 0.0% |
| 15 to 19 Minutes | 0 | 0.0% |
| 20 to 24 Minutes | 0 | 0.0% |
| 25 to 29 Minutes | 0 | 0.0% |
| 30 to 34 Minutes | 8 | 72.7% |
| 35 to 39 Minutes | 0 | 0.0% |
| 40 to 44 Minutes | 3 | 27.3% |
| 45 to 59 Minutes | 0 | 0.0% |
| 60 to 89 Minutes | 0 | 0.0% |
| 90 or more Minutes | 0 | 0.0% |
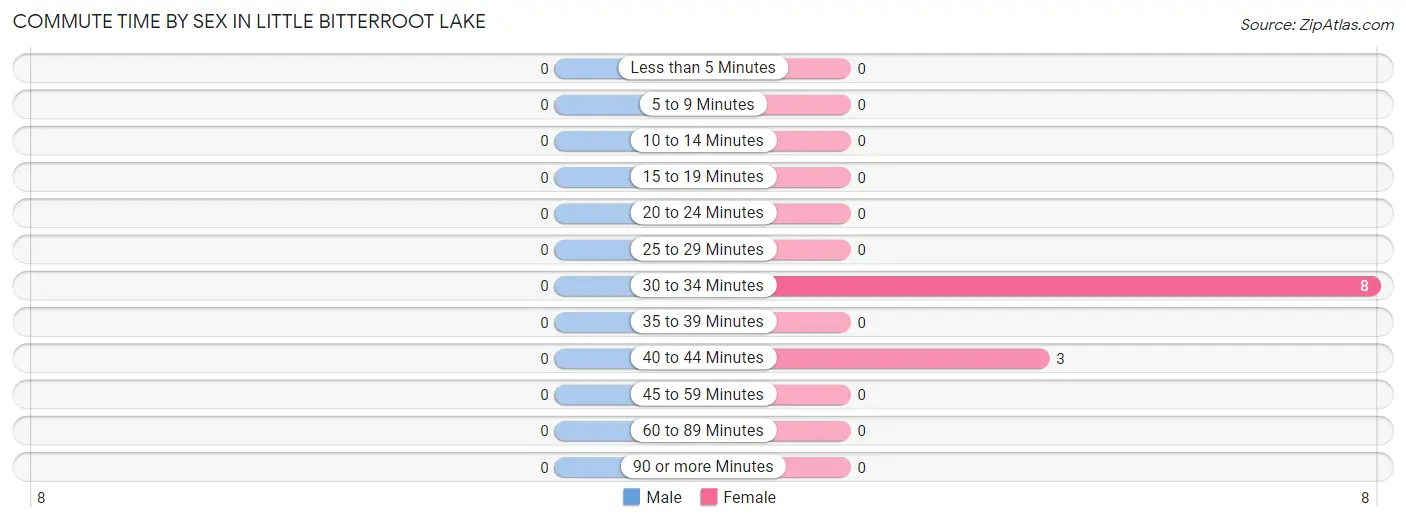
Commute Time by Sex in Little Bitterroot Lake
| Commute Time | Male | Female |
| Less than 5 Minutes | 0 (0.0%) | 0 (0.0%) |
| 5 to 9 Minutes | 0 (0.0%) | 0 (0.0%) |
| 10 to 14 Minutes | 0 (0.0%) | 0 (0.0%) |
| 15 to 19 Minutes | 0 (0.0%) | 0 (0.0%) |
| 20 to 24 Minutes | 0 (0.0%) | 0 (0.0%) |
| 25 to 29 Minutes | 0 (0.0%) | 0 (0.0%) |
| 30 to 34 Minutes | 0 (0.0%) | 8 (72.7%) |
| 35 to 39 Minutes | 0 (0.0%) | 0 (0.0%) |
| 40 to 44 Minutes | 0 (0.0%) | 3 (27.3%) |
| 45 to 59 Minutes | 0 (0.0%) | 0 (0.0%) |
| 60 to 89 Minutes | 0 (0.0%) | 0 (0.0%) |
| 90 or more Minutes | 0 (0.0%) | 0 (0.0%) |
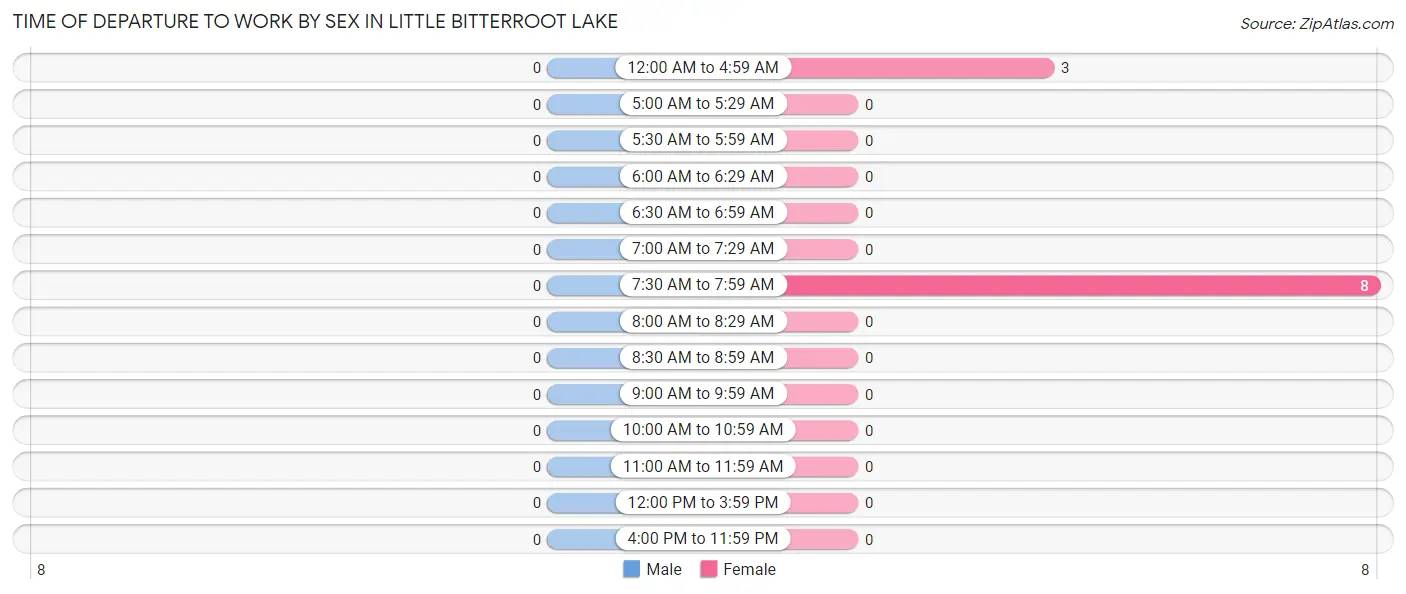
Time of Departure to Work by Sex in Little Bitterroot Lake
| Time of Departure | Male | Female |
| 12:00 AM to 4:59 AM | 0 (0.0%) | 3 (27.3%) |
| 5:00 AM to 5:29 AM | 0 (0.0%) | 0 (0.0%) |
| 5:30 AM to 5:59 AM | 0 (0.0%) | 0 (0.0%) |
| 6:00 AM to 6:29 AM | 0 (0.0%) | 0 (0.0%) |
| 6:30 AM to 6:59 AM | 0 (0.0%) | 0 (0.0%) |
| 7:00 AM to 7:29 AM | 0 (0.0%) | 0 (0.0%) |
| 7:30 AM to 7:59 AM | 0 (0.0%) | 8 (72.7%) |
| 8:00 AM to 8:29 AM | 0 (0.0%) | 0 (0.0%) |
| 8:30 AM to 8:59 AM | 0 (0.0%) | 0 (0.0%) |
| 9:00 AM to 9:59 AM | 0 (0.0%) | 0 (0.0%) |
| 10:00 AM to 10:59 AM | 0 (0.0%) | 0 (0.0%) |
| 11:00 AM to 11:59 AM | 0 (0.0%) | 0 (0.0%) |
| 12:00 PM to 3:59 PM | 0 (0.0%) | 0 (0.0%) |
| 4:00 PM to 11:59 PM | 0 (0.0%) | 0 (0.0%) |
| Total | 0 (0.0%) | 11 (100.0%) |
Housing Occupancy in Little Bitterroot Lake
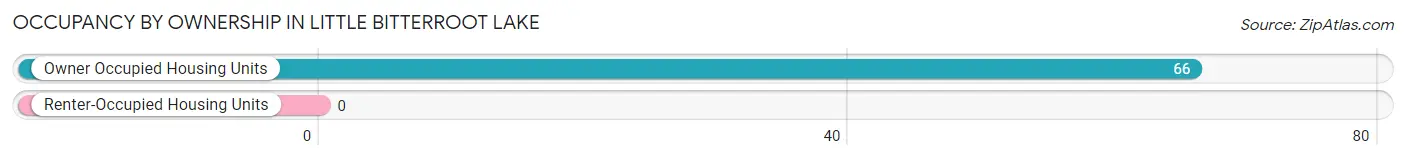
Occupancy by Ownership in Little Bitterroot Lake
Of the total 66 dwellings in Little Bitterroot Lake, owner-occupied units account for 66 (100.0%), while renter-occupied units make up 0 (0.0%).
| Occupancy | # Housing Units | % Housing Units |
| Owner Occupied Housing Units | 66 | 100.0% |
| Renter-Occupied Housing Units | 0 | 0.0% |
| Total Occupied Housing Units | 66 | 100.0% |
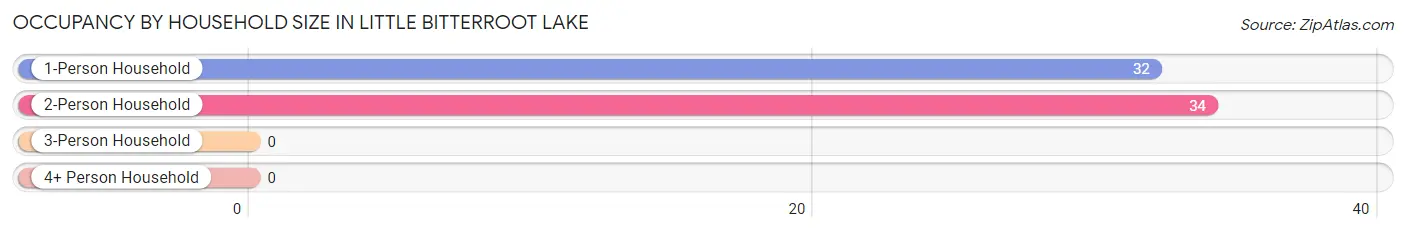
Occupancy by Household Size in Little Bitterroot Lake
| Household Size | # Housing Units | % Housing Units |
| 1-Person Household | 32 | 48.5% |
| 2-Person Household | 34 | 51.5% |
| 3-Person Household | 0 | 0.0% |
| 4+ Person Household | 0 | 0.0% |
| Total Housing Units | 66 | 100.0% |
Occupancy by Ownership by Household Size in Little Bitterroot Lake
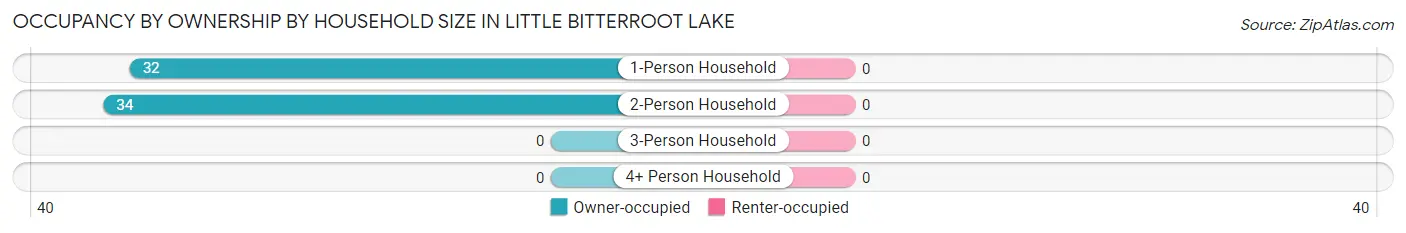
| Household Size | Owner-occupied | Renter-occupied |
| 1-Person Household | 32 (100.0%) | 0 (0.0%) |
| 2-Person Household | 34 (100.0%) | 0 (0.0%) |
| 3-Person Household | 0 (0.0%) | 0 (0.0%) |
| 4+ Person Household | 0 (0.0%) | 0 (0.0%) |
| Total Housing Units | 66 (100.0%) | 0 (0.0%) |
Occupancy by Educational Attainment in Little Bitterroot Lake
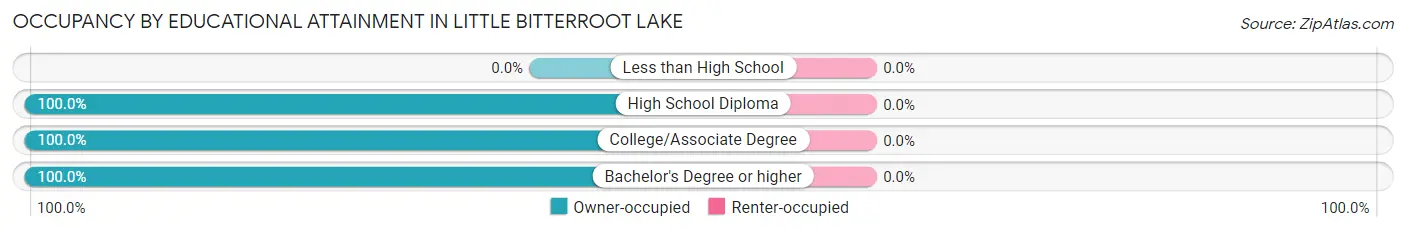
| Household Size | Owner-occupied | Renter-occupied |
| Less than High School | 0 (0.0%) | 0 (0.0%) |
| High School Diploma | 10 (100.0%) | 0 (0.0%) |
| College/Associate Degree | 26 (100.0%) | 0 (0.0%) |
| Bachelor's Degree or higher | 30 (100.0%) | 0 (0.0%) |
Occupancy by Age of Householder in Little Bitterroot Lake
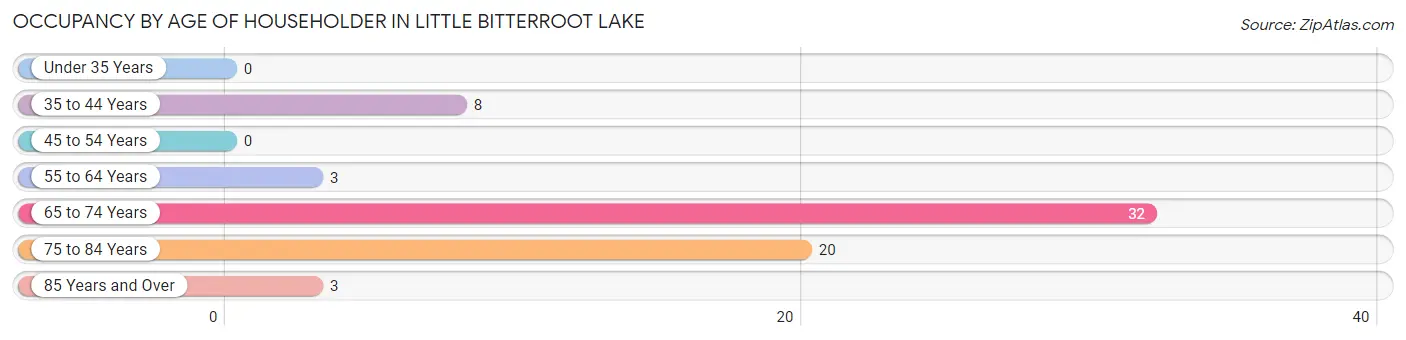
| Age Bracket | # Households | % Households |
| Under 35 Years | 0 | 0.0% |
| 35 to 44 Years | 8 | 12.1% |
| 45 to 54 Years | 0 | 0.0% |
| 55 to 64 Years | 3 | 4.5% |
| 65 to 74 Years | 32 | 48.5% |
| 75 to 84 Years | 20 | 30.3% |
| 85 Years and Over | 3 | 4.5% |
| Total | 66 | 100.0% |
Housing Finances in Little Bitterroot Lake
Median Income by Occupancy in Little Bitterroot Lake
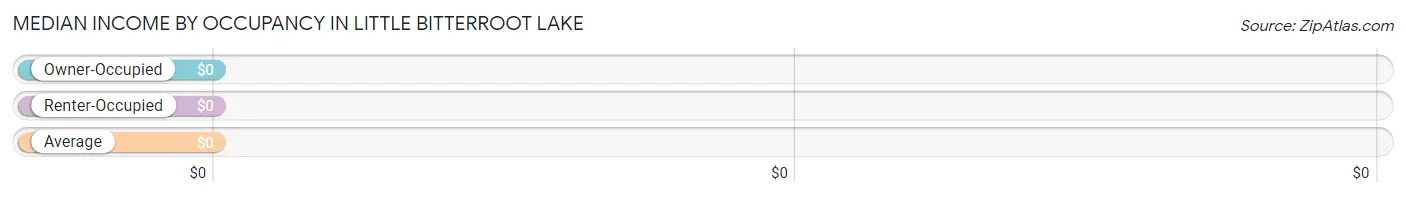
| Occupancy Type | # Households | Median Income |
| Owner-Occupied | 66 (100.0%) | $0 |
| Renter-Occupied | 0 (0.0%) | $0 |
| Average | 66 (100.0%) | $0 |
Occupancy by Householder Income Bracket in Little Bitterroot Lake
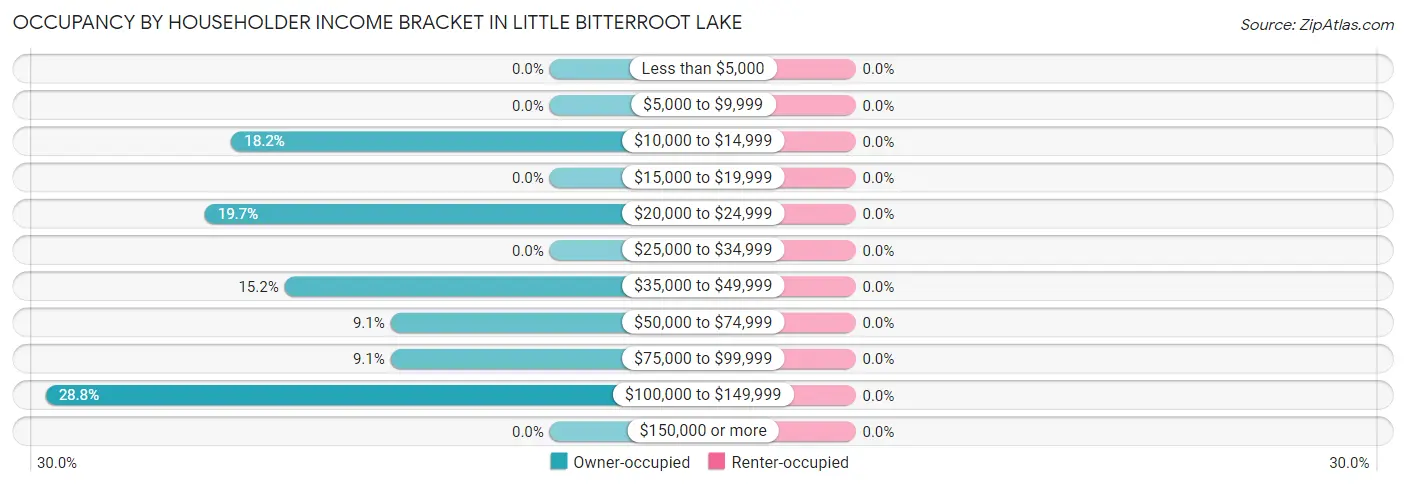
| Income Bracket | Owner-occupied | Renter-occupied |
| Less than $5,000 | 0 (0.0%) | 0 (0.0%) |
| $5,000 to $9,999 | 0 (0.0%) | 0 (0.0%) |
| $10,000 to $14,999 | 12 (18.2%) | 0 (0.0%) |
| $15,000 to $19,999 | 0 (0.0%) | 0 (0.0%) |
| $20,000 to $24,999 | 13 (19.7%) | 0 (0.0%) |
| $25,000 to $34,999 | 0 (0.0%) | 0 (0.0%) |
| $35,000 to $49,999 | 10 (15.1%) | 0 (0.0%) |
| $50,000 to $74,999 | 6 (9.1%) | 0 (0.0%) |
| $75,000 to $99,999 | 6 (9.1%) | 0 (0.0%) |
| $100,000 to $149,999 | 19 (28.8%) | 0 (0.0%) |
| $150,000 or more | 0 (0.0%) | 0 (0.0%) |
| Total | 66 (100.0%) | 0 (0.0%) |
Monthly Housing Cost Tiers in Little Bitterroot Lake
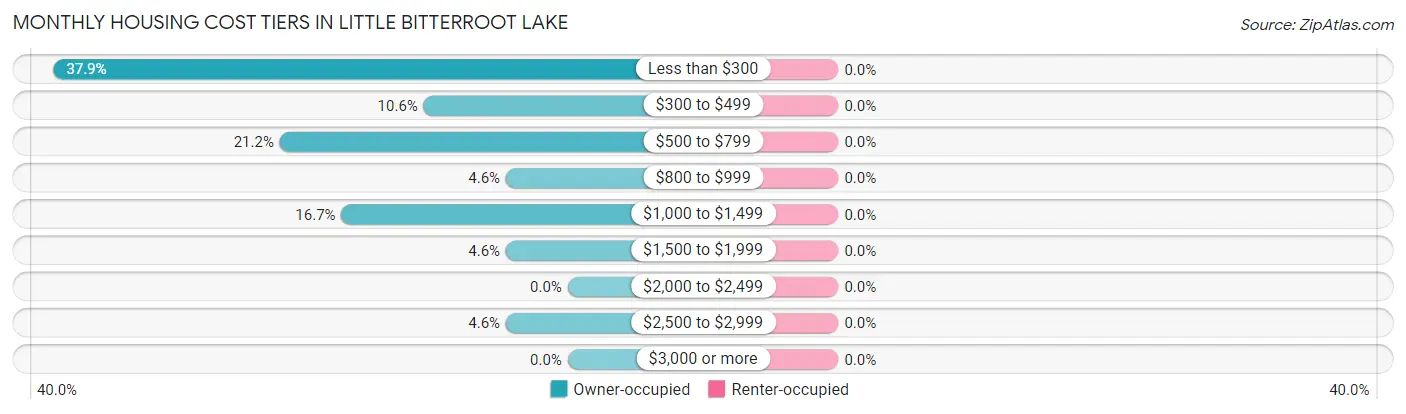
| Monthly Cost | Owner-occupied | Renter-occupied |
| Less than $300 | 25 (37.9%) | 0 (0.0%) |
| $300 to $499 | 7 (10.6%) | 0 (0.0%) |
| $500 to $799 | 14 (21.2%) | 0 (0.0%) |
| $800 to $999 | 3 (4.5%) | 0 (0.0%) |
| $1,000 to $1,499 | 11 (16.7%) | 0 (0.0%) |
| $1,500 to $1,999 | 3 (4.5%) | 0 (0.0%) |
| $2,000 to $2,499 | 0 (0.0%) | 0 (0.0%) |
| $2,500 to $2,999 | 3 (4.5%) | 0 (0.0%) |
| $3,000 or more | 0 (0.0%) | 0 (0.0%) |
| Total | 66 (100.0%) | 0 (0.0%) |
Physical Housing Characteristics in Little Bitterroot Lake
Housing Structures in Little Bitterroot Lake
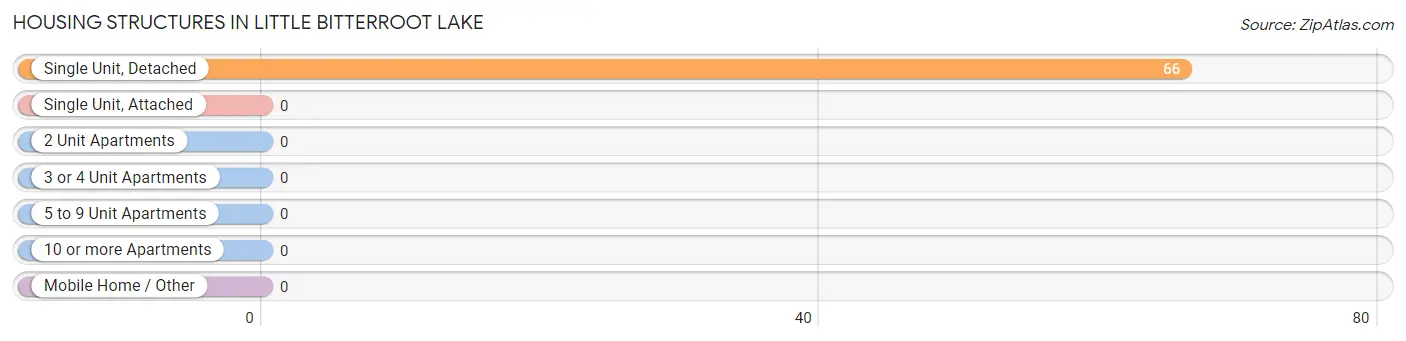
| Structure Type | # Housing Units | % Housing Units |
| Single Unit, Detached | 66 | 100.0% |
| Single Unit, Attached | 0 | 0.0% |
| 2 Unit Apartments | 0 | 0.0% |
| 3 or 4 Unit Apartments | 0 | 0.0% |
| 5 to 9 Unit Apartments | 0 | 0.0% |
| 10 or more Apartments | 0 | 0.0% |
| Mobile Home / Other | 0 | 0.0% |
| Total | 66 | 100.0% |
Housing Structures by Occupancy in Little Bitterroot Lake
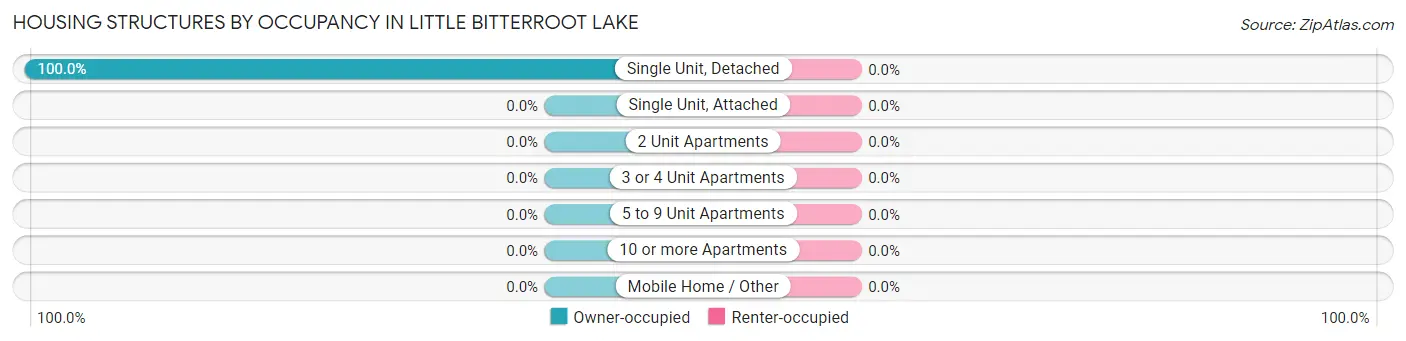
| Structure Type | Owner-occupied | Renter-occupied |
| Single Unit, Detached | 66 (100.0%) | 0 (0.0%) |
| Single Unit, Attached | 0 (0.0%) | 0 (0.0%) |
| 2 Unit Apartments | 0 (0.0%) | 0 (0.0%) |
| 3 or 4 Unit Apartments | 0 (0.0%) | 0 (0.0%) |
| 5 to 9 Unit Apartments | 0 (0.0%) | 0 (0.0%) |
| 10 or more Apartments | 0 (0.0%) | 0 (0.0%) |
| Mobile Home / Other | 0 (0.0%) | 0 (0.0%) |
| Total | 66 (100.0%) | 0 (0.0%) |
Housing Structures by Number of Rooms in Little Bitterroot Lake
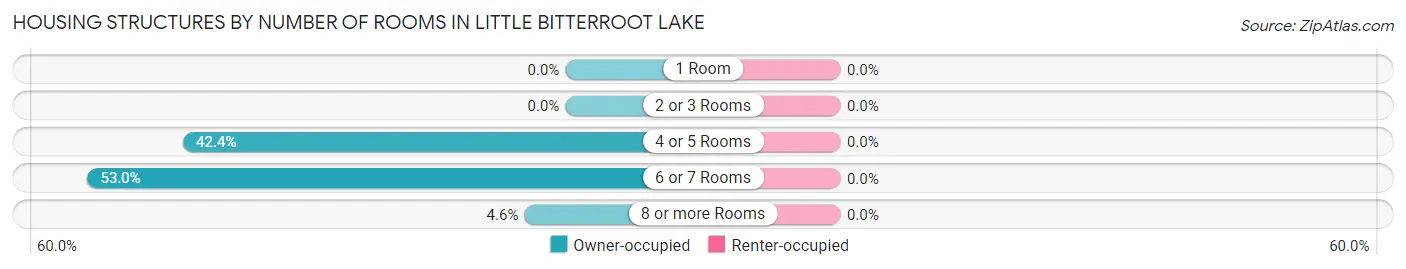
| Number of Rooms | Owner-occupied | Renter-occupied |
| 1 Room | 0 (0.0%) | 0 (0.0%) |
| 2 or 3 Rooms | 0 (0.0%) | 0 (0.0%) |
| 4 or 5 Rooms | 28 (42.4%) | 0 (0.0%) |
| 6 or 7 Rooms | 35 (53.0%) | 0 (0.0%) |
| 8 or more Rooms | 3 (4.5%) | 0 (0.0%) |
| Total | 66 (100.0%) | 0 (0.0%) |
Housing Structure by Heating Type in Little Bitterroot Lake
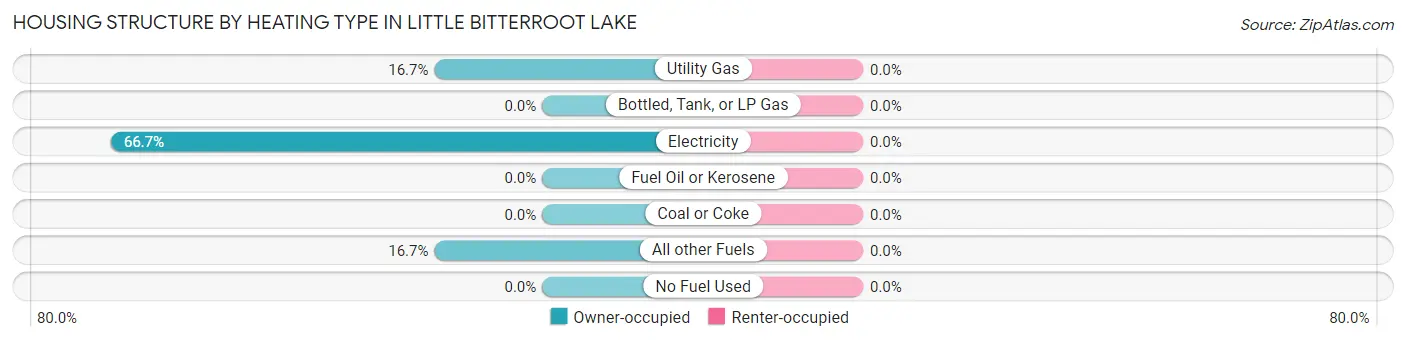
| Heating Type | Owner-occupied | Renter-occupied |
| Utility Gas | 11 (16.7%) | 0 (0.0%) |
| Bottled, Tank, or LP Gas | 0 (0.0%) | 0 (0.0%) |
| Electricity | 44 (66.7%) | 0 (0.0%) |
| Fuel Oil or Kerosene | 0 (0.0%) | 0 (0.0%) |
| Coal or Coke | 0 (0.0%) | 0 (0.0%) |
| All other Fuels | 11 (16.7%) | 0 (0.0%) |
| No Fuel Used | 0 (0.0%) | 0 (0.0%) |
| Total | 66 (100.0%) | 0 (0.0%) |
Household Vehicle Usage in Little Bitterroot Lake
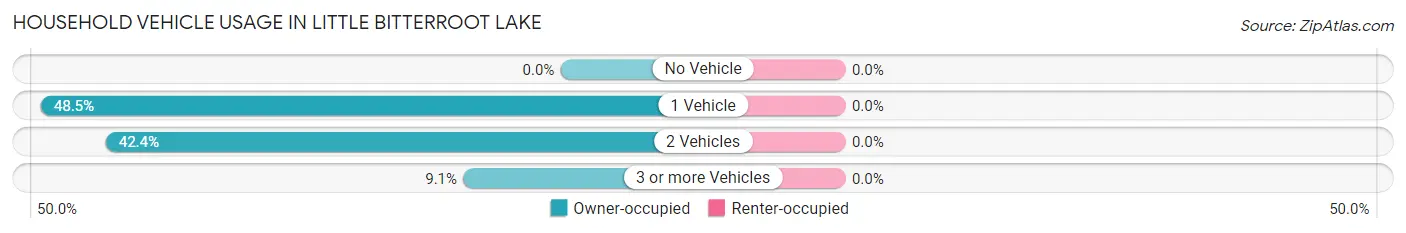
| Vehicles per Household | Owner-occupied | Renter-occupied |
| No Vehicle | 0 (0.0%) | 0 (0.0%) |
| 1 Vehicle | 32 (48.5%) | 0 (0.0%) |
| 2 Vehicles | 28 (42.4%) | 0 (0.0%) |
| 3 or more Vehicles | 6 (9.1%) | 0 (0.0%) |
| Total | 66 (100.0%) | 0 (0.0%) |
Real Estate & Mortgages in Little Bitterroot Lake
Real Estate and Mortgage Overview in Little Bitterroot Lake
| Characteristic | Without Mortgage | With Mortgage |
| Housing Units | 60 | 6 |
| Median Property Value | $539,500 | $0 |
| Median Household Income | - | - |
| Monthly Housing Costs | $471 | $0 |
| Real Estate Taxes | $3,567 | $0 |
Property Value by Mortgage Status in Little Bitterroot Lake
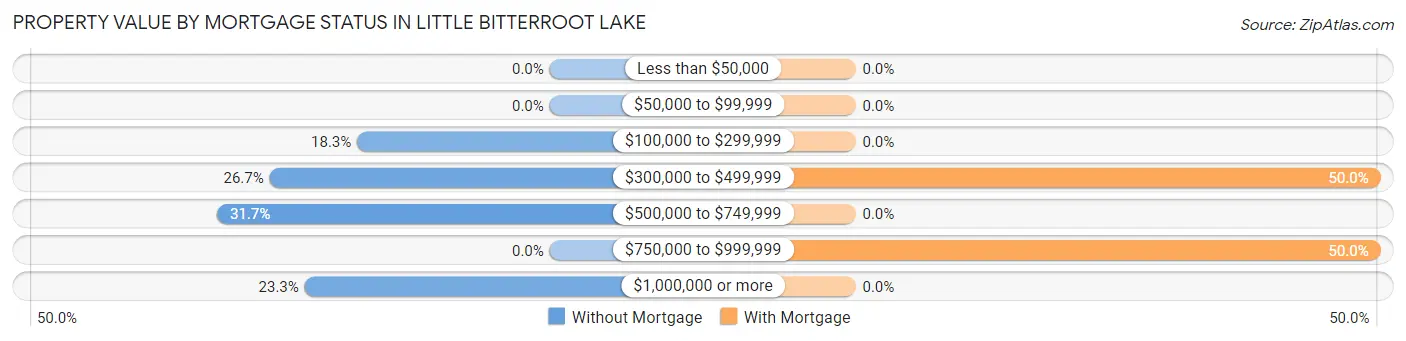
| Property Value | Without Mortgage | With Mortgage |
| Less than $50,000 | 0 (0.0%) | 0 (0.0%) |
| $50,000 to $99,999 | 0 (0.0%) | 0 (0.0%) |
| $100,000 to $299,999 | 11 (18.3%) | 0 (0.0%) |
| $300,000 to $499,999 | 16 (26.7%) | 3 (50.0%) |
| $500,000 to $749,999 | 19 (31.7%) | 0 (0.0%) |
| $750,000 to $999,999 | 0 (0.0%) | 3 (50.0%) |
| $1,000,000 or more | 14 (23.3%) | 0 (0.0%) |
| Total | 60 (100.0%) | 6 (100.0%) |
Household Income by Mortgage Status in Little Bitterroot Lake
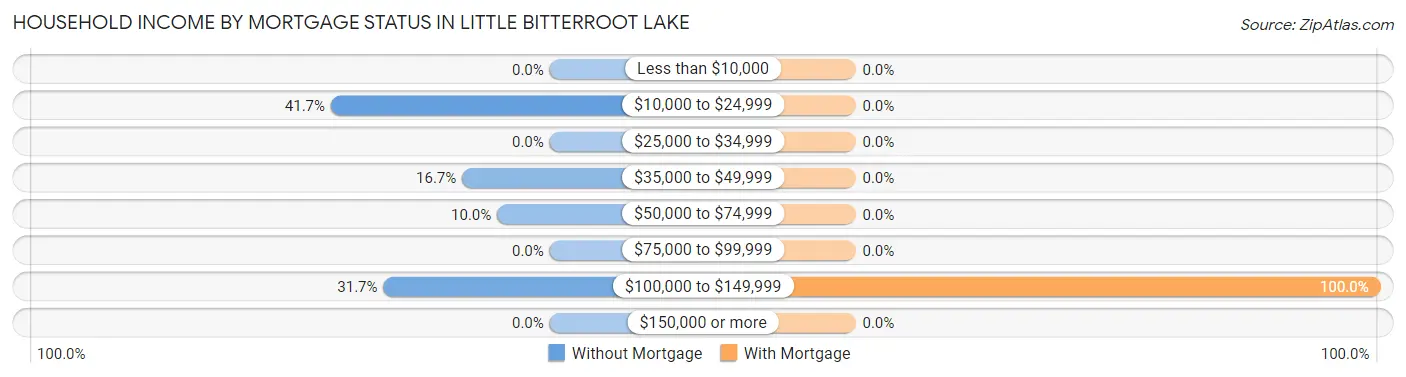
| Household Income | Without Mortgage | With Mortgage |
| Less than $10,000 | 0 (0.0%) | 0 (0.0%) |
| $10,000 to $24,999 | 25 (41.7%) | 0 (0.0%) |
| $25,000 to $34,999 | 0 (0.0%) | 0 (0.0%) |
| $35,000 to $49,999 | 10 (16.7%) | 0 (0.0%) |
| $50,000 to $74,999 | 6 (10.0%) | 0 (0.0%) |
| $75,000 to $99,999 | 0 (0.0%) | 0 (0.0%) |
| $100,000 to $149,999 | 19 (31.7%) | 6 (100.0%) |
| $150,000 or more | 0 (0.0%) | 0 (0.0%) |
| Total | 60 (100.0%) | 6 (100.0%) |
Property Value to Household Income Ratio in Little Bitterroot Lake
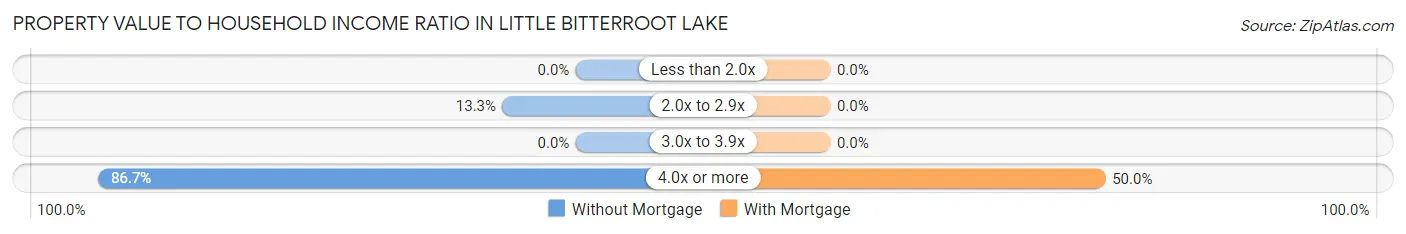
| Value-to-Income Ratio | Without Mortgage | With Mortgage |
| Less than 2.0x | 0 (0.0%) | 0 (0.0%) |
| 2.0x to 2.9x | 8 (13.3%) | 0 (0.0%) |
| 3.0x to 3.9x | 0 (0.0%) | 0 (0.0%) |
| 4.0x or more | 52 (86.7%) | 3 (50.0%) |
| Total | 60 (100.0%) | 6 (100.0%) |
Real Estate Taxes by Mortgage Status in Little Bitterroot Lake
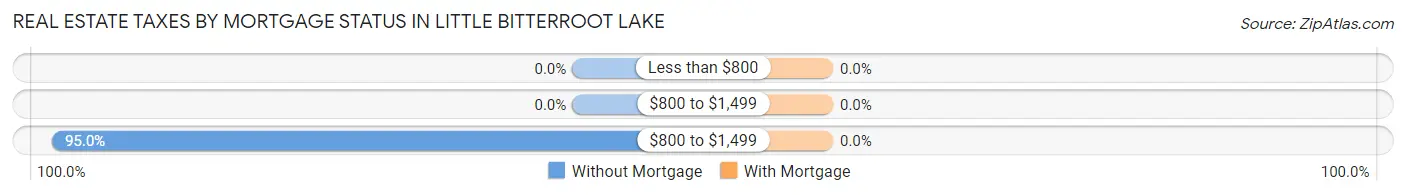
| Property Taxes | Without Mortgage | With Mortgage |
| Less than $800 | 0 (0.0%) | 0 (0.0%) |
| $800 to $1,499 | 0 (0.0%) | 0 (0.0%) |
| $800 to $1,499 | 57 (95.0%) | 0 (0.0%) |
| Total | 60 (100.0%) | 6 (100.0%) |
Health & Disability in Little Bitterroot Lake
Health Insurance Coverage by Age in Little Bitterroot Lake
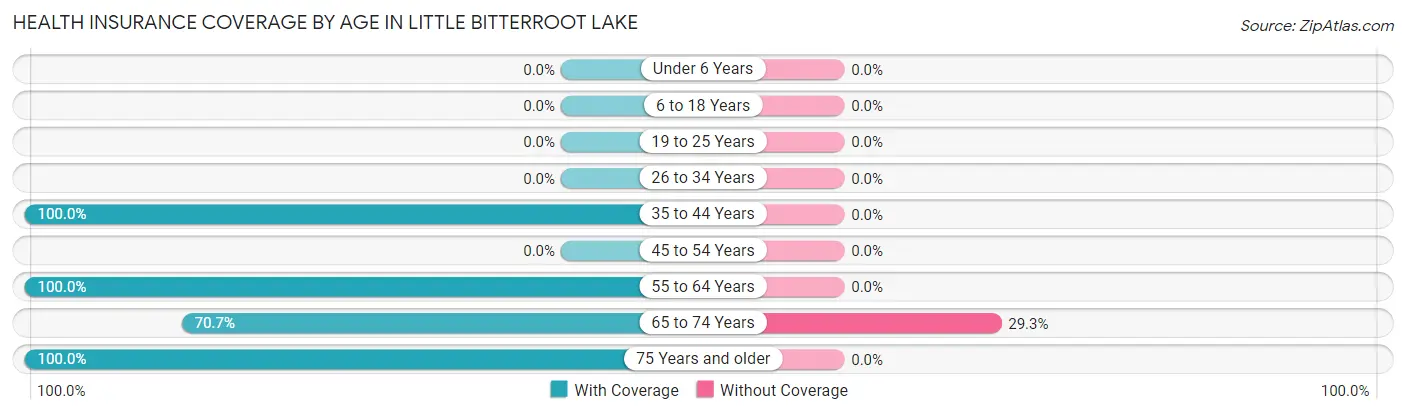
| Age Bracket | With Coverage | Without Coverage |
| Under 6 Years | 0 (0.0%) | 0 (0.0%) |
| 6 to 18 Years | 0 (0.0%) | 0 (0.0%) |
| 19 to 25 Years | 0 (0.0%) | 0 (0.0%) |
| 26 to 34 Years | 0 (0.0%) | 0 (0.0%) |
| 35 to 44 Years | 16 (100.0%) | 0 (0.0%) |
| 45 to 54 Years | 0 (0.0%) | 0 (0.0%) |
| 55 to 64 Years | 24 (100.0%) | 0 (0.0%) |
| 65 to 74 Years | 29 (70.7%) | 12 (29.3%) |
| 75 Years and older | 23 (100.0%) | 0 (0.0%) |
| Total | 92 (88.5%) | 12 (11.5%) |
Health Insurance Coverage by Citizenship Status in Little Bitterroot Lake
| Citizenship Status | With Coverage | Without Coverage |
| Native Born | 0 (0.0%) | 0 (0.0%) |
| Foreign Born, Citizen | 0 (0.0%) | 0 (0.0%) |
| Foreign Born, not a Citizen | 0 (0.0%) | 0 (0.0%) |
Health Insurance Coverage by Household Income in Little Bitterroot Lake
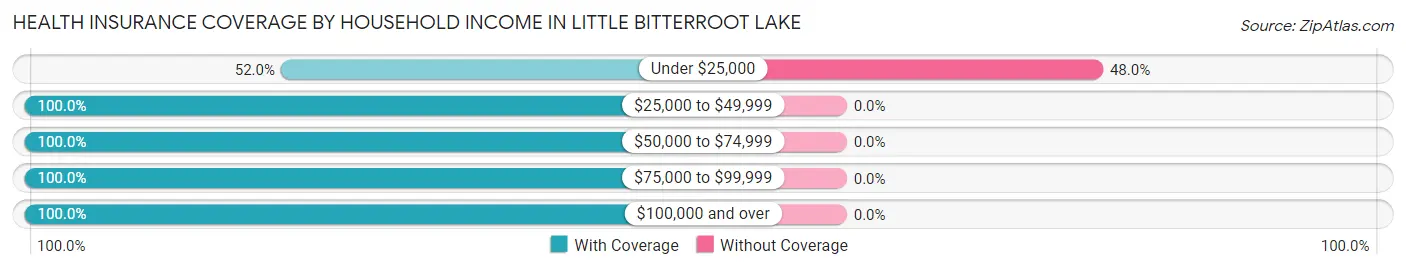
| Household Income | With Coverage | Without Coverage |
| Under $25,000 | 13 (52.0%) | 12 (48.0%) |
| $25,000 to $49,999 | 14 (100.0%) | 0 (0.0%) |
| $50,000 to $74,999 | 16 (100.0%) | 0 (0.0%) |
| $75,000 to $99,999 | 12 (100.0%) | 0 (0.0%) |
| $100,000 and over | 37 (100.0%) | 0 (0.0%) |
Public vs Private Health Insurance Coverage by Age in Little Bitterroot Lake
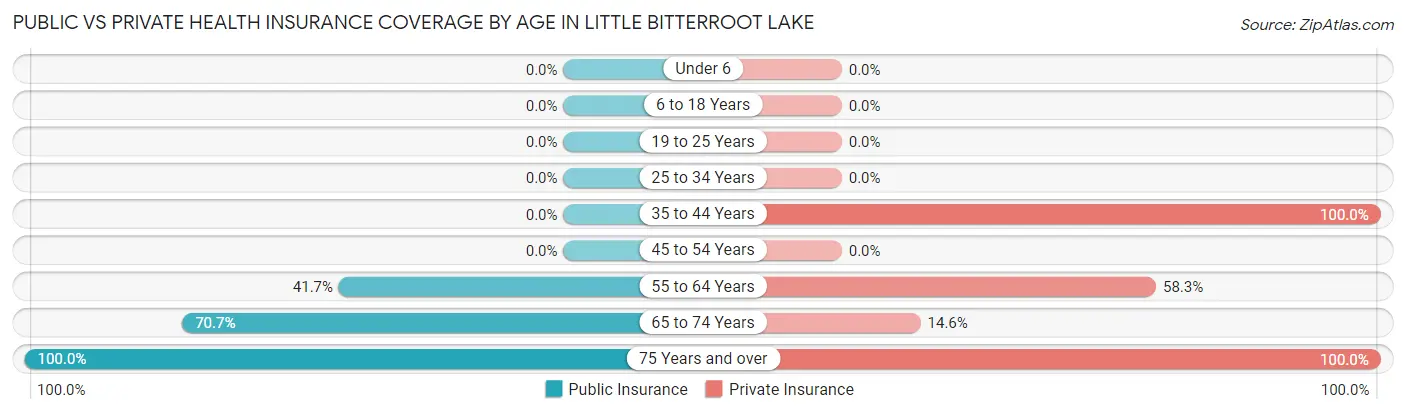
| Age Bracket | Public Insurance | Private Insurance |
| Under 6 | 0 (0.0%) | 0 (0.0%) |
| 6 to 18 Years | 0 (0.0%) | 0 (0.0%) |
| 19 to 25 Years | 0 (0.0%) | 0 (0.0%) |
| 25 to 34 Years | 0 (0.0%) | 0 (0.0%) |
| 35 to 44 Years | 0 (0.0%) | 16 (100.0%) |
| 45 to 54 Years | 0 (0.0%) | 0 (0.0%) |
| 55 to 64 Years | 10 (41.7%) | 14 (58.3%) |
| 65 to 74 Years | 29 (70.7%) | 6 (14.6%) |
| 75 Years and over | 23 (100.0%) | 23 (100.0%) |
| Total | 62 (59.6%) | 59 (56.7%) |
Disability Status by Sex by Age in Little Bitterroot Lake
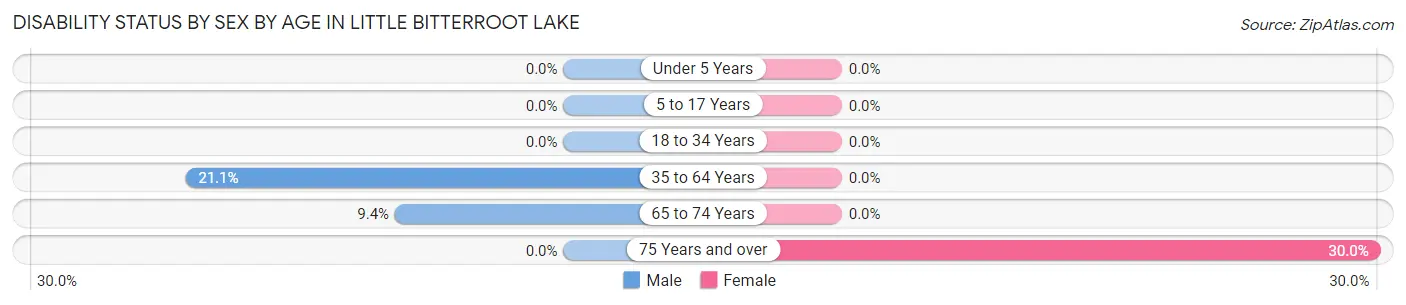
| Age Bracket | Male | Female |
| Under 5 Years | 0 (0.0%) | 0 (0.0%) |
| 5 to 17 Years | 0 (0.0%) | 0 (0.0%) |
| 18 to 34 Years | 0 (0.0%) | 0 (0.0%) |
| 35 to 64 Years | 4 (21.0%) | 0 (0.0%) |
| 65 to 74 Years | 3 (9.4%) | 0 (0.0%) |
| 75 Years and over | 0 (0.0%) | 3 (30.0%) |
Disability Class by Sex by Age in Little Bitterroot Lake
Disability Class: Hearing Difficulty
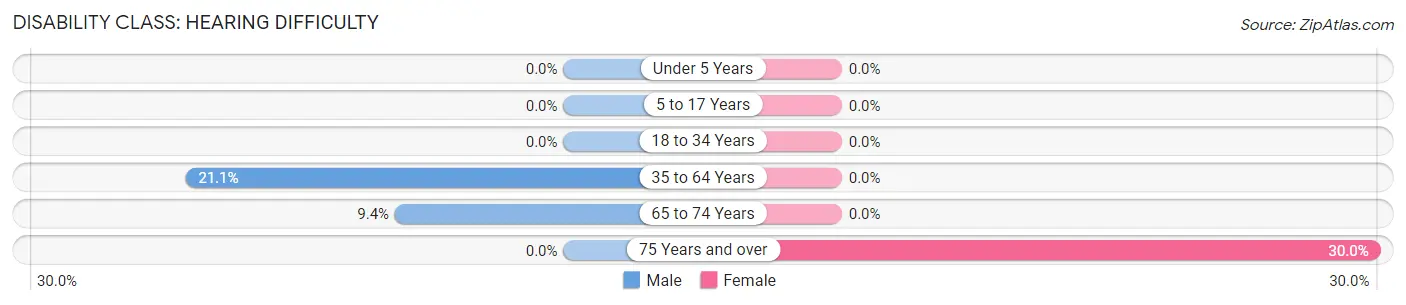
| Age Bracket | Male | Female |
| Under 5 Years | 0 (0.0%) | 0 (0.0%) |
| 5 to 17 Years | 0 (0.0%) | 0 (0.0%) |
| 18 to 34 Years | 0 (0.0%) | 0 (0.0%) |
| 35 to 64 Years | 4 (21.0%) | 0 (0.0%) |
| 65 to 74 Years | 3 (9.4%) | 0 (0.0%) |
| 75 Years and over | 0 (0.0%) | 3 (30.0%) |
Disability Class: Vision Difficulty
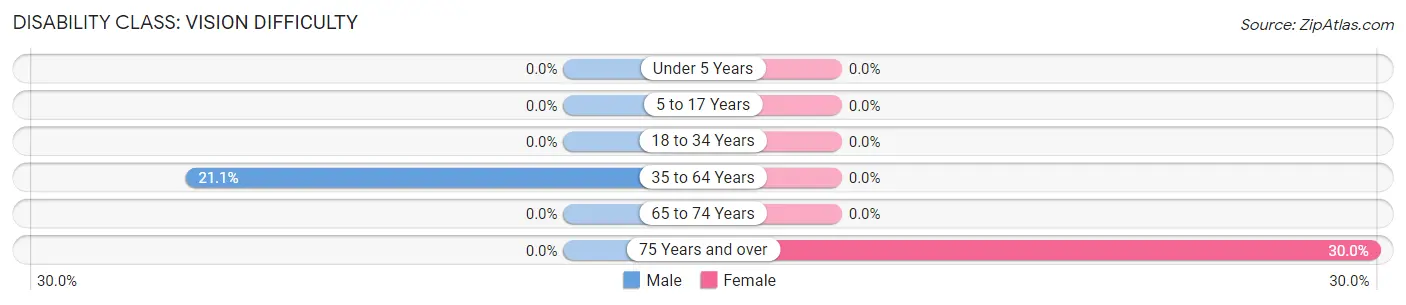
| Age Bracket | Male | Female |
| Under 5 Years | 0 (0.0%) | 0 (0.0%) |
| 5 to 17 Years | 0 (0.0%) | 0 (0.0%) |
| 18 to 34 Years | 0 (0.0%) | 0 (0.0%) |
| 35 to 64 Years | 4 (21.0%) | 0 (0.0%) |
| 65 to 74 Years | 0 (0.0%) | 0 (0.0%) |
| 75 Years and over | 0 (0.0%) | 3 (30.0%) |
Disability Class: Cognitive Difficulty
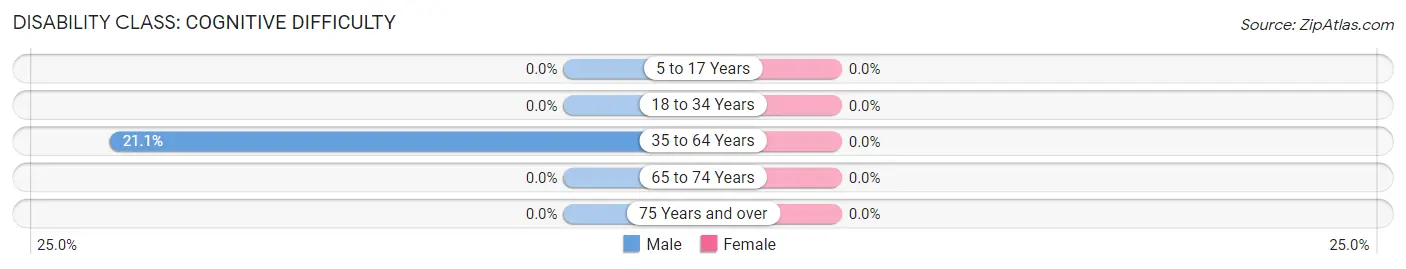
| Age Bracket | Male | Female |
| 5 to 17 Years | 0 (0.0%) | 0 (0.0%) |
| 18 to 34 Years | 0 (0.0%) | 0 (0.0%) |
| 35 to 64 Years | 4 (21.0%) | 0 (0.0%) |
| 65 to 74 Years | 0 (0.0%) | 0 (0.0%) |
| 75 Years and over | 0 (0.0%) | 0 (0.0%) |
Disability Class: Ambulatory Difficulty
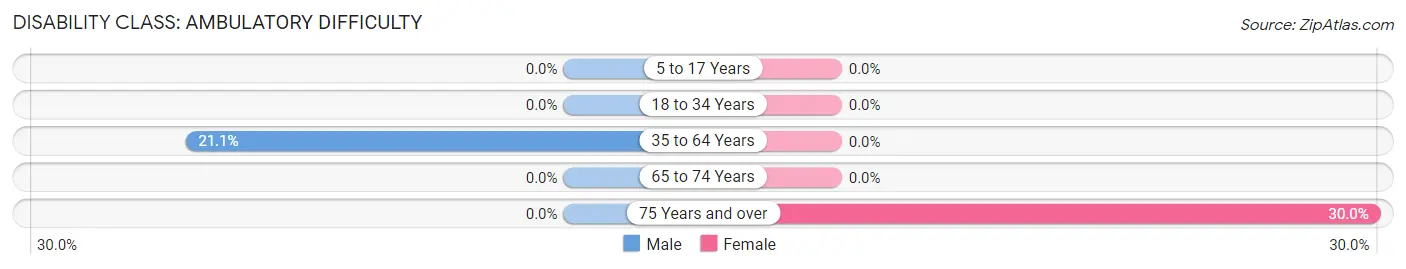
| Age Bracket | Male | Female |
| 5 to 17 Years | 0 (0.0%) | 0 (0.0%) |
| 18 to 34 Years | 0 (0.0%) | 0 (0.0%) |
| 35 to 64 Years | 4 (21.0%) | 0 (0.0%) |
| 65 to 74 Years | 0 (0.0%) | 0 (0.0%) |
| 75 Years and over | 0 (0.0%) | 3 (30.0%) |
Disability Class: Self-Care Difficulty
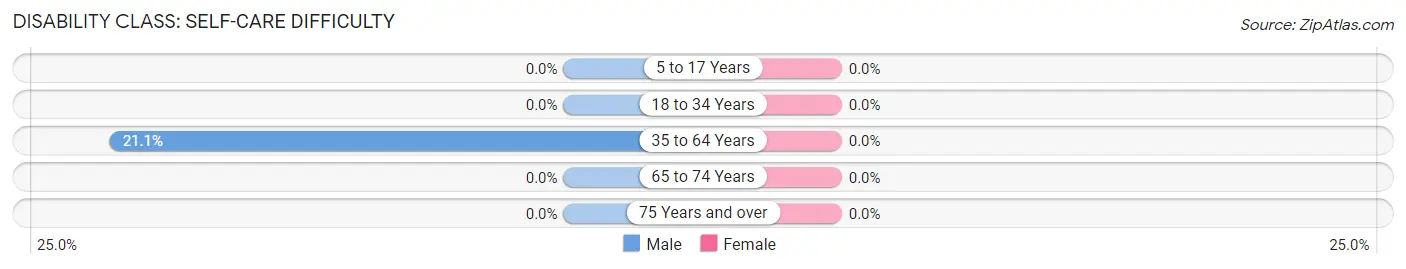
| Age Bracket | Male | Female |
| 5 to 17 Years | 0 (0.0%) | 0 (0.0%) |
| 18 to 34 Years | 0 (0.0%) | 0 (0.0%) |
| 35 to 64 Years | 4 (21.0%) | 0 (0.0%) |
| 65 to 74 Years | 0 (0.0%) | 0 (0.0%) |
| 75 Years and over | 0 (0.0%) | 0 (0.0%) |
Technology Access in Little Bitterroot Lake
Computing Device Access in Little Bitterroot Lake
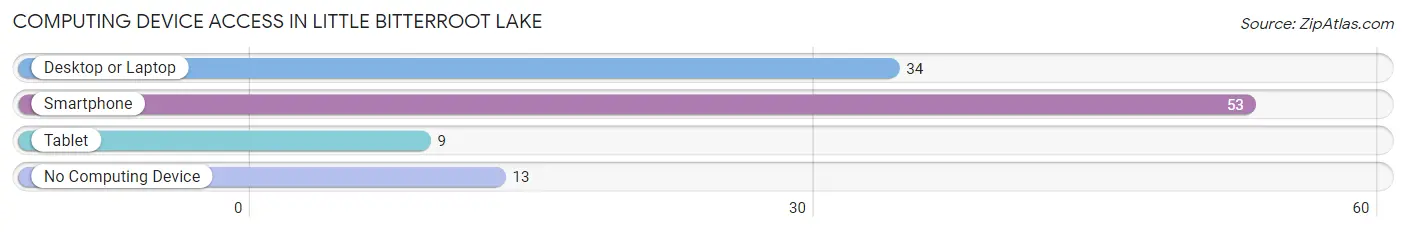
| Device Type | # Households | % Households |
| Desktop or Laptop | 34 | 51.5% |
| Smartphone | 53 | 80.3% |
| Tablet | 9 | 13.6% |
| No Computing Device | 13 | 19.7% |
| Total | 66 | 100.0% |
Internet Access in Little Bitterroot Lake
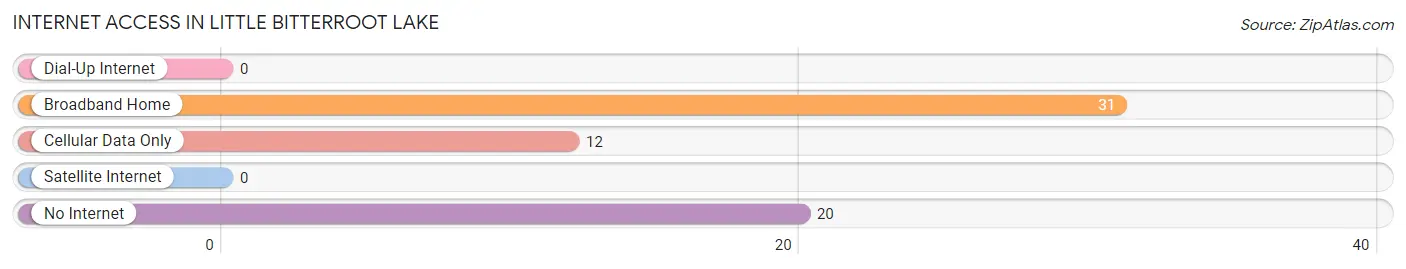
| Internet Type | # Households | % Households |
| Dial-Up Internet | 0 | 0.0% |
| Broadband Home | 31 | 47.0% |
| Cellular Data Only | 12 | 18.2% |
| Satellite Internet | 0 | 0.0% |
| No Internet | 20 | 30.3% |
| Total | 66 | 100.0% |
Little Bitterroot Lake Summary
Little Bitterroot Lake is a small lake located in the Flathead Valley of Montana. It is situated in the foothills of the Rocky Mountains, and is surrounded by the Flathead National Forest. The lake is a popular destination for fishing, camping, and other outdoor activities.
History
Little Bitterroot Lake has been a part of the Flathead Valley for centuries. The lake was originally known as “Ksiskuk” by the local Salish-Kootenai people, which translates to “Little Bitterroot”. The lake was first documented by the Lewis and Clark Expedition in 1805, and was later named by the U.S. Geological Survey in 1883.
The lake has been a popular destination for recreation since the early 1900s. In the 1920s, the lake was developed as a resort area, with cabins, lodges, and other amenities. The lake was also a popular spot for fishing, and was stocked with trout in the 1930s.
Geography
Little Bitterroot Lake is located in the Flathead Valley of Montana, in the foothills of the Rocky Mountains. The lake is approximately 4 miles long and 1 mile wide, and has a maximum depth of about 40 feet. The lake is fed by several small streams, and is drained by the Little Bitterroot River.
The lake is surrounded by the Flathead National Forest, and is home to a variety of wildlife, including deer, elk, moose, and bear. The lake is also a popular destination for bird watching, with a variety of waterfowl and other species.
Economy
Little Bitterroot Lake is a popular destination for recreation and tourism. The lake is home to several resorts and lodges, as well as campgrounds and other amenities. The lake is also a popular destination for fishing, and is stocked with trout each year.
The lake is also a popular destination for boating and other water activities. The lake is home to several marinas, as well as boat rentals and other services.
Demographics
Little Bitterroot Lake is located in Lake County, Montana. As of the 2010 census, the population of Lake County was 28,845. The median household income in the county was $41,945, and the median age was 44.7 years.
The population of the lake area is largely white, with a small percentage of Native American and Hispanic residents. The majority of the population is employed in the service and retail industries.
Conclusion
Little Bitterroot Lake is a small lake located in the Flathead Valley of Montana. The lake has been a part of the area for centuries, and is a popular destination for fishing, camping, and other outdoor activities. The lake is surrounded by the Flathead National Forest, and is home to a variety of wildlife. The lake is also a popular destination for recreation and tourism, and is home to several resorts and lodges. The population of the lake area is largely white, with a small percentage of Native American and Hispanic residents. The lake is a popular destination for fishing, boating, and other water activities, and is a major contributor to the local economy.
Common Questions
What is the Total Population of Little Bitterroot Lake?
Total Population of Little Bitterroot Lake is 104.
What is the Total Male Population of Little Bitterroot Lake?
Total Male Population of Little Bitterroot Lake is 64.
What is the Total Female Population of Little Bitterroot Lake?
Total Female Population of Little Bitterroot Lake is 40.
What is the Ratio of Males per 100 Females in Little Bitterroot Lake?
There are 160.00 Males per 100 Females in Little Bitterroot Lake.
What is the Ratio of Females per 100 Males in Little Bitterroot Lake?
There are 62.50 Females per 100 Males in Little Bitterroot Lake.
What is the Median Population Age in Little Bitterroot Lake?
Median Population Age in Little Bitterroot Lake is 68.7 Years.
What is the Average Family Size in Little Bitterroot Lake
Average Family Size in Little Bitterroot Lake is 2.1 People.
What is the Average Household Size in Little Bitterroot Lake
Average Household Size in Little Bitterroot Lake is 1.6 People.
What is Per Capita Income in Little Bitterroot Lake?
Per Capita income in Little Bitterroot Lake is $39,038.
What is the Median Family Income in Little Bitterroot Lake?
Median Family Income in Little Bitterroot Lake is $103,125.
What is Inequality or Gini Index in Little Bitterroot Lake?
Inequality or Gini Index in Little Bitterroot Lake is 0.35.
How Large is the Labor Force in Little Bitterroot Lake?
There are 36 People in the Labor Forcein in Little Bitterroot Lake.
What is the Percentage of People in the Labor Force in Little Bitterroot Lake?
34.6% of People are in the Labor Force in Little Bitterroot Lake.
What is the Unemployment Rate in Little Bitterroot Lake?
Unemployment Rate in Little Bitterroot Lake is 27.8%.