Finley Point, MT
Finley Point Map
Finley Point Overview
460
TOTAL POPULATION
248
MALE POPULATION
212
FEMALE POPULATION
116.98
MALES / 100 FEMALES
85.48
FEMALES / 100 MALES
60.3
MEDIAN AGE
2.4
AVG FAMILY SIZE
1.8
AVG HOUSEHOLD SIZE
$38,829
PER CAPITA INCOME
$33,194
AVG FAMILY INCOME
$34,861
AVG HOUSEHOLD INCOME
48.2%
WAGE / INCOME GAP [ % ]
51.8¢/ $1
WAGE / INCOME GAP [ $ ]
0.51
INEQUALITY / GINI INDEX
167
LABOR FORCE [ PEOPLE ]
38.1%
PERCENT IN LABOR FORCE
8.4%
UNEMPLOYMENT RATE
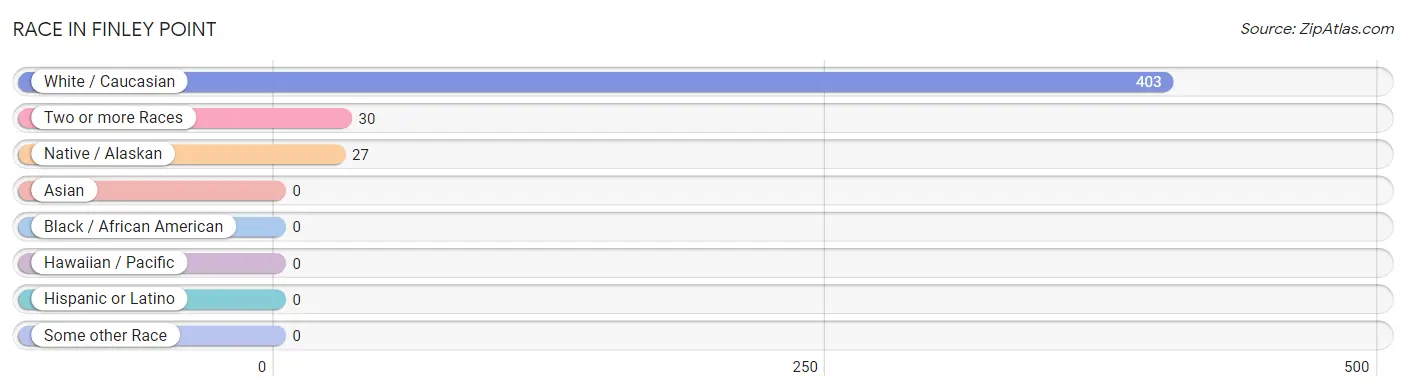
Race in Finley Point
The most populous races in Finley Point are White / Caucasian (403 | 87.6%), Two or more Races (30 | 6.5%), and Native / Alaskan (27 | 5.9%).
| Race | # Population | % Population |
| Asian | 0 | 0.0% |
| Black / African American | 0 | 0.0% |
| Hawaiian / Pacific | 0 | 0.0% |
| Hispanic or Latino | 0 | 0.0% |
| Native / Alaskan | 27 | 5.9% |
| White / Caucasian | 403 | 87.6% |
| Two or more Races | 30 | 6.5% |
| Some other Race | 0 | 0.0% |
| Total | 460 | 100.0% |
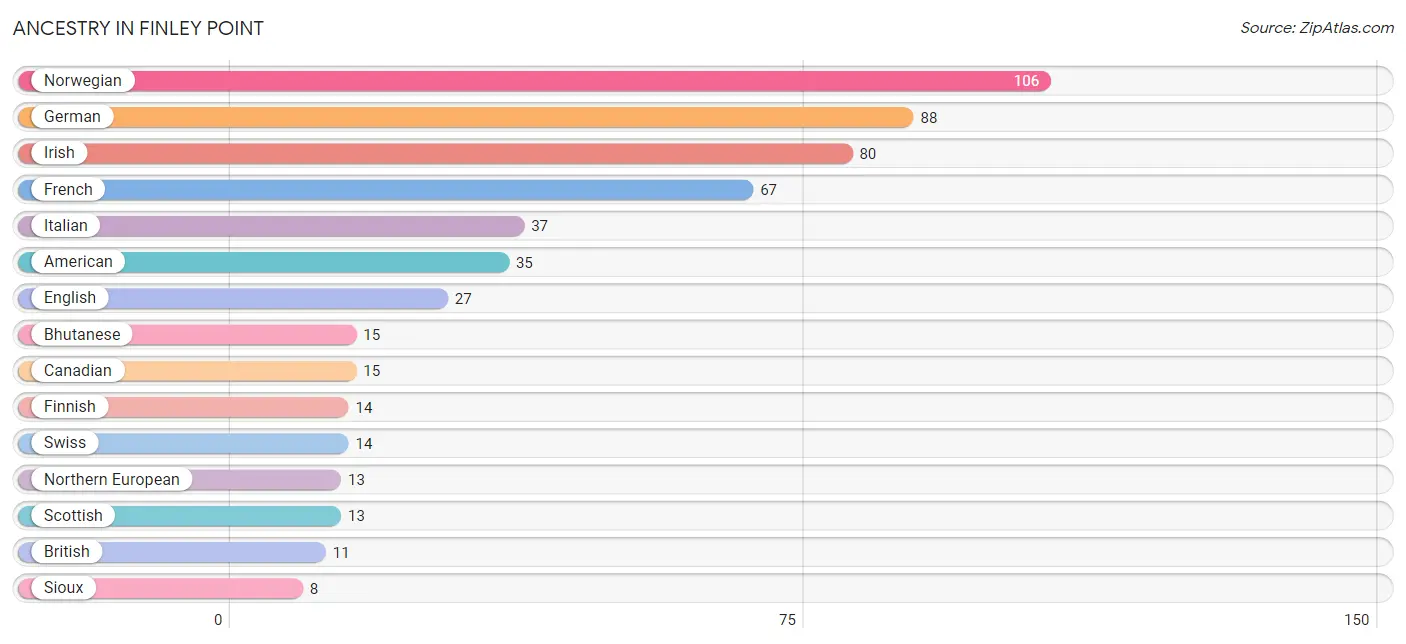
Ancestry in Finley Point
The most populous ancestries reported in Finley Point are Norwegian (106 | 23.0%), German (88 | 19.1%), Irish (80 | 17.4%), French (67 | 14.6%), and Italian (37 | 8.0%), together accounting for 82.2% of all Finley Point residents.
| Ancestry | # Population | % Population |
| American | 35 | 7.6% |
| Bhutanese | 15 | 3.3% |
| British | 11 | 2.4% |
| Canadian | 15 | 3.3% |
| Danish | 5 | 1.1% |
| English | 27 | 5.9% |
| Finnish | 14 | 3.0% |
| French | 67 | 14.6% |
| German | 88 | 19.1% |
| Irish | 80 | 17.4% |
| Italian | 37 | 8.0% |
| Northern European | 13 | 2.8% |
| Norwegian | 106 | 23.0% |
| Scottish | 13 | 2.8% |
| Sioux | 8 | 1.7% |
| Swedish | 5 | 1.1% |
| Swiss | 14 | 3.0% | View All 17 Rows |
Immigrants in Finley Point
The most numerous immigrant groups reported in Finley Point came from , and Canada (15 | 3.3%), together accounting for 3.3% of all Finley Point residents.

| Immigration Origin | # Population | % Population |
| Canada | 15 | 3.3% | View All 1 Rows |
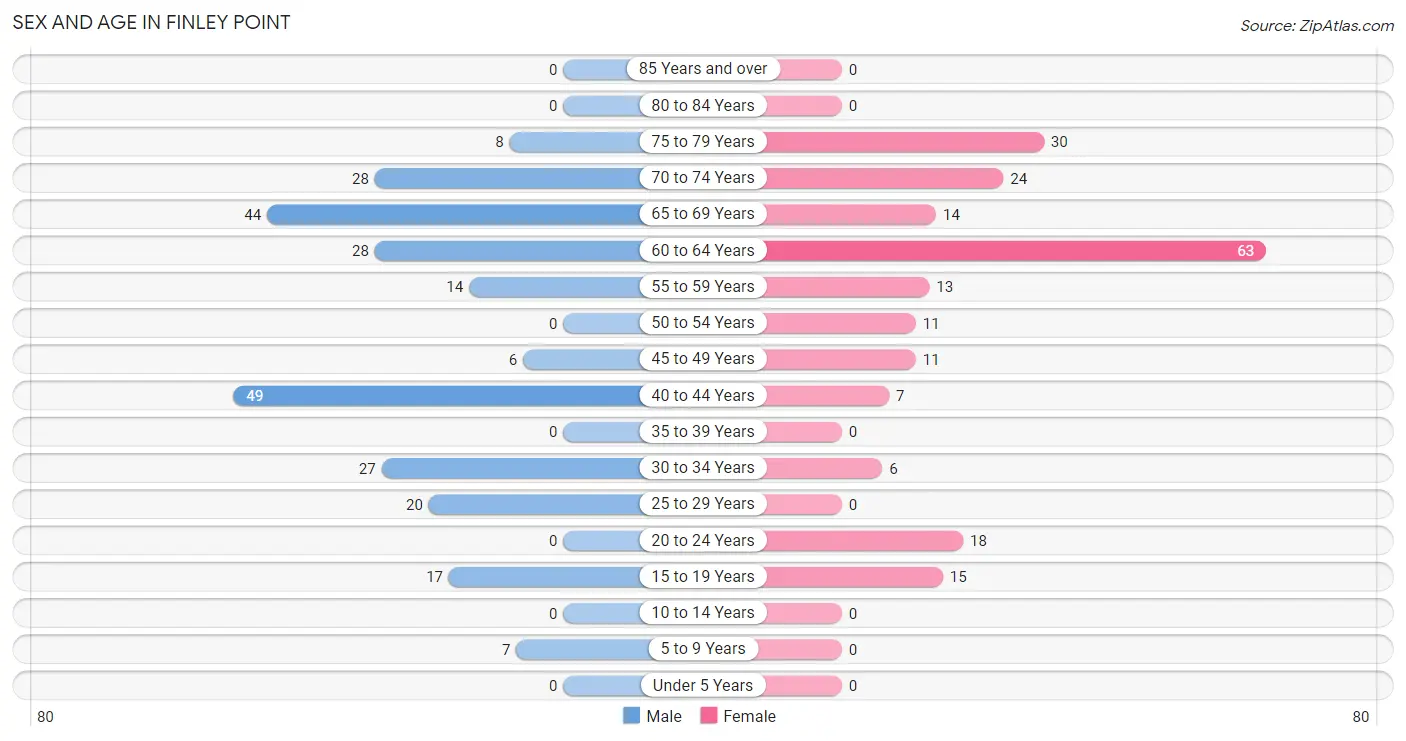
Sex and Age in Finley Point
Sex and Age in Finley Point
The most populous age groups in Finley Point are 40 to 44 Years (49 | 19.8%) for men and 60 to 64 Years (63 | 29.7%) for women.
| Age Bracket | Male | Female |
| Under 5 Years | 0 (0.0%) | 0 (0.0%) |
| 5 to 9 Years | 7 (2.8%) | 0 (0.0%) |
| 10 to 14 Years | 0 (0.0%) | 0 (0.0%) |
| 15 to 19 Years | 17 (6.9%) | 15 (7.1%) |
| 20 to 24 Years | 0 (0.0%) | 18 (8.5%) |
| 25 to 29 Years | 20 (8.1%) | 0 (0.0%) |
| 30 to 34 Years | 27 (10.9%) | 6 (2.8%) |
| 35 to 39 Years | 0 (0.0%) | 0 (0.0%) |
| 40 to 44 Years | 49 (19.8%) | 7 (3.3%) |
| 45 to 49 Years | 6 (2.4%) | 11 (5.2%) |
| 50 to 54 Years | 0 (0.0%) | 11 (5.2%) |
| 55 to 59 Years | 14 (5.7%) | 13 (6.1%) |
| 60 to 64 Years | 28 (11.3%) | 63 (29.7%) |
| 65 to 69 Years | 44 (17.7%) | 14 (6.6%) |
| 70 to 74 Years | 28 (11.3%) | 24 (11.3%) |
| 75 to 79 Years | 8 (3.2%) | 30 (14.1%) |
| 80 to 84 Years | 0 (0.0%) | 0 (0.0%) |
| 85 Years and over | 0 (0.0%) | 0 (0.0%) |
| Total | 248 (100.0%) | 212 (100.0%) |
Families and Households in Finley Point
Median Family Size in Finley Point
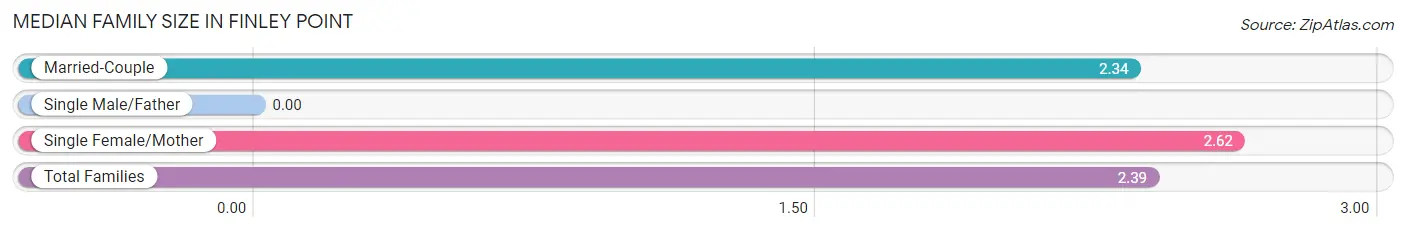
| Family Type | # Families | Family Size |
| Married-Couple | 114 (81.4%) | 2.34 |
| Single Male/Father | 0 (0.0%) | - |
| Single Female/Mother | 26 (18.6%) | 2.62 |
| Total Families | 140 (100.0%) | 2.39 |
Median Household Size in Finley Point
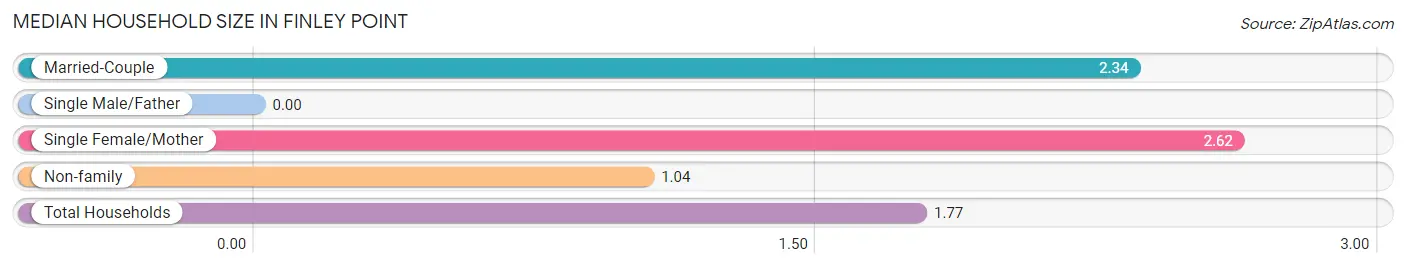
| Household Type | # Households | Household Size |
| Married-Couple | 114 (43.9%) | 2.34 |
| Single Male/Father | 0 (0.0%) | - |
| Single Female/Mother | 26 (10.0%) | 2.62 |
| Non-family | 120 (46.2%) | 1.04 |
| Total Households | 260 (100.0%) | 1.77 |
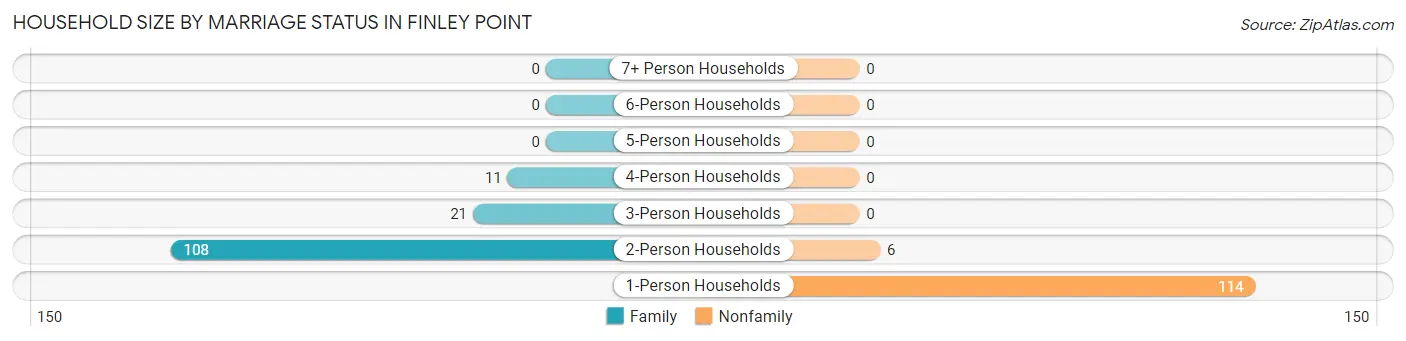
Household Size by Marriage Status in Finley Point
Out of a total of 260 households in Finley Point, 140 (53.8%) are family households, while 120 (46.2%) are nonfamily households. The most numerous type of family households are 2-person households, comprising 108, and the most common type of nonfamily households are 1-person households, comprising 114.
| Household Size | Family Households | Nonfamily Households |
| 1-Person Households | - | 114 (43.9%) |
| 2-Person Households | 108 (41.5%) | 6 (2.3%) |
| 3-Person Households | 21 (8.1%) | 0 (0.0%) |
| 4-Person Households | 11 (4.2%) | 0 (0.0%) |
| 5-Person Households | 0 (0.0%) | 0 (0.0%) |
| 6-Person Households | 0 (0.0%) | 0 (0.0%) |
| 7+ Person Households | 0 (0.0%) | 0 (0.0%) |
| Total | 140 (53.8%) | 120 (46.2%) |
Female Fertility in Finley Point
Fertility by Age in Finley Point
| Age Bracket | Women with Births | Births / 1,000 Women |
| 15 to 19 years | 0 (0.0%) | 0.0 |
| 20 to 34 years | 0 (0.0%) | 0.0 |
| 35 to 50 years | 0 (0.0%) | 0.0 |
| Total | 0 (0.0%) | 0.0 |
Fertility by Age by Marriage Status in Finley Point
| Age Bracket | Married | Unmarried |
| 15 to 19 years | 0 (0.0%) | 0 (0.0%) |
| 20 to 34 years | 0 (0.0%) | 0 (0.0%) |
| 35 to 50 years | 0 (0.0%) | 0 (0.0%) |
| Total | 0 (0.0%) | 0 (0.0%) |
Fertility by Education in Finley Point
| Educational Attainment | Women with Births | Births / 1,000 Women |
| Less than High School | 0 (0.0%) | 0.0 |
| High School Diploma | 0 (0.0%) | 0.0 |
| College or Associate's Degree | 0 (0.0%) | 0.0 |
| Bachelor's Degree | 0 (0.0%) | 0.0 |
| Graduate Degree | 0 (0.0%) | 0.0 |
| Total | 0 (0.0%) | 0.0 |
Fertility by Education by Marriage Status in Finley Point
| Educational Attainment | Married | Unmarried |
| Less than High School | 0 (0.0%) | 0 (0.0%) |
| High School Diploma | 0 (0.0%) | 0 (0.0%) |
| College or Associate's Degree | 0 (0.0%) | 0 (0.0%) |
| Bachelor's Degree | 0 (0.0%) | 0 (0.0%) |
| Graduate Degree | 0 (0.0%) | 0 (0.0%) |
| Total | 0 (0.0%) | 0 (0.0%) |
Income in Finley Point
Income Overview in Finley Point
Per Capita Income in Finley Point is $38,829, while median incomes of families and households are $33,194 and $34,861 respectively.
| Characteristic | Number | Measure |
| Per Capita Income | 460 | $38,829 |
| Median Family Income | 140 | $33,194 |
| Mean Family Income | 140 | $64,451 |
| Median Household Income | 260 | $34,861 |
| Mean Household Income | 260 | $67,263 |
| Income Deficit | 140 | $0 |
| Wage / Income Gap (%) | 460 | 48.17% |
| Wage / Income Gap ($) | 460 | 51.83¢ per $1 |
| Gini / Inequality Index | 460 | 0.51 |
Earnings by Sex in Finley Point
Average Earnings in Finley Point are $31,083, $30,333 for men and $58,523 for women, a difference of 48.2%.
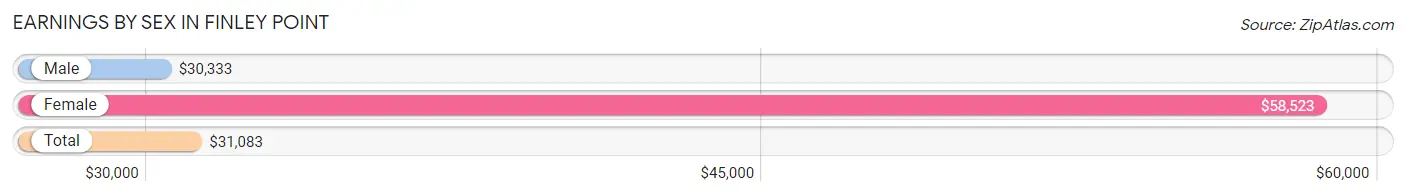
| Sex | Number | Average Earnings |
| Male | 148 (75.9%) | $30,333 |
| Female | 47 (24.1%) | $58,523 |
| Total | 195 (100.0%) | $31,083 |
Earnings by Sex by Income Bracket in Finley Point
The most common earnings brackets in Finley Point are $100,000+ for men (34 | 23.0%) and $55,000 to $64,999 for women (17 | 36.2%).
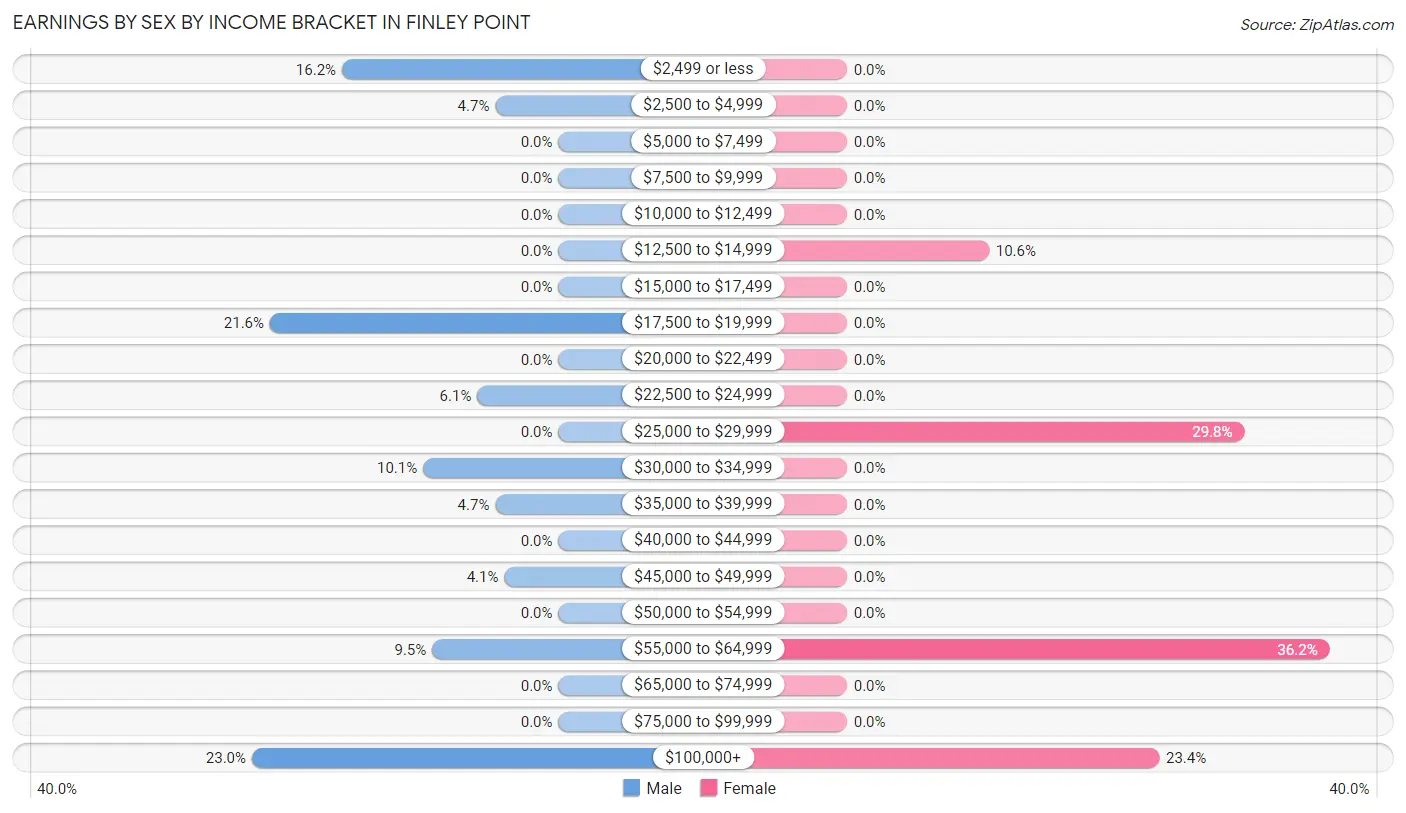
| Income | Male | Female |
| $2,499 or less | 24 (16.2%) | 0 (0.0%) |
| $2,500 to $4,999 | 7 (4.7%) | 0 (0.0%) |
| $5,000 to $7,499 | 0 (0.0%) | 0 (0.0%) |
| $7,500 to $9,999 | 0 (0.0%) | 0 (0.0%) |
| $10,000 to $12,499 | 0 (0.0%) | 0 (0.0%) |
| $12,500 to $14,999 | 0 (0.0%) | 5 (10.6%) |
| $15,000 to $17,499 | 0 (0.0%) | 0 (0.0%) |
| $17,500 to $19,999 | 32 (21.6%) | 0 (0.0%) |
| $20,000 to $22,499 | 0 (0.0%) | 0 (0.0%) |
| $22,500 to $24,999 | 9 (6.1%) | 0 (0.0%) |
| $25,000 to $29,999 | 0 (0.0%) | 14 (29.8%) |
| $30,000 to $34,999 | 15 (10.1%) | 0 (0.0%) |
| $35,000 to $39,999 | 7 (4.7%) | 0 (0.0%) |
| $40,000 to $44,999 | 0 (0.0%) | 0 (0.0%) |
| $45,000 to $49,999 | 6 (4.1%) | 0 (0.0%) |
| $50,000 to $54,999 | 0 (0.0%) | 0 (0.0%) |
| $55,000 to $64,999 | 14 (9.5%) | 17 (36.2%) |
| $65,000 to $74,999 | 0 (0.0%) | 0 (0.0%) |
| $75,000 to $99,999 | 0 (0.0%) | 0 (0.0%) |
| $100,000+ | 34 (23.0%) | 11 (23.4%) |
| Total | 148 (100.0%) | 47 (100.0%) |
Earnings by Sex by Educational Attainment in Finley Point
| Educational Attainment | Male Income | Female Income |
| Less than High School | - | - |
| High School Diploma | - | - |
| College or Associate's Degree | - | - |
| Bachelor's Degree | - | - |
| Graduate Degree | - | - |
| Total | - | - |
Family Income in Finley Point
Family Income Brackets in Finley Point
According to the Finley Point family income data, there are 64 families falling into the $25,000 to $34,999 income range, which is the most common income bracket and makes up 45.7% of all families.
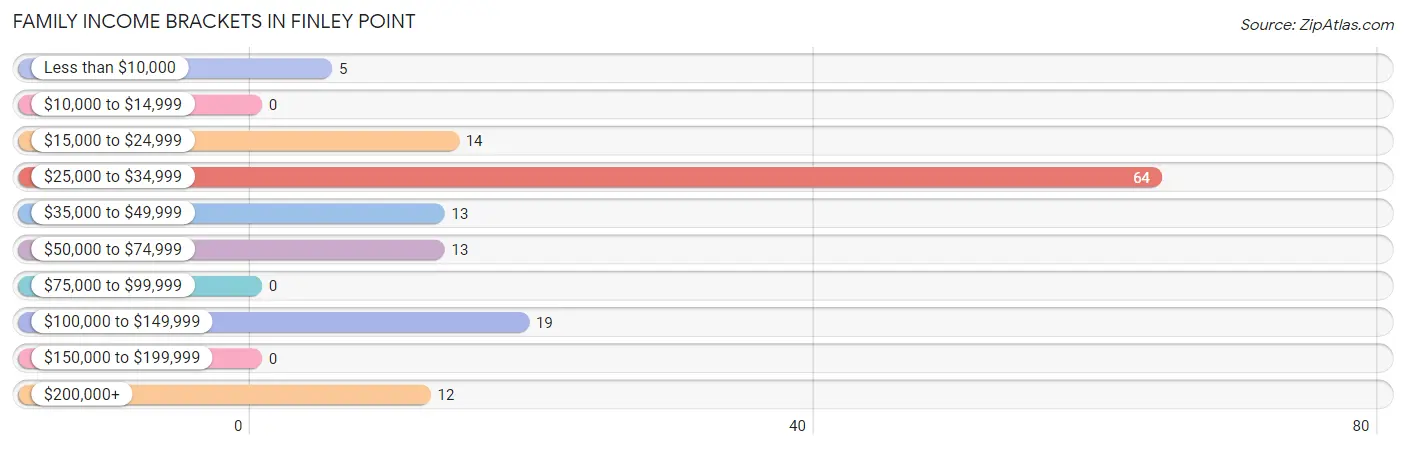
| Income Bracket | # Families | % Families |
| Less than $10,000 | 5 | 3.6% |
| $10,000 to $14,999 | 0 | 0.0% |
| $15,000 to $24,999 | 14 | 10.0% |
| $25,000 to $34,999 | 64 | 45.7% |
| $35,000 to $49,999 | 13 | 9.3% |
| $50,000 to $74,999 | 13 | 9.3% |
| $75,000 to $99,999 | 0 | 0.0% |
| $100,000 to $149,999 | 19 | 13.6% |
| $150,000 to $199,999 | 0 | 0.0% |
| $200,000+ | 12 | 8.6% |
Family Income by Famaliy Size in Finley Point
2-person families (108 | 77.1%) account for the highest median family income in Finley Point with $32,917 per family, while 2-person families (108 | 77.1%) have the highest median income of $16,458 per family member.
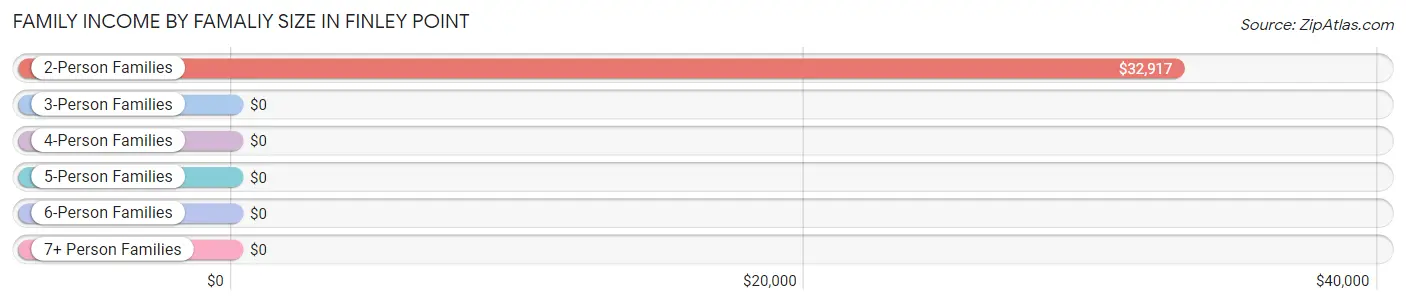
| Income Bracket | # Families | Median Income |
| 2-Person Families | 108 (77.1%) | $32,917 |
| 3-Person Families | 21 (15.0%) | $0 |
| 4-Person Families | 11 (7.9%) | $0 |
| 5-Person Families | 0 (0.0%) | $0 |
| 6-Person Families | 0 (0.0%) | $0 |
| 7+ Person Families | 0 (0.0%) | $0 |
| Total | 140 (100.0%) | $33,194 |
Family Income by Number of Earners in Finley Point
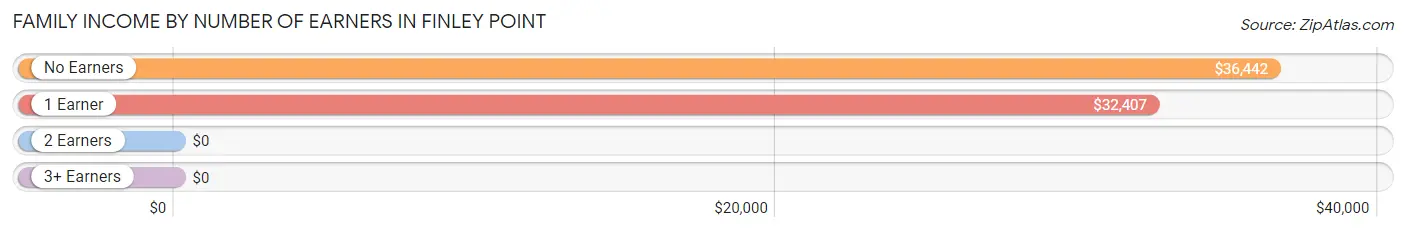
| Number of Earners | # Families | Median Income |
| No Earners | 63 (45.0%) | $36,442 |
| 1 Earner | 52 (37.1%) | $32,407 |
| 2 Earners | 14 (10.0%) | $0 |
| 3+ Earners | 11 (7.9%) | $0 |
| Total | 140 (100.0%) | $33,194 |
Household Income in Finley Point
Household Income Brackets in Finley Point
With 64 households falling in the category, the $25,000 to $34,999 income range is the most frequent in Finley Point, accounting for 24.6% of all households.
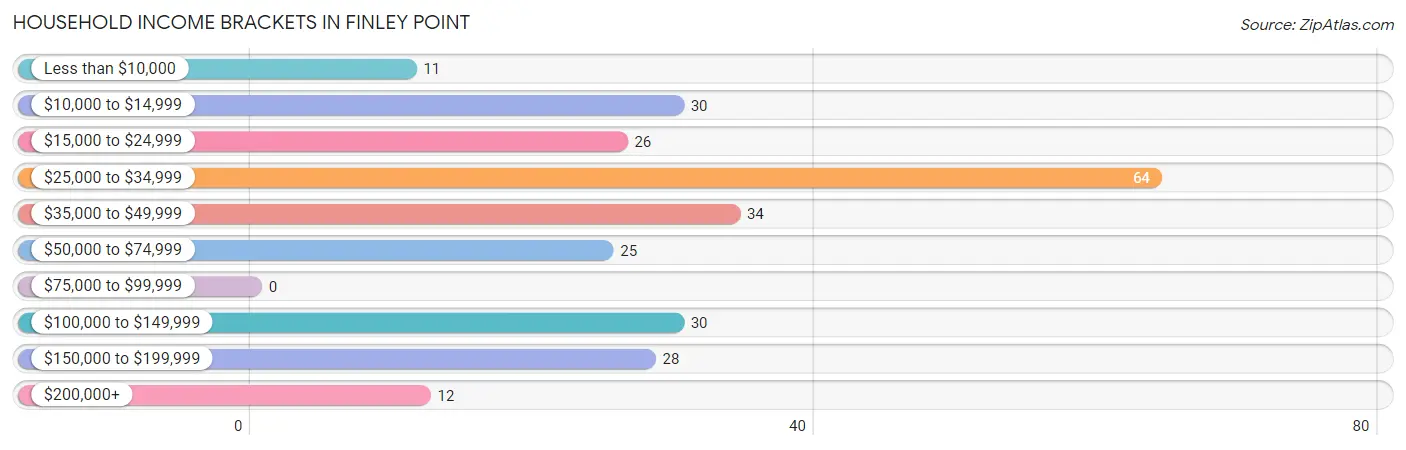
| Income Bracket | # Households | % Households |
| Less than $10,000 | 11 | 4.2% |
| $10,000 to $14,999 | 30 | 11.5% |
| $15,000 to $24,999 | 26 | 10.0% |
| $25,000 to $34,999 | 64 | 24.6% |
| $35,000 to $49,999 | 34 | 13.1% |
| $50,000 to $74,999 | 25 | 9.6% |
| $75,000 to $99,999 | 0 | 0.0% |
| $100,000 to $149,999 | 30 | 11.5% |
| $150,000 to $199,999 | 28 | 10.8% |
| $200,000+ | 12 | 4.6% |
Household Income by Householder Age in Finley Point
The median household income in Finley Point is $34,861, with the highest median household income of $181,027 found in the 25 to 44 years age bracket for the primary householder. A total of 47 households (18.1%) fall into this category. Meanwhile, the 15 to 24 years age bracket for the primary householder has the lowest median household income of $0, with 18 households (6.9%) in this group.
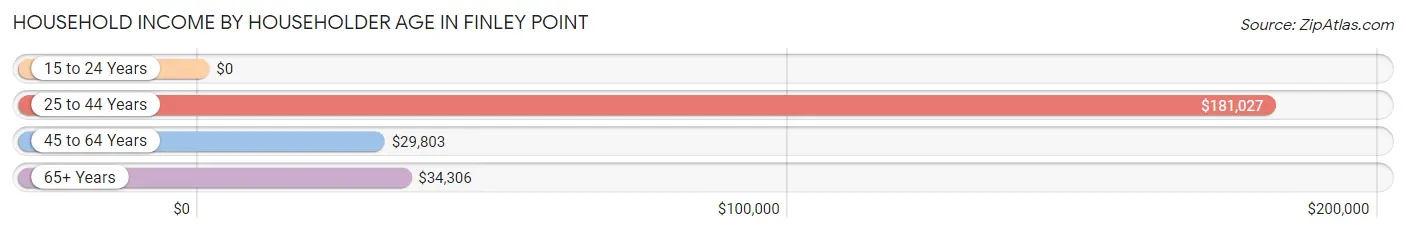
| Income Bracket | # Households | Median Income |
| 15 to 24 Years | 18 (6.9%) | $0 |
| 25 to 44 Years | 47 (18.1%) | $181,027 |
| 45 to 64 Years | 91 (35.0%) | $29,803 |
| 65+ Years | 104 (40.0%) | $34,306 |
| Total | 260 (100.0%) | $34,861 |
Poverty in Finley Point
Income Below Poverty by Sex and Age in Finley Point
With 4.4% poverty level for males and 19.3% for females among the residents of Finley Point, 65 to 74 year old males and 65 to 74 year old females are the most vulnerable to poverty, with 11 males (15.3%) and 16 females (42.1%) in their respective age groups living below the poverty level.
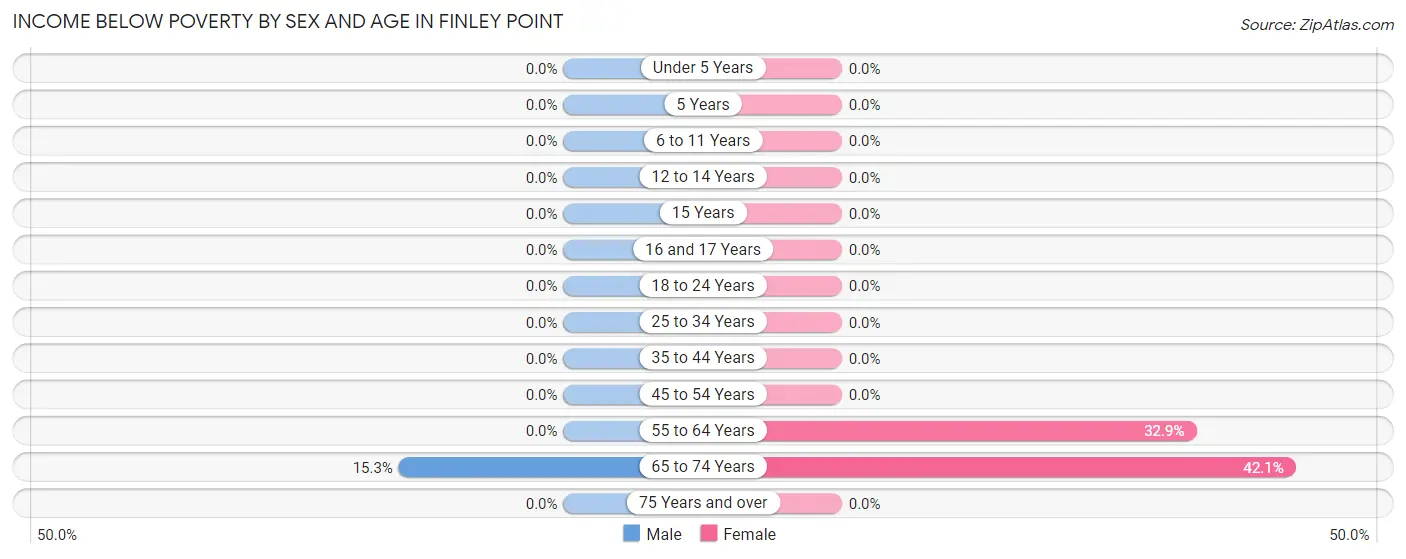
| Age Bracket | Male | Female |
| Under 5 Years | 0 (0.0%) | 0 (0.0%) |
| 5 Years | 0 (0.0%) | 0 (0.0%) |
| 6 to 11 Years | 0 (0.0%) | 0 (0.0%) |
| 12 to 14 Years | 0 (0.0%) | 0 (0.0%) |
| 15 Years | 0 (0.0%) | 0 (0.0%) |
| 16 and 17 Years | 0 (0.0%) | 0 (0.0%) |
| 18 to 24 Years | 0 (0.0%) | 0 (0.0%) |
| 25 to 34 Years | 0 (0.0%) | 0 (0.0%) |
| 35 to 44 Years | 0 (0.0%) | 0 (0.0%) |
| 45 to 54 Years | 0 (0.0%) | 0 (0.0%) |
| 55 to 64 Years | 0 (0.0%) | 25 (32.9%) |
| 65 to 74 Years | 11 (15.3%) | 16 (42.1%) |
| 75 Years and over | 0 (0.0%) | 0 (0.0%) |
| Total | 11 (4.4%) | 41 (19.3%) |
Income Above Poverty by Sex and Age in Finley Point
According to the poverty statistics in Finley Point, males aged 6 to 11 years and females aged 15 years are the age groups that are most secure financially, with 100.0% of males and 100.0% of females in these age groups living above the poverty line.
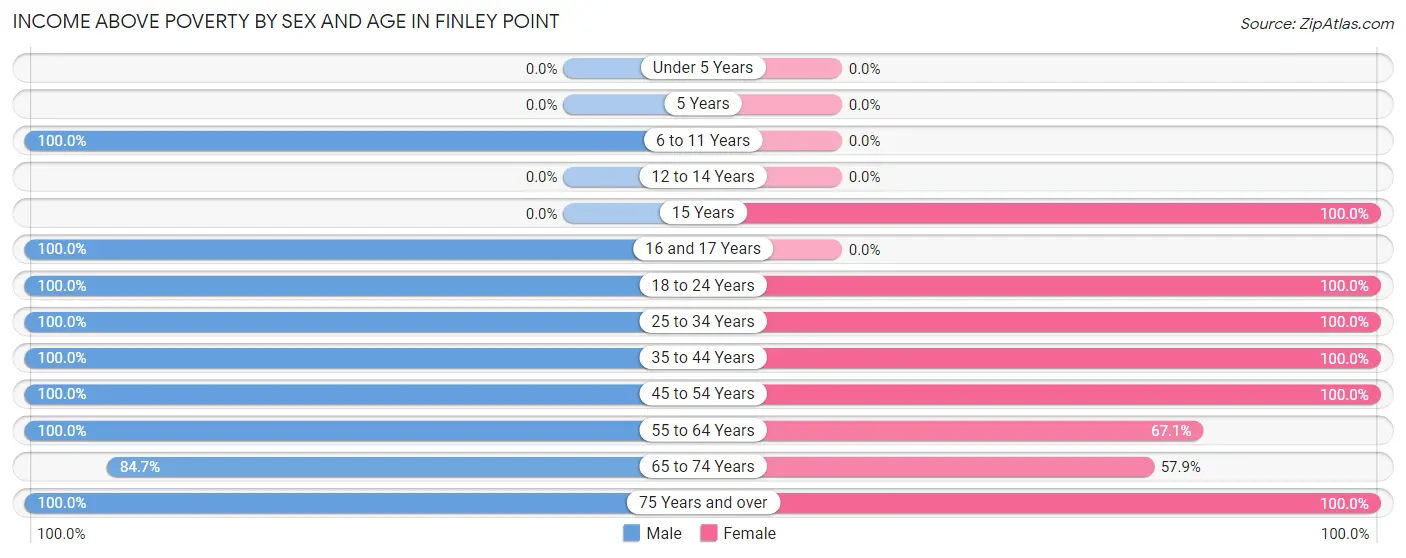
| Age Bracket | Male | Female |
| Under 5 Years | 0 (0.0%) | 0 (0.0%) |
| 5 Years | 0 (0.0%) | 0 (0.0%) |
| 6 to 11 Years | 7 (100.0%) | 0 (0.0%) |
| 12 to 14 Years | 0 (0.0%) | 0 (0.0%) |
| 15 Years | 0 (0.0%) | 15 (100.0%) |
| 16 and 17 Years | 10 (100.0%) | 0 (0.0%) |
| 18 to 24 Years | 7 (100.0%) | 18 (100.0%) |
| 25 to 34 Years | 47 (100.0%) | 6 (100.0%) |
| 35 to 44 Years | 49 (100.0%) | 7 (100.0%) |
| 45 to 54 Years | 6 (100.0%) | 22 (100.0%) |
| 55 to 64 Years | 42 (100.0%) | 51 (67.1%) |
| 65 to 74 Years | 61 (84.7%) | 22 (57.9%) |
| 75 Years and over | 8 (100.0%) | 30 (100.0%) |
| Total | 237 (95.6%) | 171 (80.7%) |
Income Below Poverty Among Married-Couple Families in Finley Point
The poverty statistics for married-couple families in Finley Point show that 4.4% or 5 of the total 114 families live below the poverty line. Families with no children have the highest poverty rate of 5.2%, comprising of 5 families. On the other hand, families with 1 or 2 children have the lowest poverty rate of 0.0%, which includes 0 families.
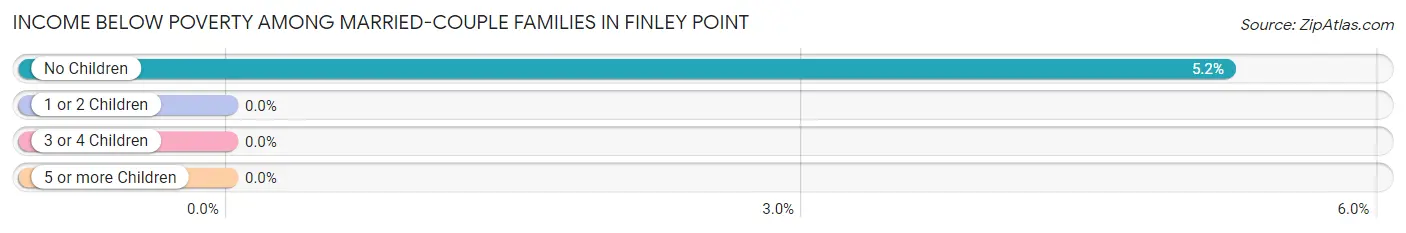
| Children | Above Poverty | Below Poverty |
| No Children | 91 (94.8%) | 5 (5.2%) |
| 1 or 2 Children | 18 (100.0%) | 0 (0.0%) |
| 3 or 4 Children | 0 (0.0%) | 0 (0.0%) |
| 5 or more Children | 0 (0.0%) | 0 (0.0%) |
| Total | 109 (95.6%) | 5 (4.4%) |
Income Below Poverty Among Single-Parent Households in Finley Point
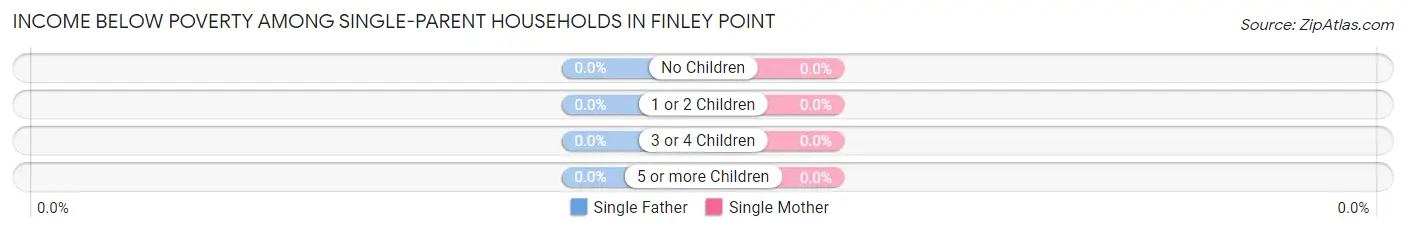
| Children | Single Father | Single Mother |
| No Children | 0 (0.0%) | 0 (0.0%) |
| 1 or 2 Children | 0 (0.0%) | 0 (0.0%) |
| 3 or 4 Children | 0 (0.0%) | 0 (0.0%) |
| 5 or more Children | 0 (0.0%) | 0 (0.0%) |
| Total | 0 (0.0%) | 0 (0.0%) |
Income Below Poverty Among Married-Couple vs Single-Parent Households in Finley Point
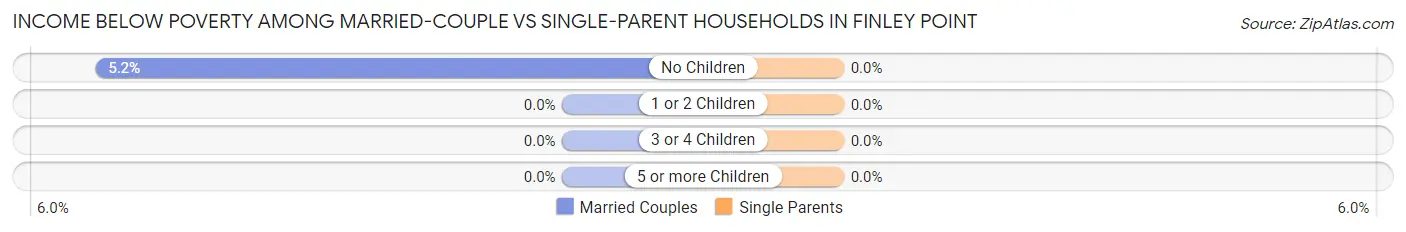
| Children | Married-Couple Families | Single-Parent Households |
| No Children | 5 (5.2%) | 0 (0.0%) |
| 1 or 2 Children | 0 (0.0%) | 0 (0.0%) |
| 3 or 4 Children | 0 (0.0%) | 0 (0.0%) |
| 5 or more Children | 0 (0.0%) | 0 (0.0%) |
| Total | 5 (4.4%) | 0 (0.0%) |
Employment Characteristics in Finley Point
Employment by Class of Employer in Finley Point
Among the 153 employed individuals in Finley Point, self-employed (incorporated) (67 | 43.8%), self-employed (not incorporated) (29 | 19.0%), and not-for-profit organizations (24 | 15.7%) make up the most common classes of employment.
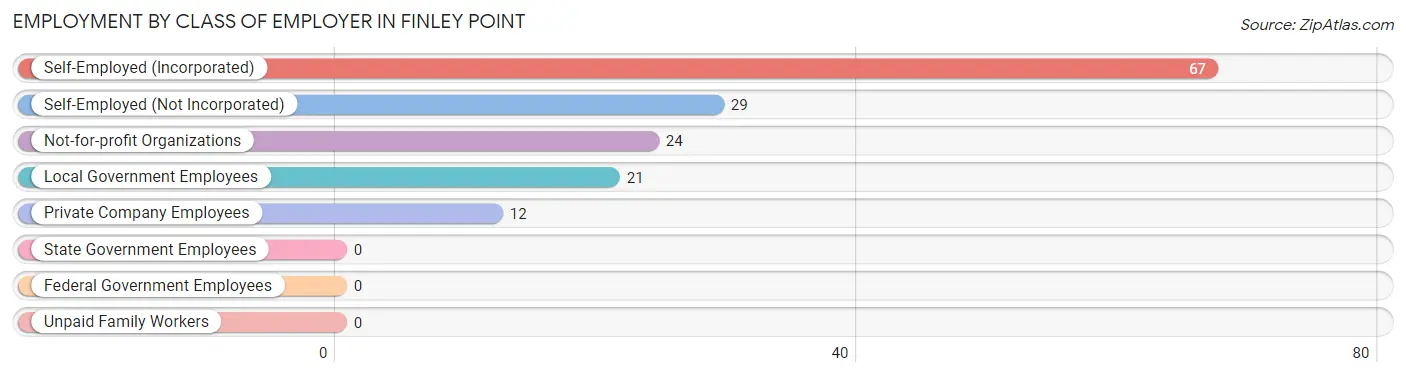
| Employer Class | # Employees | % Employees |
| Private Company Employees | 12 | 7.8% |
| Self-Employed (Incorporated) | 67 | 43.8% |
| Self-Employed (Not Incorporated) | 29 | 19.0% |
| Not-for-profit Organizations | 24 | 15.7% |
| Local Government Employees | 21 | 13.7% |
| State Government Employees | 0 | 0.0% |
| Federal Government Employees | 0 | 0.0% |
| Unpaid Family Workers | 0 | 0.0% |
| Total | 153 | 100.0% |
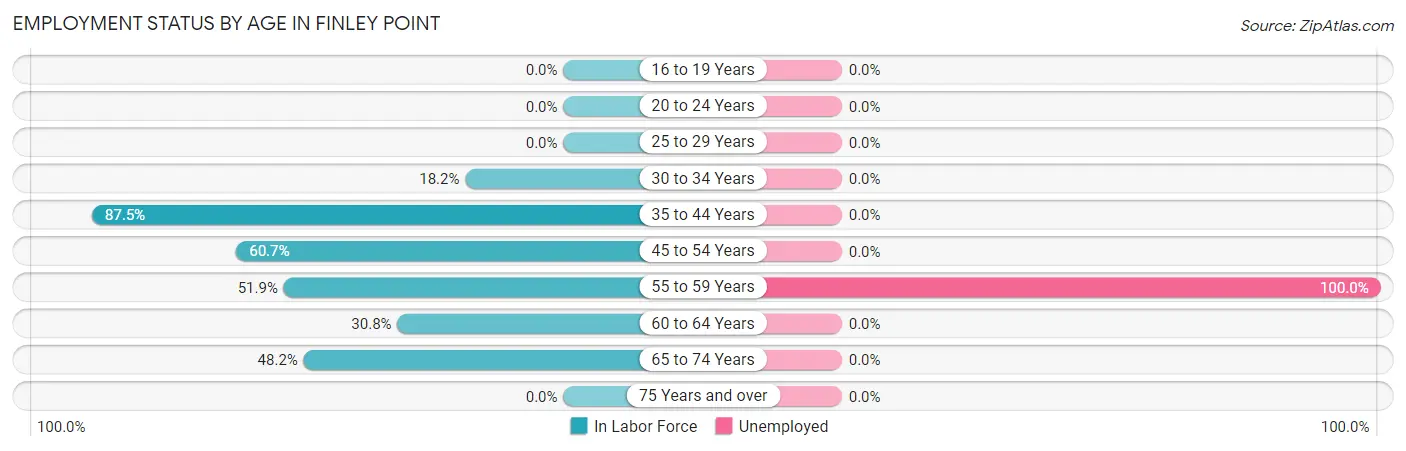
Employment Status by Age in Finley Point
According to the labor force statistics for Finley Point, out of the total population over 16 years of age (438), 38.1% or 167 individuals are in the labor force, with 8.4% or 14 of them unemployed. The age group with the highest labor force participation rate is 35 to 44 years, with 87.5% or 49 individuals in the labor force. Within the labor force, the 55 to 59 years age range has the highest percentage of unemployed individuals, with 100.0% or 14 of them being unemployed.
| Age Bracket | In Labor Force | Unemployed |
| 16 to 19 Years | 0 (0.0%) | 0 (0.0%) |
| 20 to 24 Years | 0 (0.0%) | 0 (0.0%) |
| 25 to 29 Years | 0 (0.0%) | 0 (0.0%) |
| 30 to 34 Years | 6 (18.2%) | 0 (0.0%) |
| 35 to 44 Years | 49 (87.5%) | 0 (0.0%) |
| 45 to 54 Years | 17 (60.7%) | 0 (0.0%) |
| 55 to 59 Years | 14 (51.9%) | 14 (100.0%) |
| 60 to 64 Years | 28 (30.8%) | 0 (0.0%) |
| 65 to 74 Years | 53 (48.2%) | 0 (0.0%) |
| 75 Years and over | 0 (0.0%) | 0 (0.0%) |
| Total | 167 (38.1%) | 14 (8.4%) |
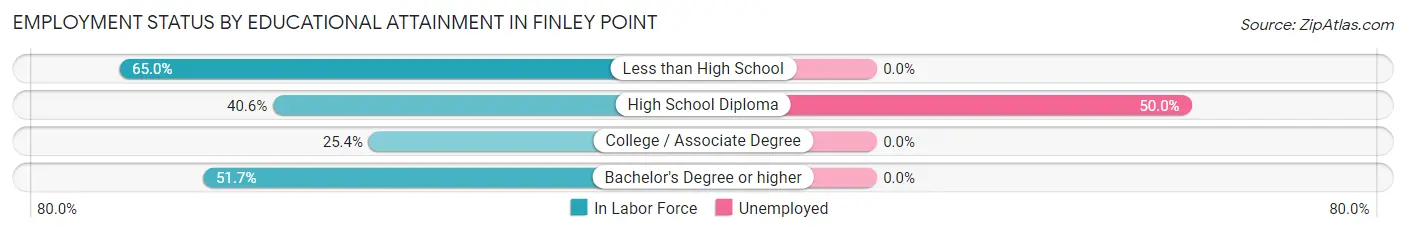
Employment Status by Educational Attainment in Finley Point
According to labor force statistics for Finley Point, 44.7% of individuals (114) out of the total population between 25 and 64 years of age (255) are in the labor force, with 12.3% or 14 of them being unemployed. The group with the highest labor force participation rate are those with the educational attainment of less than high school, with 65.0% or 26 individuals in the labor force. Within the labor force, individuals with high school diploma education have the highest percentage of unemployment, with 50.0% or 14 of them being unemployed.
| Educational Attainment | In Labor Force | Unemployed |
| Less than High School | 26 (65.0%) | 0 (0.0%) |
| High School Diploma | 28 (40.6%) | 34 (50.0%) |
| College / Associate Degree | 15 (25.4%) | 0 (0.0%) |
| Bachelor's Degree or higher | 45 (51.7%) | 0 (0.0%) |
| Total | 114 (44.7%) | 31 (12.3%) |
Employment Occupations by Sex in Finley Point
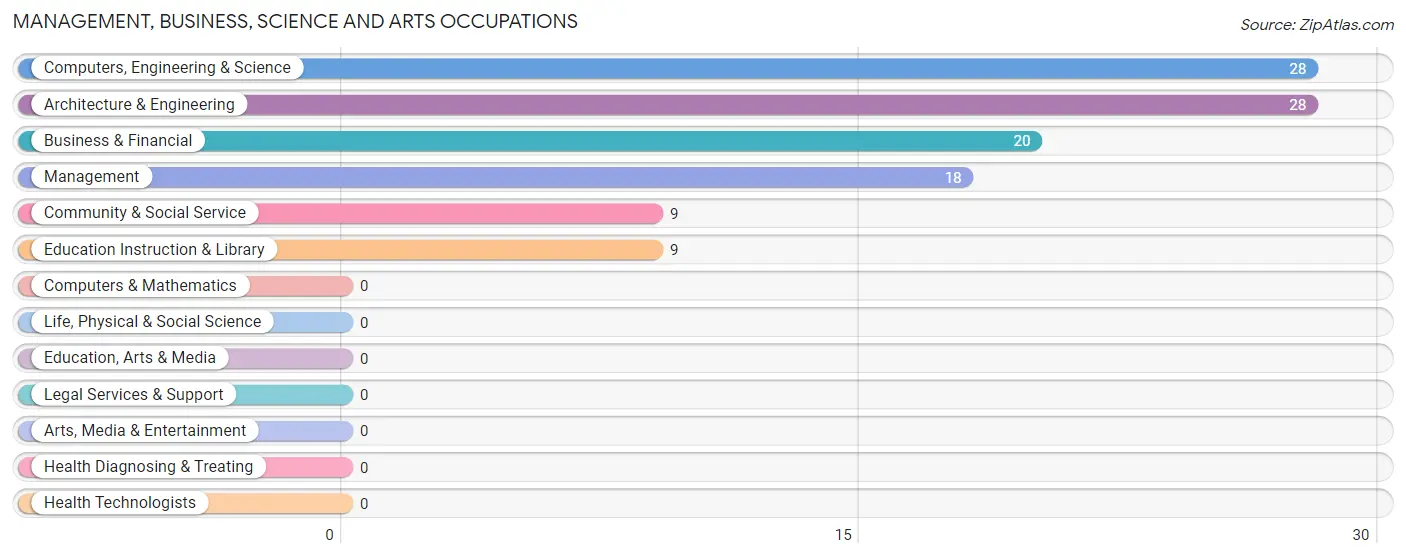
Management, Business, Science and Arts Occupations
The most common Management, Business, Science and Arts occupations in Finley Point are Computers, Engineering & Science (28 | 18.3%), Architecture & Engineering (28 | 18.3%), Business & Financial (20 | 13.1%), Management (18 | 11.8%), and Community & Social Service (9 | 5.9%).
Management, Business, Science and Arts Occupations by Sex
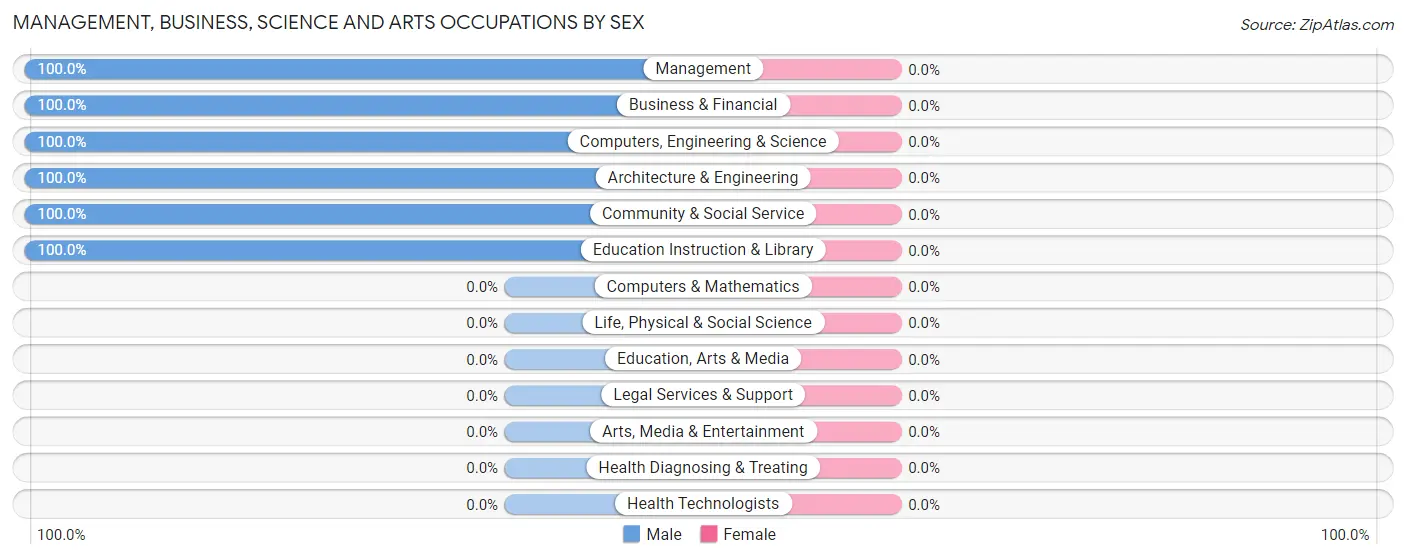
| Occupation | Male | Female |
| Management | 18 (100.0%) | 0 (0.0%) |
| Business & Financial | 20 (100.0%) | 0 (0.0%) |
| Computers, Engineering & Science | 28 (100.0%) | 0 (0.0%) |
| Computers & Mathematics | 0 (0.0%) | 0 (0.0%) |
| Architecture & Engineering | 28 (100.0%) | 0 (0.0%) |
| Life, Physical & Social Science | 0 (0.0%) | 0 (0.0%) |
| Community & Social Service | 9 (100.0%) | 0 (0.0%) |
| Education, Arts & Media | 0 (0.0%) | 0 (0.0%) |
| Legal Services & Support | 0 (0.0%) | 0 (0.0%) |
| Education Instruction & Library | 9 (100.0%) | 0 (0.0%) |
| Arts, Media & Entertainment | 0 (0.0%) | 0 (0.0%) |
| Health Diagnosing & Treating | 0 (0.0%) | 0 (0.0%) |
| Health Technologists | 0 (0.0%) | 0 (0.0%) |
| Total (Category) | 75 (100.0%) | 0 (0.0%) |
| Total (Overall) | 117 (76.5%) | 36 (23.5%) |
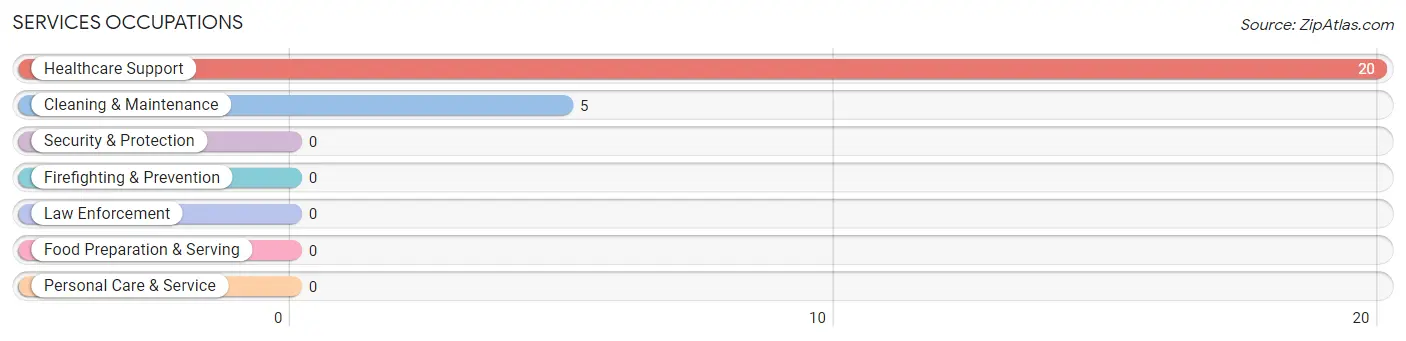
Services Occupations
The most common Services occupations in Finley Point are Healthcare Support (20 | 13.1%), and Cleaning & Maintenance (5 | 3.3%).
Services Occupations by Sex
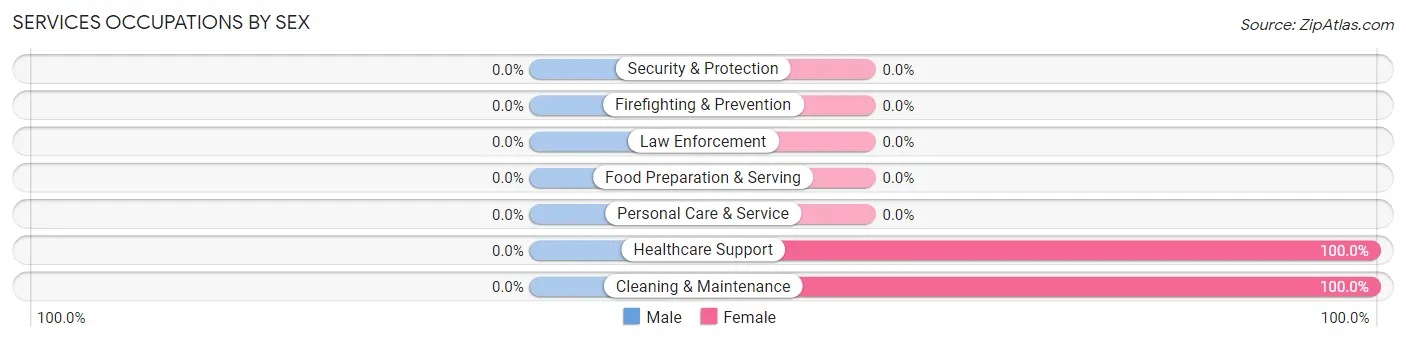
| Occupation | Male | Female |
| Healthcare Support | 0 (0.0%) | 20 (100.0%) |
| Security & Protection | 0 (0.0%) | 0 (0.0%) |
| Firefighting & Prevention | 0 (0.0%) | 0 (0.0%) |
| Law Enforcement | 0 (0.0%) | 0 (0.0%) |
| Food Preparation & Serving | 0 (0.0%) | 0 (0.0%) |
| Cleaning & Maintenance | 0 (0.0%) | 5 (100.0%) |
| Personal Care & Service | 0 (0.0%) | 0 (0.0%) |
| Total (Category) | 0 (0.0%) | 25 (100.0%) |
| Total (Overall) | 117 (76.5%) | 36 (23.5%) |
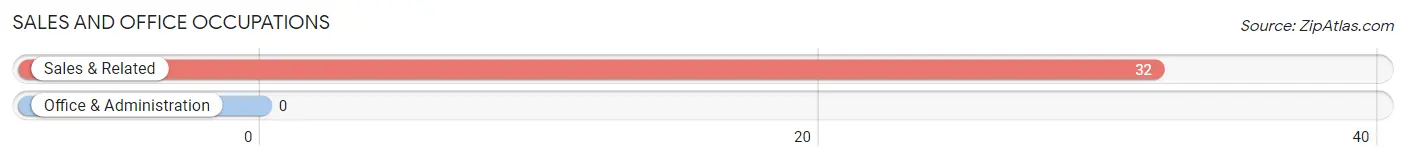
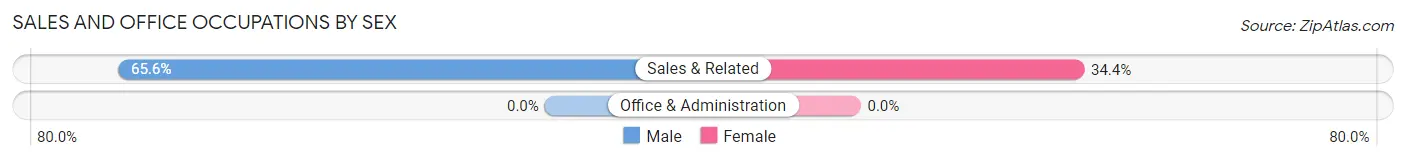
Sales and Office Occupations
The most common Sales and Office occupations in Finley Point are , and Sales & Related (32 | 20.9%).
Sales and Office Occupations by Sex
| Occupation | Male | Female |
| Sales & Related | 21 (65.6%) | 11 (34.4%) |
| Office & Administration | 0 (0.0%) | 0 (0.0%) |
| Total (Category) | 21 (65.6%) | 11 (34.4%) |
| Total (Overall) | 117 (76.5%) | 36 (23.5%) |
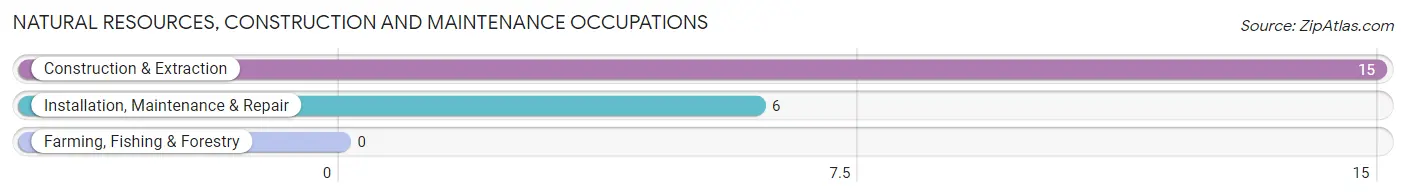
Natural Resources, Construction and Maintenance Occupations
The most common Natural Resources, Construction and Maintenance occupations in Finley Point are Construction & Extraction (15 | 9.8%), and Installation, Maintenance & Repair (6 | 3.9%).
Natural Resources, Construction and Maintenance Occupations by Sex
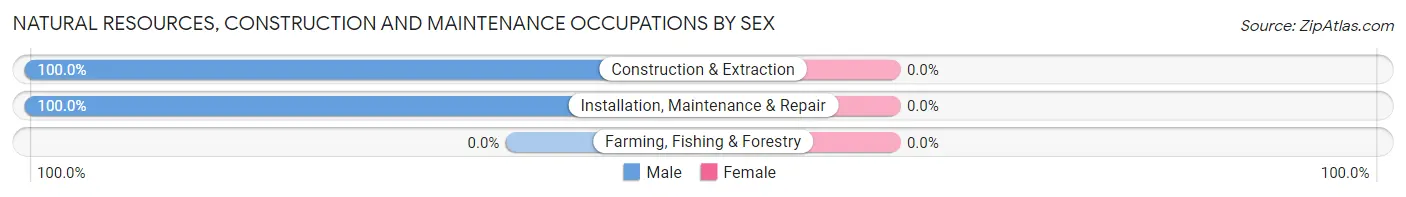
| Occupation | Male | Female |
| Farming, Fishing & Forestry | 0 (0.0%) | 0 (0.0%) |
| Construction & Extraction | 15 (100.0%) | 0 (0.0%) |
| Installation, Maintenance & Repair | 6 (100.0%) | 0 (0.0%) |
| Total (Category) | 21 (100.0%) | 0 (0.0%) |
| Total (Overall) | 117 (76.5%) | 36 (23.5%) |
Production, Transportation and Moving Occupations
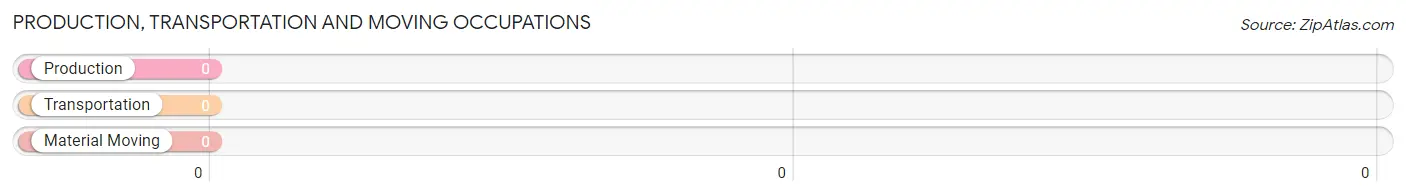
Production, Transportation and Moving Occupations by Sex
| Occupation | Male | Female |
| Production | 0 (0.0%) | 0 (0.0%) |
| Transportation | 0 (0.0%) | 0 (0.0%) |
| Material Moving | 0 (0.0%) | 0 (0.0%) |
| Total (Category) | 0 (0.0%) | 0 (0.0%) |
| Total (Overall) | 117 (76.5%) | 36 (23.5%) |
Employment Industries by Sex in Finley Point
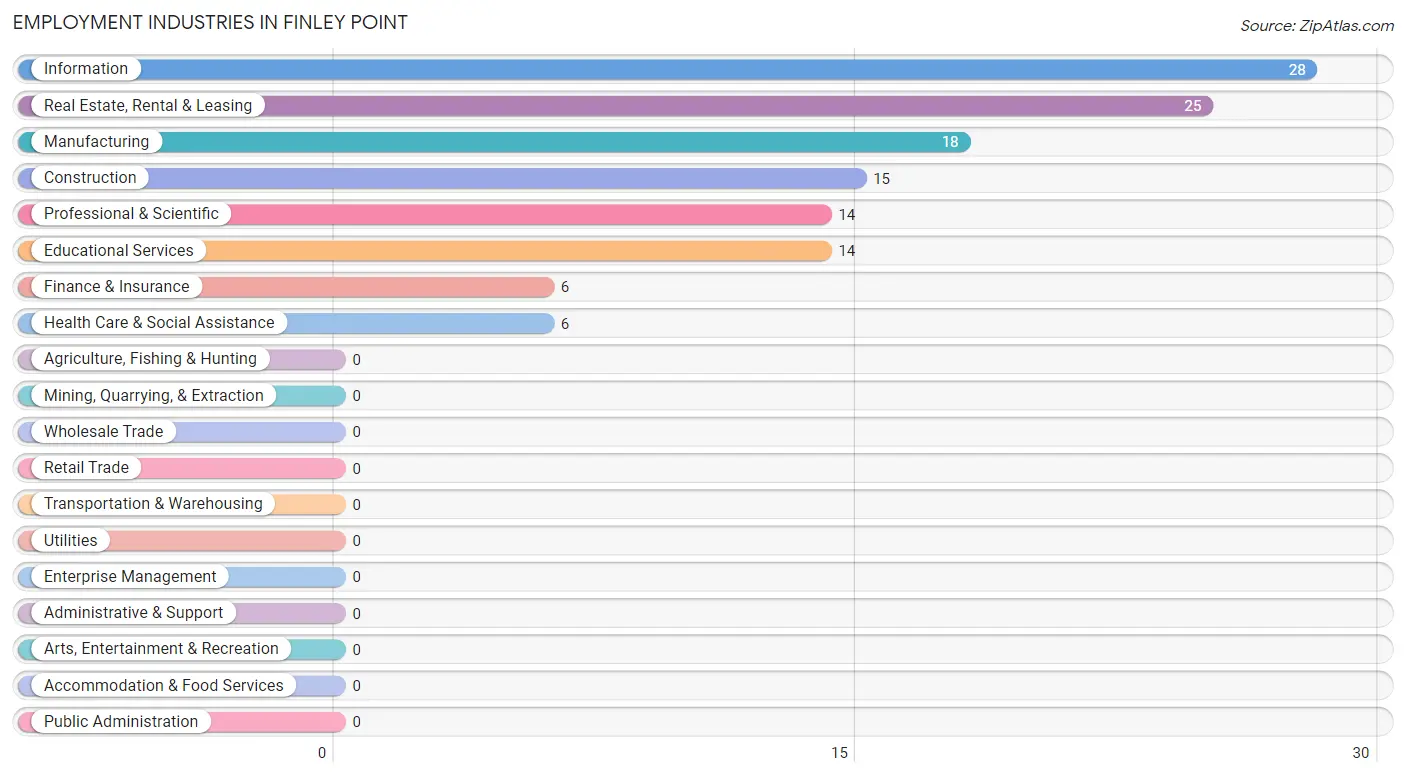
Employment Industries in Finley Point
The major employment industries in Finley Point include Information (28 | 18.3%), Real Estate, Rental & Leasing (25 | 16.3%), Manufacturing (18 | 11.8%), Construction (15 | 9.8%), and Professional & Scientific (14 | 9.1%).
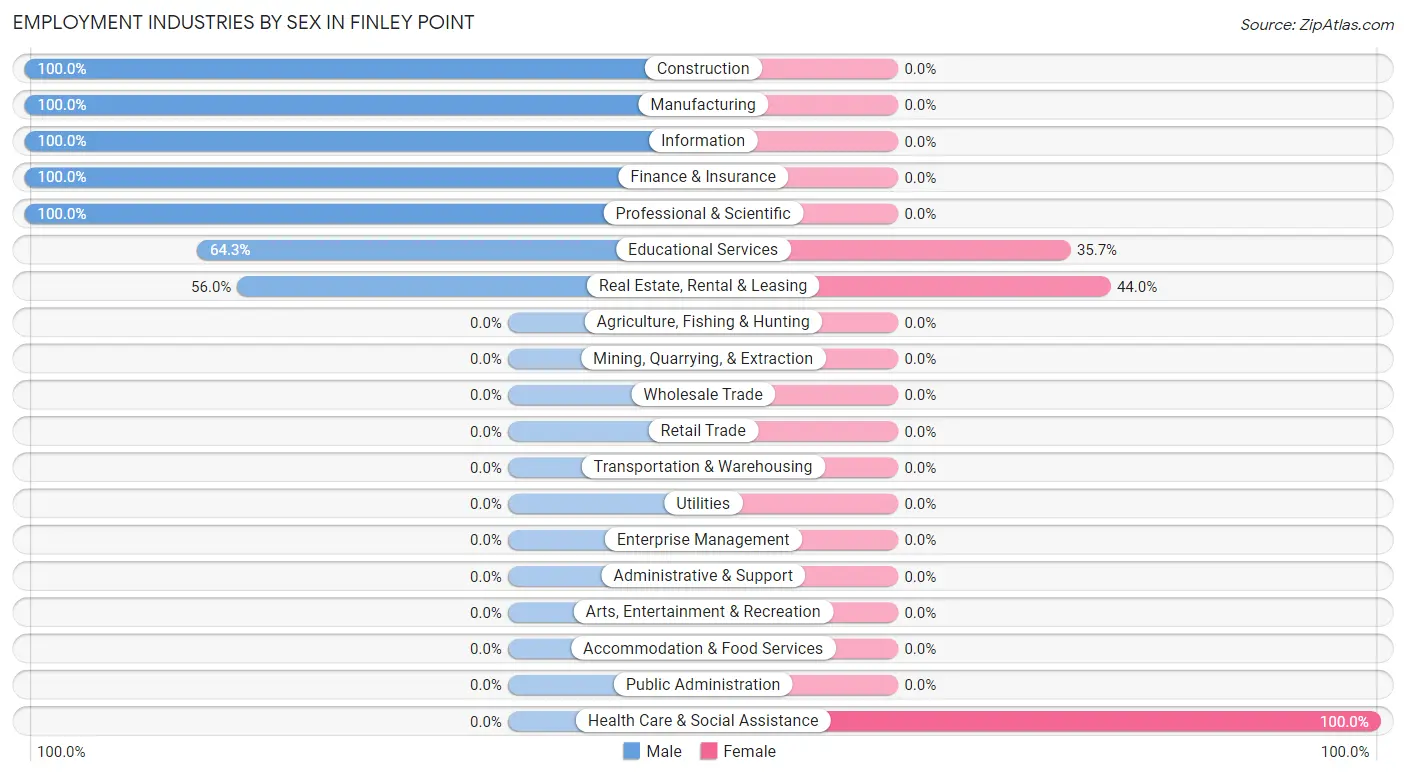
Employment Industries by Sex in Finley Point
The Finley Point industries that see more men than women are Construction (100.0%), Manufacturing (100.0%), and Information (100.0%), whereas the industries that tend to have a higher number of women are Health Care & Social Assistance (100.0%), Real Estate, Rental & Leasing (44.0%), and Educational Services (35.7%).
| Industry | Male | Female |
| Agriculture, Fishing & Hunting | 0 (0.0%) | 0 (0.0%) |
| Mining, Quarrying, & Extraction | 0 (0.0%) | 0 (0.0%) |
| Construction | 15 (100.0%) | 0 (0.0%) |
| Manufacturing | 18 (100.0%) | 0 (0.0%) |
| Wholesale Trade | 0 (0.0%) | 0 (0.0%) |
| Retail Trade | 0 (0.0%) | 0 (0.0%) |
| Transportation & Warehousing | 0 (0.0%) | 0 (0.0%) |
| Utilities | 0 (0.0%) | 0 (0.0%) |
| Information | 28 (100.0%) | 0 (0.0%) |
| Finance & Insurance | 6 (100.0%) | 0 (0.0%) |
| Real Estate, Rental & Leasing | 14 (56.0%) | 11 (44.0%) |
| Professional & Scientific | 14 (100.0%) | 0 (0.0%) |
| Enterprise Management | 0 (0.0%) | 0 (0.0%) |
| Administrative & Support | 0 (0.0%) | 0 (0.0%) |
| Educational Services | 9 (64.3%) | 5 (35.7%) |
| Health Care & Social Assistance | 0 (0.0%) | 6 (100.0%) |
| Arts, Entertainment & Recreation | 0 (0.0%) | 0 (0.0%) |
| Accommodation & Food Services | 0 (0.0%) | 0 (0.0%) |
| Public Administration | 0 (0.0%) | 0 (0.0%) |
| Total | 117 (76.5%) | 36 (23.5%) |
Education in Finley Point
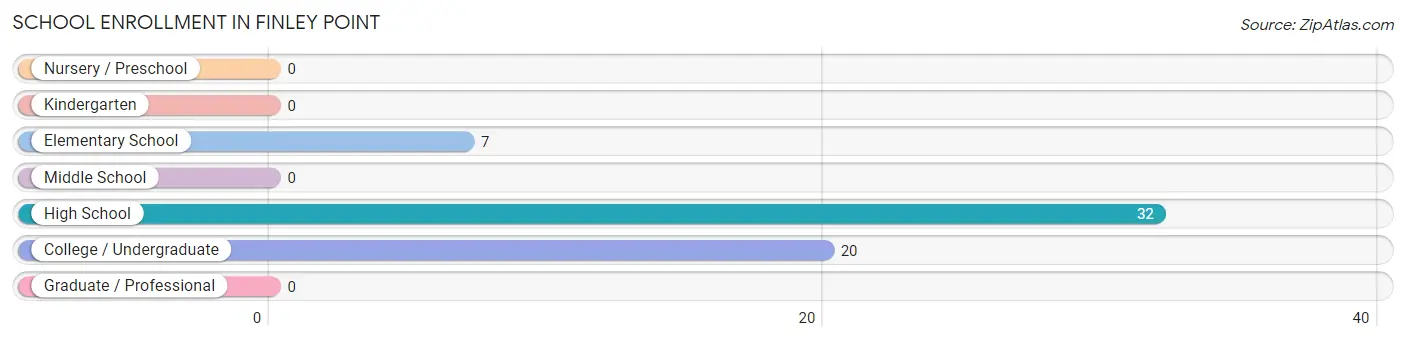
School Enrollment in Finley Point
The most common levels of schooling among the 59 students in Finley Point are high school (32 | 54.2%), college / undergraduate (20 | 33.9%), and elementary school (7 | 11.9%).
| School Level | # Students | % Students |
| Nursery / Preschool | 0 | 0.0% |
| Kindergarten | 0 | 0.0% |
| Elementary School | 7 | 11.9% |
| Middle School | 0 | 0.0% |
| High School | 32 | 54.2% |
| College / Undergraduate | 20 | 33.9% |
| Graduate / Professional | 0 | 0.0% |
| Total | 59 | 100.0% |
School Enrollment by Age by Funding Source in Finley Point
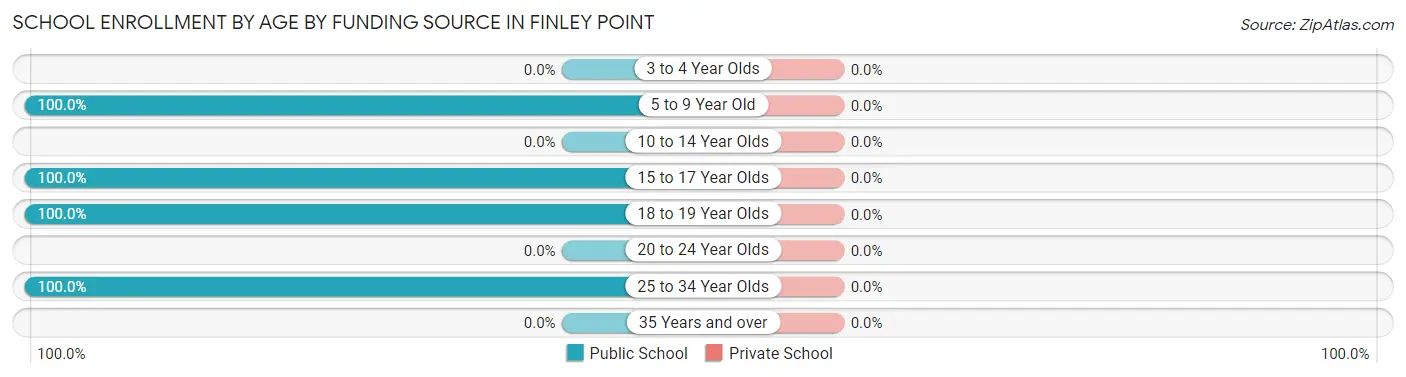
| Age Bracket | Public School | Private School |
| 3 to 4 Year Olds | 0 (0.0%) | 0 (0.0%) |
| 5 to 9 Year Old | 7 (100.0%) | 0 (0.0%) |
| 10 to 14 Year Olds | 0 (0.0%) | 0 (0.0%) |
| 15 to 17 Year Olds | 25 (100.0%) | 0 (0.0%) |
| 18 to 19 Year Olds | 7 (100.0%) | 0 (0.0%) |
| 20 to 24 Year Olds | 0 (0.0%) | 0 (0.0%) |
| 25 to 34 Year Olds | 20 (100.0%) | 0 (0.0%) |
| 35 Years and over | 0 (0.0%) | 0 (0.0%) |
| Total | 59 (100.0%) | 0 (0.0%) |
Educational Attainment by Field of Study in Finley Point
Literature & languages (38 | 29.0%), engineering (28 | 21.4%), liberal arts & history (25 | 19.1%), psychology (11 | 8.4%), and education (10 | 7.6%) are the most common fields of study among 131 individuals in Finley Point who have obtained a bachelor's degree or higher.
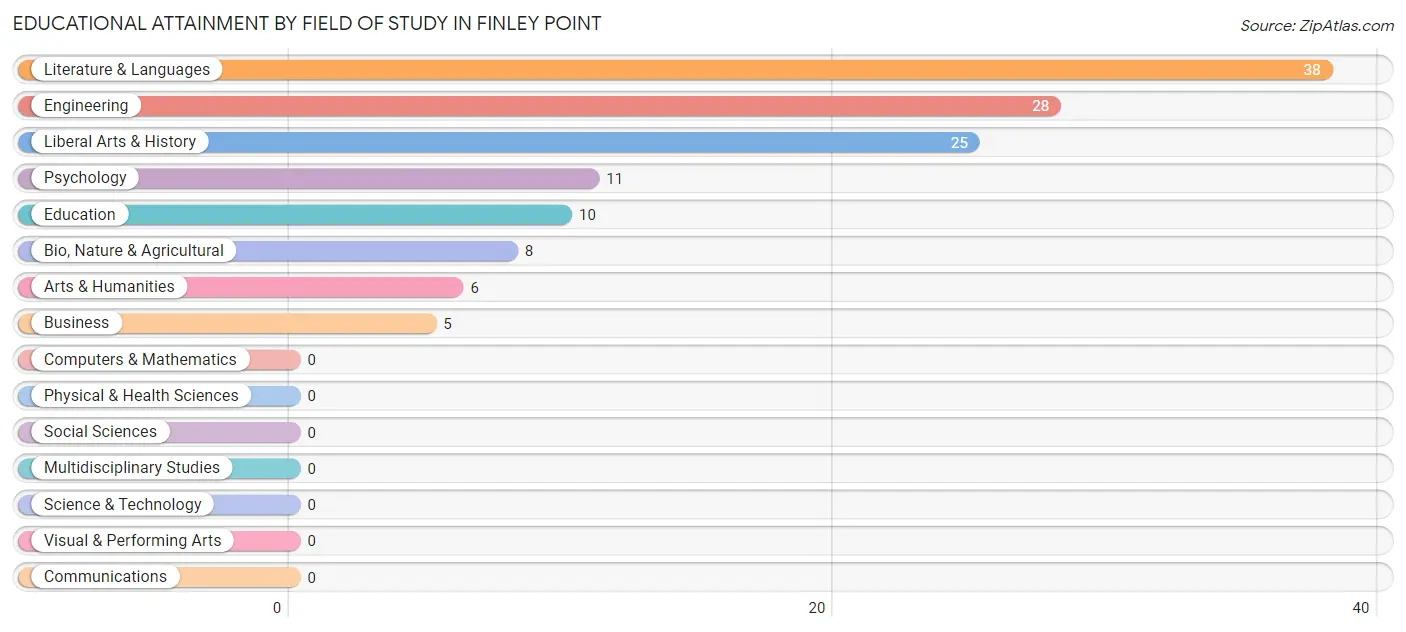
| Field of Study | # Graduates | % Graduates |
| Computers & Mathematics | 0 | 0.0% |
| Bio, Nature & Agricultural | 8 | 6.1% |
| Physical & Health Sciences | 0 | 0.0% |
| Psychology | 11 | 8.4% |
| Social Sciences | 0 | 0.0% |
| Engineering | 28 | 21.4% |
| Multidisciplinary Studies | 0 | 0.0% |
| Science & Technology | 0 | 0.0% |
| Business | 5 | 3.8% |
| Education | 10 | 7.6% |
| Literature & Languages | 38 | 29.0% |
| Liberal Arts & History | 25 | 19.1% |
| Visual & Performing Arts | 0 | 0.0% |
| Communications | 0 | 0.0% |
| Arts & Humanities | 6 | 4.6% |
| Total | 131 | 100.0% |
Transportation & Commute in Finley Point
Vehicle Availability by Sex in Finley Point
The most prevalent vehicle ownership categories in Finley Point are males with 2 vehicles (73, accounting for 62.4%) and females with 2 vehicles (5, making up 202.8%).
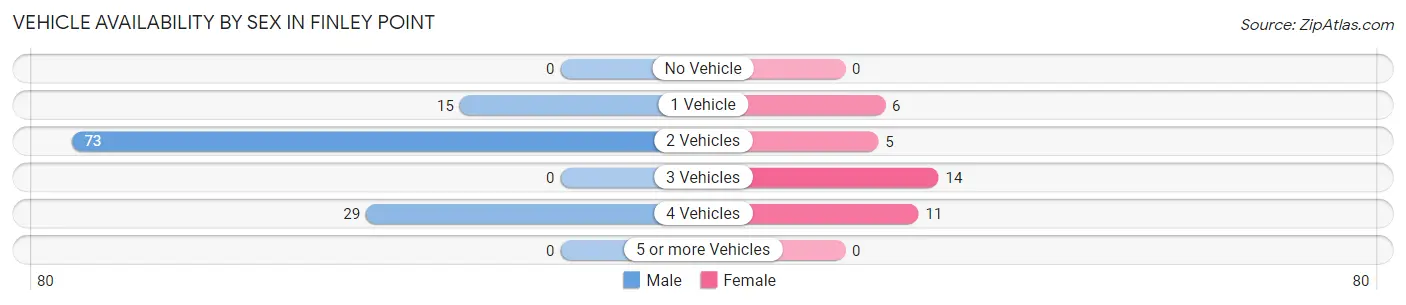
| Vehicles Available | Male | Female |
| No Vehicle | 0 (0.0%) | 0 (0.0%) |
| 1 Vehicle | 15 (12.8%) | 6 (16.7%) |
| 2 Vehicles | 73 (62.4%) | 5 (13.9%) |
| 3 Vehicles | 0 (0.0%) | 14 (38.9%) |
| 4 Vehicles | 29 (24.8%) | 11 (30.6%) |
| 5 or more Vehicles | 0 (0.0%) | 0 (0.0%) |
| Total | 117 (100.0%) | 36 (100.0%) |
Commute Time in Finley Point
The most frequently occuring commute durations in Finley Point are 15 to 19 minutes (40 commuters, 38.1%), 10 to 14 minutes (25 commuters, 23.8%), and 30 to 34 minutes (22 commuters, 20.9%).
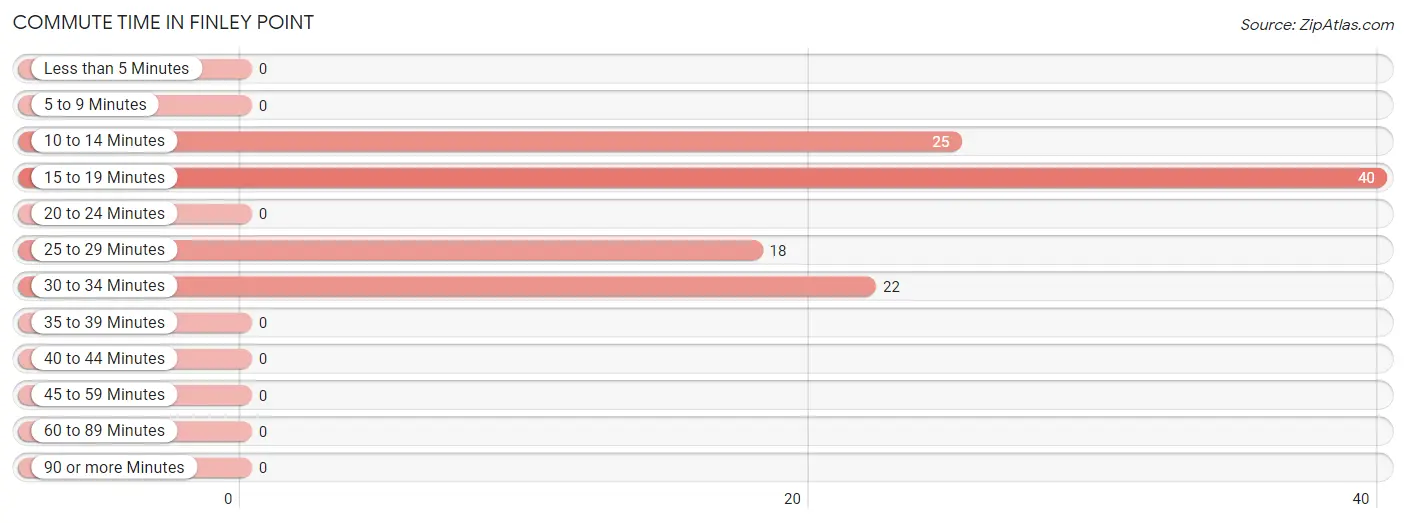
| Commute Time | # Commuters | % Commuters |
| Less than 5 Minutes | 0 | 0.0% |
| 5 to 9 Minutes | 0 | 0.0% |
| 10 to 14 Minutes | 25 | 23.8% |
| 15 to 19 Minutes | 40 | 38.1% |
| 20 to 24 Minutes | 0 | 0.0% |
| 25 to 29 Minutes | 18 | 17.1% |
| 30 to 34 Minutes | 22 | 20.9% |
| 35 to 39 Minutes | 0 | 0.0% |
| 40 to 44 Minutes | 0 | 0.0% |
| 45 to 59 Minutes | 0 | 0.0% |
| 60 to 89 Minutes | 0 | 0.0% |
| 90 or more Minutes | 0 | 0.0% |
Commute Time by Sex in Finley Point
The most common commute times in Finley Point are 15 to 19 minutes (21 commuters, 30.4%) for males and 15 to 19 minutes (19 commuters, 52.8%) for females.
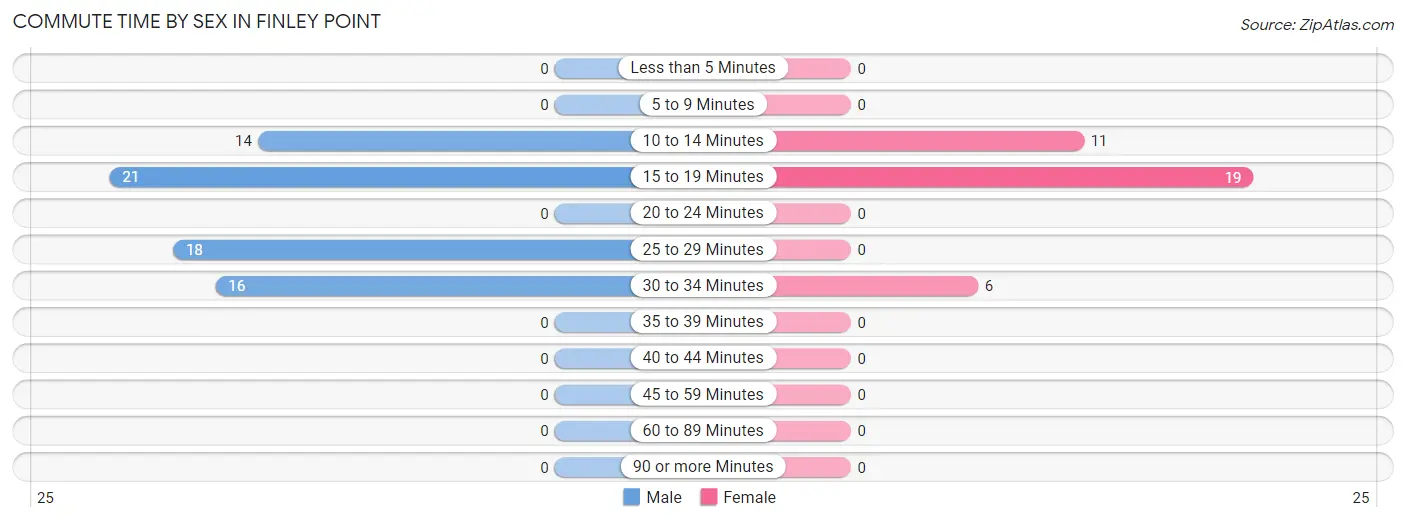
| Commute Time | Male | Female |
| Less than 5 Minutes | 0 (0.0%) | 0 (0.0%) |
| 5 to 9 Minutes | 0 (0.0%) | 0 (0.0%) |
| 10 to 14 Minutes | 14 (20.3%) | 11 (30.6%) |
| 15 to 19 Minutes | 21 (30.4%) | 19 (52.8%) |
| 20 to 24 Minutes | 0 (0.0%) | 0 (0.0%) |
| 25 to 29 Minutes | 18 (26.1%) | 0 (0.0%) |
| 30 to 34 Minutes | 16 (23.2%) | 6 (16.7%) |
| 35 to 39 Minutes | 0 (0.0%) | 0 (0.0%) |
| 40 to 44 Minutes | 0 (0.0%) | 0 (0.0%) |
| 45 to 59 Minutes | 0 (0.0%) | 0 (0.0%) |
| 60 to 89 Minutes | 0 (0.0%) | 0 (0.0%) |
| 90 or more Minutes | 0 (0.0%) | 0 (0.0%) |
Time of Departure to Work by Sex in Finley Point
The most frequent times of departure to work in Finley Point are 6:30 AM to 6:59 AM (33, 47.8%) for males and 9:00 AM to 9:59 AM (25, 69.4%) for females.
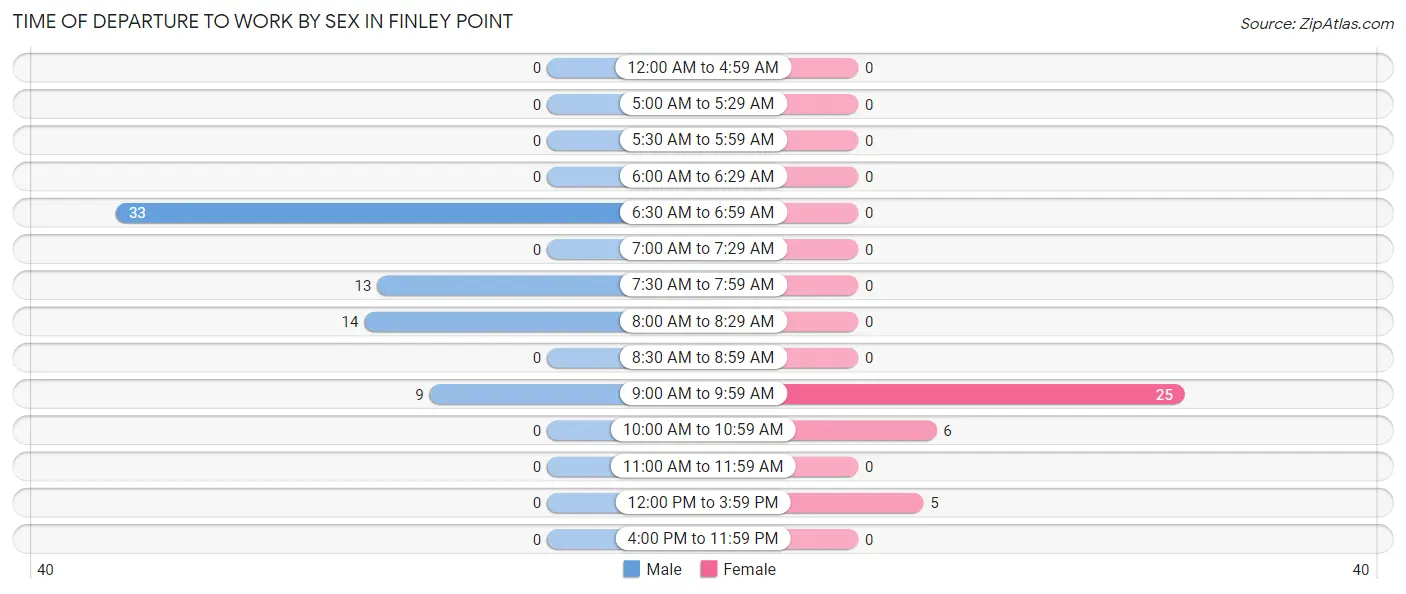
| Time of Departure | Male | Female |
| 12:00 AM to 4:59 AM | 0 (0.0%) | 0 (0.0%) |
| 5:00 AM to 5:29 AM | 0 (0.0%) | 0 (0.0%) |
| 5:30 AM to 5:59 AM | 0 (0.0%) | 0 (0.0%) |
| 6:00 AM to 6:29 AM | 0 (0.0%) | 0 (0.0%) |
| 6:30 AM to 6:59 AM | 33 (47.8%) | 0 (0.0%) |
| 7:00 AM to 7:29 AM | 0 (0.0%) | 0 (0.0%) |
| 7:30 AM to 7:59 AM | 13 (18.8%) | 0 (0.0%) |
| 8:00 AM to 8:29 AM | 14 (20.3%) | 0 (0.0%) |
| 8:30 AM to 8:59 AM | 0 (0.0%) | 0 (0.0%) |
| 9:00 AM to 9:59 AM | 9 (13.0%) | 25 (69.4%) |
| 10:00 AM to 10:59 AM | 0 (0.0%) | 6 (16.7%) |
| 11:00 AM to 11:59 AM | 0 (0.0%) | 0 (0.0%) |
| 12:00 PM to 3:59 PM | 0 (0.0%) | 5 (13.9%) |
| 4:00 PM to 11:59 PM | 0 (0.0%) | 0 (0.0%) |
| Total | 69 (100.0%) | 36 (100.0%) |
Housing Occupancy in Finley Point
Occupancy by Ownership in Finley Point
Of the total 260 dwellings in Finley Point, owner-occupied units account for 190 (73.1%), while renter-occupied units make up 70 (26.9%).
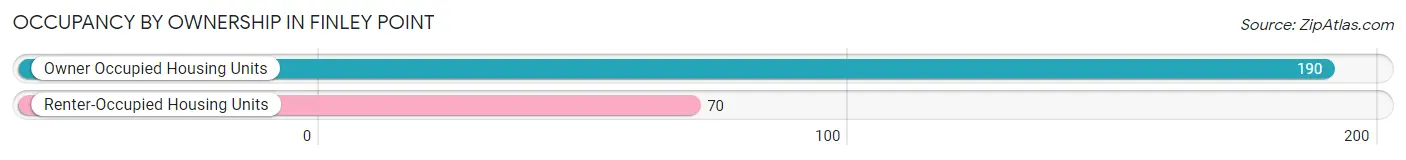
| Occupancy | # Housing Units | % Housing Units |
| Owner Occupied Housing Units | 190 | 73.1% |
| Renter-Occupied Housing Units | 70 | 26.9% |
| Total Occupied Housing Units | 260 | 100.0% |
Occupancy by Household Size in Finley Point
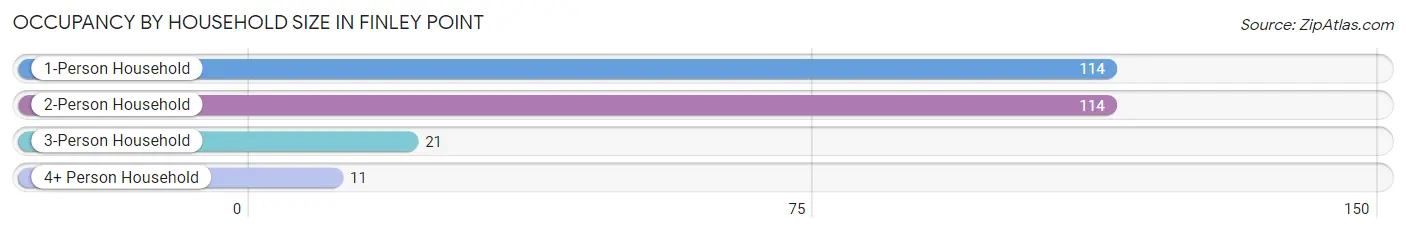
| Household Size | # Housing Units | % Housing Units |
| 1-Person Household | 114 | 43.9% |
| 2-Person Household | 114 | 43.9% |
| 3-Person Household | 21 | 8.1% |
| 4+ Person Household | 11 | 4.2% |
| Total Housing Units | 260 | 100.0% |
Occupancy by Ownership by Household Size in Finley Point
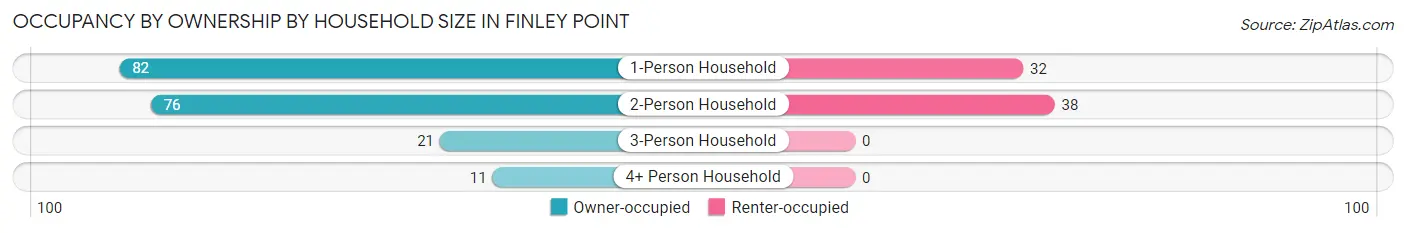
| Household Size | Owner-occupied | Renter-occupied |
| 1-Person Household | 82 (71.9%) | 32 (28.1%) |
| 2-Person Household | 76 (66.7%) | 38 (33.3%) |
| 3-Person Household | 21 (100.0%) | 0 (0.0%) |
| 4+ Person Household | 11 (100.0%) | 0 (0.0%) |
| Total Housing Units | 190 (73.1%) | 70 (26.9%) |
Occupancy by Educational Attainment in Finley Point
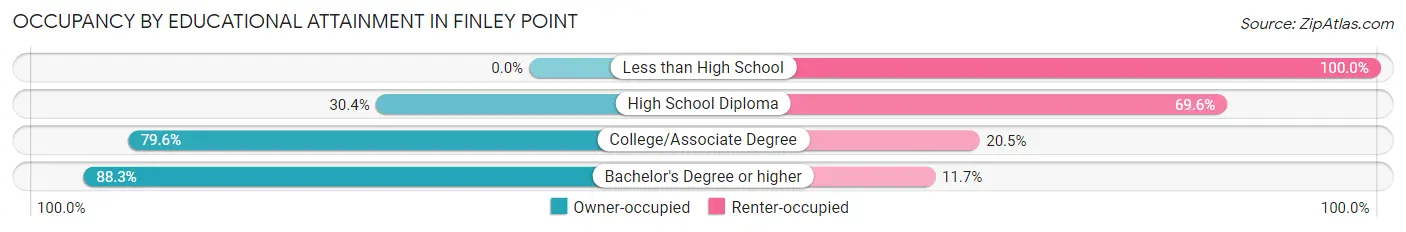
| Household Size | Owner-occupied | Renter-occupied |
| Less than High School | 0 (0.0%) | 6 (100.0%) |
| High School Diploma | 14 (30.4%) | 32 (69.6%) |
| College/Associate Degree | 70 (79.5%) | 18 (20.4%) |
| Bachelor's Degree or higher | 106 (88.3%) | 14 (11.7%) |
Occupancy by Age of Householder in Finley Point
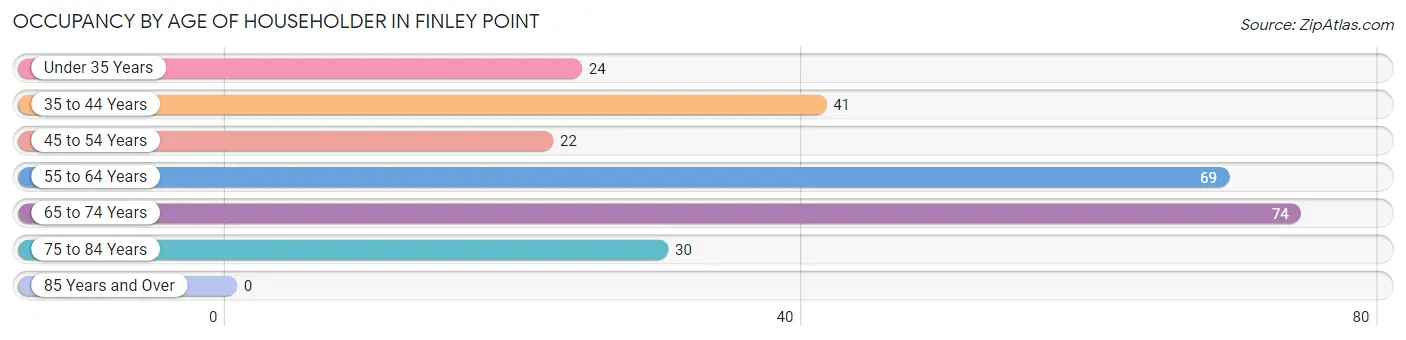
| Age Bracket | # Households | % Households |
| Under 35 Years | 24 | 9.2% |
| 35 to 44 Years | 41 | 15.8% |
| 45 to 54 Years | 22 | 8.5% |
| 55 to 64 Years | 69 | 26.5% |
| 65 to 74 Years | 74 | 28.5% |
| 75 to 84 Years | 30 | 11.5% |
| 85 Years and Over | 0 | 0.0% |
| Total | 260 | 100.0% |
Housing Finances in Finley Point
Median Income by Occupancy in Finley Point
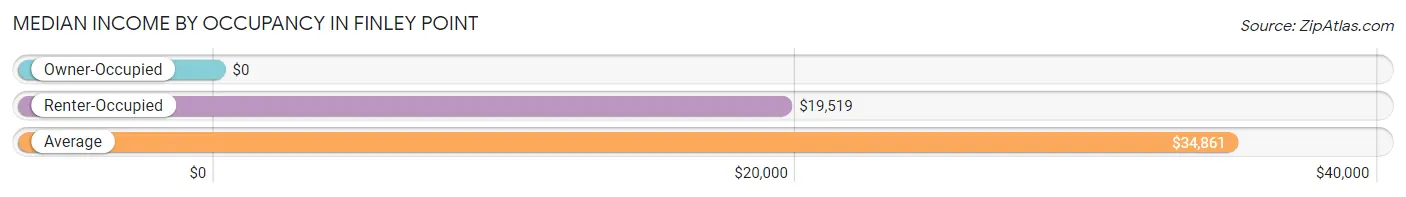
| Occupancy Type | # Households | Median Income |
| Owner-Occupied | 190 (73.1%) | $0 |
| Renter-Occupied | 70 (26.9%) | $19,519 |
| Average | 260 (100.0%) | $34,861 |
Occupancy by Householder Income Bracket in Finley Point
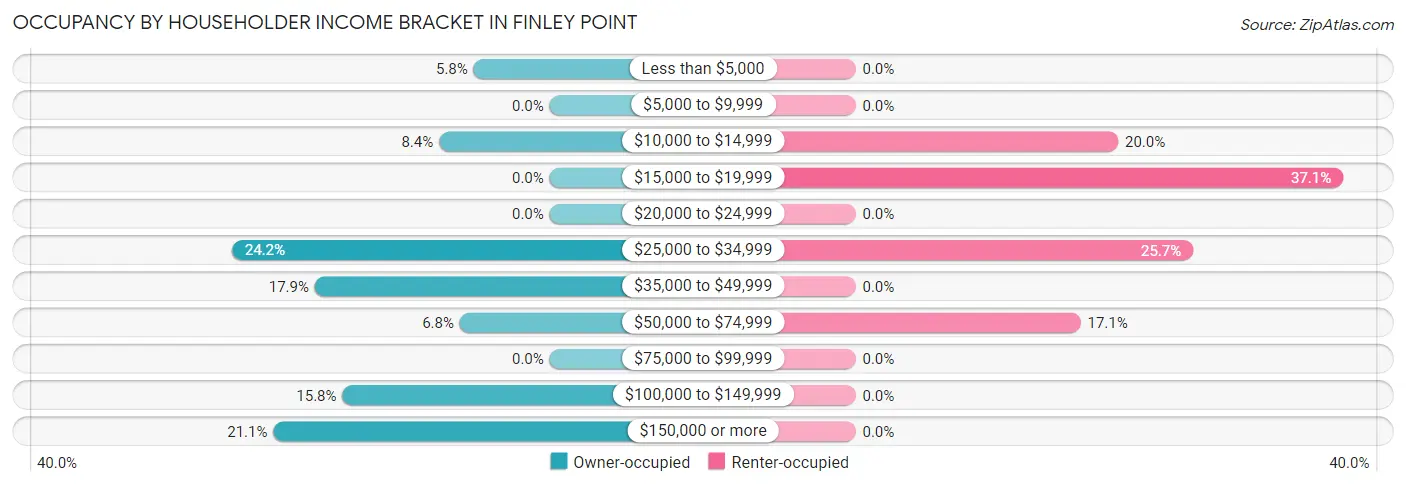
| Income Bracket | Owner-occupied | Renter-occupied |
| Less than $5,000 | 11 (5.8%) | 0 (0.0%) |
| $5,000 to $9,999 | 0 (0.0%) | 0 (0.0%) |
| $10,000 to $14,999 | 16 (8.4%) | 14 (20.0%) |
| $15,000 to $19,999 | 0 (0.0%) | 26 (37.1%) |
| $20,000 to $24,999 | 0 (0.0%) | 0 (0.0%) |
| $25,000 to $34,999 | 46 (24.2%) | 18 (25.7%) |
| $35,000 to $49,999 | 34 (17.9%) | 0 (0.0%) |
| $50,000 to $74,999 | 13 (6.8%) | 12 (17.1%) |
| $75,000 to $99,999 | 0 (0.0%) | 0 (0.0%) |
| $100,000 to $149,999 | 30 (15.8%) | 0 (0.0%) |
| $150,000 or more | 40 (21.0%) | 0 (0.0%) |
| Total | 190 (100.0%) | 70 (100.0%) |
Monthly Housing Cost Tiers in Finley Point
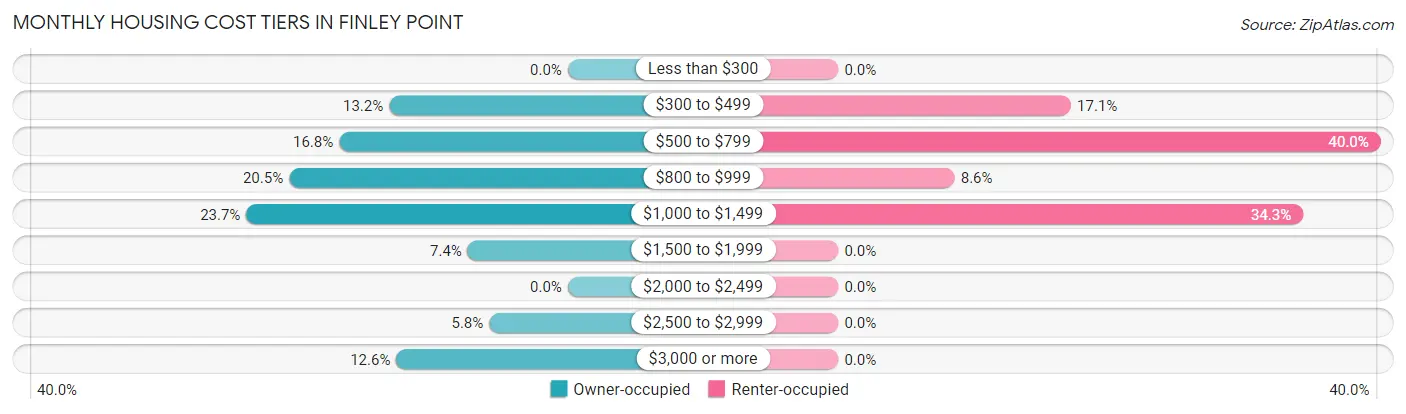
| Monthly Cost | Owner-occupied | Renter-occupied |
| Less than $300 | 0 (0.0%) | 0 (0.0%) |
| $300 to $499 | 25 (13.2%) | 12 (17.1%) |
| $500 to $799 | 32 (16.8%) | 28 (40.0%) |
| $800 to $999 | 39 (20.5%) | 6 (8.6%) |
| $1,000 to $1,499 | 45 (23.7%) | 24 (34.3%) |
| $1,500 to $1,999 | 14 (7.4%) | 0 (0.0%) |
| $2,000 to $2,499 | 0 (0.0%) | 0 (0.0%) |
| $2,500 to $2,999 | 11 (5.8%) | 0 (0.0%) |
| $3,000 or more | 24 (12.6%) | 0 (0.0%) |
| Total | 190 (100.0%) | 70 (100.0%) |
Physical Housing Characteristics in Finley Point
Housing Structures in Finley Point
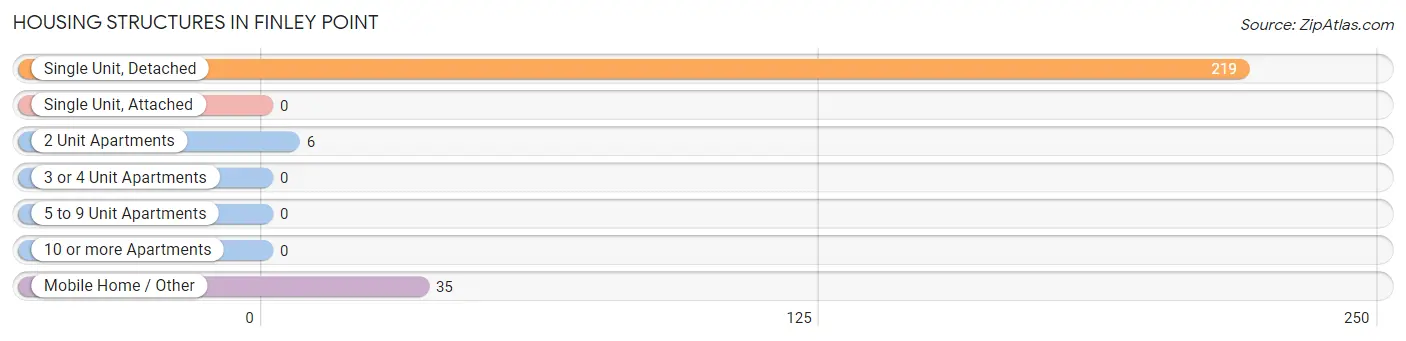
| Structure Type | # Housing Units | % Housing Units |
| Single Unit, Detached | 219 | 84.2% |
| Single Unit, Attached | 0 | 0.0% |
| 2 Unit Apartments | 6 | 2.3% |
| 3 or 4 Unit Apartments | 0 | 0.0% |
| 5 to 9 Unit Apartments | 0 | 0.0% |
| 10 or more Apartments | 0 | 0.0% |
| Mobile Home / Other | 35 | 13.5% |
| Total | 260 | 100.0% |
Housing Structures by Occupancy in Finley Point
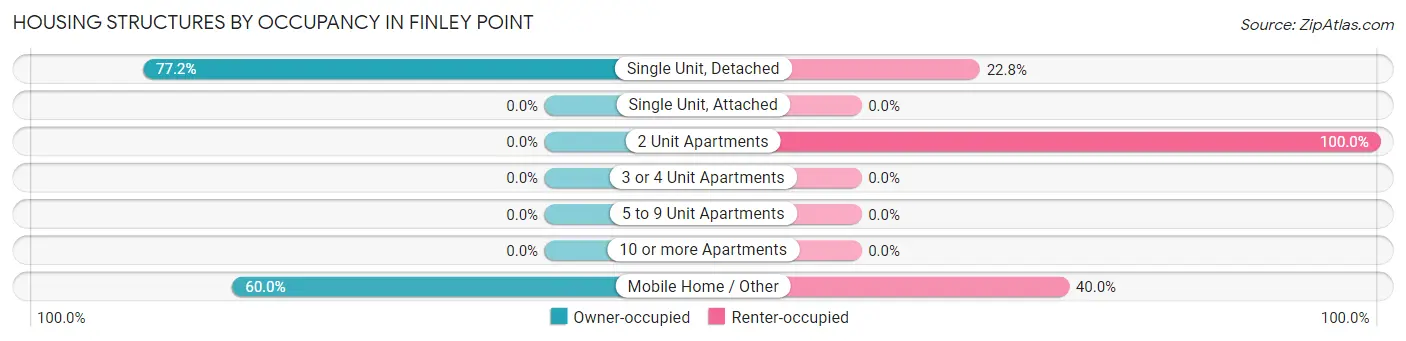
| Structure Type | Owner-occupied | Renter-occupied |
| Single Unit, Detached | 169 (77.2%) | 50 (22.8%) |
| Single Unit, Attached | 0 (0.0%) | 0 (0.0%) |
| 2 Unit Apartments | 0 (0.0%) | 6 (100.0%) |
| 3 or 4 Unit Apartments | 0 (0.0%) | 0 (0.0%) |
| 5 to 9 Unit Apartments | 0 (0.0%) | 0 (0.0%) |
| 10 or more Apartments | 0 (0.0%) | 0 (0.0%) |
| Mobile Home / Other | 21 (60.0%) | 14 (40.0%) |
| Total | 190 (73.1%) | 70 (26.9%) |
Housing Structures by Number of Rooms in Finley Point
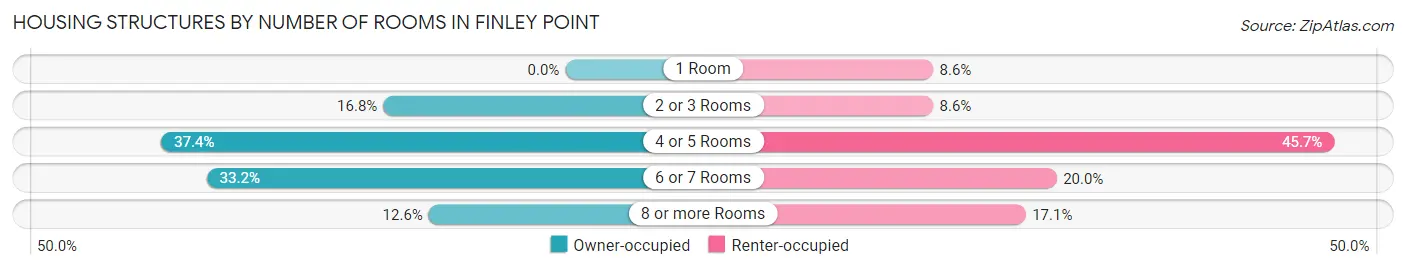
| Number of Rooms | Owner-occupied | Renter-occupied |
| 1 Room | 0 (0.0%) | 6 (8.6%) |
| 2 or 3 Rooms | 32 (16.8%) | 6 (8.6%) |
| 4 or 5 Rooms | 71 (37.4%) | 32 (45.7%) |
| 6 or 7 Rooms | 63 (33.2%) | 14 (20.0%) |
| 8 or more Rooms | 24 (12.6%) | 12 (17.1%) |
| Total | 190 (100.0%) | 70 (100.0%) |
Housing Structure by Heating Type in Finley Point
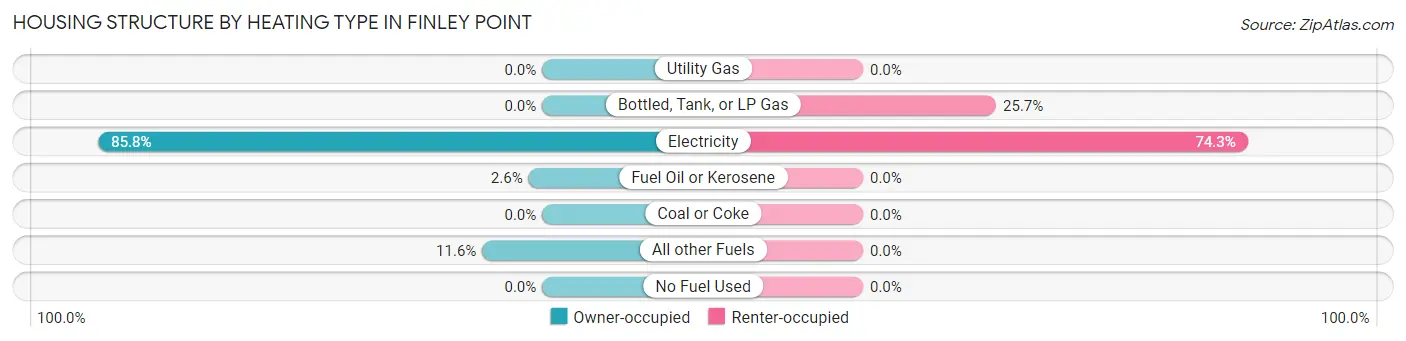
| Heating Type | Owner-occupied | Renter-occupied |
| Utility Gas | 0 (0.0%) | 0 (0.0%) |
| Bottled, Tank, or LP Gas | 0 (0.0%) | 18 (25.7%) |
| Electricity | 163 (85.8%) | 52 (74.3%) |
| Fuel Oil or Kerosene | 5 (2.6%) | 0 (0.0%) |
| Coal or Coke | 0 (0.0%) | 0 (0.0%) |
| All other Fuels | 22 (11.6%) | 0 (0.0%) |
| No Fuel Used | 0 (0.0%) | 0 (0.0%) |
| Total | 190 (100.0%) | 70 (100.0%) |
Household Vehicle Usage in Finley Point
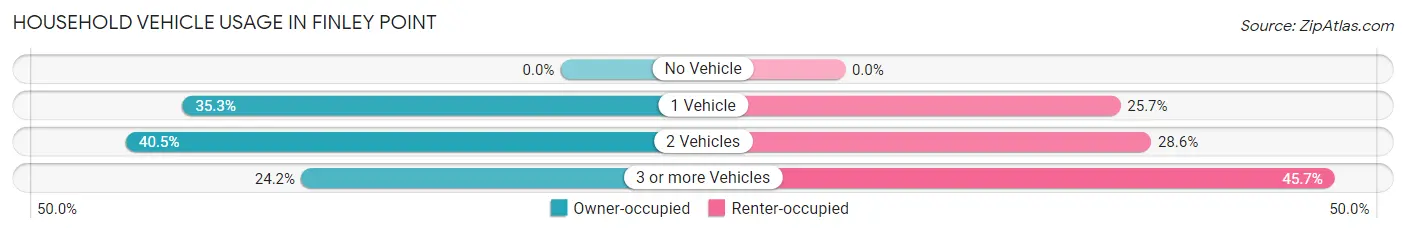
| Vehicles per Household | Owner-occupied | Renter-occupied |
| No Vehicle | 0 (0.0%) | 0 (0.0%) |
| 1 Vehicle | 67 (35.3%) | 18 (25.7%) |
| 2 Vehicles | 77 (40.5%) | 20 (28.6%) |
| 3 or more Vehicles | 46 (24.2%) | 32 (45.7%) |
| Total | 190 (100.0%) | 70 (100.0%) |
Real Estate & Mortgages in Finley Point
Real Estate and Mortgage Overview in Finley Point
| Characteristic | Without Mortgage | With Mortgage |
| Housing Units | 96 | 94 |
| Median Property Value | $552,600 | $425,800 |
| Median Household Income | - | - |
| Monthly Housing Costs | $631 | $24 |
| Real Estate Taxes | $5,192 | $9 |
Property Value by Mortgage Status in Finley Point
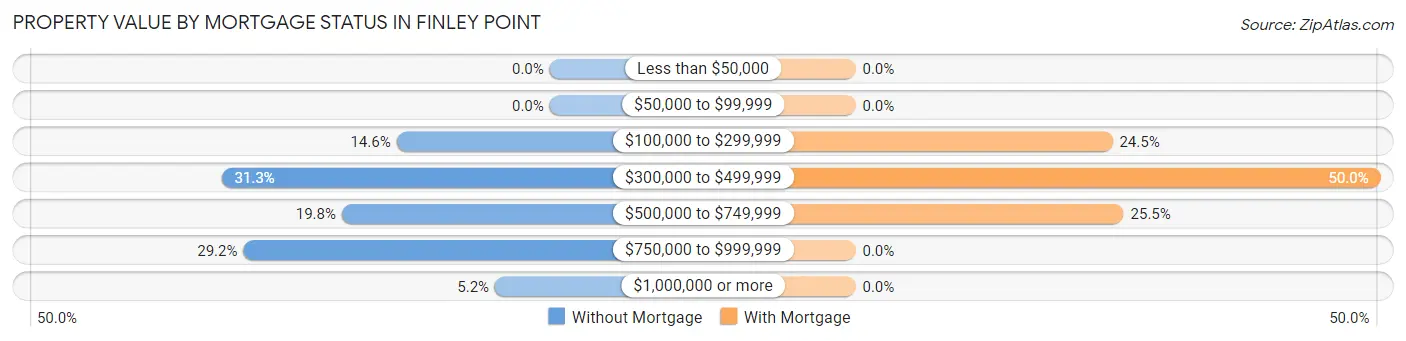
| Property Value | Without Mortgage | With Mortgage |
| Less than $50,000 | 0 (0.0%) | 0 (0.0%) |
| $50,000 to $99,999 | 0 (0.0%) | 0 (0.0%) |
| $100,000 to $299,999 | 14 (14.6%) | 23 (24.5%) |
| $300,000 to $499,999 | 30 (31.2%) | 47 (50.0%) |
| $500,000 to $749,999 | 19 (19.8%) | 24 (25.5%) |
| $750,000 to $999,999 | 28 (29.2%) | 0 (0.0%) |
| $1,000,000 or more | 5 (5.2%) | 0 (0.0%) |
| Total | 96 (100.0%) | 94 (100.0%) |
Household Income by Mortgage Status in Finley Point
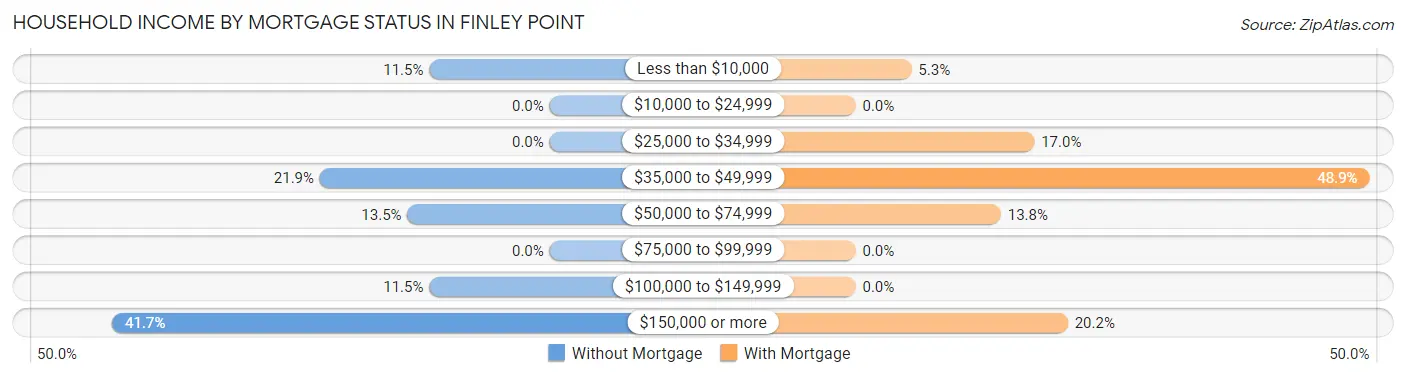
| Household Income | Without Mortgage | With Mortgage |
| Less than $10,000 | 11 (11.5%) | 5 (5.3%) |
| $10,000 to $24,999 | 0 (0.0%) | 0 (0.0%) |
| $25,000 to $34,999 | 0 (0.0%) | 16 (17.0%) |
| $35,000 to $49,999 | 21 (21.9%) | 46 (48.9%) |
| $50,000 to $74,999 | 13 (13.5%) | 13 (13.8%) |
| $75,000 to $99,999 | 0 (0.0%) | 0 (0.0%) |
| $100,000 to $149,999 | 11 (11.5%) | 0 (0.0%) |
| $150,000 or more | 40 (41.7%) | 19 (20.2%) |
| Total | 96 (100.0%) | 94 (100.0%) |
Property Value to Household Income Ratio in Finley Point
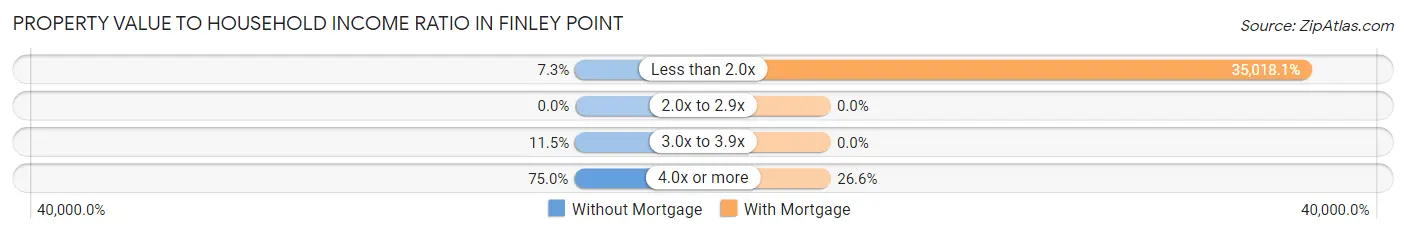
| Value-to-Income Ratio | Without Mortgage | With Mortgage |
| Less than 2.0x | 7 (7.3%) | 32,917 (35,018.1%) |
| 2.0x to 2.9x | 0 (0.0%) | 0 (0.0%) |
| 3.0x to 3.9x | 11 (11.5%) | 0 (0.0%) |
| 4.0x or more | 72 (75.0%) | 25 (26.6%) |
| Total | 96 (100.0%) | 94 (100.0%) |
Real Estate Taxes by Mortgage Status in Finley Point
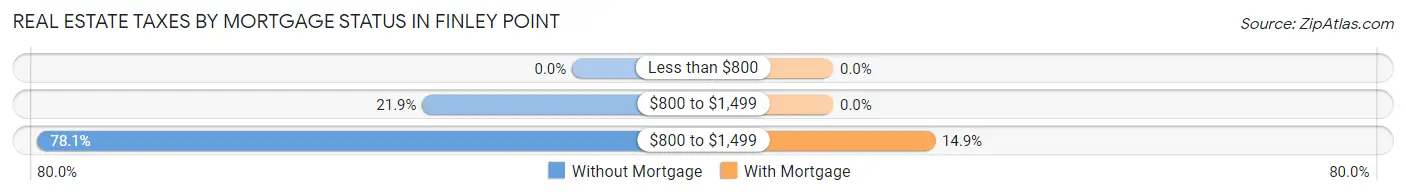
| Property Taxes | Without Mortgage | With Mortgage |
| Less than $800 | 0 (0.0%) | 0 (0.0%) |
| $800 to $1,499 | 21 (21.9%) | 0 (0.0%) |
| $800 to $1,499 | 75 (78.1%) | 14 (14.9%) |
| Total | 96 (100.0%) | 94 (100.0%) |
Health & Disability in Finley Point
Health Insurance Coverage by Age in Finley Point
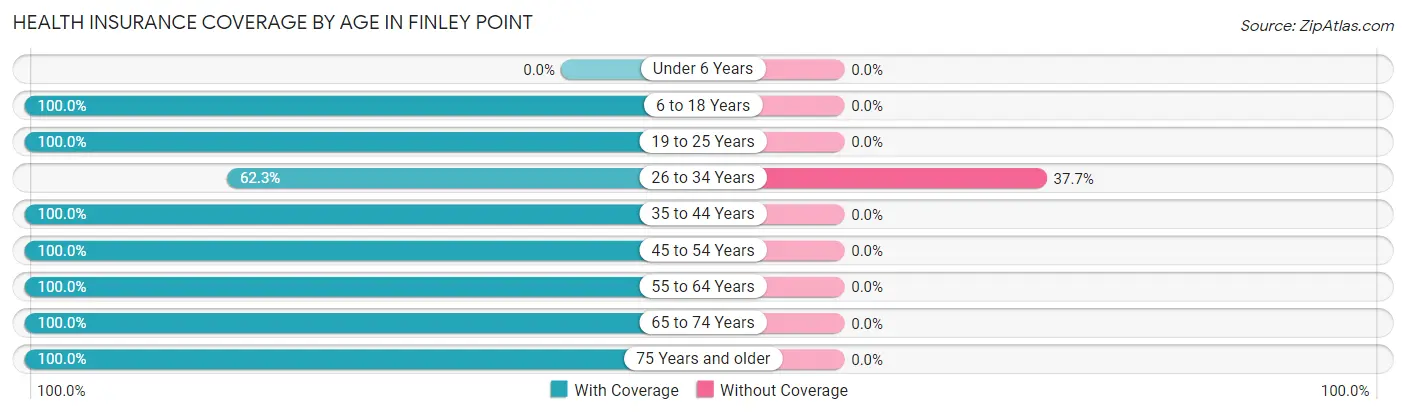
| Age Bracket | With Coverage | Without Coverage |
| Under 6 Years | 0 (0.0%) | 0 (0.0%) |
| 6 to 18 Years | 39 (100.0%) | 0 (0.0%) |
| 19 to 25 Years | 18 (100.0%) | 0 (0.0%) |
| 26 to 34 Years | 33 (62.3%) | 20 (37.7%) |
| 35 to 44 Years | 56 (100.0%) | 0 (0.0%) |
| 45 to 54 Years | 28 (100.0%) | 0 (0.0%) |
| 55 to 64 Years | 118 (100.0%) | 0 (0.0%) |
| 65 to 74 Years | 110 (100.0%) | 0 (0.0%) |
| 75 Years and older | 38 (100.0%) | 0 (0.0%) |
| Total | 440 (95.7%) | 20 (4.3%) |
Health Insurance Coverage by Citizenship Status in Finley Point
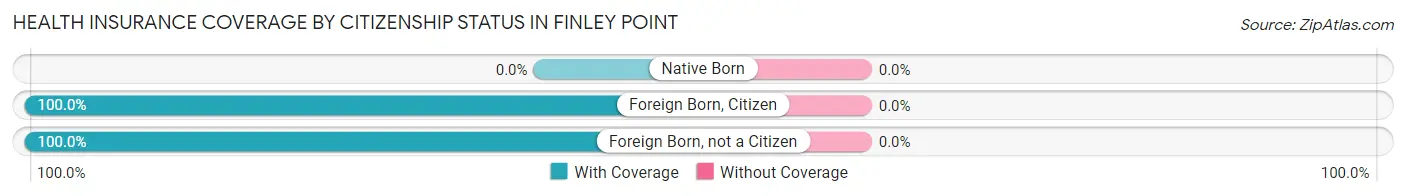
| Citizenship Status | With Coverage | Without Coverage |
| Native Born | 0 (0.0%) | 0 (0.0%) |
| Foreign Born, Citizen | 39 (100.0%) | 0 (0.0%) |
| Foreign Born, not a Citizen | 18 (100.0%) | 0 (0.0%) |
Health Insurance Coverage by Household Income in Finley Point
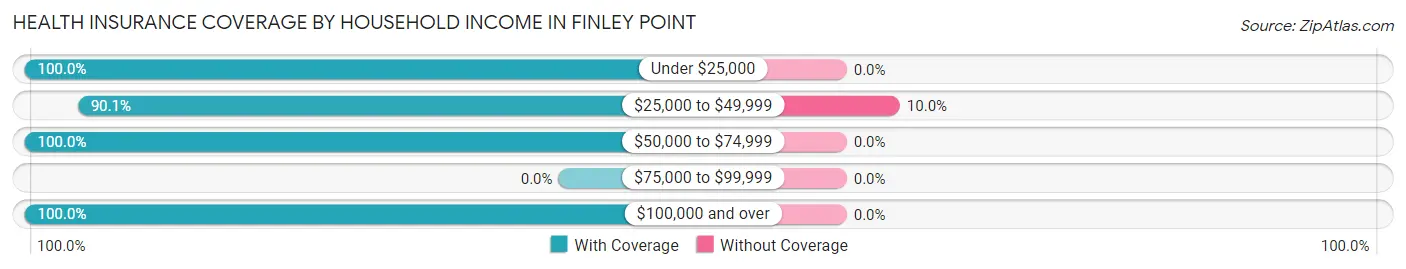
| Household Income | With Coverage | Without Coverage |
| Under $25,000 | 87 (100.0%) | 0 (0.0%) |
| $25,000 to $49,999 | 181 (90.0%) | 20 (10.0%) |
| $50,000 to $74,999 | 45 (100.0%) | 0 (0.0%) |
| $75,000 to $99,999 | 0 (0.0%) | 0 (0.0%) |
| $100,000 and over | 127 (100.0%) | 0 (0.0%) |
Public vs Private Health Insurance Coverage by Age in Finley Point
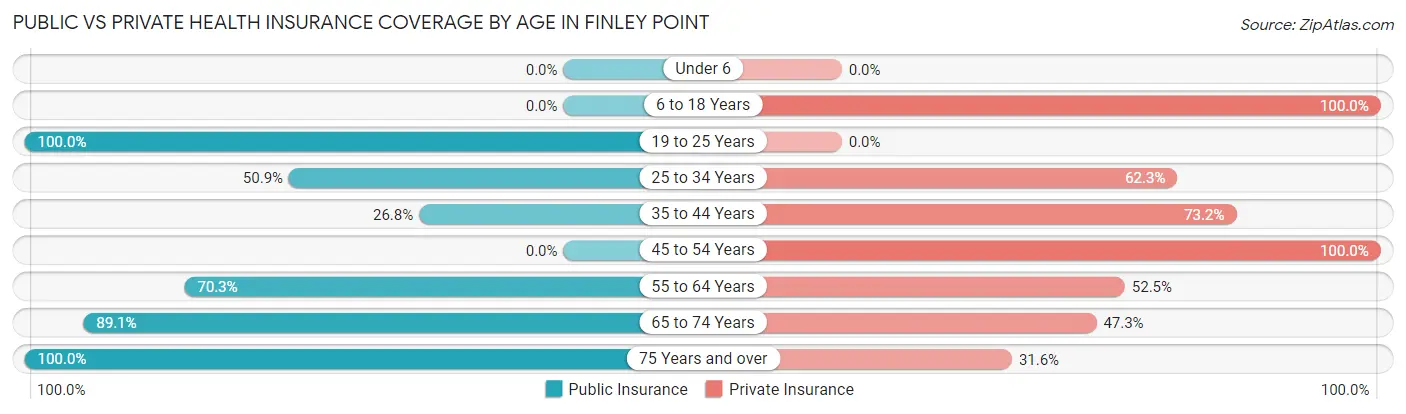
| Age Bracket | Public Insurance | Private Insurance |
| Under 6 | 0 (0.0%) | 0 (0.0%) |
| 6 to 18 Years | 0 (0.0%) | 39 (100.0%) |
| 19 to 25 Years | 18 (100.0%) | 0 (0.0%) |
| 25 to 34 Years | 27 (50.9%) | 33 (62.3%) |
| 35 to 44 Years | 15 (26.8%) | 41 (73.2%) |
| 45 to 54 Years | 0 (0.0%) | 28 (100.0%) |
| 55 to 64 Years | 83 (70.3%) | 62 (52.5%) |
| 65 to 74 Years | 98 (89.1%) | 52 (47.3%) |
| 75 Years and over | 38 (100.0%) | 12 (31.6%) |
| Total | 279 (60.7%) | 267 (58.0%) |
Disability Status by Sex by Age in Finley Point
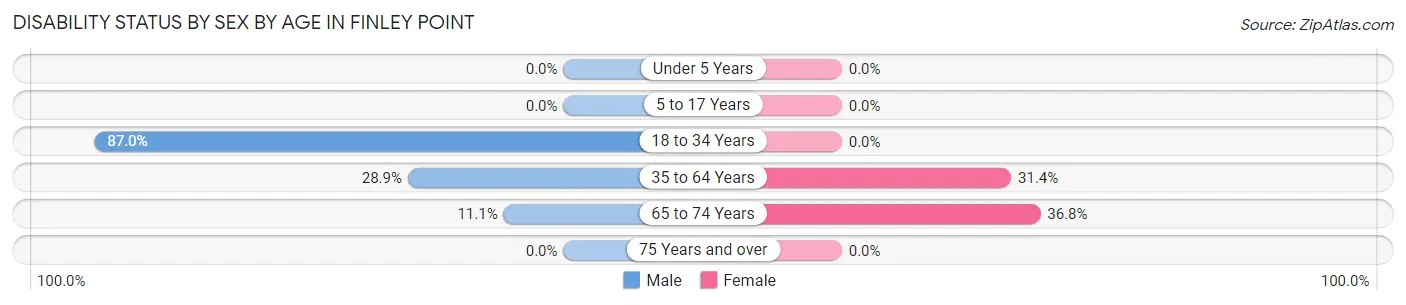
| Age Bracket | Male | Female |
| Under 5 Years | 0 (0.0%) | 0 (0.0%) |
| 5 to 17 Years | 0 (0.0%) | 0 (0.0%) |
| 18 to 34 Years | 47 (87.0%) | 0 (0.0%) |
| 35 to 64 Years | 28 (28.9%) | 33 (31.4%) |
| 65 to 74 Years | 8 (11.1%) | 14 (36.8%) |
| 75 Years and over | 0 (0.0%) | 0 (0.0%) |
Disability Class by Sex by Age in Finley Point
Disability Class: Hearing Difficulty
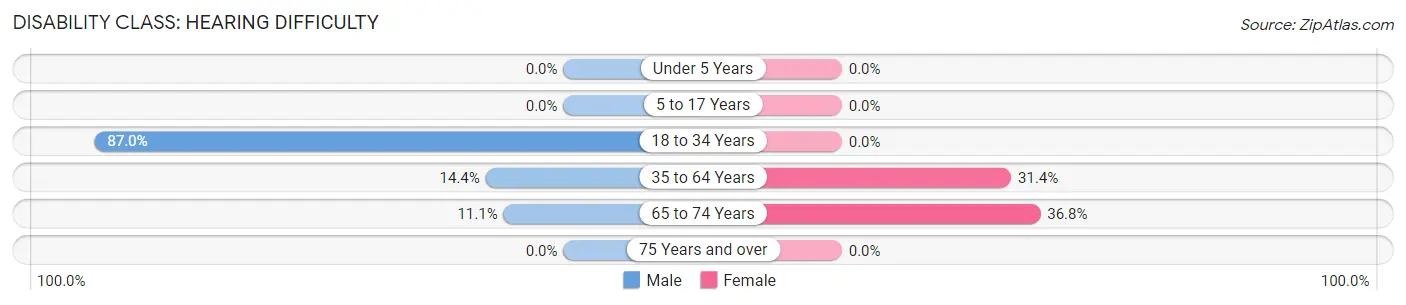
| Age Bracket | Male | Female |
| Under 5 Years | 0 (0.0%) | 0 (0.0%) |
| 5 to 17 Years | 0 (0.0%) | 0 (0.0%) |
| 18 to 34 Years | 47 (87.0%) | 0 (0.0%) |
| 35 to 64 Years | 14 (14.4%) | 33 (31.4%) |
| 65 to 74 Years | 8 (11.1%) | 14 (36.8%) |
| 75 Years and over | 0 (0.0%) | 0 (0.0%) |
Disability Class: Vision Difficulty
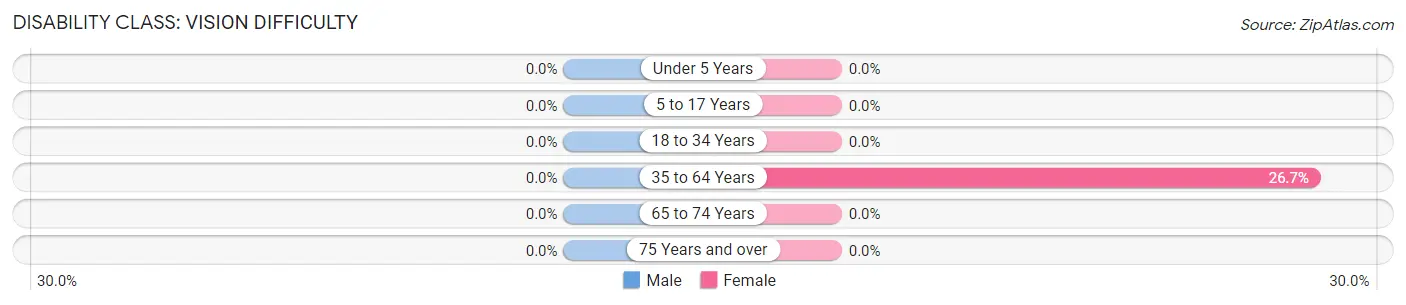
| Age Bracket | Male | Female |
| Under 5 Years | 0 (0.0%) | 0 (0.0%) |
| 5 to 17 Years | 0 (0.0%) | 0 (0.0%) |
| 18 to 34 Years | 0 (0.0%) | 0 (0.0%) |
| 35 to 64 Years | 0 (0.0%) | 28 (26.7%) |
| 65 to 74 Years | 0 (0.0%) | 0 (0.0%) |
| 75 Years and over | 0 (0.0%) | 0 (0.0%) |
Disability Class: Cognitive Difficulty
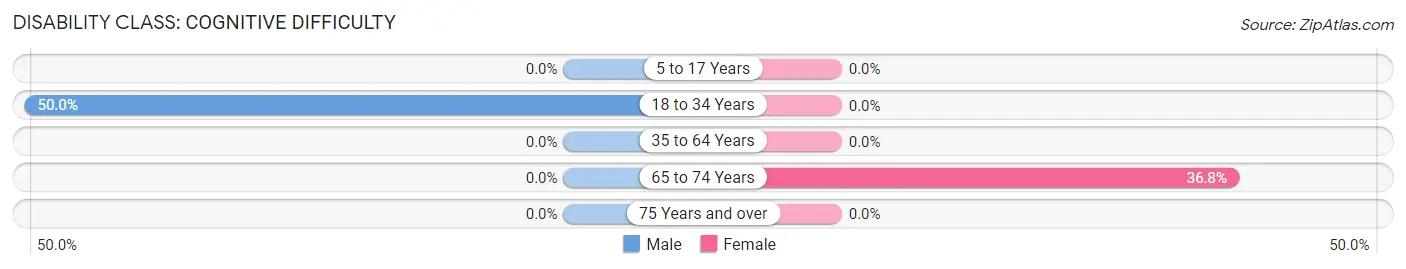
| Age Bracket | Male | Female |
| 5 to 17 Years | 0 (0.0%) | 0 (0.0%) |
| 18 to 34 Years | 27 (50.0%) | 0 (0.0%) |
| 35 to 64 Years | 0 (0.0%) | 0 (0.0%) |
| 65 to 74 Years | 0 (0.0%) | 14 (36.8%) |
| 75 Years and over | 0 (0.0%) | 0 (0.0%) |
Disability Class: Ambulatory Difficulty
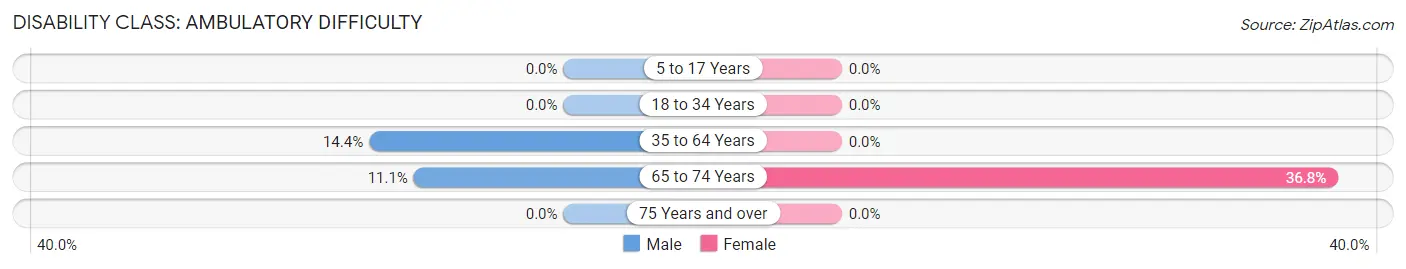
| Age Bracket | Male | Female |
| 5 to 17 Years | 0 (0.0%) | 0 (0.0%) |
| 18 to 34 Years | 0 (0.0%) | 0 (0.0%) |
| 35 to 64 Years | 14 (14.4%) | 0 (0.0%) |
| 65 to 74 Years | 8 (11.1%) | 14 (36.8%) |
| 75 Years and over | 0 (0.0%) | 0 (0.0%) |
Disability Class: Self-Care Difficulty
| Age Bracket | Male | Female |
| 5 to 17 Years | 0 (0.0%) | 0 (0.0%) |
| 18 to 34 Years | 0 (0.0%) | 0 (0.0%) |
| 35 to 64 Years | 0 (0.0%) | 0 (0.0%) |
| 65 to 74 Years | 0 (0.0%) | 0 (0.0%) |
| 75 Years and over | 0 (0.0%) | 0 (0.0%) |
Technology Access in Finley Point
Computing Device Access in Finley Point
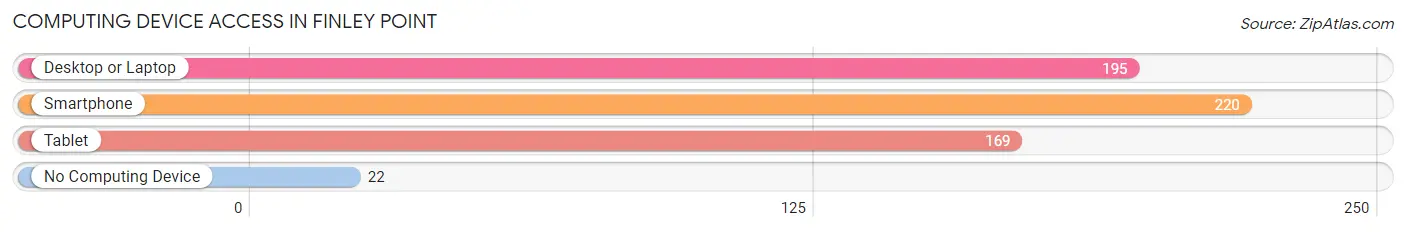
| Device Type | # Households | % Households |
| Desktop or Laptop | 195 | 75.0% |
| Smartphone | 220 | 84.6% |
| Tablet | 169 | 65.0% |
| No Computing Device | 22 | 8.5% |
| Total | 260 | 100.0% |
Internet Access in Finley Point
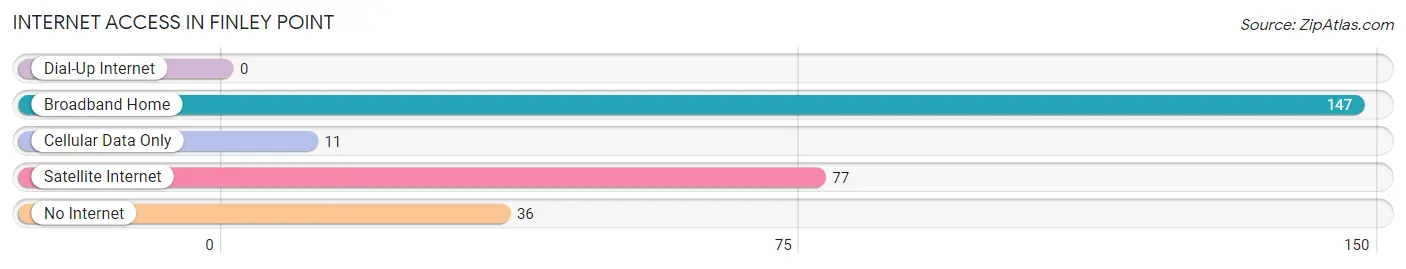
| Internet Type | # Households | % Households |
| Dial-Up Internet | 0 | 0.0% |
| Broadband Home | 147 | 56.5% |
| Cellular Data Only | 11 | 4.2% |
| Satellite Internet | 77 | 29.6% |
| No Internet | 36 | 13.9% |
| Total | 260 | 100.0% |
Finley Point Summary
Finley Point is a small unincorporated community located in Lake County, Montana, United States. It is situated on the western shore of Flathead Lake, the largest natural freshwater lake in the western United States. The community is located approximately 10 miles north of Polson, the county seat, and is part of the Flathead Indian Reservation.
History
The area around Finley Point has been inhabited by Native Americans for thousands of years. The Salish, Kootenai, and Pend d’Oreille tribes were the primary inhabitants of the area prior to the arrival of European settlers. The first European settlers arrived in the area in the late 1800s and established a small fishing village. The village was named after William Finley, an early settler who established a trading post in the area.
In the early 1900s, the area around Finley Point began to develop as a resort destination. The first resort, the Finley Point Resort, was established in 1910 and quickly became a popular destination for tourists. The resort was later expanded to include a hotel, restaurant, and other amenities.
In the 1950s, the area around Finley Point began to develop as a residential community. The first homes were built in the area in the late 1950s and early 1960s. The community has since grown to include a variety of homes, businesses, and other amenities.
Geography
Finley Point is located on the western shore of Flathead Lake, the largest natural freshwater lake in the western United States. The community is situated approximately 10 miles north of Polson, the county seat, and is part of the Flathead Indian Reservation. The area around Finley Point is characterized by rolling hills, forests, and open meadows. The community is located at an elevation of 2,845 feet above sea level.
Economy
The economy of Finley Point is largely based on tourism and recreation. The area is a popular destination for fishing, boating, and other outdoor activities. The Finley Point Resort is a popular destination for tourists and provides a variety of amenities, including a hotel, restaurant, and other services. The community also has a variety of small businesses, including restaurants, shops, and other services.
Demographics
As of the 2010 census, the population of Finley Point was 1,072. The racial makeup of the community was 95.3% White, 0.7% Native American, 0.3% Asian, 0.2% African American, 0.1% Pacific Islander, and 3.4% from other races. The median household income in Finley Point was $37,917, and the median family income was $45,625. The per capita income in Finley Point was $20,945.
Common Questions
What is the Total Population of Finley Point?
Total Population of Finley Point is 460.
What is the Total Male Population of Finley Point?
Total Male Population of Finley Point is 248.
What is the Total Female Population of Finley Point?
Total Female Population of Finley Point is 212.
What is the Ratio of Males per 100 Females in Finley Point?
There are 116.98 Males per 100 Females in Finley Point.
What is the Ratio of Females per 100 Males in Finley Point?
There are 85.48 Females per 100 Males in Finley Point.
What is the Median Population Age in Finley Point?
Median Population Age in Finley Point is 60.3 Years.
What is the Average Family Size in Finley Point
Average Family Size in Finley Point is 2.4 People.
What is the Average Household Size in Finley Point
Average Household Size in Finley Point is 1.8 People.
What is Per Capita Income in Finley Point?
Per Capita income in Finley Point is $38,829.
What is the Median Family Income in Finley Point?
Median Family Income in Finley Point is $33,194.
What is the Median Household income in Finley Point?
Median Household Income in Finley Point is $34,861.
What is Income or Wage Gap in Finley Point?
Income or Wage Gap in Finley Point is 48.2%.
Women in Finley Point earn 51.8 cents for every dollar earned by a man.
What is Inequality or Gini Index in Finley Point?
Inequality or Gini Index in Finley Point is 0.51.
How Large is the Labor Force in Finley Point?
There are 167 People in the Labor Forcein in Finley Point.
What is the Percentage of People in the Labor Force in Finley Point?
38.1% of People are in the Labor Force in Finley Point.
What is the Unemployment Rate in Finley Point?
Unemployment Rate in Finley Point is 8.4%.