Wibaux County, MT
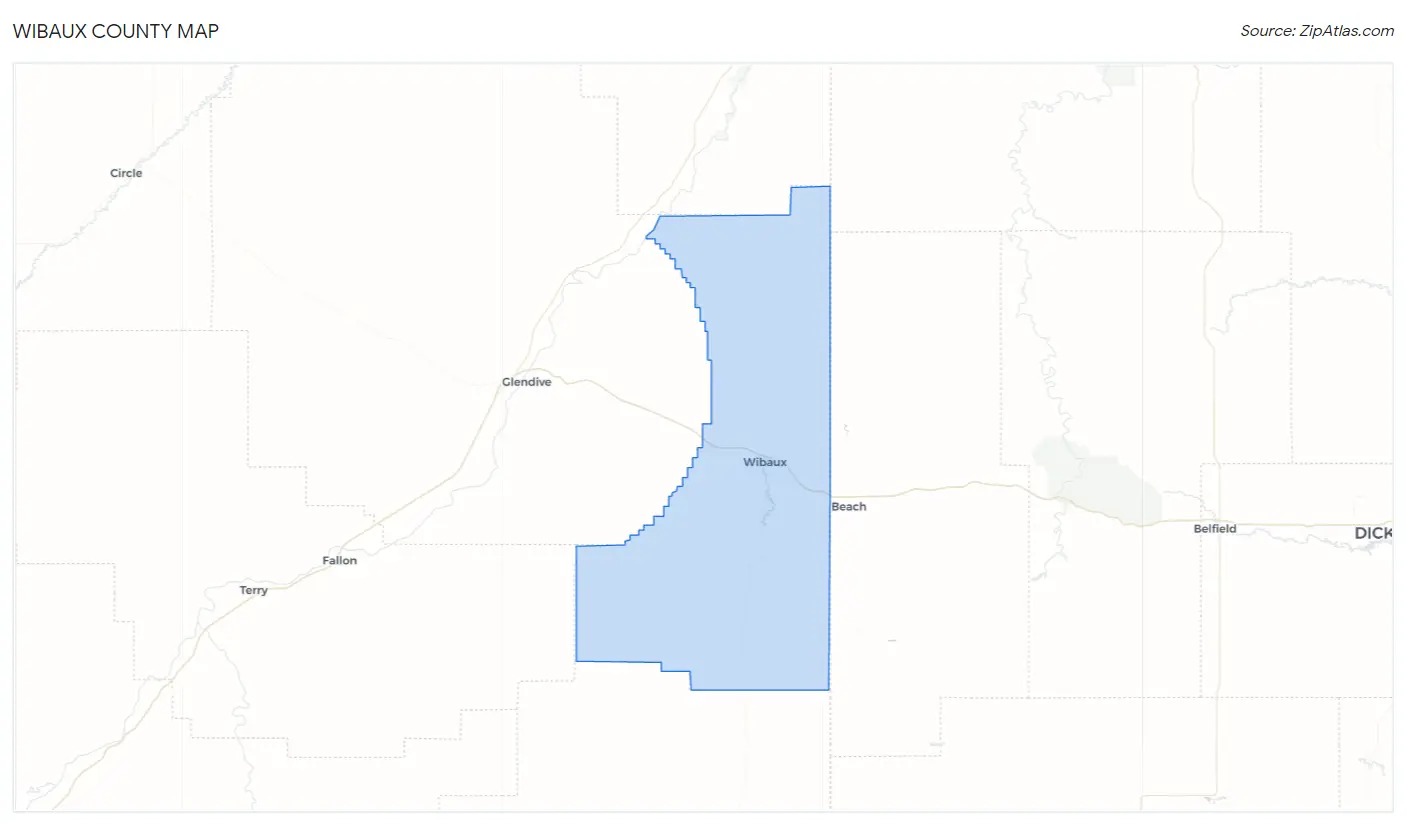
Wibaux County Map
Wibaux County Overview
1,119
TOTAL POPULATION
542
MALE POPULATION
577
FEMALE POPULATION
93.93
MALES / 100 FEMALES
106.46
FEMALES / 100 MALES
46.4
MEDIAN AGE
3.0
AVG FAMILY SIZE
2.4
AVG HOUSEHOLD SIZE
$31,089
PER CAPITA INCOME
$90,000
AVG FAMILY INCOME
$58,750
AVG HOUSEHOLD INCOME
47.9%
WAGE / INCOME GAP [ % ]
52.1¢/ $1
WAGE / INCOME GAP [ $ ]
0.41
INEQUALITY / GINI INDEX
489
LABOR FORCE [ PEOPLE ]
58.1%
PERCENT IN LABOR FORCE
Wibaux County Area Codes
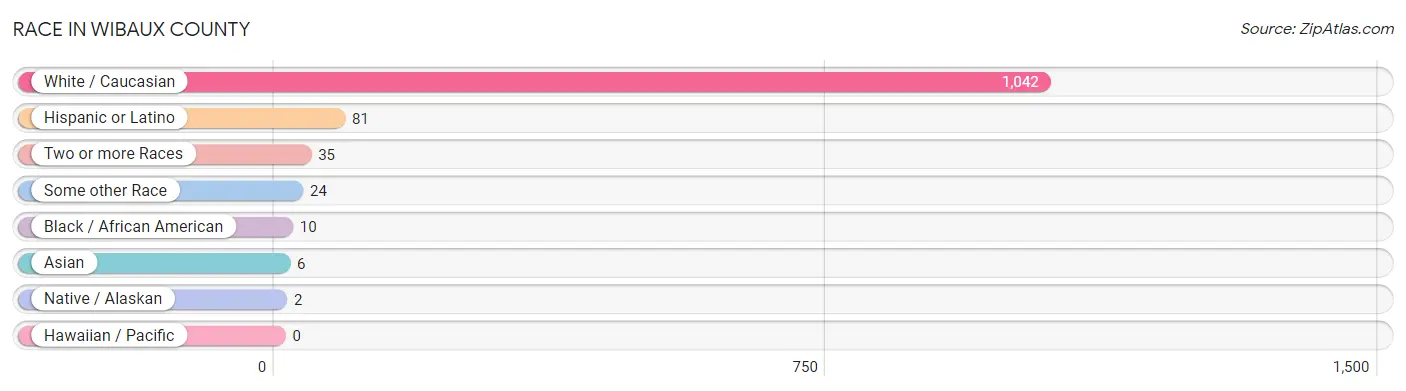
Race in Wibaux County
The most populous races in Wibaux County are White / Caucasian (1,042 | 93.1%), Hispanic or Latino (81 | 7.2%), and Two or more Races (35 | 3.1%).
| Race | # Population | % Population |
| Asian | 6 | 0.5% |
| Black / African American | 10 | 0.9% |
| Hawaiian / Pacific | 0 | 0.0% |
| Hispanic or Latino | 81 | 7.2% |
| Native / Alaskan | 2 | 0.2% |
| White / Caucasian | 1,042 | 93.1% |
| Two or more Races | 35 | 3.1% |
| Some other Race | 24 | 2.1% |
| Total | 1,119 | 100.0% |
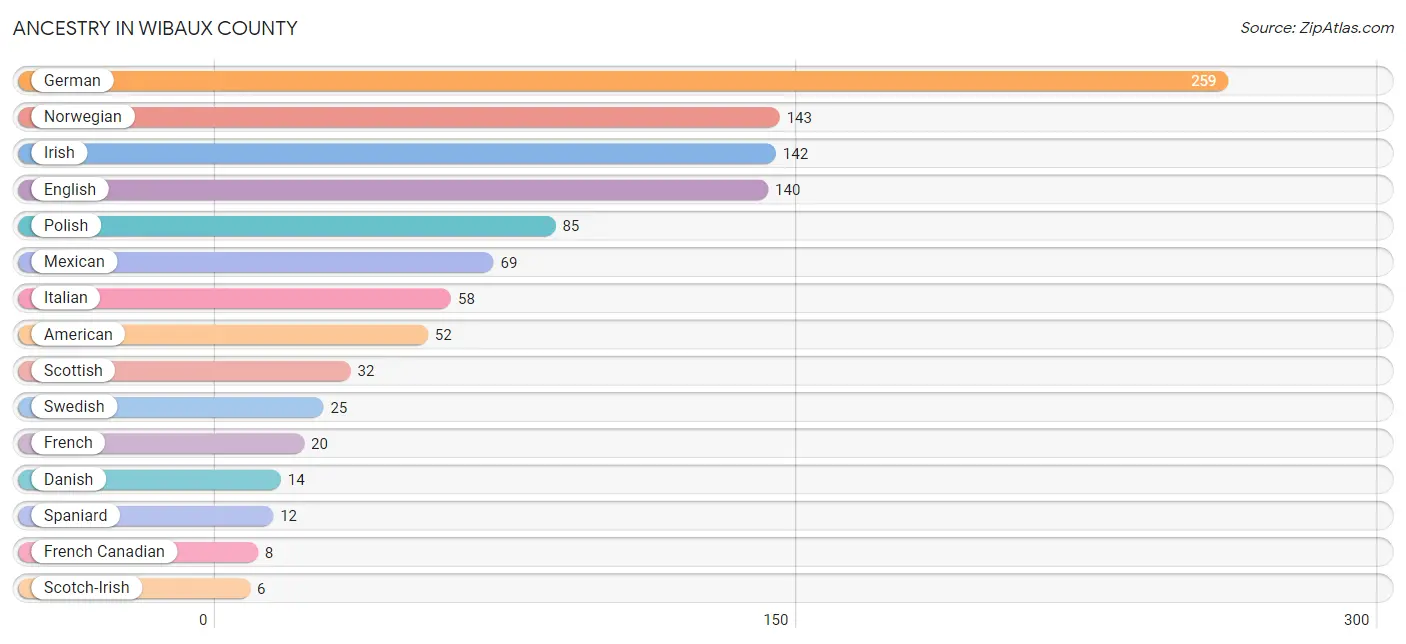
Ancestry in Wibaux County
The most populous ancestries reported in Wibaux County are German (259 | 23.2%), Norwegian (143 | 12.8%), Irish (142 | 12.7%), English (140 | 12.5%), and Polish (85 | 7.6%), together accounting for 68.7% of all Wibaux County residents.
| Ancestry | # Population | % Population |
| American | 52 | 4.6% |
| Belgian | 3 | 0.3% |
| Chippewa | 2 | 0.2% |
| Czech | 4 | 0.4% |
| Danish | 14 | 1.3% |
| English | 140 | 12.5% |
| Finnish | 3 | 0.3% |
| French | 20 | 1.8% |
| French Canadian | 8 | 0.7% |
| German | 259 | 23.2% |
| German Russian | 2 | 0.2% |
| Indian (Asian) | 3 | 0.3% |
| Irish | 142 | 12.7% |
| Italian | 58 | 5.2% |
| Mexican | 69 | 6.2% |
| Norwegian | 143 | 12.8% |
| Polish | 85 | 7.6% |
| Russian | 3 | 0.3% |
| Scotch-Irish | 6 | 0.5% |
| Scottish | 32 | 2.9% |
| Spaniard | 12 | 1.1% |
| Sri Lankan | 3 | 0.3% |
| Swedish | 25 | 2.2% |
| Ukrainian | 3 | 0.3% | View All 24 Rows |
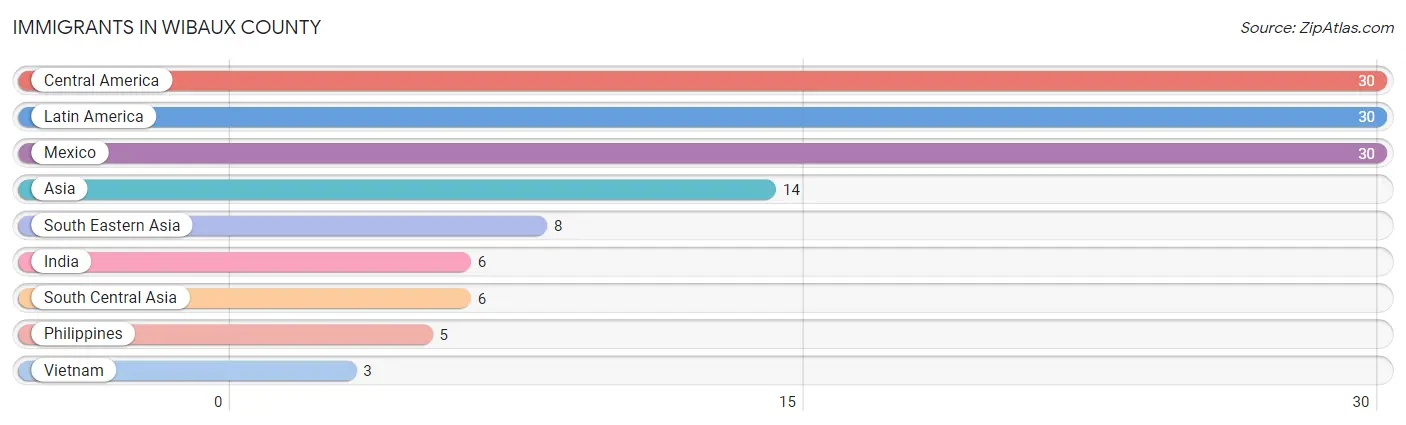
Immigrants in Wibaux County
The most numerous immigrant groups reported in Wibaux County came from Central America (30 | 2.7%), Latin America (30 | 2.7%), Mexico (30 | 2.7%), Asia (14 | 1.3%), and South Eastern Asia (8 | 0.7%), together accounting for 10.0% of all Wibaux County residents.
| Immigration Origin | # Population | % Population |
| Asia | 14 | 1.3% |
| Central America | 30 | 2.7% |
| India | 6 | 0.5% |
| Latin America | 30 | 2.7% |
| Mexico | 30 | 2.7% |
| Philippines | 5 | 0.4% |
| South Central Asia | 6 | 0.5% |
| South Eastern Asia | 8 | 0.7% |
| Vietnam | 3 | 0.3% | View All 9 Rows |
Sex and Age in Wibaux County
Sex and Age in Wibaux County
The most populous age groups in Wibaux County are 50 to 54 Years (57 | 10.5%) for men and 60 to 64 Years (67 | 11.6%) for women.
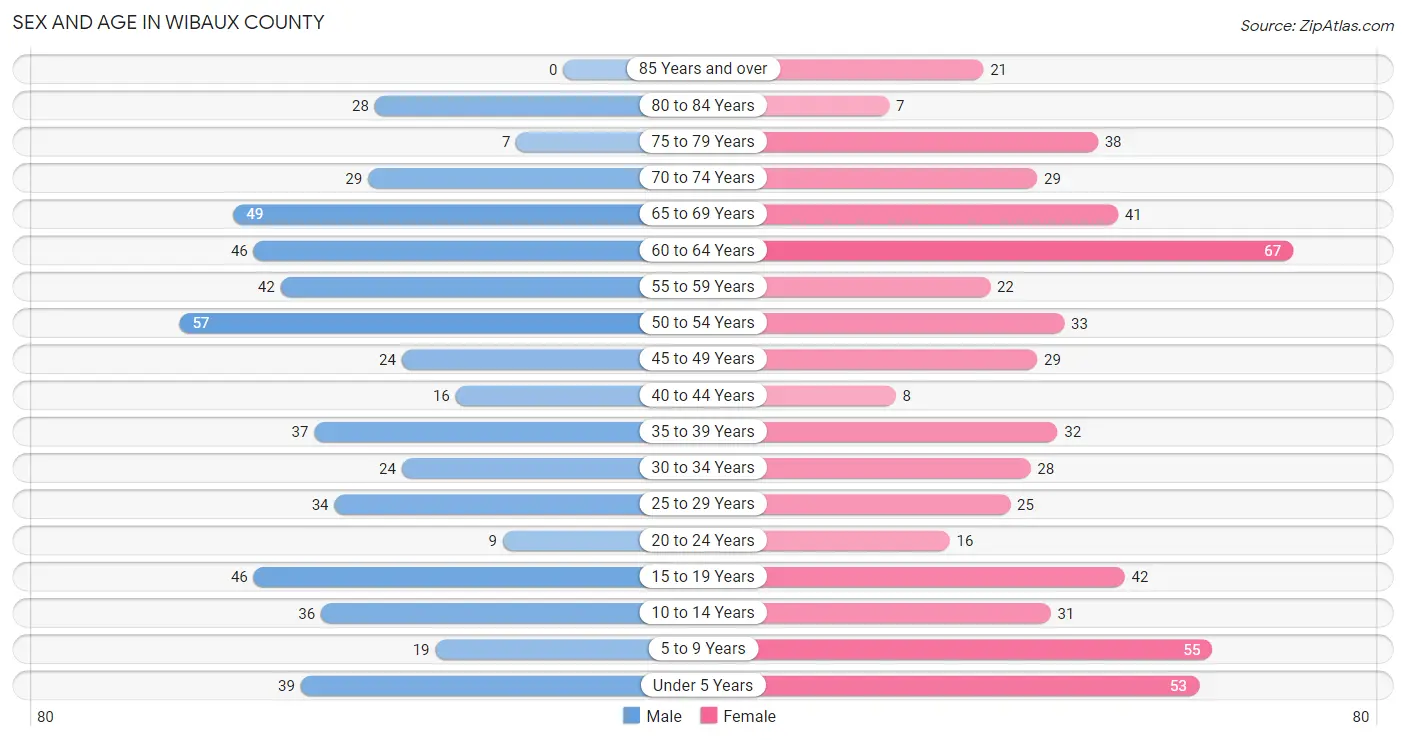
| Age Bracket | Male | Female |
| Under 5 Years | 39 (7.2%) | 53 (9.2%) |
| 5 to 9 Years | 19 (3.5%) | 55 (9.5%) |
| 10 to 14 Years | 36 (6.6%) | 31 (5.4%) |
| 15 to 19 Years | 46 (8.5%) | 42 (7.3%) |
| 20 to 24 Years | 9 (1.7%) | 16 (2.8%) |
| 25 to 29 Years | 34 (6.3%) | 25 (4.3%) |
| 30 to 34 Years | 24 (4.4%) | 28 (4.9%) |
| 35 to 39 Years | 37 (6.8%) | 32 (5.6%) |
| 40 to 44 Years | 16 (2.9%) | 8 (1.4%) |
| 45 to 49 Years | 24 (4.4%) | 29 (5.0%) |
| 50 to 54 Years | 57 (10.5%) | 33 (5.7%) |
| 55 to 59 Years | 42 (7.7%) | 22 (3.8%) |
| 60 to 64 Years | 46 (8.5%) | 67 (11.6%) |
| 65 to 69 Years | 49 (9.0%) | 41 (7.1%) |
| 70 to 74 Years | 29 (5.3%) | 29 (5.0%) |
| 75 to 79 Years | 7 (1.3%) | 38 (6.6%) |
| 80 to 84 Years | 28 (5.2%) | 7 (1.2%) |
| 85 Years and over | 0 (0.0%) | 21 (3.6%) |
| Total | 542 (100.0%) | 577 (100.0%) |
Families and Households in Wibaux County
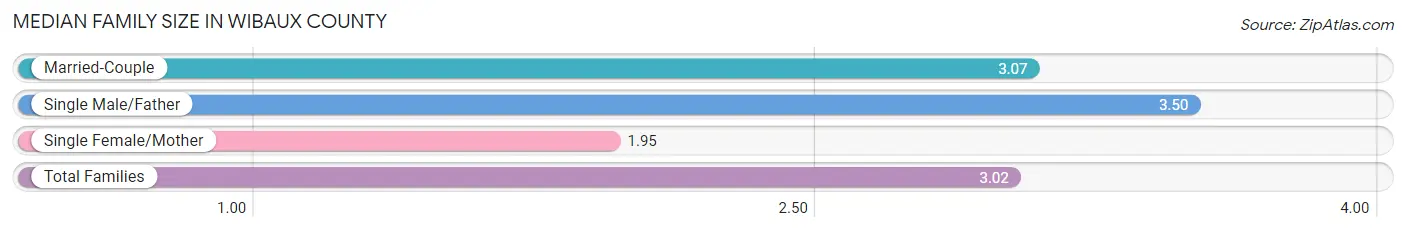
Median Family Size in Wibaux County
The median family size in Wibaux County is 3.02 persons per family, with single male/father families (12 | 4.2%) accounting for the largest median family size of 3.5 persons per family. On the other hand, single female/mother families (19 | 6.6%) represent the smallest median family size with 1.95 persons per family.
| Family Type | # Families | Family Size |
| Married-Couple | 257 (89.2%) | 3.07 |
| Single Male/Father | 12 (4.2%) | 3.50 |
| Single Female/Mother | 19 (6.6%) | 1.95 |
| Total Families | 288 (100.0%) | 3.02 |
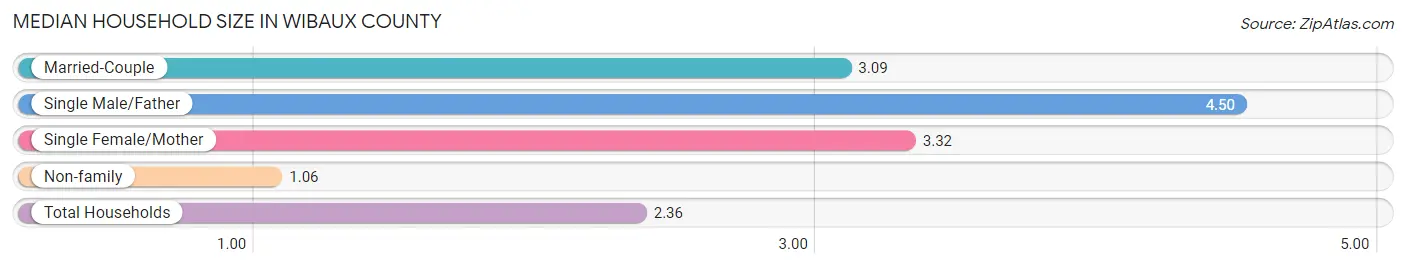
Median Household Size in Wibaux County
The median household size in Wibaux County is 2.36 persons per household, with single male/father households (12 | 2.6%) accounting for the largest median household size of 4.5 persons per household. non-family households (178 | 38.2%) represent the smallest median household size with 1.06 persons per household.
| Household Type | # Households | Household Size |
| Married-Couple | 257 (55.1%) | 3.09 |
| Single Male/Father | 12 (2.6%) | 4.50 |
| Single Female/Mother | 19 (4.1%) | 3.32 |
| Non-family | 178 (38.2%) | 1.06 |
| Total Households | 466 (100.0%) | 2.36 |
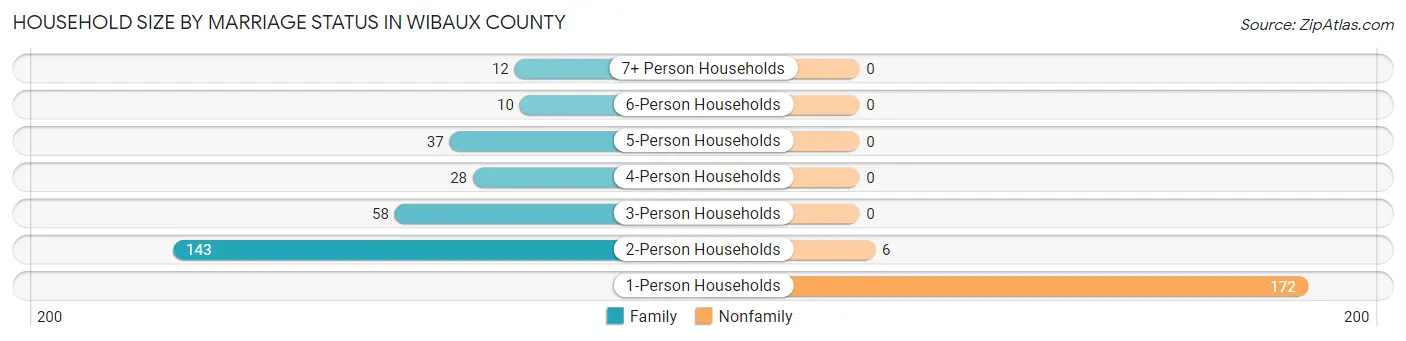
Household Size by Marriage Status in Wibaux County
Out of a total of 466 households in Wibaux County, 288 (61.8%) are family households, while 178 (38.2%) are nonfamily households. The most numerous type of family households are 2-person households, comprising 143, and the most common type of nonfamily households are 1-person households, comprising 172.
| Household Size | Family Households | Nonfamily Households |
| 1-Person Households | - | 172 (36.9%) |
| 2-Person Households | 143 (30.7%) | 6 (1.3%) |
| 3-Person Households | 58 (12.4%) | 0 (0.0%) |
| 4-Person Households | 28 (6.0%) | 0 (0.0%) |
| 5-Person Households | 37 (7.9%) | 0 (0.0%) |
| 6-Person Households | 10 (2.1%) | 0 (0.0%) |
| 7+ Person Households | 12 (2.6%) | 0 (0.0%) |
| Total | 288 (61.8%) | 178 (38.2%) |
Female Fertility in Wibaux County
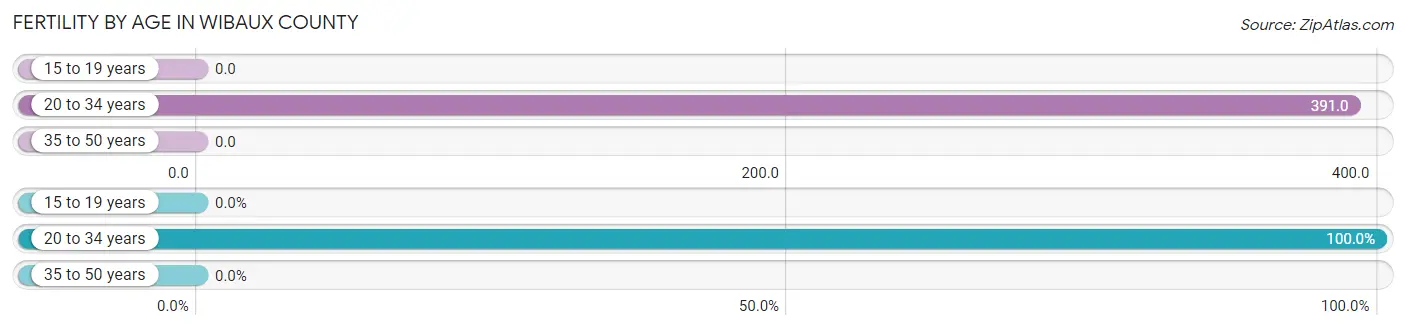
Fertility by Age in Wibaux County
Average fertility rate in Wibaux County is 150.0 births per 1,000 women. Women in the age bracket of 20 to 34 years have the highest fertility rate with 391.0 births per 1,000 women. Women in the age bracket of 20 to 34 years acount for 100.0% of all women with births.
| Age Bracket | Women with Births | Births / 1,000 Women |
| 15 to 19 years | 0 (0.0%) | 0.0 |
| 20 to 34 years | 27 (100.0%) | 391.0 |
| 35 to 50 years | 0 (0.0%) | 0.0 |
| Total | 27 (100.0%) | 150.0 |
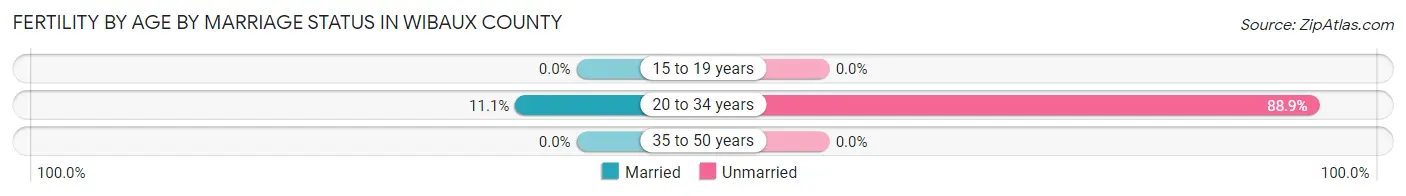
Fertility by Age by Marriage Status in Wibaux County
11.1% of women with births (27) in Wibaux County are married. The highest percentage of unmarried women with births falls into 20 to 34 years age bracket with 88.9% of them unmarried at the time of birth, while the lowest percentage of unmarried women with births belong to 20 to 34 years age bracket with 88.9% of them unmarried.
| Age Bracket | Married | Unmarried |
| 15 to 19 years | 0 (0.0%) | 0 (0.0%) |
| 20 to 34 years | 3 (11.1%) | 24 (88.9%) |
| 35 to 50 years | 0 (0.0%) | 0 (0.0%) |
| Total | 3 (11.1%) | 24 (88.9%) |
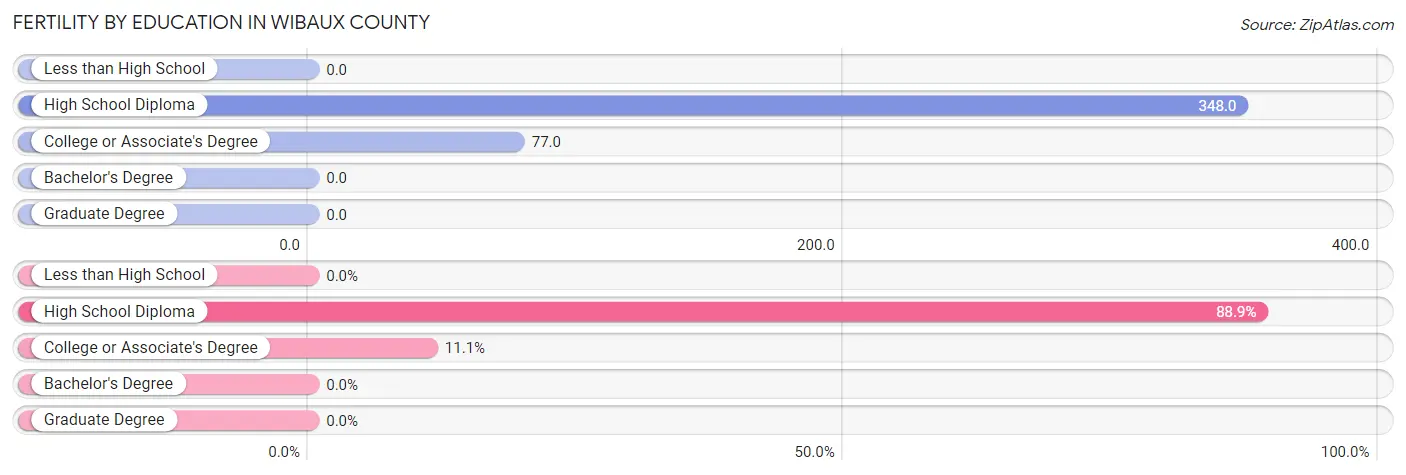
Fertility by Education in Wibaux County
| Educational Attainment | Women with Births | Births / 1,000 Women |
| Less than High School | 0 (0.0%) | 0.0 |
| High School Diploma | 24 (88.9%) | 348.0 |
| College or Associate's Degree | 3 (11.1%) | 77.0 |
| Bachelor's Degree | 0 (0.0%) | 0.0 |
| Graduate Degree | 0 (0.0%) | 0.0 |
| Total | 27 (100.0%) | 150.0 |
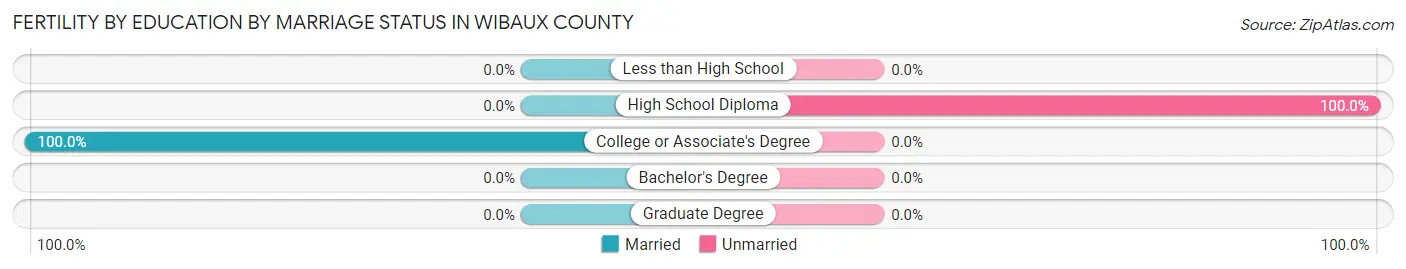
Fertility by Education by Marriage Status in Wibaux County
88.9% of women with births in Wibaux County are unmarried. Women with the educational attainment of college or associate's degree are most likely to be married with 100.0% of them married at childbirth, while women with the educational attainment of high school diploma are least likely to be married with 100.0% of them unmarried at childbirth.
| Educational Attainment | Married | Unmarried |
| Less than High School | 0 (0.0%) | 0 (0.0%) |
| High School Diploma | 0 (0.0%) | 24 (100.0%) |
| College or Associate's Degree | 3 (100.0%) | 0 (0.0%) |
| Bachelor's Degree | 0 (0.0%) | 0 (0.0%) |
| Graduate Degree | 0 (0.0%) | 0 (0.0%) |
| Total | 3 (11.1%) | 24 (88.9%) |
Income in Wibaux County
Income Overview in Wibaux County
Per Capita Income in Wibaux County is $31,089, while median incomes of families and households are $90,000 and $58,750 respectively.
| Characteristic | Number | Measure |
| Per Capita Income | 1,119 | $31,089 |
| Median Family Income | 288 | $90,000 |
| Mean Family Income | 288 | $88,872 |
| Median Household Income | 466 | $58,750 |
| Mean Household Income | 466 | $74,288 |
| Income Deficit | 288 | $0 |
| Wage / Income Gap (%) | 1,119 | 47.94% |
| Wage / Income Gap ($) | 1,119 | 52.06¢ per $1 |
| Gini / Inequality Index | 1,119 | 0.41 |
Earnings by Sex in Wibaux County
Average Earnings in Wibaux County are $43,158, $56,146 for men and $29,228 for women, a difference of 47.9%.
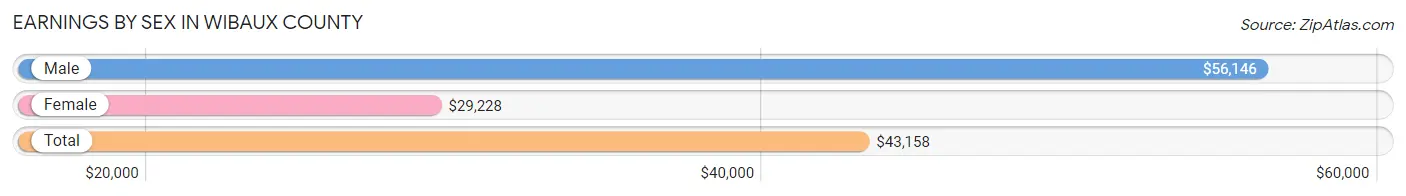
| Sex | Number | Average Earnings |
| Male | 321 (55.9%) | $56,146 |
| Female | 253 (44.1%) | $29,228 |
| Total | 574 (100.0%) | $43,158 |
Earnings by Sex by Income Bracket in Wibaux County
The most common earnings brackets in Wibaux County are $55,000 to $64,999 for men (60 | 18.7%) and $25,000 to $29,999 for women (39 | 15.4%).
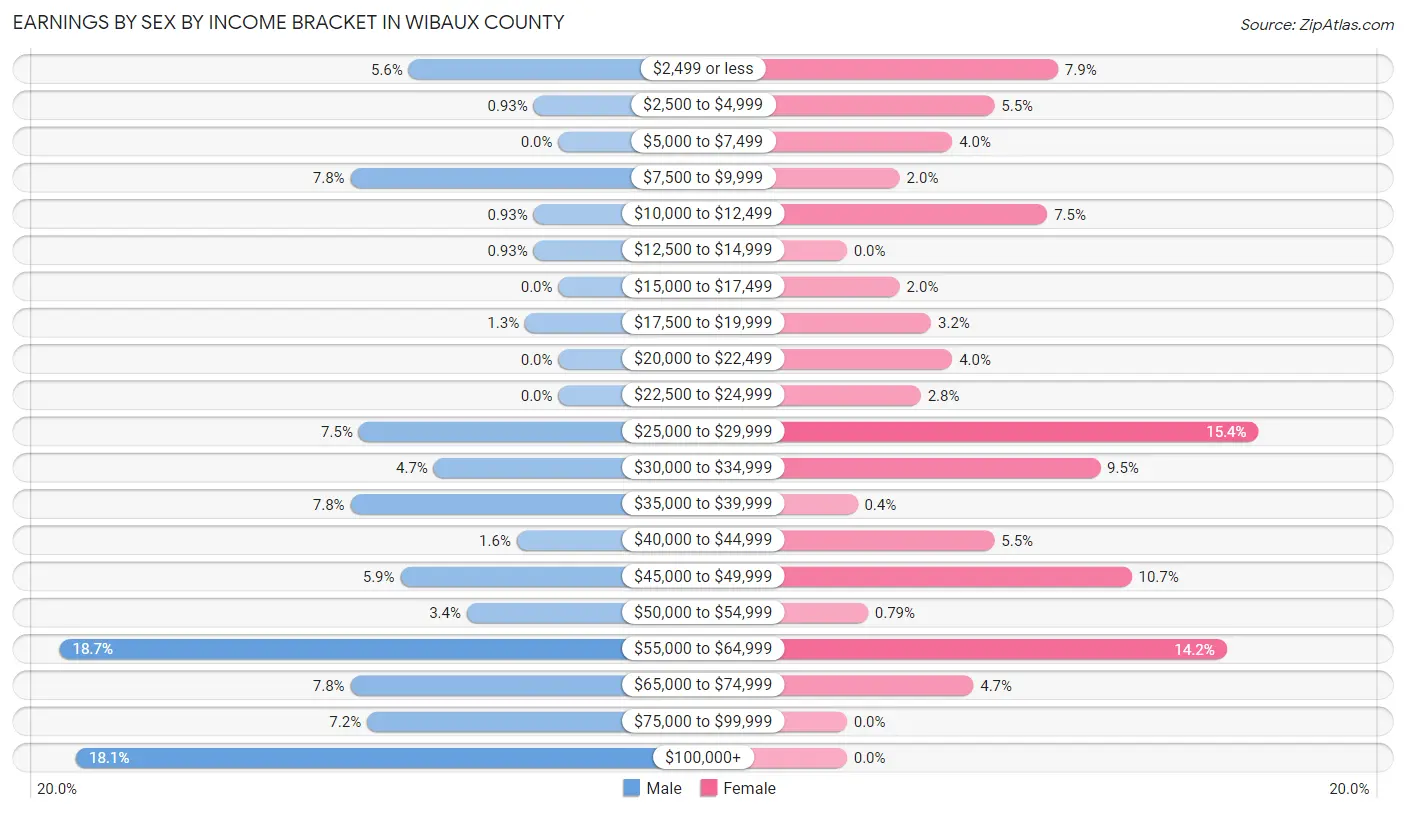
| Income | Male | Female |
| $2,499 or less | 18 (5.6%) | 20 (7.9%) |
| $2,500 to $4,999 | 3 (0.9%) | 14 (5.5%) |
| $5,000 to $7,499 | 0 (0.0%) | 10 (4.0%) |
| $7,500 to $9,999 | 25 (7.8%) | 5 (2.0%) |
| $10,000 to $12,499 | 3 (0.9%) | 19 (7.5%) |
| $12,500 to $14,999 | 3 (0.9%) | 0 (0.0%) |
| $15,000 to $17,499 | 0 (0.0%) | 5 (2.0%) |
| $17,500 to $19,999 | 4 (1.3%) | 8 (3.2%) |
| $20,000 to $22,499 | 0 (0.0%) | 10 (4.0%) |
| $22,500 to $24,999 | 0 (0.0%) | 7 (2.8%) |
| $25,000 to $29,999 | 24 (7.5%) | 39 (15.4%) |
| $30,000 to $34,999 | 15 (4.7%) | 24 (9.5%) |
| $35,000 to $39,999 | 25 (7.8%) | 1 (0.4%) |
| $40,000 to $44,999 | 5 (1.6%) | 14 (5.5%) |
| $45,000 to $49,999 | 19 (5.9%) | 27 (10.7%) |
| $50,000 to $54,999 | 11 (3.4%) | 2 (0.8%) |
| $55,000 to $64,999 | 60 (18.7%) | 36 (14.2%) |
| $65,000 to $74,999 | 25 (7.8%) | 12 (4.7%) |
| $75,000 to $99,999 | 23 (7.2%) | 0 (0.0%) |
| $100,000+ | 58 (18.1%) | 0 (0.0%) |
| Total | 321 (100.0%) | 253 (100.0%) |
Earnings by Sex by Educational Attainment in Wibaux County
Average earnings in Wibaux County are $60,391 for men and $30,096 for women, a difference of 50.2%. Men with an educational attainment of bachelor's degree enjoy the highest average annual earnings of $118,594, while those with less than high school education earn the least with $49,375. Women with an educational attainment of graduate degree earn the most with the average annual earnings of $65,208, while those with high school diploma education have the smallest earnings of $28,792.
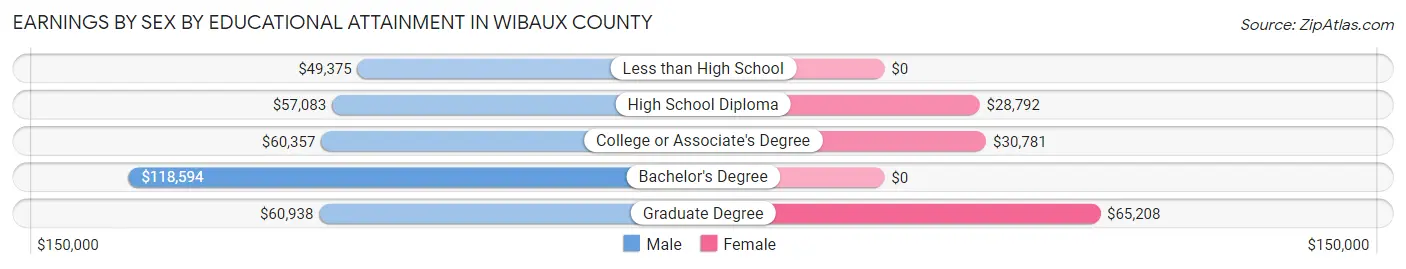
| Educational Attainment | Male Income | Female Income |
| Less than High School | $49,375 | $0 |
| High School Diploma | $57,083 | $28,792 |
| College or Associate's Degree | $60,357 | $30,781 |
| Bachelor's Degree | $118,594 | $0 |
| Graduate Degree | $60,938 | $65,208 |
| Total | $60,391 | $30,096 |
Family Income in Wibaux County
Family Income Brackets in Wibaux County
According to the Wibaux County family income data, there are 99 families falling into the $100,000 to $149,999 income range, which is the most common income bracket and makes up 34.4% of all families. Conversely, the less than $10,000 income bracket is the least frequent group with only 10 families (3.5%) belonging to this category.
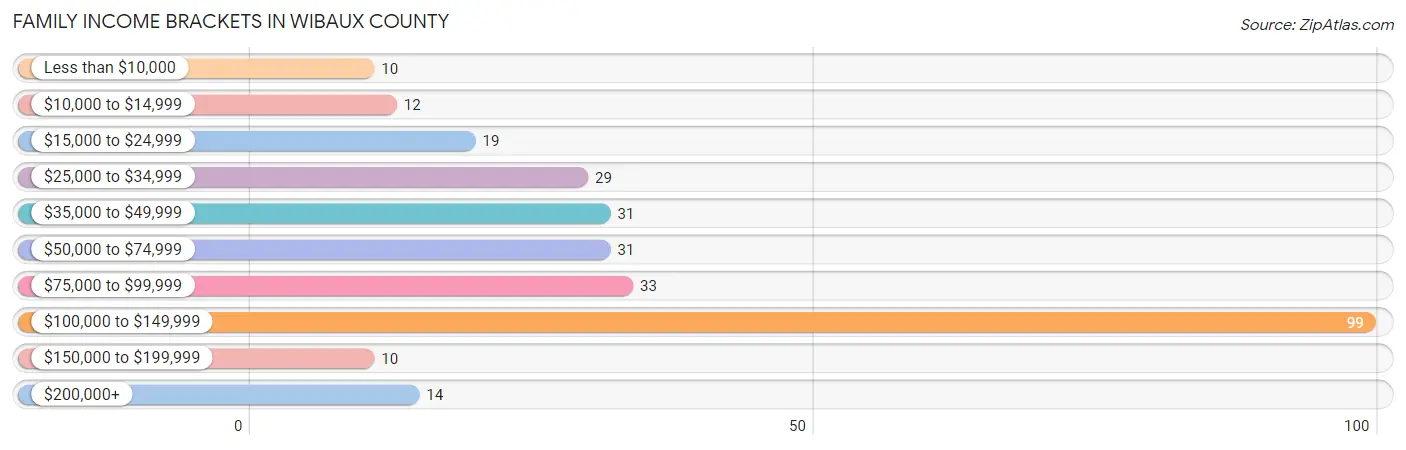
| Income Bracket | # Families | % Families |
| Less than $10,000 | 10 | 3.5% |
| $10,000 to $14,999 | 12 | 4.2% |
| $15,000 to $24,999 | 19 | 6.6% |
| $25,000 to $34,999 | 29 | 10.1% |
| $35,000 to $49,999 | 31 | 10.8% |
| $50,000 to $74,999 | 31 | 10.8% |
| $75,000 to $99,999 | 33 | 11.5% |
| $100,000 to $149,999 | 99 | 34.4% |
| $150,000 to $199,999 | 10 | 3.5% |
| $200,000+ | 14 | 4.9% |
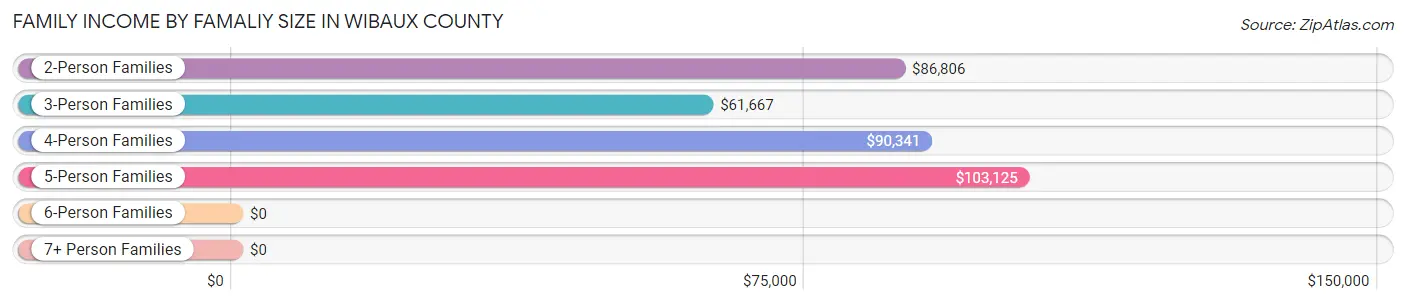
Family Income by Famaliy Size in Wibaux County
5-person families (22 | 7.6%) account for the highest median family income in Wibaux County with $103,125 per family, while 2-person families (157 | 54.5%) have the highest median income of $43,403 per family member.
| Income Bracket | # Families | Median Income |
| 2-Person Families | 157 (54.5%) | $86,806 |
| 3-Person Families | 44 (15.3%) | $61,667 |
| 4-Person Families | 43 (14.9%) | $90,341 |
| 5-Person Families | 22 (7.6%) | $103,125 |
| 6-Person Families | 10 (3.5%) | $0 |
| 7+ Person Families | 12 (4.2%) | $0 |
| Total | 288 (100.0%) | $90,000 |
Family Income by Number of Earners in Wibaux County
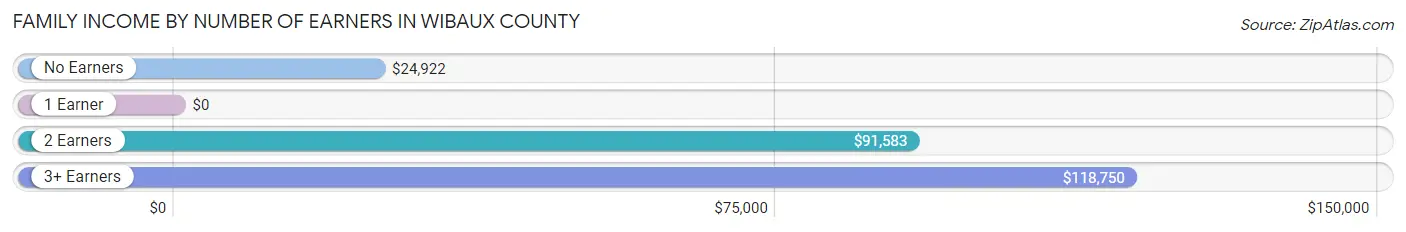
| Number of Earners | # Families | Median Income |
| No Earners | 31 (10.8%) | $24,922 |
| 1 Earner | 86 (29.9%) | $0 |
| 2 Earners | 141 (49.0%) | $91,583 |
| 3+ Earners | 30 (10.4%) | $118,750 |
| Total | 288 (100.0%) | $90,000 |
Household Income in Wibaux County
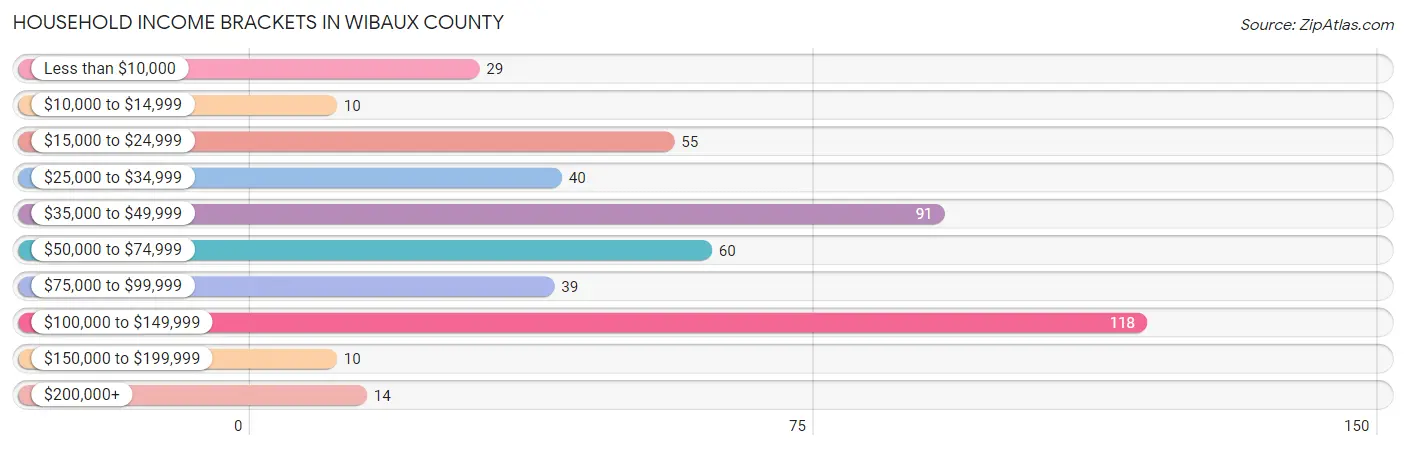
Household Income Brackets in Wibaux County
With 118 households falling in the category, the $100,000 to $149,999 income range is the most frequent in Wibaux County, accounting for 25.3% of all households. In contrast, only 10 households (2.1%) fall into the $10,000 to $14,999 income bracket, making it the least populous group.
| Income Bracket | # Households | % Households |
| Less than $10,000 | 29 | 6.2% |
| $10,000 to $14,999 | 10 | 2.1% |
| $15,000 to $24,999 | 55 | 11.8% |
| $25,000 to $34,999 | 40 | 8.6% |
| $35,000 to $49,999 | 91 | 19.5% |
| $50,000 to $74,999 | 60 | 12.9% |
| $75,000 to $99,999 | 39 | 8.4% |
| $100,000 to $149,999 | 118 | 25.3% |
| $150,000 to $199,999 | 10 | 2.1% |
| $200,000+ | 14 | 3.0% |
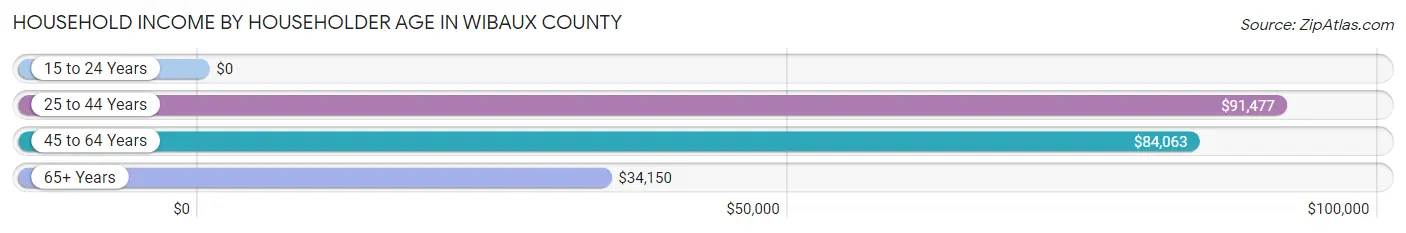
Household Income by Householder Age in Wibaux County
The median household income in Wibaux County is $58,750, with the highest median household income of $91,477 found in the 25 to 44 years age bracket for the primary householder. A total of 95 households (20.4%) fall into this category. Meanwhile, the 15 to 24 years age bracket for the primary householder has the lowest median household income of $0, with 21 households (4.5%) in this group.
| Income Bracket | # Households | Median Income |
| 15 to 24 Years | 21 (4.5%) | $0 |
| 25 to 44 Years | 95 (20.4%) | $91,477 |
| 45 to 64 Years | 187 (40.1%) | $84,063 |
| 65+ Years | 163 (35.0%) | $34,150 |
| Total | 466 (100.0%) | $58,750 |
Poverty in Wibaux County
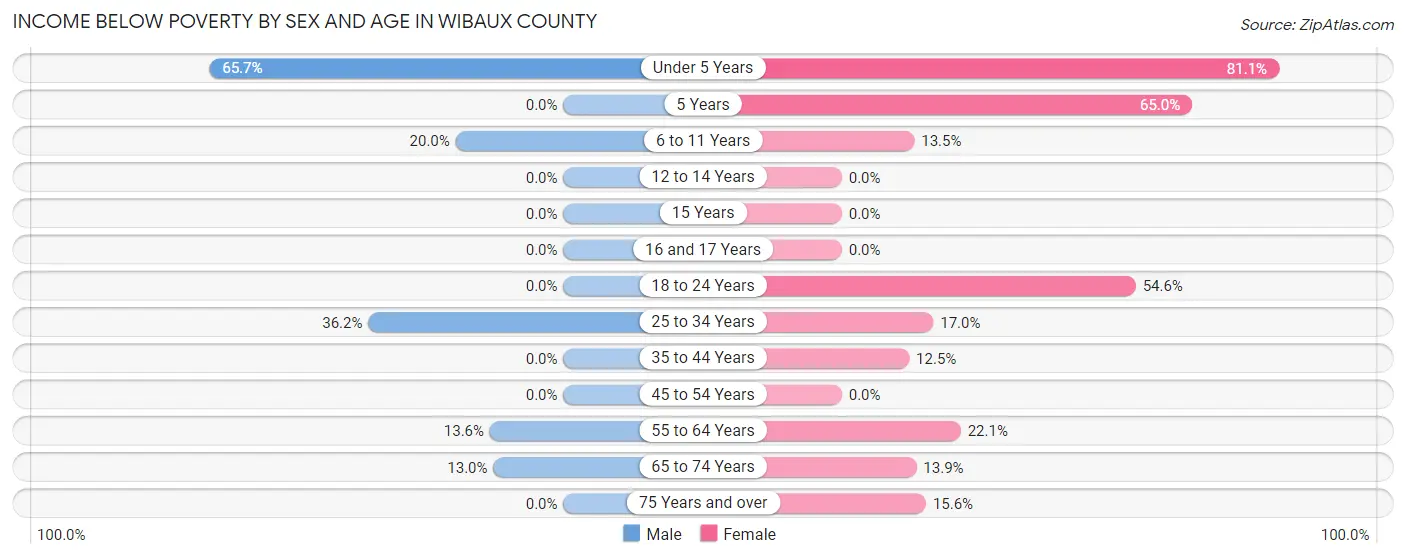
Income Below Poverty by Sex and Age in Wibaux County
With 13.0% poverty level for males and 22.4% for females among the residents of Wibaux County, under 5 year old males and under 5 year old females are the most vulnerable to poverty, with 23 males (65.7%) and 43 females (81.1%) in their respective age groups living below the poverty level.
| Age Bracket | Male | Female |
| Under 5 Years | 23 (65.7%) | 43 (81.1%) |
| 5 Years | 0 (0.0%) | 13 (65.0%) |
| 6 to 11 Years | 4 (20.0%) | 7 (13.5%) |
| 12 to 14 Years | 0 (0.0%) | 0 (0.0%) |
| 15 Years | 0 (0.0%) | 0 (0.0%) |
| 16 and 17 Years | 0 (0.0%) | 0 (0.0%) |
| 18 to 24 Years | 0 (0.0%) | 12 (54.5%) |
| 25 to 34 Years | 21 (36.2%) | 9 (17.0%) |
| 35 to 44 Years | 0 (0.0%) | 5 (12.5%) |
| 45 to 54 Years | 0 (0.0%) | 0 (0.0%) |
| 55 to 64 Years | 12 (13.6%) | 17 (22.1%) |
| 65 to 74 Years | 10 (13.0%) | 9 (13.9%) |
| 75 Years and over | 0 (0.0%) | 10 (15.6%) |
| Total | 70 (13.0%) | 125 (22.4%) |
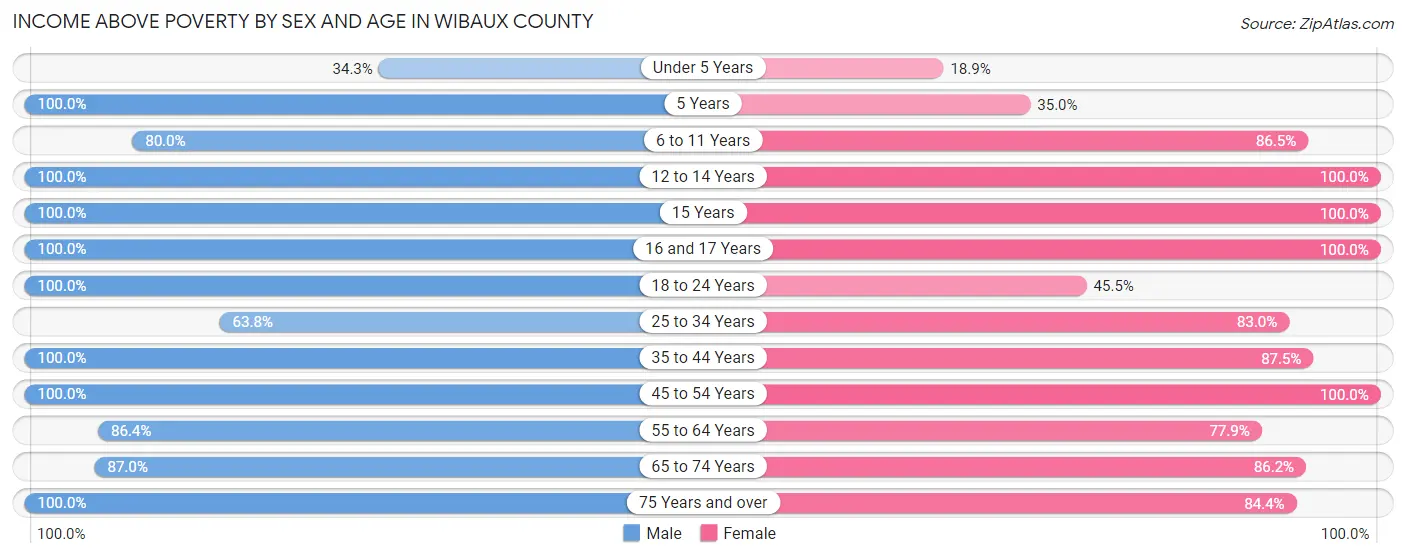
Income Above Poverty by Sex and Age in Wibaux County
According to the poverty statistics in Wibaux County, males aged 5 years and females aged 12 to 14 years are the age groups that are most secure financially, with 100.0% of males and 100.0% of females in these age groups living above the poverty line.
| Age Bracket | Male | Female |
| Under 5 Years | 12 (34.3%) | 10 (18.9%) |
| 5 Years | 3 (100.0%) | 7 (35.0%) |
| 6 to 11 Years | 16 (80.0%) | 45 (86.5%) |
| 12 to 14 Years | 32 (100.0%) | 14 (100.0%) |
| 15 Years | 18 (100.0%) | 27 (100.0%) |
| 16 and 17 Years | 12 (100.0%) | 9 (100.0%) |
| 18 to 24 Years | 25 (100.0%) | 10 (45.5%) |
| 25 to 34 Years | 37 (63.8%) | 44 (83.0%) |
| 35 to 44 Years | 53 (100.0%) | 35 (87.5%) |
| 45 to 54 Years | 81 (100.0%) | 62 (100.0%) |
| 55 to 64 Years | 76 (86.4%) | 60 (77.9%) |
| 65 to 74 Years | 67 (87.0%) | 56 (86.2%) |
| 75 Years and over | 35 (100.0%) | 54 (84.4%) |
| Total | 467 (87.0%) | 433 (77.6%) |
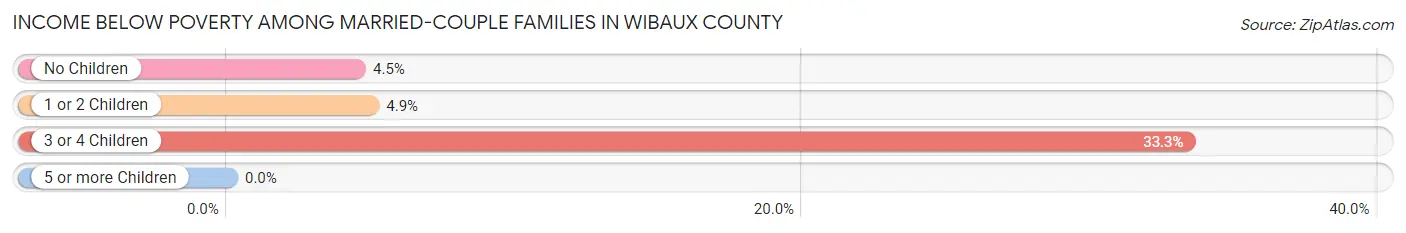
Income Below Poverty Among Married-Couple Families in Wibaux County
The poverty statistics for married-couple families in Wibaux County show that 8.9% or 23 of the total 257 families live below the poverty line. Families with 3 or 4 children have the highest poverty rate of 33.3%, comprising of 13 families. On the other hand, families with no children have the lowest poverty rate of 4.5%, which includes 7 families.
| Children | Above Poverty | Below Poverty |
| No Children | 150 (95.5%) | 7 (4.5%) |
| 1 or 2 Children | 58 (95.1%) | 3 (4.9%) |
| 3 or 4 Children | 26 (66.7%) | 13 (33.3%) |
| 5 or more Children | 0 (0.0%) | 0 (0.0%) |
| Total | 234 (91.0%) | 23 (8.9%) |
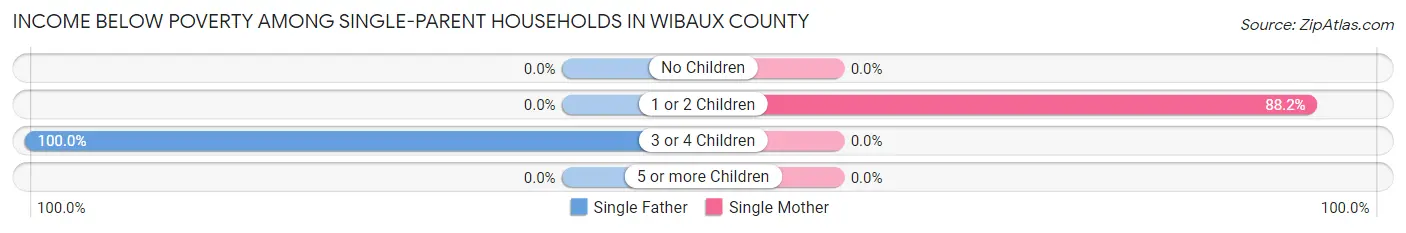
Income Below Poverty Among Single-Parent Households in Wibaux County
According to the poverty data in Wibaux County, 75.0% or 9 single-father households and 78.9% or 15 single-mother households are living below the poverty line. Among single-father households, those with 3 or 4 children have the highest poverty rate, with 9 households (100.0%) experiencing poverty. Likewise, among single-mother households, those with 1 or 2 children have the highest poverty rate, with 15 households (88.2%) falling below the poverty line.
| Children | Single Father | Single Mother |
| No Children | 0 (0.0%) | 0 (0.0%) |
| 1 or 2 Children | 0 (0.0%) | 15 (88.2%) |
| 3 or 4 Children | 9 (100.0%) | 0 (0.0%) |
| 5 or more Children | 0 (0.0%) | 0 (0.0%) |
| Total | 9 (75.0%) | 15 (78.9%) |
Income Below Poverty Among Married-Couple vs Single-Parent Households in Wibaux County
The poverty data for Wibaux County shows that 23 of the married-couple family households (8.9%) and 24 of the single-parent households (77.4%) are living below the poverty level. Within the married-couple family households, those with 3 or 4 children have the highest poverty rate, with 13 households (33.3%) falling below the poverty line. Among the single-parent households, those with 3 or 4 children have the highest poverty rate, with 9 household (100.0%) living below poverty.
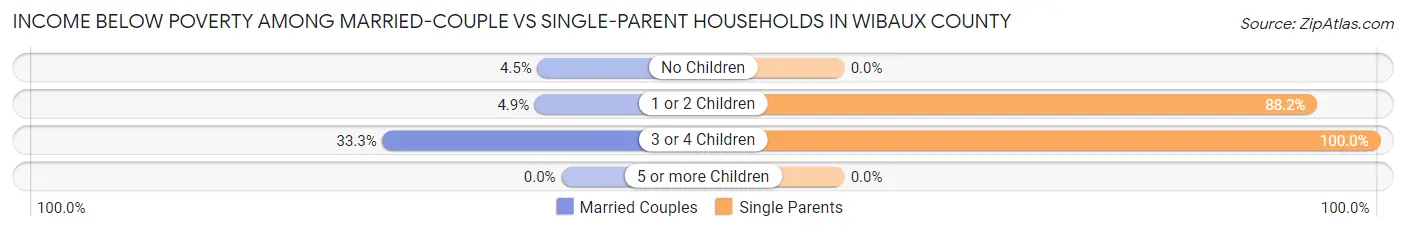
| Children | Married-Couple Families | Single-Parent Households |
| No Children | 7 (4.5%) | 0 (0.0%) |
| 1 or 2 Children | 3 (4.9%) | 15 (88.2%) |
| 3 or 4 Children | 13 (33.3%) | 9 (100.0%) |
| 5 or more Children | 0 (0.0%) | 0 (0.0%) |
| Total | 23 (8.9%) | 24 (77.4%) |
Employment Characteristics in Wibaux County
Employment by Class of Employer in Wibaux County
Among the 489 employed individuals in Wibaux County, private company employees (215 | 44.0%), self-employed (not incorporated) (85 | 17.4%), and local government employees (81 | 16.6%) make up the most common classes of employment.
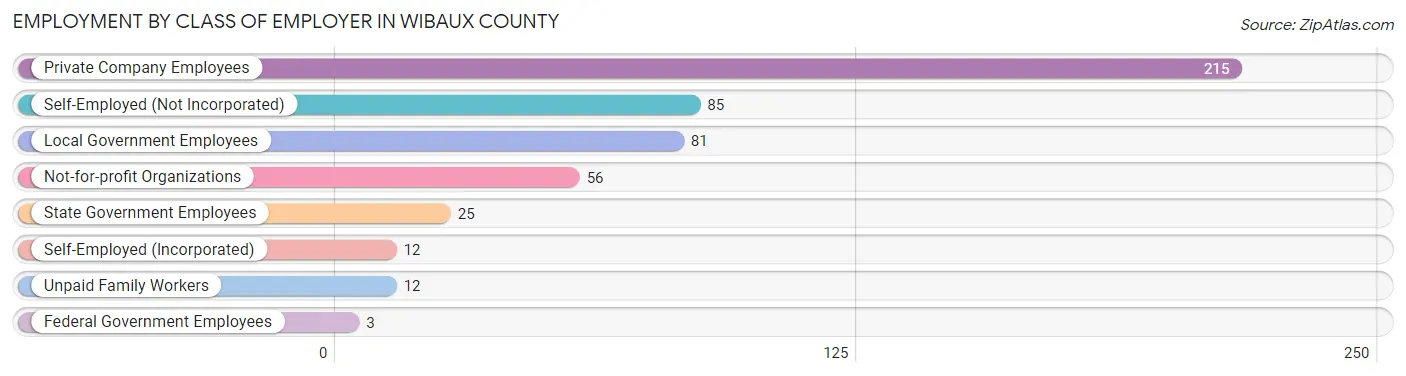
| Employer Class | # Employees | % Employees |
| Private Company Employees | 215 | 44.0% |
| Self-Employed (Incorporated) | 12 | 2.5% |
| Self-Employed (Not Incorporated) | 85 | 17.4% |
| Not-for-profit Organizations | 56 | 11.5% |
| Local Government Employees | 81 | 16.6% |
| State Government Employees | 25 | 5.1% |
| Federal Government Employees | 3 | 0.6% |
| Unpaid Family Workers | 12 | 2.5% |
| Total | 489 | 100.0% |
Employment Status by Age in Wibaux County
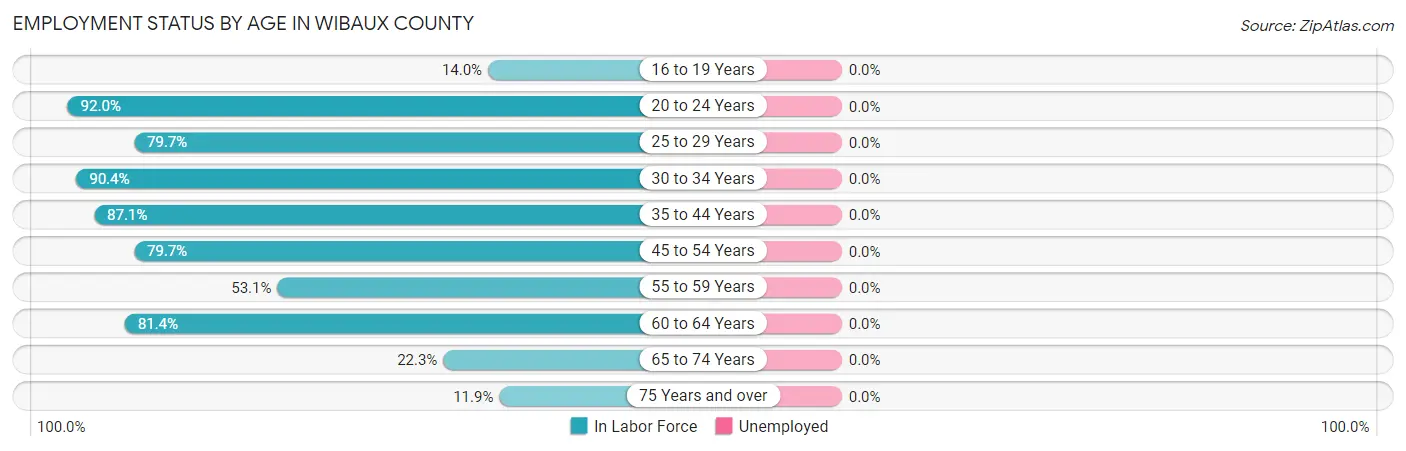
| Age Bracket | In Labor Force | Unemployed |
| 16 to 19 Years | 6 (14.0%) | 0 (0.0%) |
| 20 to 24 Years | 23 (92.0%) | 0 (0.0%) |
| 25 to 29 Years | 47 (79.7%) | 0 (0.0%) |
| 30 to 34 Years | 47 (90.4%) | 0 (0.0%) |
| 35 to 44 Years | 81 (87.1%) | 0 (0.0%) |
| 45 to 54 Years | 114 (79.7%) | 0 (0.0%) |
| 55 to 59 Years | 34 (53.1%) | 0 (0.0%) |
| 60 to 64 Years | 92 (81.4%) | 0 (0.0%) |
| 65 to 74 Years | 33 (22.3%) | 0 (0.0%) |
| 75 Years and over | 12 (11.9%) | 0 (0.0%) |
| Total | 489 (58.1%) | 0 (0.0%) |
Employment Status by Educational Attainment in Wibaux County
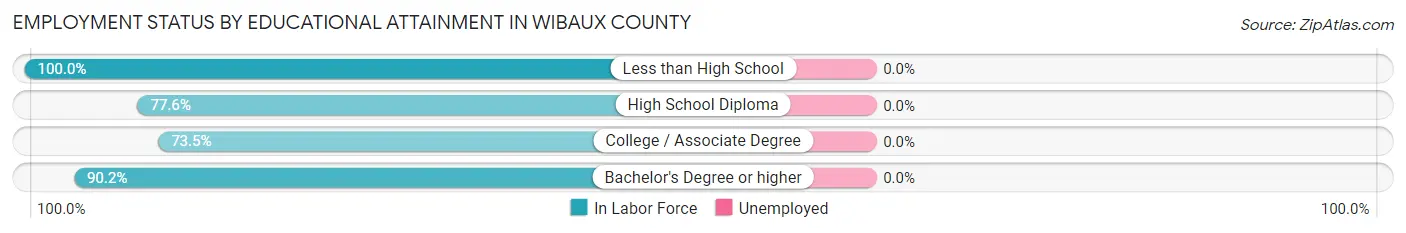
| Educational Attainment | In Labor Force | Unemployed |
| Less than High School | 8 (100.0%) | 0 (0.0%) |
| High School Diploma | 170 (77.6%) | 0 (0.0%) |
| College / Associate Degree | 136 (73.5%) | 0 (0.0%) |
| Bachelor's Degree or higher | 101 (90.2%) | 0 (0.0%) |
| Total | 415 (79.2%) | 0 (0.0%) |
Employment Occupations by Sex in Wibaux County
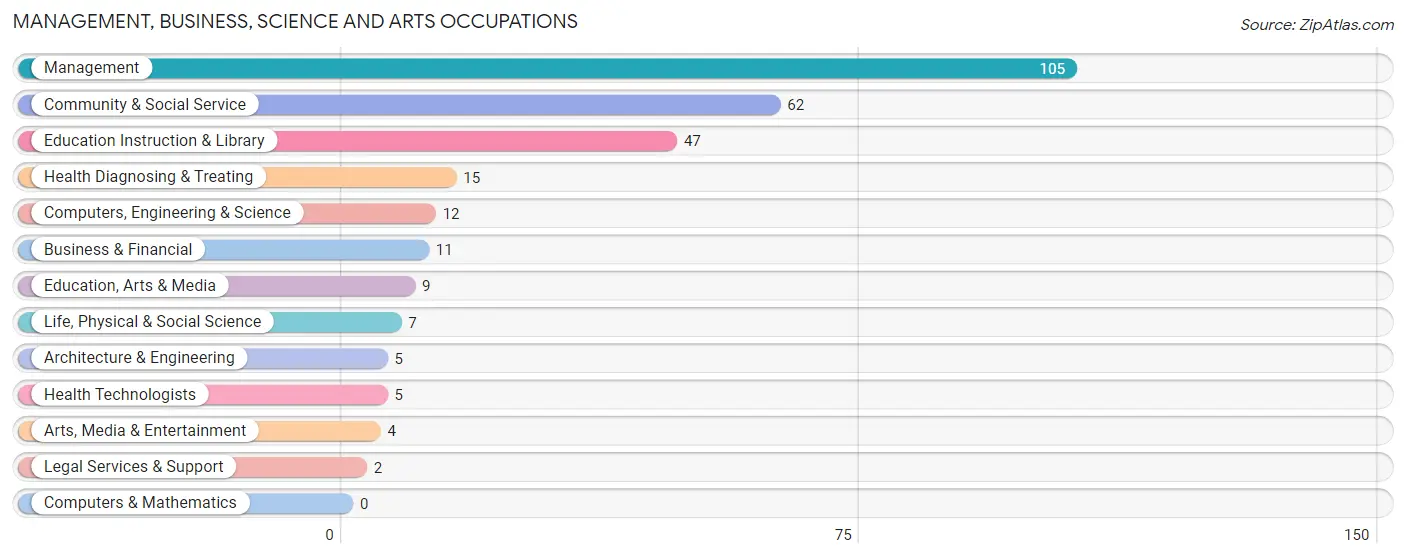
Management, Business, Science and Arts Occupations
The most common Management, Business, Science and Arts occupations in Wibaux County are Management (105 | 21.5%), Community & Social Service (62 | 12.7%), Education Instruction & Library (47 | 9.6%), Health Diagnosing & Treating (15 | 3.1%), and Computers, Engineering & Science (12 | 2.5%).
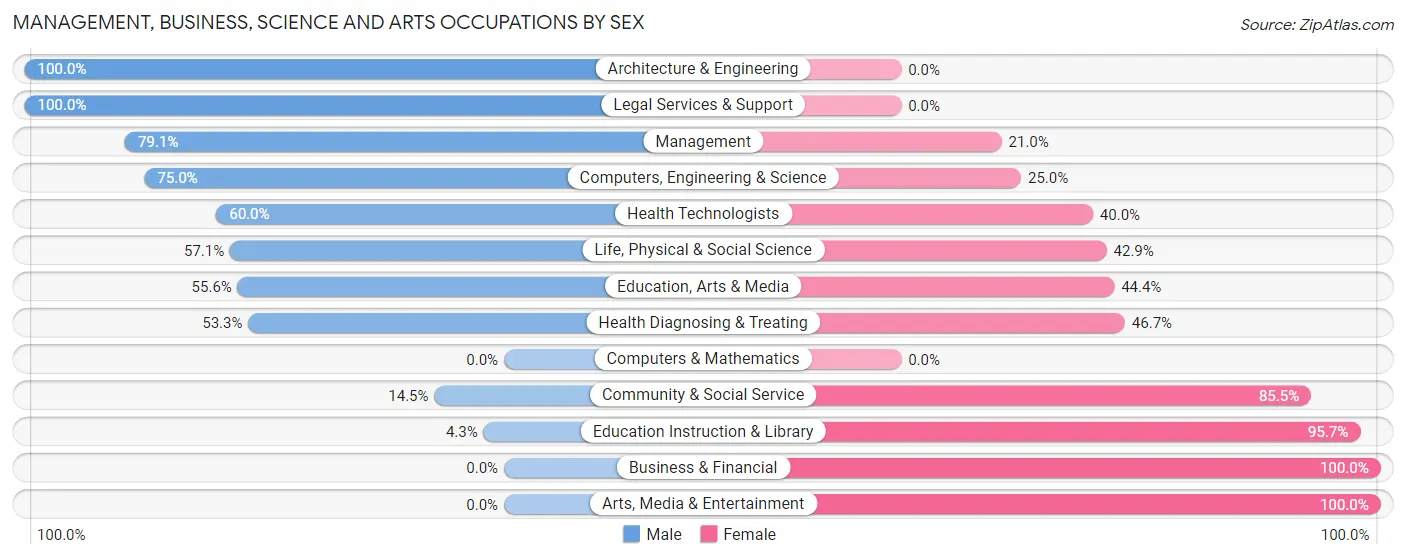
Management, Business, Science and Arts Occupations by Sex
Within the Management, Business, Science and Arts occupations in Wibaux County, the most male-oriented occupations are Architecture & Engineering (100.0%), Legal Services & Support (100.0%), and Management (79.0%), while the most female-oriented occupations are Business & Financial (100.0%), Arts, Media & Entertainment (100.0%), and Education Instruction & Library (95.7%).
| Occupation | Male | Female |
| Management | 83 (79.0%) | 22 (20.9%) |
| Business & Financial | 0 (0.0%) | 11 (100.0%) |
| Computers, Engineering & Science | 9 (75.0%) | 3 (25.0%) |
| Computers & Mathematics | 0 (0.0%) | 0 (0.0%) |
| Architecture & Engineering | 5 (100.0%) | 0 (0.0%) |
| Life, Physical & Social Science | 4 (57.1%) | 3 (42.9%) |
| Community & Social Service | 9 (14.5%) | 53 (85.5%) |
| Education, Arts & Media | 5 (55.6%) | 4 (44.4%) |
| Legal Services & Support | 2 (100.0%) | 0 (0.0%) |
| Education Instruction & Library | 2 (4.3%) | 45 (95.7%) |
| Arts, Media & Entertainment | 0 (0.0%) | 4 (100.0%) |
| Health Diagnosing & Treating | 8 (53.3%) | 7 (46.7%) |
| Health Technologists | 3 (60.0%) | 2 (40.0%) |
| Total (Category) | 109 (53.2%) | 96 (46.8%) |
| Total (Overall) | 277 (56.7%) | 212 (43.3%) |
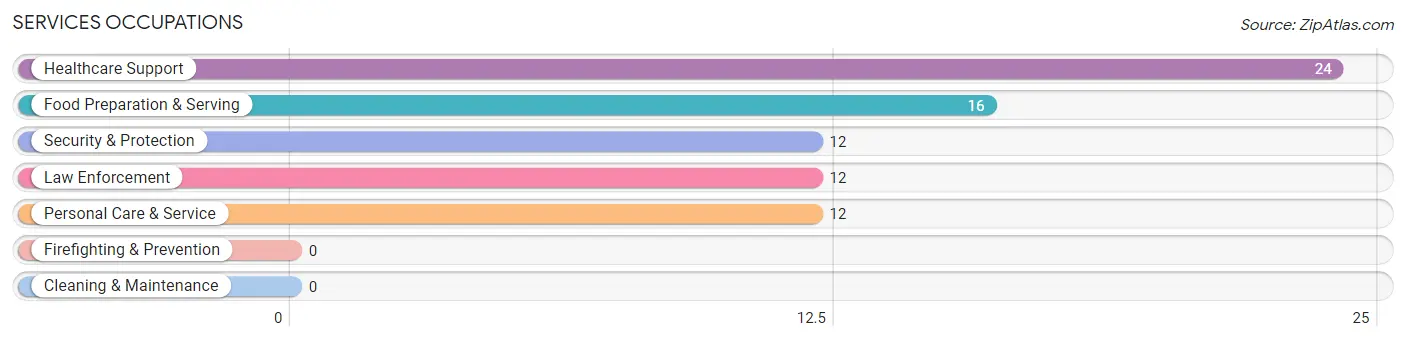
Services Occupations
The most common Services occupations in Wibaux County are Healthcare Support (24 | 4.9%), Food Preparation & Serving (16 | 3.3%), Security & Protection (12 | 2.5%), Law Enforcement (12 | 2.5%), and Personal Care & Service (12 | 2.5%).
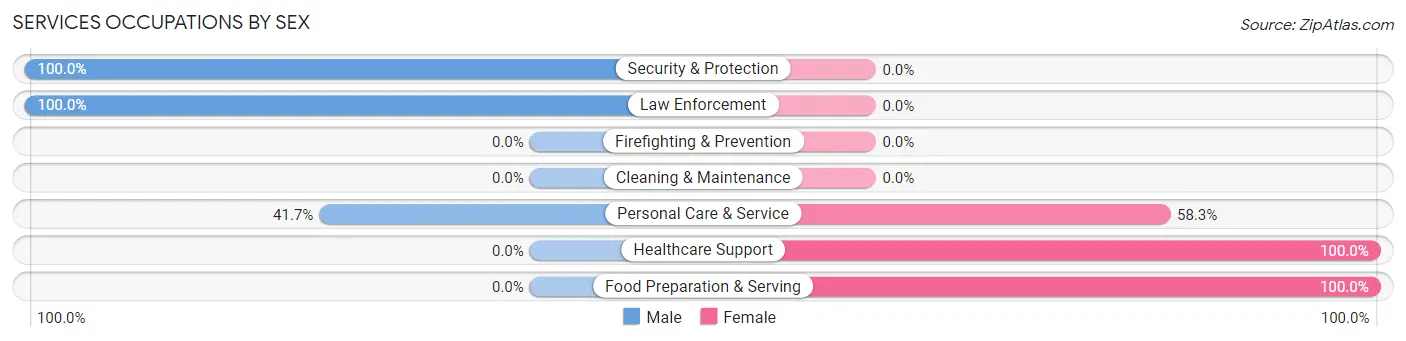
Services Occupations by Sex
Within the Services occupations in Wibaux County, the most male-oriented occupations are Security & Protection (100.0%), Law Enforcement (100.0%), and Personal Care & Service (41.7%), while the most female-oriented occupations are Healthcare Support (100.0%), Food Preparation & Serving (100.0%), and Personal Care & Service (58.3%).
| Occupation | Male | Female |
| Healthcare Support | 0 (0.0%) | 24 (100.0%) |
| Security & Protection | 12 (100.0%) | 0 (0.0%) |
| Firefighting & Prevention | 0 (0.0%) | 0 (0.0%) |
| Law Enforcement | 12 (100.0%) | 0 (0.0%) |
| Food Preparation & Serving | 0 (0.0%) | 16 (100.0%) |
| Cleaning & Maintenance | 0 (0.0%) | 0 (0.0%) |
| Personal Care & Service | 5 (41.7%) | 7 (58.3%) |
| Total (Category) | 17 (26.6%) | 47 (73.4%) |
| Total (Overall) | 277 (56.7%) | 212 (43.3%) |
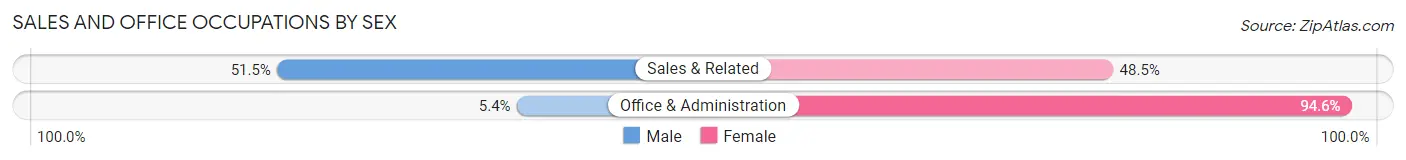
Sales and Office Occupations
The most common Sales and Office occupations in Wibaux County are Office & Administration (37 | 7.6%), and Sales & Related (33 | 6.8%).
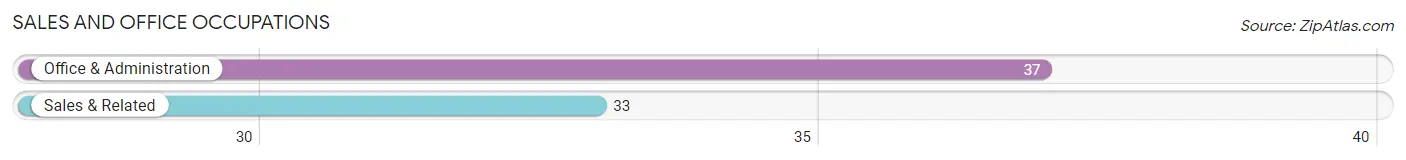
Sales and Office Occupations by Sex
| Occupation | Male | Female |
| Sales & Related | 17 (51.5%) | 16 (48.5%) |
| Office & Administration | 2 (5.4%) | 35 (94.6%) |
| Total (Category) | 19 (27.1%) | 51 (72.9%) |
| Total (Overall) | 277 (56.7%) | 212 (43.3%) |
Natural Resources, Construction and Maintenance Occupations
The most common Natural Resources, Construction and Maintenance occupations in Wibaux County are Construction & Extraction (59 | 12.1%), Installation, Maintenance & Repair (27 | 5.5%), and Farming, Fishing & Forestry (21 | 4.3%).
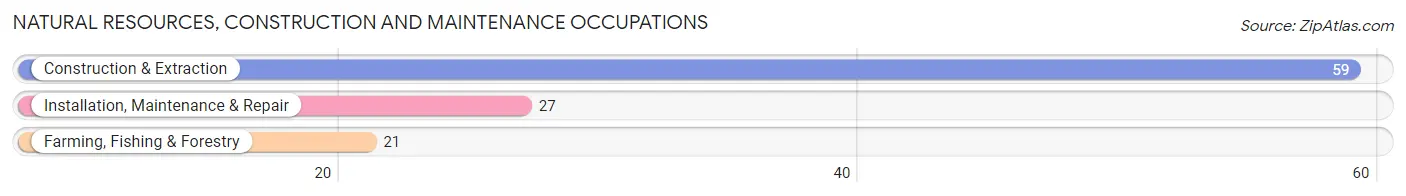
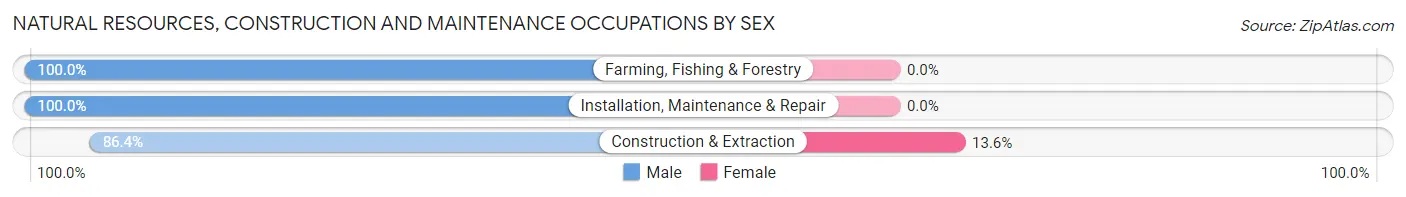
Natural Resources, Construction and Maintenance Occupations by Sex
| Occupation | Male | Female |
| Farming, Fishing & Forestry | 21 (100.0%) | 0 (0.0%) |
| Construction & Extraction | 51 (86.4%) | 8 (13.6%) |
| Installation, Maintenance & Repair | 27 (100.0%) | 0 (0.0%) |
| Total (Category) | 99 (92.5%) | 8 (7.5%) |
| Total (Overall) | 277 (56.7%) | 212 (43.3%) |
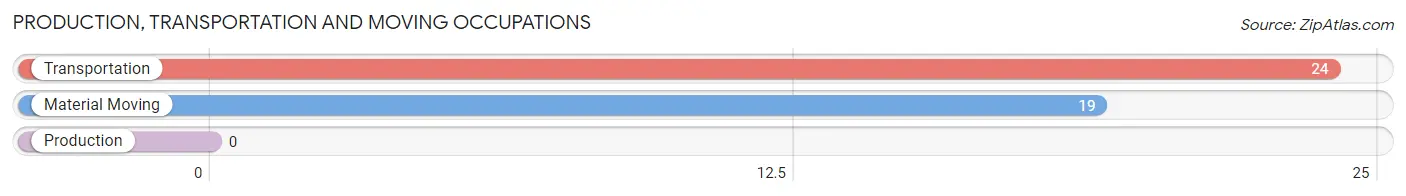
Production, Transportation and Moving Occupations
The most common Production, Transportation and Moving occupations in Wibaux County are Transportation (24 | 4.9%), and Material Moving (19 | 3.9%).
Production, Transportation and Moving Occupations by Sex
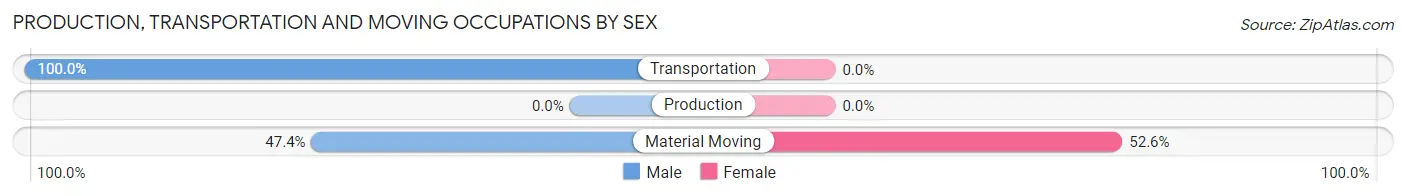
| Occupation | Male | Female |
| Production | 0 (0.0%) | 0 (0.0%) |
| Transportation | 24 (100.0%) | 0 (0.0%) |
| Material Moving | 9 (47.4%) | 10 (52.6%) |
| Total (Category) | 33 (76.7%) | 10 (23.3%) |
| Total (Overall) | 277 (56.7%) | 212 (43.3%) |
Employment Industries by Sex in Wibaux County
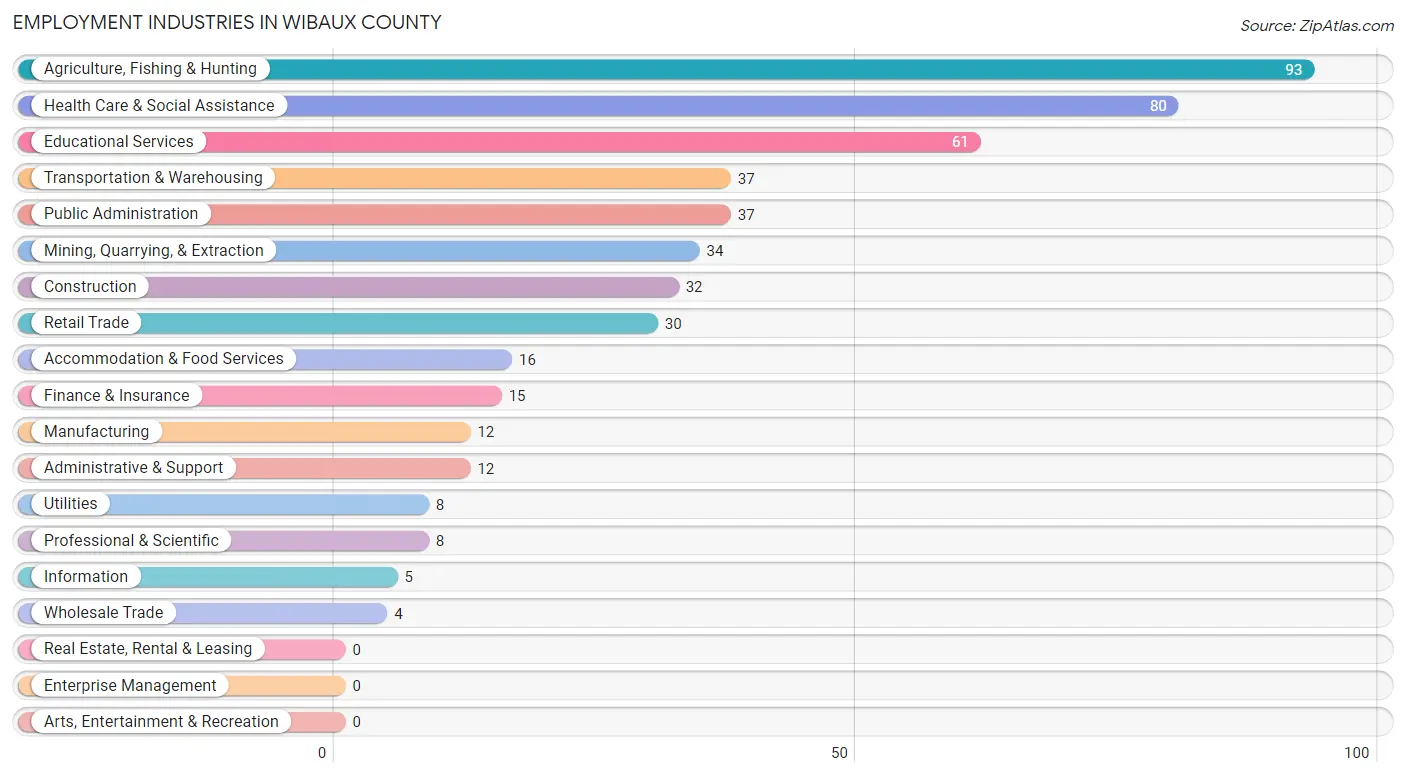
Employment Industries in Wibaux County
The major employment industries in Wibaux County include Agriculture, Fishing & Hunting (93 | 19.0%), Health Care & Social Assistance (80 | 16.4%), Educational Services (61 | 12.5%), Transportation & Warehousing (37 | 7.6%), and Public Administration (37 | 7.6%).
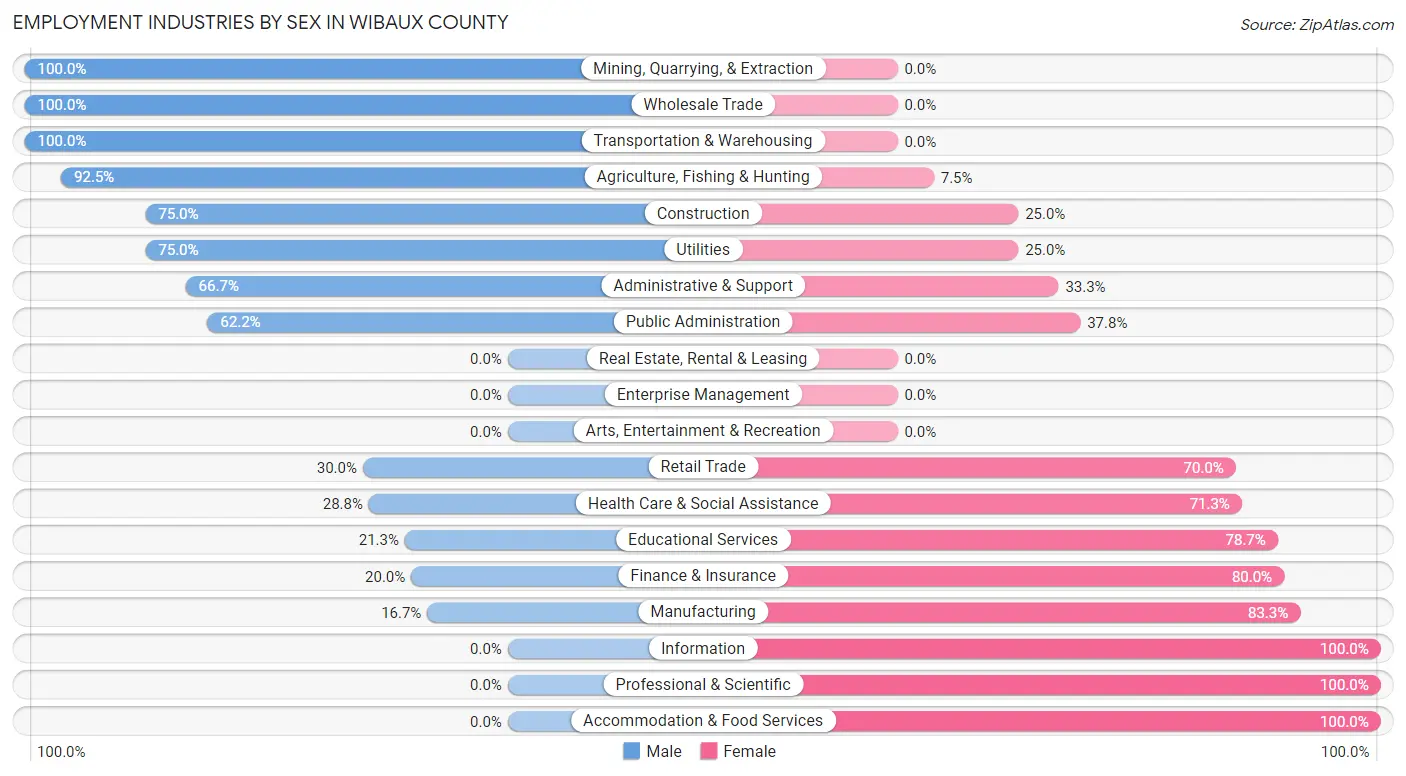
Employment Industries by Sex in Wibaux County
The Wibaux County industries that see more men than women are Mining, Quarrying, & Extraction (100.0%), Wholesale Trade (100.0%), and Transportation & Warehousing (100.0%), whereas the industries that tend to have a higher number of women are Information (100.0%), Professional & Scientific (100.0%), and Accommodation & Food Services (100.0%).
| Industry | Male | Female |
| Agriculture, Fishing & Hunting | 86 (92.5%) | 7 (7.5%) |
| Mining, Quarrying, & Extraction | 34 (100.0%) | 0 (0.0%) |
| Construction | 24 (75.0%) | 8 (25.0%) |
| Manufacturing | 2 (16.7%) | 10 (83.3%) |
| Wholesale Trade | 4 (100.0%) | 0 (0.0%) |
| Retail Trade | 9 (30.0%) | 21 (70.0%) |
| Transportation & Warehousing | 37 (100.0%) | 0 (0.0%) |
| Utilities | 6 (75.0%) | 2 (25.0%) |
| Information | 0 (0.0%) | 5 (100.0%) |
| Finance & Insurance | 3 (20.0%) | 12 (80.0%) |
| Real Estate, Rental & Leasing | 0 (0.0%) | 0 (0.0%) |
| Professional & Scientific | 0 (0.0%) | 8 (100.0%) |
| Enterprise Management | 0 (0.0%) | 0 (0.0%) |
| Administrative & Support | 8 (66.7%) | 4 (33.3%) |
| Educational Services | 13 (21.3%) | 48 (78.7%) |
| Health Care & Social Assistance | 23 (28.7%) | 57 (71.3%) |
| Arts, Entertainment & Recreation | 0 (0.0%) | 0 (0.0%) |
| Accommodation & Food Services | 0 (0.0%) | 16 (100.0%) |
| Public Administration | 23 (62.2%) | 14 (37.8%) |
| Total | 277 (56.7%) | 212 (43.3%) |
Education in Wibaux County
School Enrollment in Wibaux County
The most common levels of schooling among the 247 students in Wibaux County are high school (102 | 41.3%), elementary school (62 | 25.1%), and middle school (39 | 15.8%).
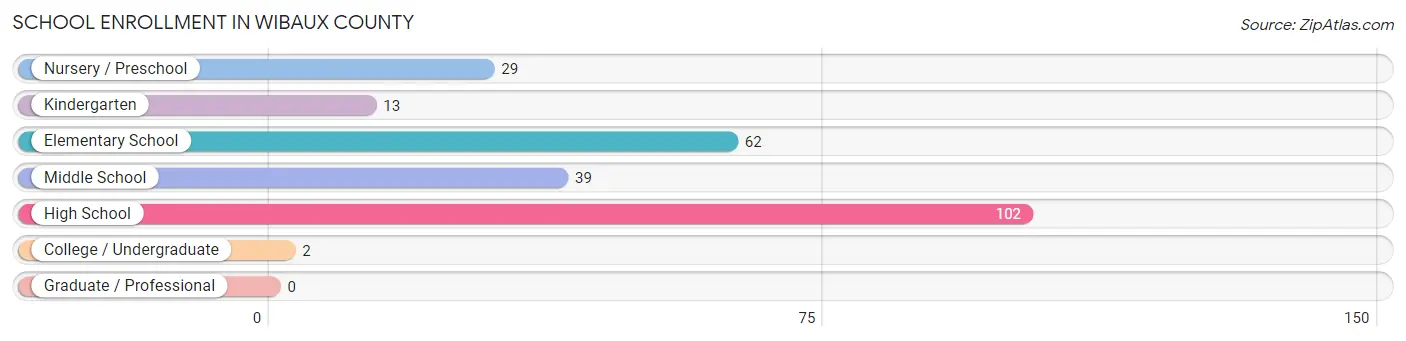
| School Level | # Students | % Students |
| Nursery / Preschool | 29 | 11.7% |
| Kindergarten | 13 | 5.3% |
| Elementary School | 62 | 25.1% |
| Middle School | 39 | 15.8% |
| High School | 102 | 41.3% |
| College / Undergraduate | 2 | 0.8% |
| Graduate / Professional | 0 | 0.0% |
| Total | 247 | 100.0% |
School Enrollment by Age by Funding Source in Wibaux County
Out of a total of 247 students who are enrolled in schools in Wibaux County, 22 (8.9%) attend a private institution, while the remaining 225 (91.1%) are enrolled in public schools. The age group of 3 to 4 year olds has the highest likelihood of being enrolled in private schools, with 3 (18.8% in the age bracket) enrolled. Conversely, the age group of 18 to 19 year olds has the lowest likelihood of being enrolled in a private school, with 22 (100.0% in the age bracket) attending a public institution.
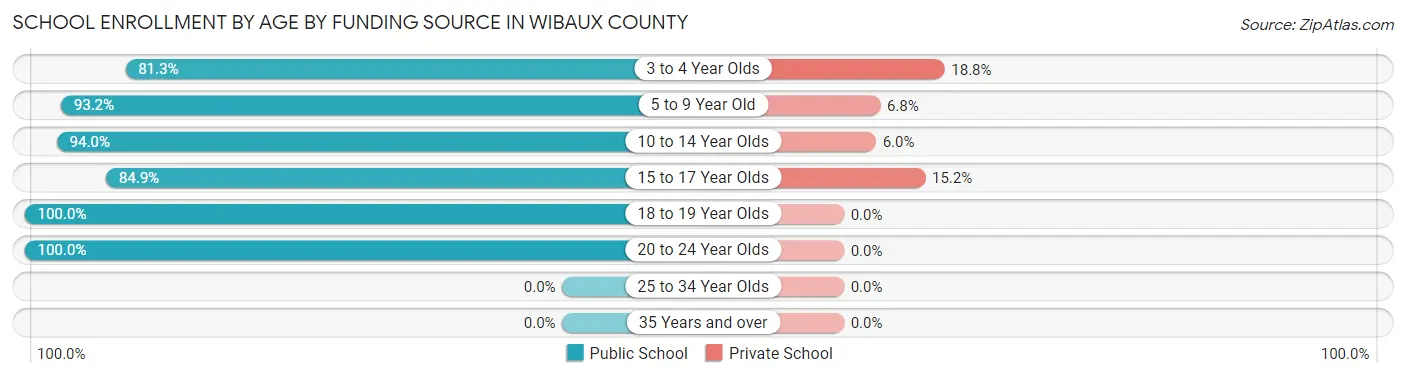
| Age Bracket | Public School | Private School |
| 3 to 4 Year Olds | 13 (81.2%) | 3 (18.8%) |
| 5 to 9 Year Old | 69 (93.2%) | 5 (6.8%) |
| 10 to 14 Year Olds | 63 (94.0%) | 4 (6.0%) |
| 15 to 17 Year Olds | 56 (84.9%) | 10 (15.1%) |
| 18 to 19 Year Olds | 22 (100.0%) | 0 (0.0%) |
| 20 to 24 Year Olds | 2 (100.0%) | 0 (0.0%) |
| 25 to 34 Year Olds | 0 (0.0%) | 0 (0.0%) |
| 35 Years and over | 0 (0.0%) | 0 (0.0%) |
| Total | 225 (91.1%) | 22 (8.9%) |
Educational Attainment by Field of Study in Wibaux County
Education (74 | 40.4%), arts & humanities (25 | 13.7%), bio, nature & agricultural (24 | 13.1%), business (23 | 12.6%), and science & technology (11 | 6.0%) are the most common fields of study among 183 individuals in Wibaux County who have obtained a bachelor's degree or higher.
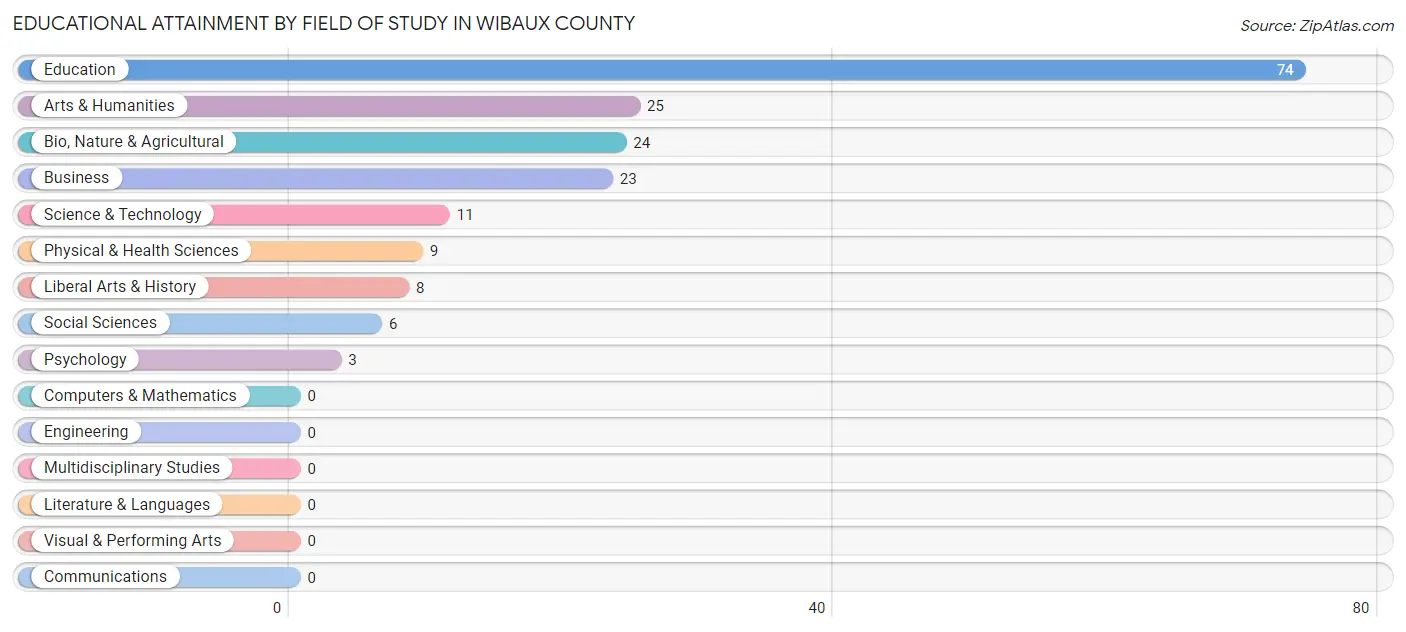
| Field of Study | # Graduates | % Graduates |
| Computers & Mathematics | 0 | 0.0% |
| Bio, Nature & Agricultural | 24 | 13.1% |
| Physical & Health Sciences | 9 | 4.9% |
| Psychology | 3 | 1.6% |
| Social Sciences | 6 | 3.3% |
| Engineering | 0 | 0.0% |
| Multidisciplinary Studies | 0 | 0.0% |
| Science & Technology | 11 | 6.0% |
| Business | 23 | 12.6% |
| Education | 74 | 40.4% |
| Literature & Languages | 0 | 0.0% |
| Liberal Arts & History | 8 | 4.4% |
| Visual & Performing Arts | 0 | 0.0% |
| Communications | 0 | 0.0% |
| Arts & Humanities | 25 | 13.7% |
| Total | 183 | 100.0% |
Transportation & Commute in Wibaux County
Vehicle Availability by Sex in Wibaux County
The most prevalent vehicle ownership categories in Wibaux County are males with 2 vehicles (103, accounting for 37.2%) and females with 2 vehicles (60, making up 48.6%).
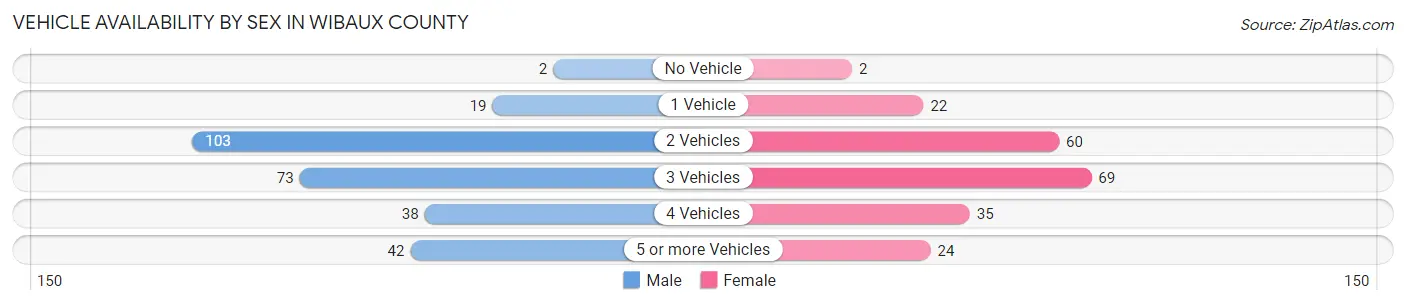
| Vehicles Available | Male | Female |
| No Vehicle | 2 (0.7%) | 2 (0.9%) |
| 1 Vehicle | 19 (6.9%) | 22 (10.4%) |
| 2 Vehicles | 103 (37.2%) | 60 (28.3%) |
| 3 Vehicles | 73 (26.4%) | 69 (32.6%) |
| 4 Vehicles | 38 (13.7%) | 35 (16.5%) |
| 5 or more Vehicles | 42 (15.2%) | 24 (11.3%) |
| Total | 277 (100.0%) | 212 (100.0%) |
Commute Time in Wibaux County
The most frequently occuring commute durations in Wibaux County are 5 to 9 minutes (106 commuters, 24.6%), less than 5 minutes (88 commuters, 20.5%), and 15 to 19 minutes (66 commuters, 15.3%).
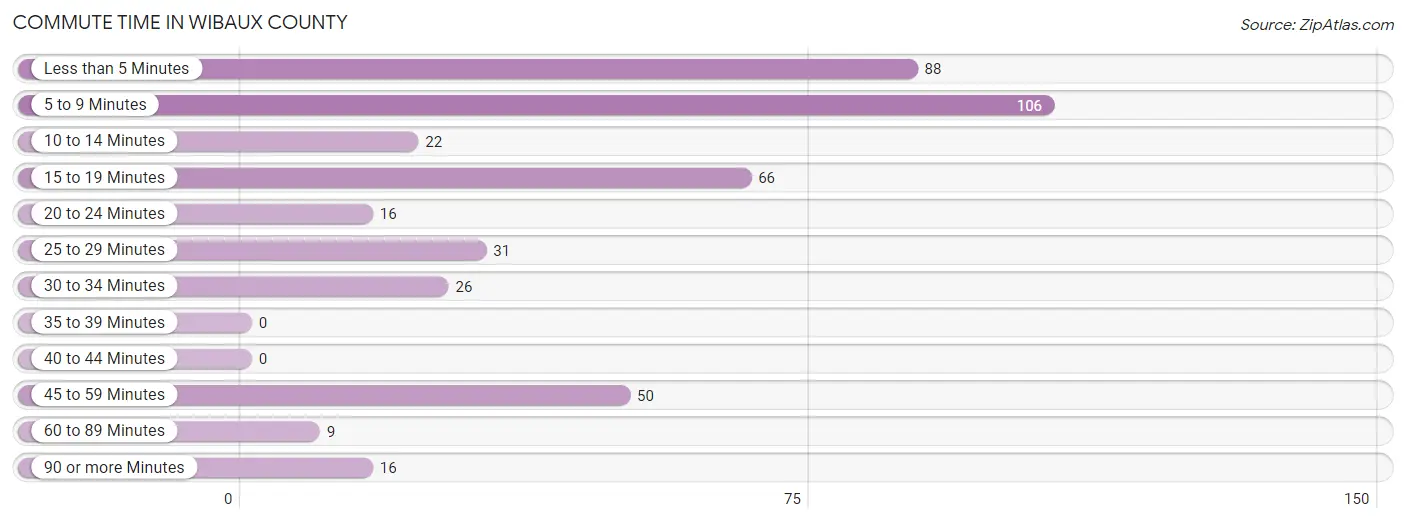
| Commute Time | # Commuters | % Commuters |
| Less than 5 Minutes | 88 | 20.5% |
| 5 to 9 Minutes | 106 | 24.6% |
| 10 to 14 Minutes | 22 | 5.1% |
| 15 to 19 Minutes | 66 | 15.3% |
| 20 to 24 Minutes | 16 | 3.7% |
| 25 to 29 Minutes | 31 | 7.2% |
| 30 to 34 Minutes | 26 | 6.0% |
| 35 to 39 Minutes | 0 | 0.0% |
| 40 to 44 Minutes | 0 | 0.0% |
| 45 to 59 Minutes | 50 | 11.6% |
| 60 to 89 Minutes | 9 | 2.1% |
| 90 or more Minutes | 16 | 3.7% |
Commute Time by Sex in Wibaux County
The most common commute times in Wibaux County are 5 to 9 minutes (54 commuters, 22.9%) for males and 5 to 9 minutes (52 commuters, 26.8%) for females.
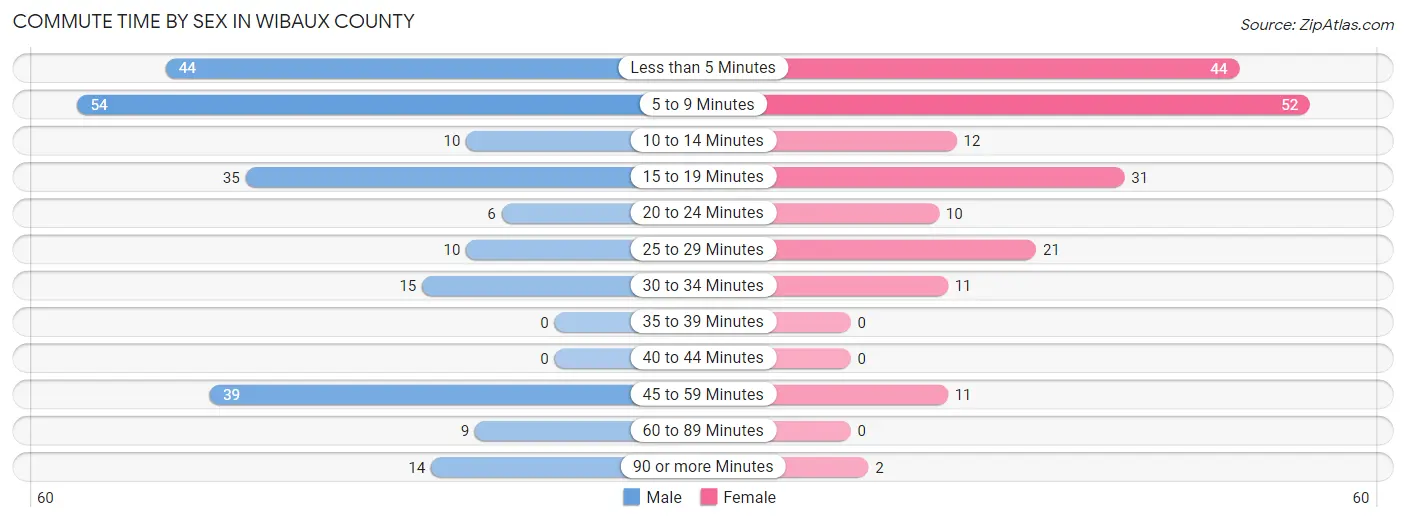
| Commute Time | Male | Female |
| Less than 5 Minutes | 44 (18.6%) | 44 (22.7%) |
| 5 to 9 Minutes | 54 (22.9%) | 52 (26.8%) |
| 10 to 14 Minutes | 10 (4.2%) | 12 (6.2%) |
| 15 to 19 Minutes | 35 (14.8%) | 31 (16.0%) |
| 20 to 24 Minutes | 6 (2.5%) | 10 (5.1%) |
| 25 to 29 Minutes | 10 (4.2%) | 21 (10.8%) |
| 30 to 34 Minutes | 15 (6.4%) | 11 (5.7%) |
| 35 to 39 Minutes | 0 (0.0%) | 0 (0.0%) |
| 40 to 44 Minutes | 0 (0.0%) | 0 (0.0%) |
| 45 to 59 Minutes | 39 (16.5%) | 11 (5.7%) |
| 60 to 89 Minutes | 9 (3.8%) | 0 (0.0%) |
| 90 or more Minutes | 14 (5.9%) | 2 (1.0%) |
Time of Departure to Work by Sex in Wibaux County
The most frequent times of departure to work in Wibaux County are 7:00 AM to 7:29 AM (51, 21.6%) for males and 7:30 AM to 7:59 AM (75, 38.7%) for females.
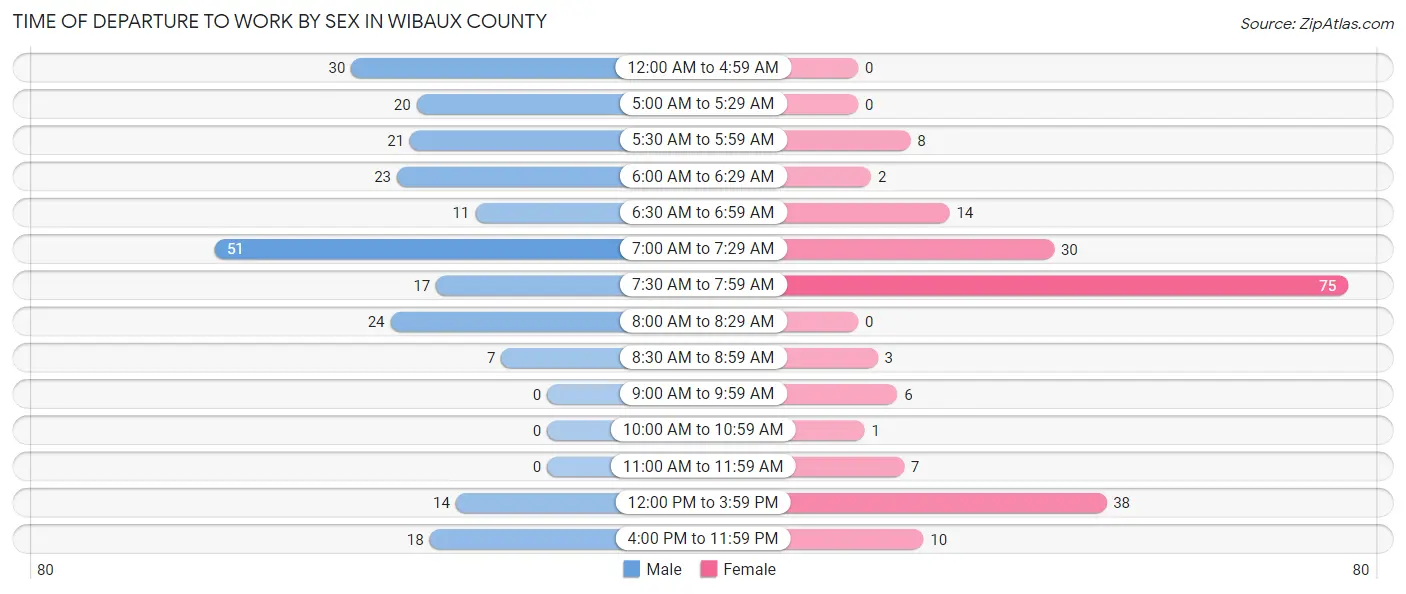
| Time of Departure | Male | Female |
| 12:00 AM to 4:59 AM | 30 (12.7%) | 0 (0.0%) |
| 5:00 AM to 5:29 AM | 20 (8.5%) | 0 (0.0%) |
| 5:30 AM to 5:59 AM | 21 (8.9%) | 8 (4.1%) |
| 6:00 AM to 6:29 AM | 23 (9.8%) | 2 (1.0%) |
| 6:30 AM to 6:59 AM | 11 (4.7%) | 14 (7.2%) |
| 7:00 AM to 7:29 AM | 51 (21.6%) | 30 (15.5%) |
| 7:30 AM to 7:59 AM | 17 (7.2%) | 75 (38.7%) |
| 8:00 AM to 8:29 AM | 24 (10.2%) | 0 (0.0%) |
| 8:30 AM to 8:59 AM | 7 (3.0%) | 3 (1.5%) |
| 9:00 AM to 9:59 AM | 0 (0.0%) | 6 (3.1%) |
| 10:00 AM to 10:59 AM | 0 (0.0%) | 1 (0.5%) |
| 11:00 AM to 11:59 AM | 0 (0.0%) | 7 (3.6%) |
| 12:00 PM to 3:59 PM | 14 (5.9%) | 38 (19.6%) |
| 4:00 PM to 11:59 PM | 18 (7.6%) | 10 (5.1%) |
| Total | 236 (100.0%) | 194 (100.0%) |
Housing Occupancy in Wibaux County
Occupancy by Ownership in Wibaux County
Of the total 466 dwellings in Wibaux County, owner-occupied units account for 347 (74.5%), while renter-occupied units make up 119 (25.5%).
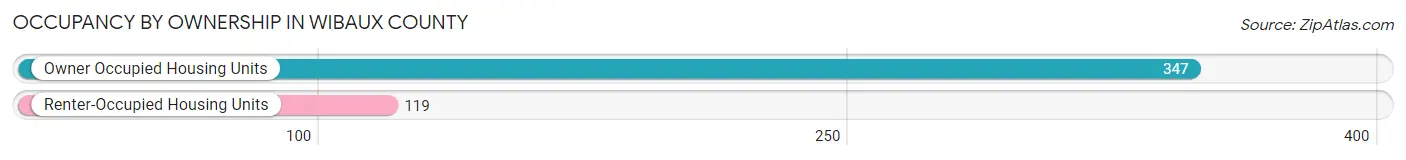
| Occupancy | # Housing Units | % Housing Units |
| Owner Occupied Housing Units | 347 | 74.5% |
| Renter-Occupied Housing Units | 119 | 25.5% |
| Total Occupied Housing Units | 466 | 100.0% |
Occupancy by Household Size in Wibaux County
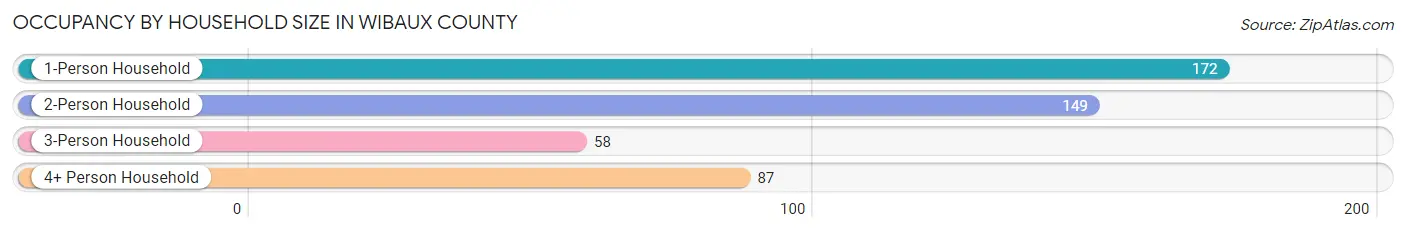
| Household Size | # Housing Units | % Housing Units |
| 1-Person Household | 172 | 36.9% |
| 2-Person Household | 149 | 32.0% |
| 3-Person Household | 58 | 12.4% |
| 4+ Person Household | 87 | 18.7% |
| Total Housing Units | 466 | 100.0% |
Occupancy by Ownership by Household Size in Wibaux County
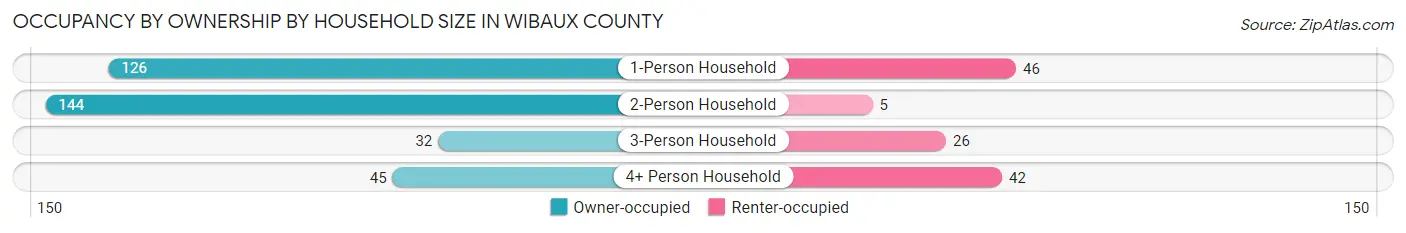
| Household Size | Owner-occupied | Renter-occupied |
| 1-Person Household | 126 (73.3%) | 46 (26.7%) |
| 2-Person Household | 144 (96.6%) | 5 (3.4%) |
| 3-Person Household | 32 (55.2%) | 26 (44.8%) |
| 4+ Person Household | 45 (51.7%) | 42 (48.3%) |
| Total Housing Units | 347 (74.5%) | 119 (25.5%) |
Occupancy by Educational Attainment in Wibaux County
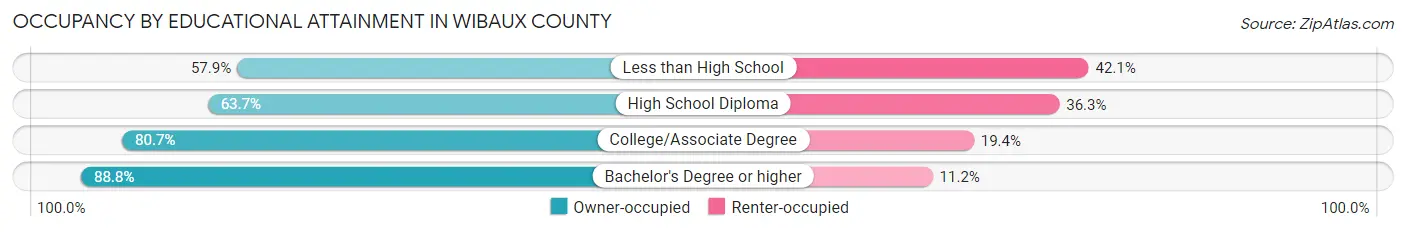
| Household Size | Owner-occupied | Renter-occupied |
| Less than High School | 22 (57.9%) | 16 (42.1%) |
| High School Diploma | 114 (63.7%) | 65 (36.3%) |
| College/Associate Degree | 100 (80.6%) | 24 (19.4%) |
| Bachelor's Degree or higher | 111 (88.8%) | 14 (11.2%) |
Occupancy by Age of Householder in Wibaux County
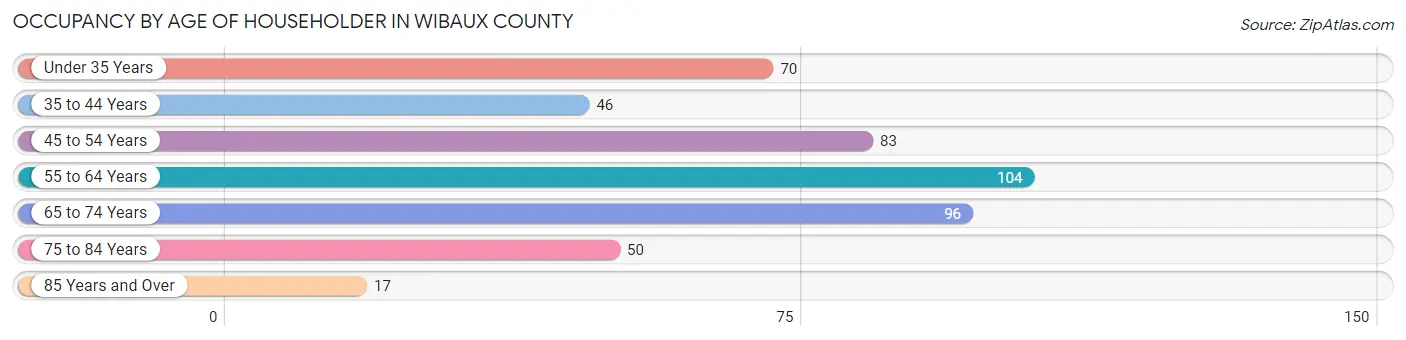
| Age Bracket | # Households | % Households |
| Under 35 Years | 70 | 15.0% |
| 35 to 44 Years | 46 | 9.9% |
| 45 to 54 Years | 83 | 17.8% |
| 55 to 64 Years | 104 | 22.3% |
| 65 to 74 Years | 96 | 20.6% |
| 75 to 84 Years | 50 | 10.7% |
| 85 Years and Over | 17 | 3.6% |
| Total | 466 | 100.0% |
Housing Finances in Wibaux County
Median Income by Occupancy in Wibaux County
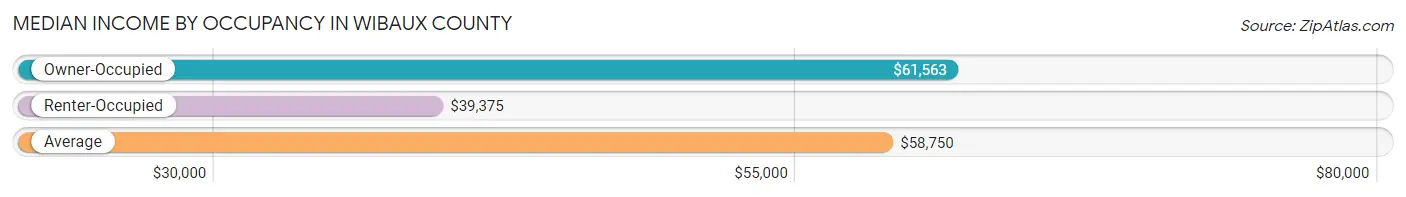
| Occupancy Type | # Households | Median Income |
| Owner-Occupied | 347 (74.5%) | $61,563 |
| Renter-Occupied | 119 (25.5%) | $39,375 |
| Average | 466 (100.0%) | $58,750 |
Occupancy by Householder Income Bracket in Wibaux County

| Income Bracket | Owner-occupied | Renter-occupied |
| Less than $5,000 | 9 (2.6%) | 3 (2.5%) |
| $5,000 to $9,999 | 8 (2.3%) | 9 (7.6%) |
| $10,000 to $14,999 | 0 (0.0%) | 10 (8.4%) |
| $15,000 to $19,999 | 5 (1.4%) | 13 (10.9%) |
| $20,000 to $24,999 | 32 (9.2%) | 5 (4.2%) |
| $25,000 to $34,999 | 31 (8.9%) | 9 (7.6%) |
| $35,000 to $49,999 | 77 (22.2%) | 14 (11.8%) |
| $50,000 to $74,999 | 37 (10.7%) | 23 (19.3%) |
| $75,000 to $99,999 | 35 (10.1%) | 4 (3.4%) |
| $100,000 to $149,999 | 89 (25.7%) | 29 (24.4%) |
| $150,000 or more | 24 (6.9%) | 0 (0.0%) |
| Total | 347 (100.0%) | 119 (100.0%) |
Monthly Housing Cost Tiers in Wibaux County
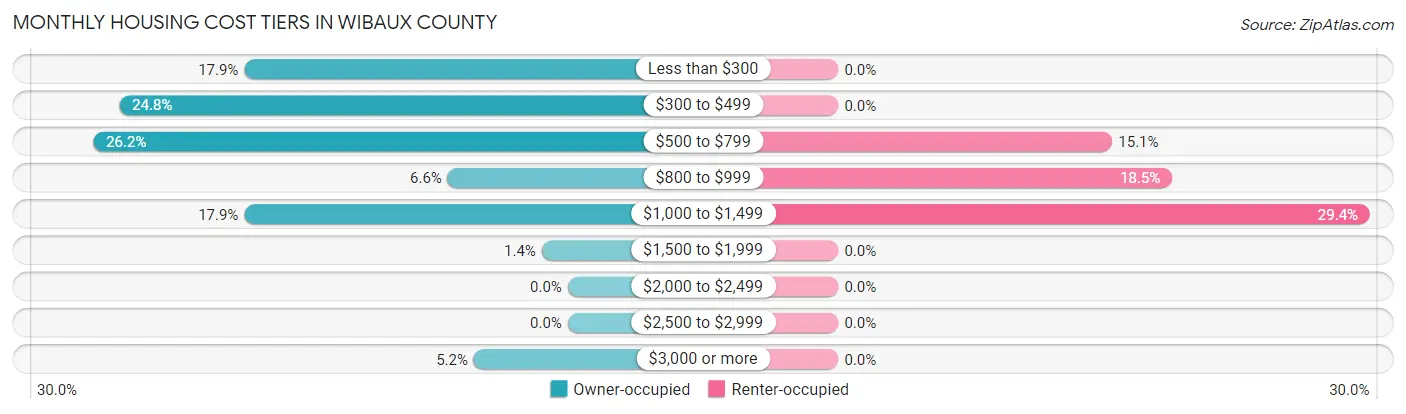
| Monthly Cost | Owner-occupied | Renter-occupied |
| Less than $300 | 62 (17.9%) | 0 (0.0%) |
| $300 to $499 | 86 (24.8%) | 0 (0.0%) |
| $500 to $799 | 91 (26.2%) | 18 (15.1%) |
| $800 to $999 | 23 (6.6%) | 22 (18.5%) |
| $1,000 to $1,499 | 62 (17.9%) | 35 (29.4%) |
| $1,500 to $1,999 | 5 (1.4%) | 0 (0.0%) |
| $2,000 to $2,499 | 0 (0.0%) | 0 (0.0%) |
| $2,500 to $2,999 | 0 (0.0%) | 0 (0.0%) |
| $3,000 or more | 18 (5.2%) | 0 (0.0%) |
| Total | 347 (100.0%) | 119 (100.0%) |
Physical Housing Characteristics in Wibaux County
Housing Structures in Wibaux County
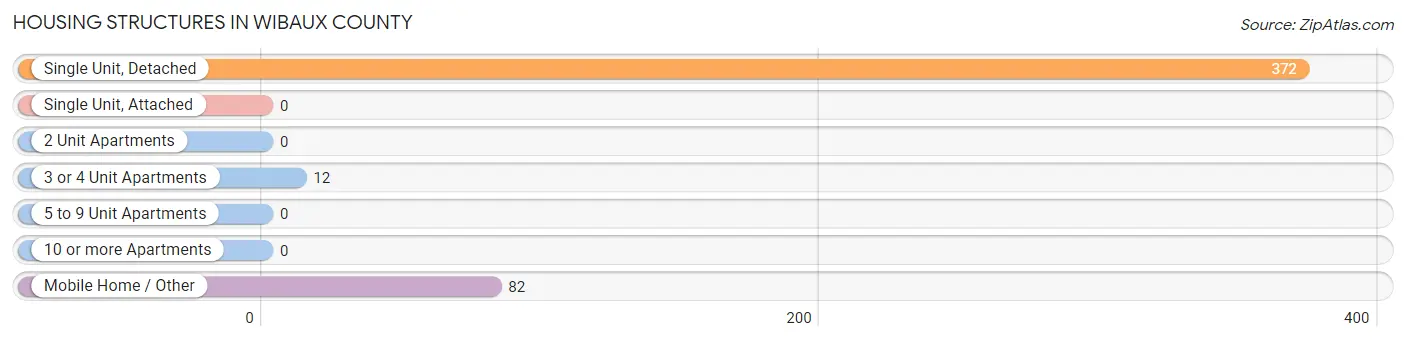
| Structure Type | # Housing Units | % Housing Units |
| Single Unit, Detached | 372 | 79.8% |
| Single Unit, Attached | 0 | 0.0% |
| 2 Unit Apartments | 0 | 0.0% |
| 3 or 4 Unit Apartments | 12 | 2.6% |
| 5 to 9 Unit Apartments | 0 | 0.0% |
| 10 or more Apartments | 0 | 0.0% |
| Mobile Home / Other | 82 | 17.6% |
| Total | 466 | 100.0% |
Housing Structures by Occupancy in Wibaux County
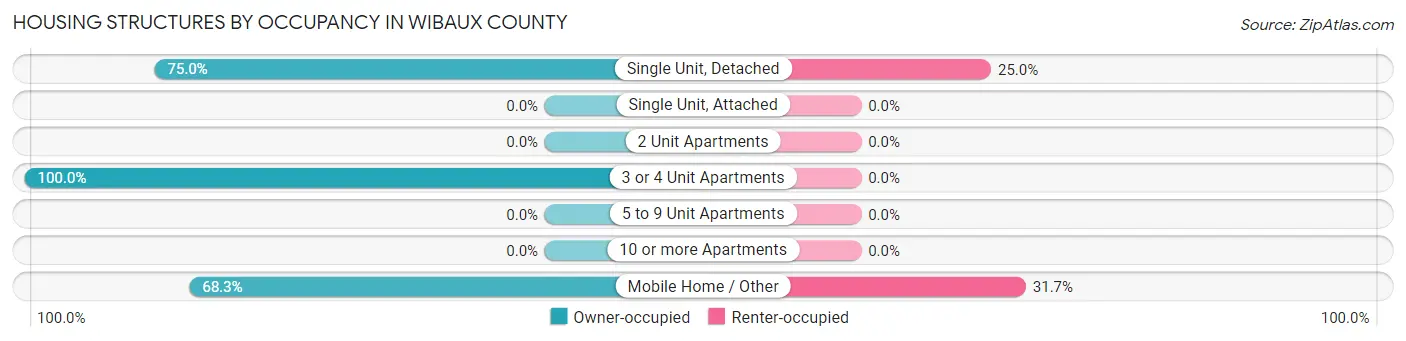
| Structure Type | Owner-occupied | Renter-occupied |
| Single Unit, Detached | 279 (75.0%) | 93 (25.0%) |
| Single Unit, Attached | 0 (0.0%) | 0 (0.0%) |
| 2 Unit Apartments | 0 (0.0%) | 0 (0.0%) |
| 3 or 4 Unit Apartments | 12 (100.0%) | 0 (0.0%) |
| 5 to 9 Unit Apartments | 0 (0.0%) | 0 (0.0%) |
| 10 or more Apartments | 0 (0.0%) | 0 (0.0%) |
| Mobile Home / Other | 56 (68.3%) | 26 (31.7%) |
| Total | 347 (74.5%) | 119 (25.5%) |
Housing Structures by Number of Rooms in Wibaux County
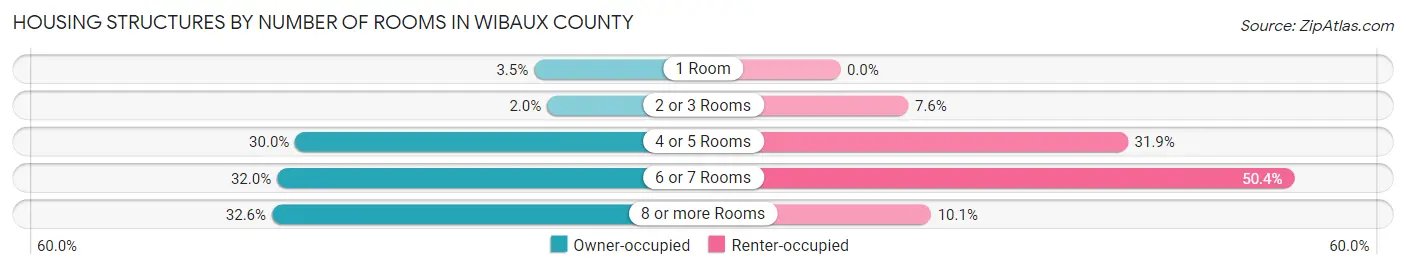
| Number of Rooms | Owner-occupied | Renter-occupied |
| 1 Room | 12 (3.5%) | 0 (0.0%) |
| 2 or 3 Rooms | 7 (2.0%) | 9 (7.6%) |
| 4 or 5 Rooms | 104 (30.0%) | 38 (31.9%) |
| 6 or 7 Rooms | 111 (32.0%) | 60 (50.4%) |
| 8 or more Rooms | 113 (32.6%) | 12 (10.1%) |
| Total | 347 (100.0%) | 119 (100.0%) |
Housing Structure by Heating Type in Wibaux County
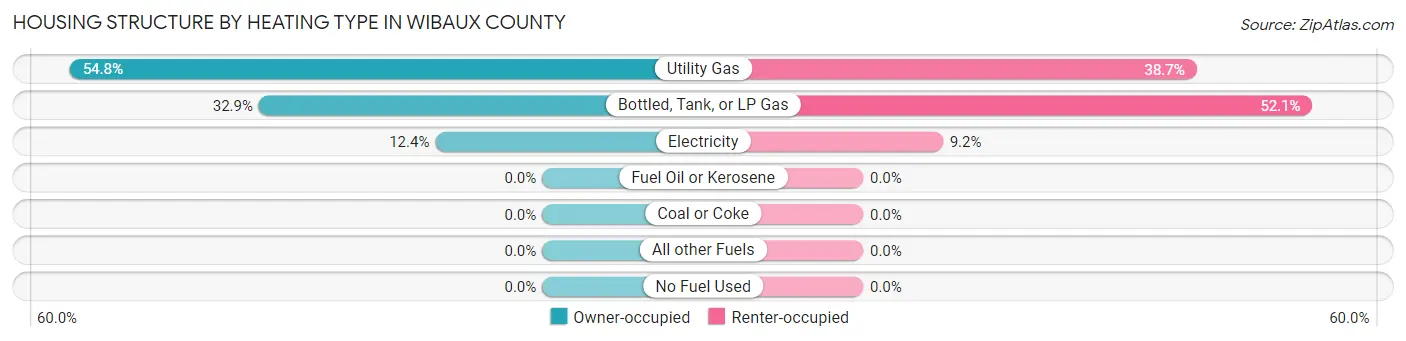
| Heating Type | Owner-occupied | Renter-occupied |
| Utility Gas | 190 (54.8%) | 46 (38.7%) |
| Bottled, Tank, or LP Gas | 114 (32.9%) | 62 (52.1%) |
| Electricity | 43 (12.4%) | 11 (9.2%) |
| Fuel Oil or Kerosene | 0 (0.0%) | 0 (0.0%) |
| Coal or Coke | 0 (0.0%) | 0 (0.0%) |
| All other Fuels | 0 (0.0%) | 0 (0.0%) |
| No Fuel Used | 0 (0.0%) | 0 (0.0%) |
| Total | 347 (100.0%) | 119 (100.0%) |
Household Vehicle Usage in Wibaux County
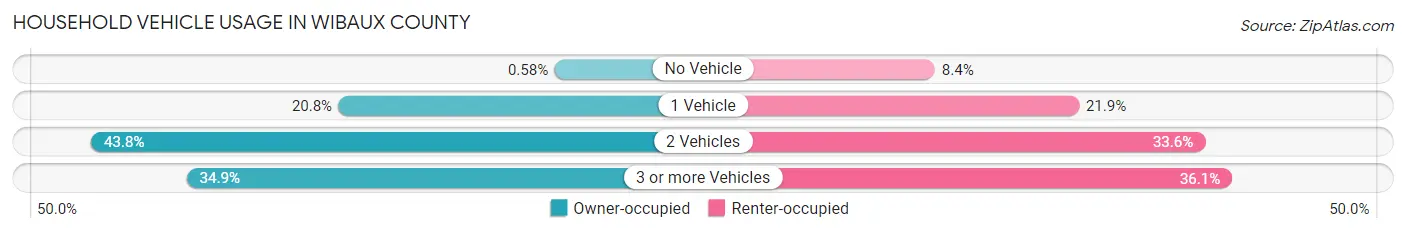
| Vehicles per Household | Owner-occupied | Renter-occupied |
| No Vehicle | 2 (0.6%) | 10 (8.4%) |
| 1 Vehicle | 72 (20.7%) | 26 (21.8%) |
| 2 Vehicles | 152 (43.8%) | 40 (33.6%) |
| 3 or more Vehicles | 121 (34.9%) | 43 (36.1%) |
| Total | 347 (100.0%) | 119 (100.0%) |
Real Estate & Mortgages in Wibaux County
Real Estate and Mortgage Overview in Wibaux County
| Characteristic | Without Mortgage | With Mortgage |
| Housing Units | 237 | 110 |
| Median Property Value | $104,400 | $97,300 |
| Median Household Income | $55,417 | $8 |
| Monthly Housing Costs | $405 | $18 |
| Real Estate Taxes | $573 | $7 |
Property Value by Mortgage Status in Wibaux County
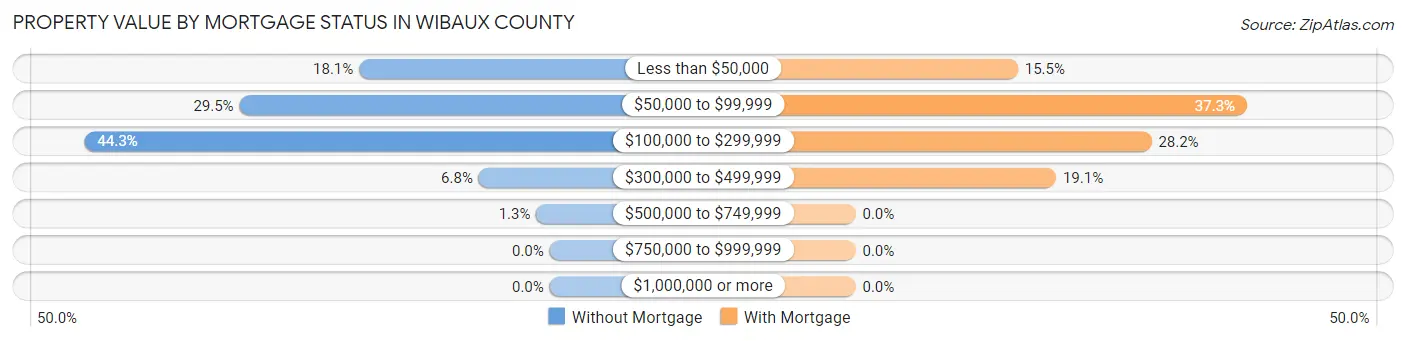
| Property Value | Without Mortgage | With Mortgage |
| Less than $50,000 | 43 (18.1%) | 17 (15.4%) |
| $50,000 to $99,999 | 70 (29.5%) | 41 (37.3%) |
| $100,000 to $299,999 | 105 (44.3%) | 31 (28.2%) |
| $300,000 to $499,999 | 16 (6.8%) | 21 (19.1%) |
| $500,000 to $749,999 | 3 (1.3%) | 0 (0.0%) |
| $750,000 to $999,999 | 0 (0.0%) | 0 (0.0%) |
| $1,000,000 or more | 0 (0.0%) | 0 (0.0%) |
| Total | 237 (100.0%) | 110 (100.0%) |
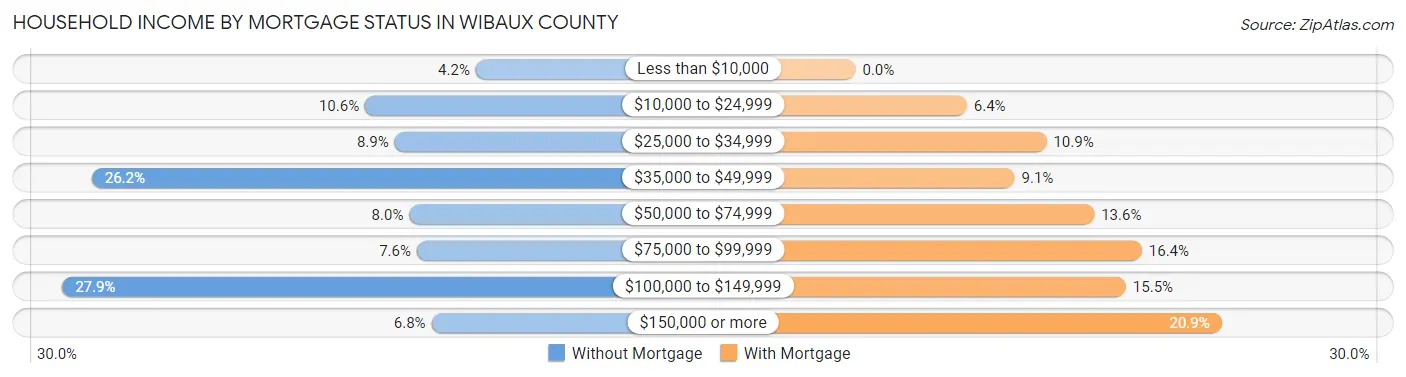
Household Income by Mortgage Status in Wibaux County
| Household Income | Without Mortgage | With Mortgage |
| Less than $10,000 | 10 (4.2%) | 0 (0.0%) |
| $10,000 to $24,999 | 25 (10.5%) | 7 (6.4%) |
| $25,000 to $34,999 | 21 (8.9%) | 12 (10.9%) |
| $35,000 to $49,999 | 62 (26.2%) | 10 (9.1%) |
| $50,000 to $74,999 | 19 (8.0%) | 15 (13.6%) |
| $75,000 to $99,999 | 18 (7.6%) | 18 (16.4%) |
| $100,000 to $149,999 | 66 (27.9%) | 17 (15.4%) |
| $150,000 or more | 16 (6.8%) | 23 (20.9%) |
| Total | 237 (100.0%) | 110 (100.0%) |
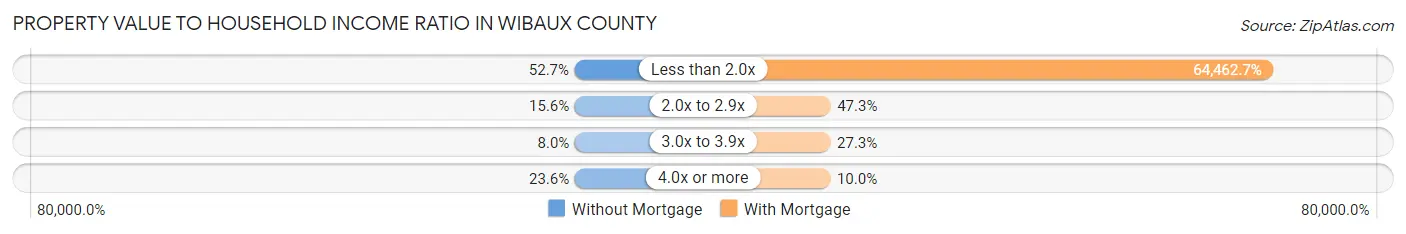
Property Value to Household Income Ratio in Wibaux County
| Value-to-Income Ratio | Without Mortgage | With Mortgage |
| Less than 2.0x | 125 (52.7%) | 70,909 (64,462.7%) |
| 2.0x to 2.9x | 37 (15.6%) | 52 (47.3%) |
| 3.0x to 3.9x | 19 (8.0%) | 30 (27.3%) |
| 4.0x or more | 56 (23.6%) | 11 (10.0%) |
| Total | 237 (100.0%) | 110 (100.0%) |
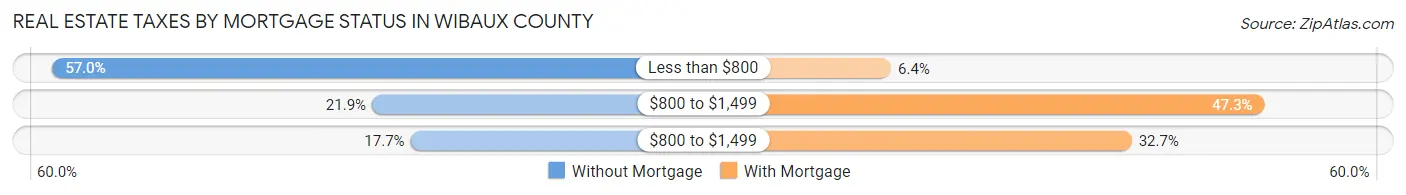
Real Estate Taxes by Mortgage Status in Wibaux County
| Property Taxes | Without Mortgage | With Mortgage |
| Less than $800 | 135 (57.0%) | 7 (6.4%) |
| $800 to $1,499 | 52 (21.9%) | 52 (47.3%) |
| $800 to $1,499 | 42 (17.7%) | 36 (32.7%) |
| Total | 237 (100.0%) | 110 (100.0%) |
Health & Disability in Wibaux County
Health Insurance Coverage by Age in Wibaux County
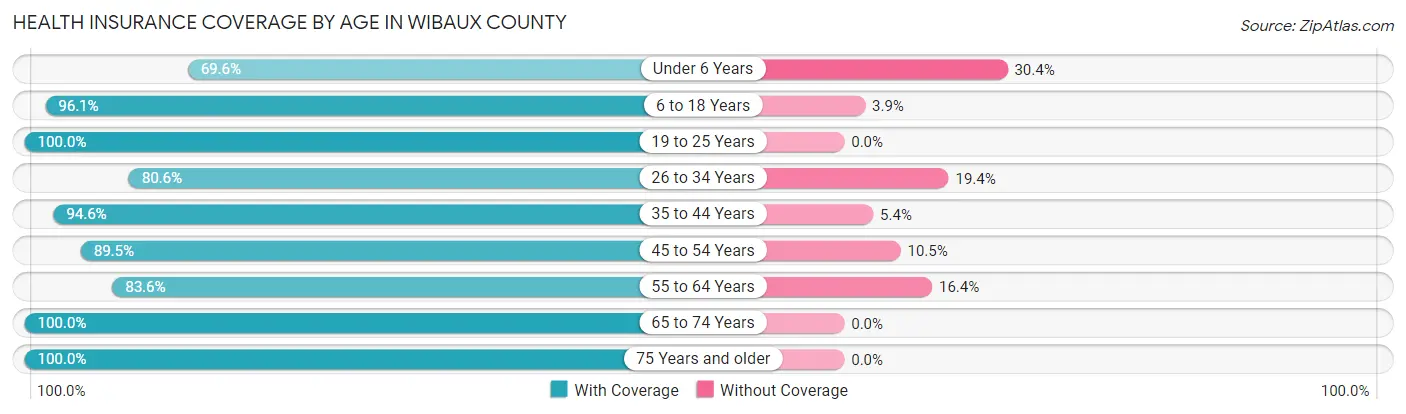
| Age Bracket | With Coverage | Without Coverage |
| Under 6 Years | 80 (69.6%) | 35 (30.4%) |
| 6 to 18 Years | 198 (96.1%) | 8 (3.9%) |
| 19 to 25 Years | 28 (100.0%) | 0 (0.0%) |
| 26 to 34 Years | 87 (80.6%) | 21 (19.4%) |
| 35 to 44 Years | 88 (94.6%) | 5 (5.4%) |
| 45 to 54 Years | 128 (89.5%) | 15 (10.5%) |
| 55 to 64 Years | 138 (83.6%) | 27 (16.4%) |
| 65 to 74 Years | 142 (100.0%) | 0 (0.0%) |
| 75 Years and older | 99 (100.0%) | 0 (0.0%) |
| Total | 988 (89.9%) | 111 (10.1%) |
Health Insurance Coverage by Citizenship Status in Wibaux County
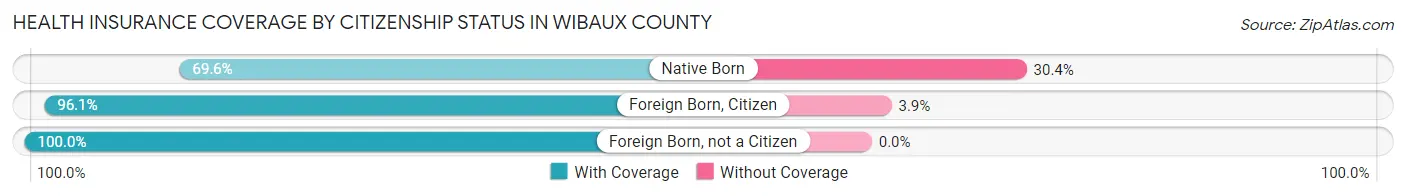
| Citizenship Status | With Coverage | Without Coverage |
| Native Born | 80 (69.6%) | 35 (30.4%) |
| Foreign Born, Citizen | 198 (96.1%) | 8 (3.9%) |
| Foreign Born, not a Citizen | 28 (100.0%) | 0 (0.0%) |
Health Insurance Coverage by Household Income in Wibaux County
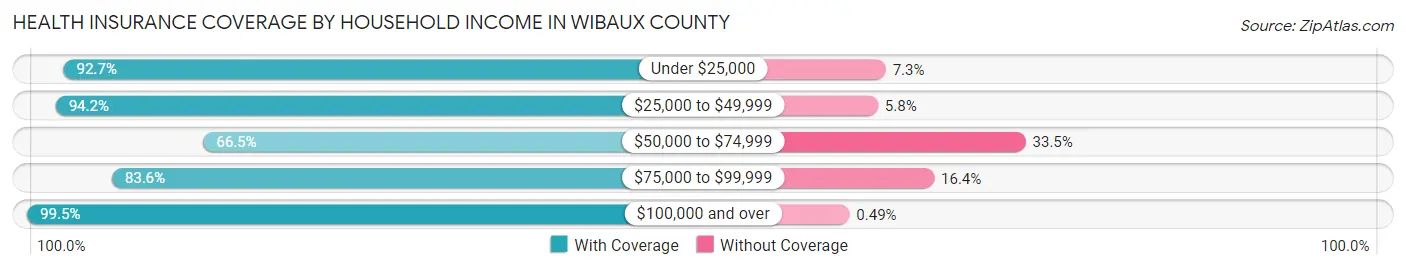
| Household Income | With Coverage | Without Coverage |
| Under $25,000 | 127 (92.7%) | 10 (7.3%) |
| $25,000 to $49,999 | 226 (94.2%) | 14 (5.8%) |
| $50,000 to $74,999 | 133 (66.5%) | 67 (33.5%) |
| $75,000 to $99,999 | 92 (83.6%) | 18 (16.4%) |
| $100,000 and over | 410 (99.5%) | 2 (0.5%) |
Public vs Private Health Insurance Coverage by Age in Wibaux County
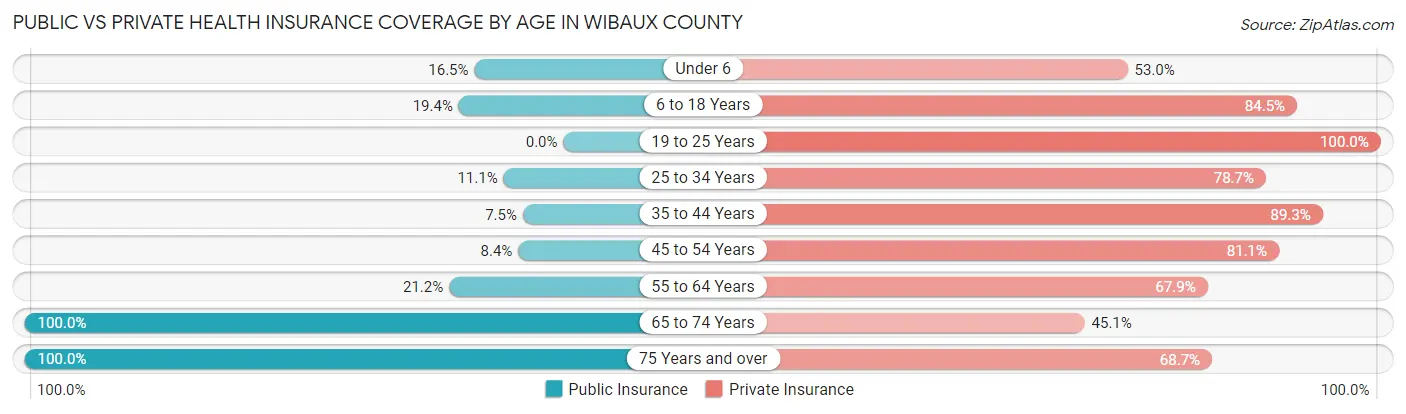
| Age Bracket | Public Insurance | Private Insurance |
| Under 6 | 19 (16.5%) | 61 (53.0%) |
| 6 to 18 Years | 40 (19.4%) | 174 (84.5%) |
| 19 to 25 Years | 0 (0.0%) | 28 (100.0%) |
| 25 to 34 Years | 12 (11.1%) | 85 (78.7%) |
| 35 to 44 Years | 7 (7.5%) | 83 (89.2%) |
| 45 to 54 Years | 12 (8.4%) | 116 (81.1%) |
| 55 to 64 Years | 35 (21.2%) | 112 (67.9%) |
| 65 to 74 Years | 142 (100.0%) | 64 (45.1%) |
| 75 Years and over | 99 (100.0%) | 68 (68.7%) |
| Total | 366 (33.3%) | 791 (72.0%) |
Disability Status by Sex by Age in Wibaux County
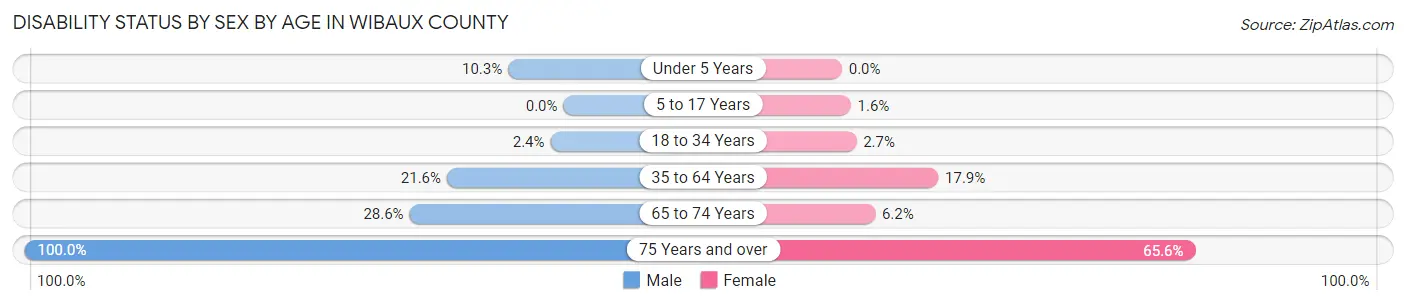
| Age Bracket | Male | Female |
| Under 5 Years | 4 (10.3%) | 0 (0.0%) |
| 5 to 17 Years | 0 (0.0%) | 2 (1.6%) |
| 18 to 34 Years | 2 (2.4%) | 2 (2.7%) |
| 35 to 64 Years | 48 (21.6%) | 32 (17.9%) |
| 65 to 74 Years | 22 (28.6%) | 4 (6.1%) |
| 75 Years and over | 35 (100.0%) | 42 (65.6%) |
Disability Class by Sex by Age in Wibaux County
Disability Class: Hearing Difficulty

| Age Bracket | Male | Female |
| Under 5 Years | 0 (0.0%) | 0 (0.0%) |
| 5 to 17 Years | 0 (0.0%) | 0 (0.0%) |
| 18 to 34 Years | 0 (0.0%) | 0 (0.0%) |
| 35 to 64 Years | 9 (4.1%) | 10 (5.6%) |
| 65 to 74 Years | 5 (6.5%) | 1 (1.5%) |
| 75 Years and over | 28 (80.0%) | 28 (43.8%) |
Disability Class: Vision Difficulty
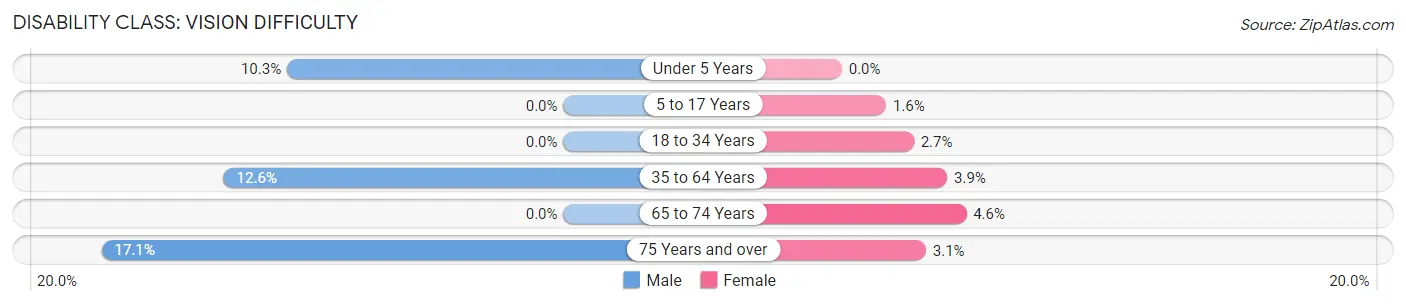
| Age Bracket | Male | Female |
| Under 5 Years | 4 (10.3%) | 0 (0.0%) |
| 5 to 17 Years | 0 (0.0%) | 2 (1.6%) |
| 18 to 34 Years | 0 (0.0%) | 2 (2.7%) |
| 35 to 64 Years | 28 (12.6%) | 7 (3.9%) |
| 65 to 74 Years | 0 (0.0%) | 3 (4.6%) |
| 75 Years and over | 6 (17.1%) | 2 (3.1%) |
Disability Class: Cognitive Difficulty
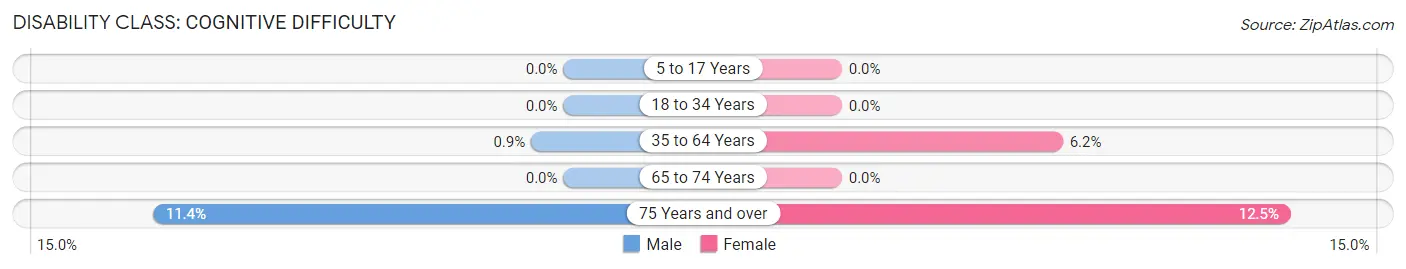
| Age Bracket | Male | Female |
| 5 to 17 Years | 0 (0.0%) | 0 (0.0%) |
| 18 to 34 Years | 0 (0.0%) | 0 (0.0%) |
| 35 to 64 Years | 2 (0.9%) | 11 (6.1%) |
| 65 to 74 Years | 0 (0.0%) | 0 (0.0%) |
| 75 Years and over | 4 (11.4%) | 8 (12.5%) |
Disability Class: Ambulatory Difficulty
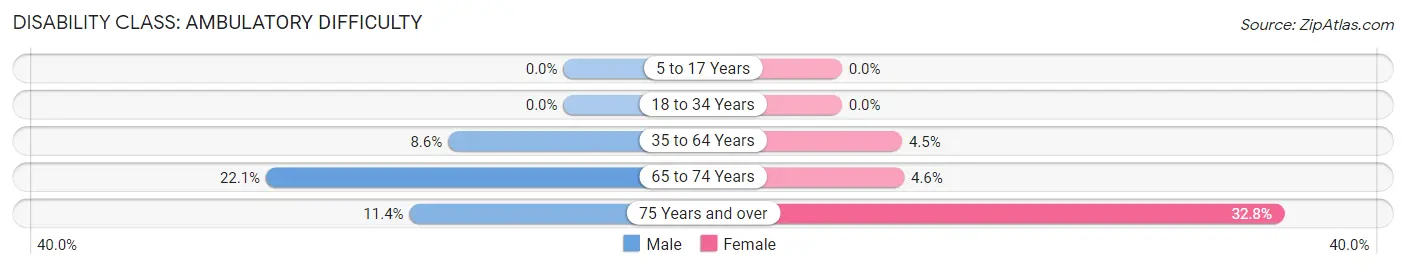
| Age Bracket | Male | Female |
| 5 to 17 Years | 0 (0.0%) | 0 (0.0%) |
| 18 to 34 Years | 0 (0.0%) | 0 (0.0%) |
| 35 to 64 Years | 19 (8.6%) | 8 (4.5%) |
| 65 to 74 Years | 17 (22.1%) | 3 (4.6%) |
| 75 Years and over | 4 (11.4%) | 21 (32.8%) |
Disability Class: Self-Care Difficulty
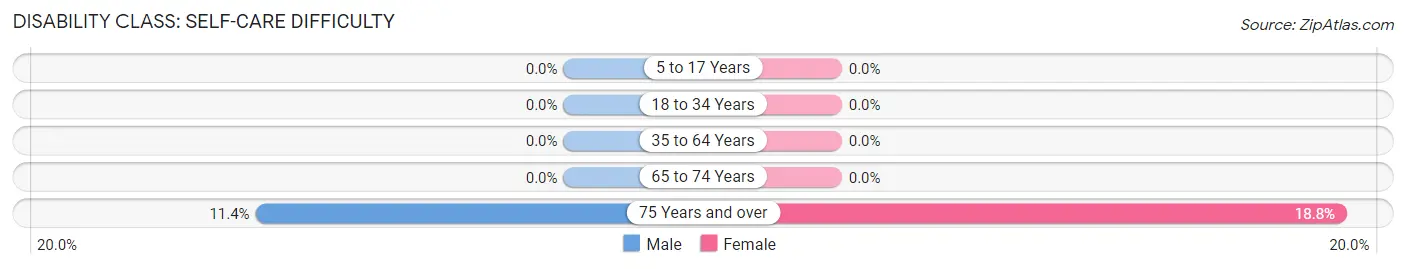
| Age Bracket | Male | Female |
| 5 to 17 Years | 0 (0.0%) | 0 (0.0%) |
| 18 to 34 Years | 0 (0.0%) | 0 (0.0%) |
| 35 to 64 Years | 0 (0.0%) | 0 (0.0%) |
| 65 to 74 Years | 0 (0.0%) | 0 (0.0%) |
| 75 Years and over | 4 (11.4%) | 12 (18.8%) |
Technology Access in Wibaux County
Computing Device Access in Wibaux County
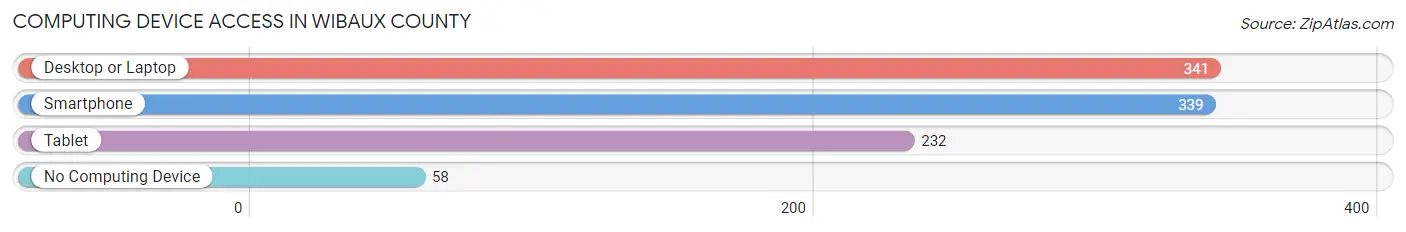
| Device Type | # Households | % Households |
| Desktop or Laptop | 341 | 73.2% |
| Smartphone | 339 | 72.8% |
| Tablet | 232 | 49.8% |
| No Computing Device | 58 | 12.4% |
| Total | 466 | 100.0% |
Internet Access in Wibaux County
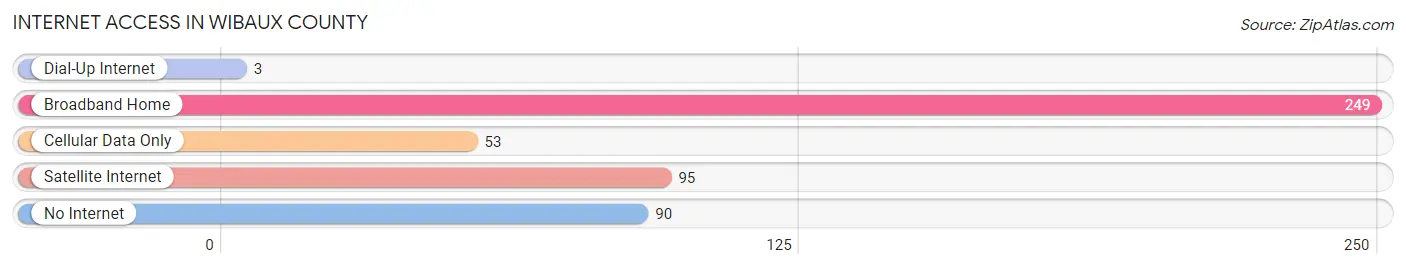
| Internet Type | # Households | % Households |
| Dial-Up Internet | 3 | 0.6% |
| Broadband Home | 249 | 53.4% |
| Cellular Data Only | 53 | 11.4% |
| Satellite Internet | 95 | 20.4% |
| No Internet | 90 | 19.3% |
| Total | 466 | 100.0% |
Wibaux County Summary
Wibaux County is located in the eastern part of Montana, in the United States. It is bordered by Dawson County to the north, Richland County to the east, Fallon County to the south, and McCone County to the west. The county seat is Wibaux, and the largest city is Glendive. The county has a total area of 1,845 square miles, of which 1,844 square miles is land and 1 square mile is water.
History
The area that is now Wibaux County was first inhabited by the Sioux and Assiniboine Native American tribes. The first white settlers arrived in the area in the late 1800s, and the county was officially established in 1914. The county was named after Pierre Wibaux, a French-Canadian fur trader who established a trading post in the area in the late 1800s.
Geography
Wibaux County is located in the eastern part of Montana, in the United States. It is bordered by Dawson County to the north, Richland County to the east, Fallon County to the south, and McCone County to the west. The county has a total area of 1,845 square miles, of which 1,844 square miles is land and 1 square mile is water. The terrain is mostly flat, with some rolling hills in the western part of the county. The county is home to several rivers, including the Yellowstone, Missouri, and Powder Rivers.
Economy
The economy of Wibaux County is largely based on agriculture and ranching. The county is home to several large ranches, and the main crops grown in the area are wheat, barley, and hay. The county also has a strong tourism industry, with visitors coming to the area to enjoy the natural beauty and outdoor activities.
Demographics
As of the 2010 census, the population of Wibaux County was 1,921. The racial makeup of the county was 95.3% White, 0.2% African American, 1.2% Native American, 0.2% Asian, 0.1% Pacific Islander, 0.7% from other races, and 2.3% from two or more races. The median household income was $37,917, and the median family income was $45,000. The per capita income was $19,945. About 11.2% of the population was below the poverty line.
Conclusion
Wibaux County is a rural county located in the eastern part of Montana. It is home to a diverse population and a strong agricultural and ranching economy. The county is also a popular tourist destination, with visitors coming to the area to enjoy the natural beauty and outdoor activities.
Common Questions
What is the Total Population of Wibaux County?
Total Population of Wibaux County is 1,119.
What is the Total Male Population of Wibaux County?
Total Male Population of Wibaux County is 542.
What is the Total Female Population of Wibaux County?
Total Female Population of Wibaux County is 577.
What is the Ratio of Males per 100 Females in Wibaux County?
There are 93.93 Males per 100 Females in Wibaux County.
What is the Ratio of Females per 100 Males in Wibaux County?
There are 106.46 Females per 100 Males in Wibaux County.
What is the Median Population Age in Wibaux County?
Median Population Age in Wibaux County is 46.4 Years.
What is the Average Family Size in Wibaux County
Average Family Size in Wibaux County is 3.0 People.
What is the Average Household Size in Wibaux County
Average Household Size in Wibaux County is 2.4 People.
What is Per Capita Income in Wibaux County?
Per Capita income in Wibaux County is $31,089.
What is the Median Family Income in Wibaux County?
Median Family Income in Wibaux County is $90,000.
What is the Median Household income in Wibaux County?
Median Household Income in Wibaux County is $58,750.
What is Income or Wage Gap in Wibaux County?
Income or Wage Gap in Wibaux County is 47.9%.
Women in Wibaux County earn 52.1 cents for every dollar earned by a man.
What is Inequality or Gini Index in Wibaux County?
Inequality or Gini Index in Wibaux County is 0.41.
How Large is the Labor Force in Wibaux County?
There are 489 People in the Labor Forcein in Wibaux County.
What is the Percentage of People in the Labor Force in Wibaux County?
58.1% of People are in the Labor Force in Wibaux County.