Wheatland County, MT
Wheatland County Map
Wheatland County Overview
2,060
TOTAL POPULATION
942
MALE POPULATION
1,118
FEMALE POPULATION
84.26
MALES / 100 FEMALES
118.68
FEMALES / 100 MALES
49.1
MEDIAN AGE
2.8
AVG FAMILY SIZE
2.3
AVG HOUSEHOLD SIZE
$28,410
PER CAPITA INCOME
$59,766
AVG FAMILY INCOME
$48,272
AVG HOUSEHOLD INCOME
31.1%
WAGE / INCOME GAP [ % ]
68.9¢/ $1
WAGE / INCOME GAP [ $ ]
$26,129
FAMILY INCOME DEFICIT
0.50
INEQUALITY / GINI INDEX
829
LABOR FORCE [ PEOPLE ]
49.0%
PERCENT IN LABOR FORCE
0.2%
UNEMPLOYMENT RATE
Wheatland County Area Codes
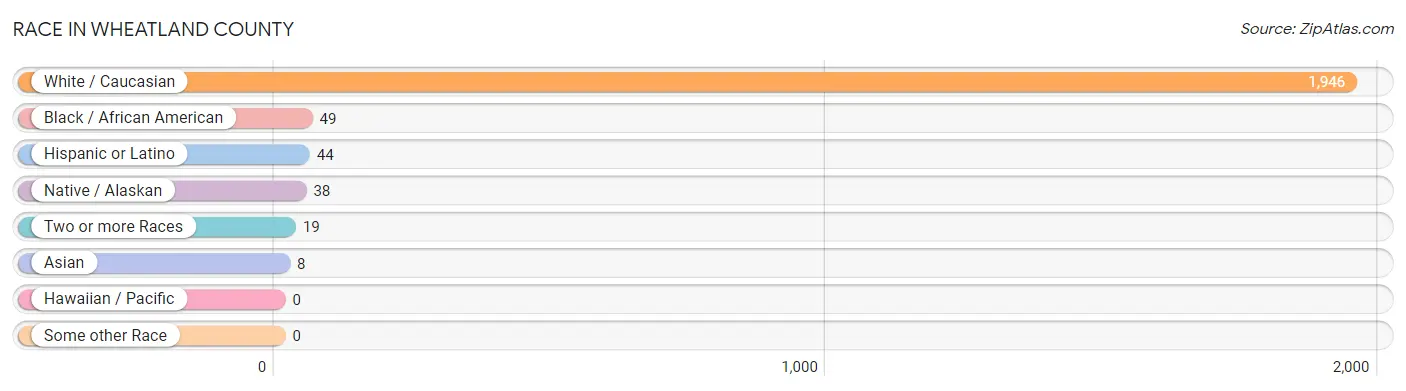
Race in Wheatland County
The most populous races in Wheatland County are White / Caucasian (1,946 | 94.5%), Black / African American (49 | 2.4%), and Hispanic or Latino (44 | 2.1%).
| Race | # Population | % Population |
| Asian | 8 | 0.4% |
| Black / African American | 49 | 2.4% |
| Hawaiian / Pacific | 0 | 0.0% |
| Hispanic or Latino | 44 | 2.1% |
| Native / Alaskan | 38 | 1.8% |
| White / Caucasian | 1,946 | 94.5% |
| Two or more Races | 19 | 0.9% |
| Some other Race | 0 | 0.0% |
| Total | 2,060 | 100.0% |
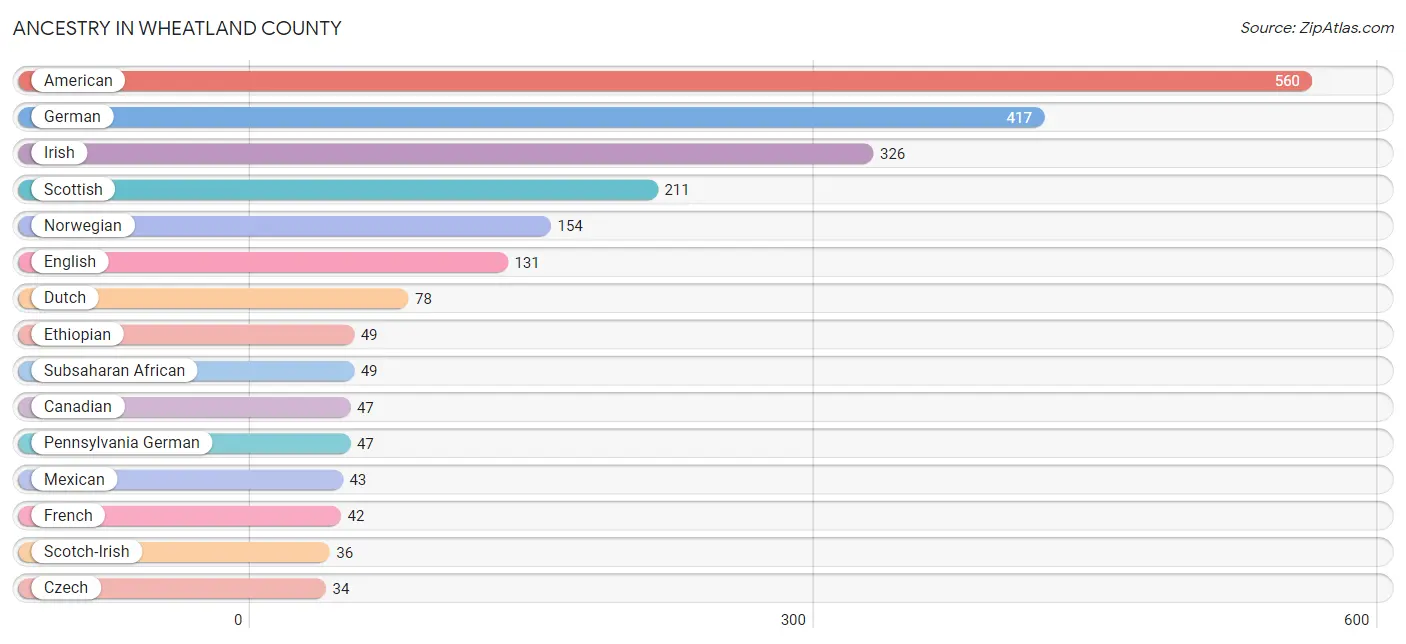
Ancestry in Wheatland County
The most populous ancestries reported in Wheatland County are American (560 | 27.2%), German (417 | 20.2%), Irish (326 | 15.8%), Scottish (211 | 10.2%), and Norwegian (154 | 7.5%), together accounting for 81.0% of all Wheatland County residents.
| Ancestry | # Population | % Population |
| American | 560 | 27.2% |
| Arab | 1 | 0.1% |
| Austrian | 5 | 0.2% |
| Belgian | 12 | 0.6% |
| Blackfeet | 2 | 0.1% |
| British | 4 | 0.2% |
| Canadian | 47 | 2.3% |
| Choctaw | 27 | 1.3% |
| Cree | 2 | 0.1% |
| Czech | 34 | 1.7% |
| Danish | 9 | 0.4% |
| Dutch | 78 | 3.8% |
| English | 131 | 6.4% |
| Ethiopian | 49 | 2.4% |
| European | 17 | 0.8% |
| French | 42 | 2.0% |
| German | 417 | 20.2% |
| Greek | 1 | 0.1% |
| Hungarian | 3 | 0.2% |
| Irish | 326 | 15.8% |
| Italian | 30 | 1.5% |
| Korean | 18 | 0.9% |
| Mexican | 43 | 2.1% |
| Norwegian | 154 | 7.5% |
| Pennsylvania German | 47 | 2.3% |
| Polish | 24 | 1.2% |
| Puerto Rican | 1 | 0.1% |
| Russian | 33 | 1.6% |
| Scotch-Irish | 36 | 1.8% |
| Scottish | 211 | 10.2% |
| Subsaharan African | 49 | 2.4% |
| Swedish | 10 | 0.5% |
| Syrian | 1 | 0.1% |
| Welsh | 18 | 0.9% | View All 34 Rows |
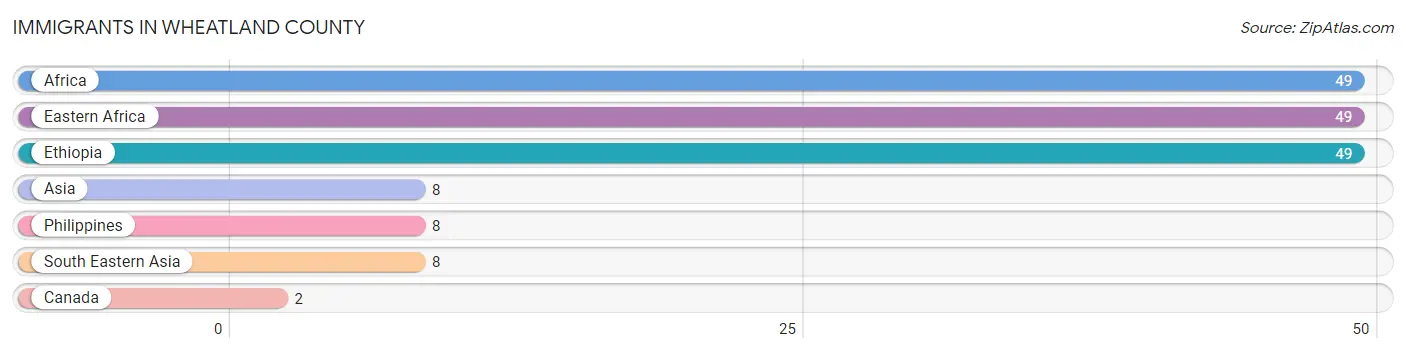
Immigrants in Wheatland County
The most numerous immigrant groups reported in Wheatland County came from Africa (49 | 2.4%), Eastern Africa (49 | 2.4%), Ethiopia (49 | 2.4%), Asia (8 | 0.4%), and Philippines (8 | 0.4%), together accounting for 7.9% of all Wheatland County residents.
| Immigration Origin | # Population | % Population |
| Africa | 49 | 2.4% |
| Asia | 8 | 0.4% |
| Canada | 2 | 0.1% |
| Eastern Africa | 49 | 2.4% |
| Ethiopia | 49 | 2.4% |
| Philippines | 8 | 0.4% |
| South Eastern Asia | 8 | 0.4% | View All 7 Rows |
Sex and Age in Wheatland County
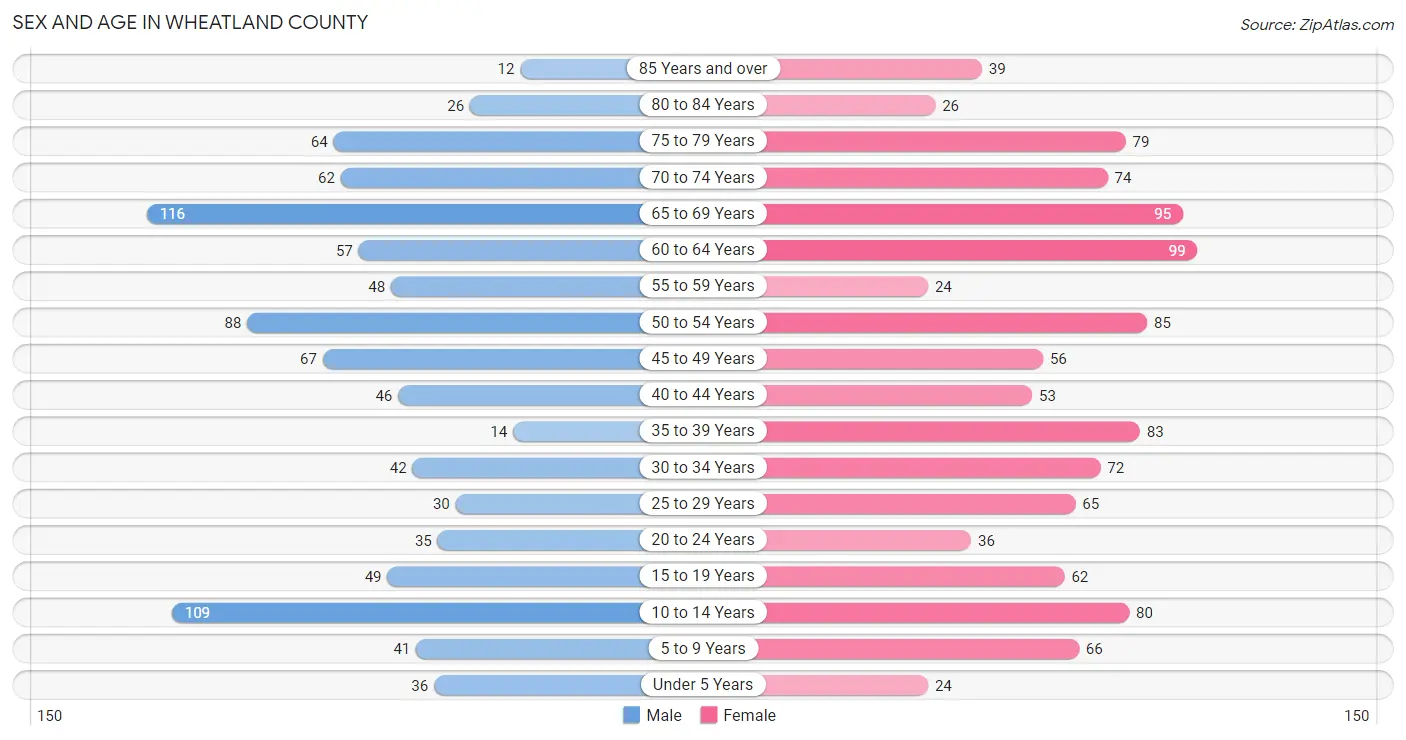
Sex and Age in Wheatland County
The most populous age groups in Wheatland County are 65 to 69 Years (116 | 12.3%) for men and 60 to 64 Years (99 | 8.9%) for women.
| Age Bracket | Male | Female |
| Under 5 Years | 36 (3.8%) | 24 (2.1%) |
| 5 to 9 Years | 41 (4.3%) | 66 (5.9%) |
| 10 to 14 Years | 109 (11.6%) | 80 (7.2%) |
| 15 to 19 Years | 49 (5.2%) | 62 (5.6%) |
| 20 to 24 Years | 35 (3.7%) | 36 (3.2%) |
| 25 to 29 Years | 30 (3.2%) | 65 (5.8%) |
| 30 to 34 Years | 42 (4.5%) | 72 (6.4%) |
| 35 to 39 Years | 14 (1.5%) | 83 (7.4%) |
| 40 to 44 Years | 46 (4.9%) | 53 (4.7%) |
| 45 to 49 Years | 67 (7.1%) | 56 (5.0%) |
| 50 to 54 Years | 88 (9.3%) | 85 (7.6%) |
| 55 to 59 Years | 48 (5.1%) | 24 (2.1%) |
| 60 to 64 Years | 57 (6.0%) | 99 (8.9%) |
| 65 to 69 Years | 116 (12.3%) | 95 (8.5%) |
| 70 to 74 Years | 62 (6.6%) | 74 (6.6%) |
| 75 to 79 Years | 64 (6.8%) | 79 (7.1%) |
| 80 to 84 Years | 26 (2.8%) | 26 (2.3%) |
| 85 Years and over | 12 (1.3%) | 39 (3.5%) |
| Total | 942 (100.0%) | 1,118 (100.0%) |
Families and Households in Wheatland County
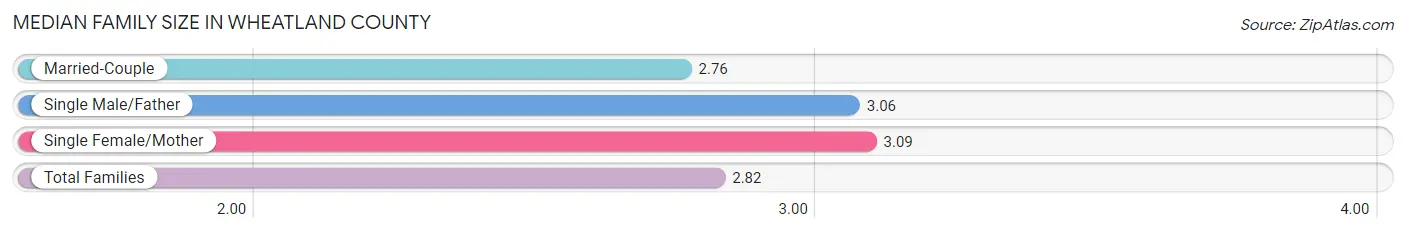
Median Family Size in Wheatland County
The median family size in Wheatland County is 2.82 persons per family, with single female/mother families (64 | 11.2%) accounting for the largest median family size of 3.09 persons per family. On the other hand, married-couple families (474 | 82.7%) represent the smallest median family size with 2.76 persons per family.
| Family Type | # Families | Family Size |
| Married-Couple | 474 (82.7%) | 2.76 |
| Single Male/Father | 35 (6.1%) | 3.06 |
| Single Female/Mother | 64 (11.2%) | 3.09 |
| Total Families | 573 (100.0%) | 2.82 |
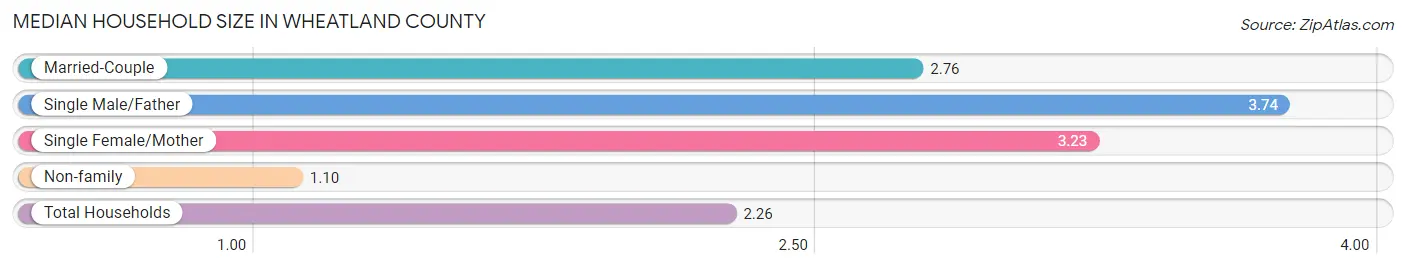
Median Household Size in Wheatland County
The median household size in Wheatland County is 2.26 persons per household, with single male/father households (35 | 4.0%) accounting for the largest median household size of 3.74 persons per household. non-family households (302 | 34.5%) represent the smallest median household size with 1.10 persons per household.
| Household Type | # Households | Household Size |
| Married-Couple | 474 (54.2%) | 2.76 |
| Single Male/Father | 35 (4.0%) | 3.74 |
| Single Female/Mother | 64 (7.3%) | 3.23 |
| Non-family | 302 (34.5%) | 1.10 |
| Total Households | 875 (100.0%) | 2.26 |
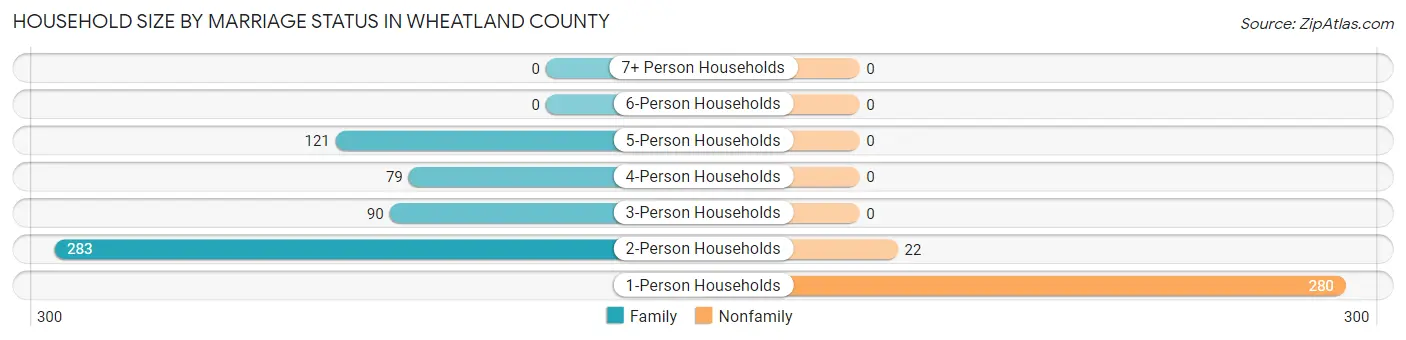
Household Size by Marriage Status in Wheatland County
Out of a total of 875 households in Wheatland County, 573 (65.5%) are family households, while 302 (34.5%) are nonfamily households. The most numerous type of family households are 2-person households, comprising 283, and the most common type of nonfamily households are 1-person households, comprising 280.
| Household Size | Family Households | Nonfamily Households |
| 1-Person Households | - | 280 (32.0%) |
| 2-Person Households | 283 (32.3%) | 22 (2.5%) |
| 3-Person Households | 90 (10.3%) | 0 (0.0%) |
| 4-Person Households | 79 (9.0%) | 0 (0.0%) |
| 5-Person Households | 121 (13.8%) | 0 (0.0%) |
| 6-Person Households | 0 (0.0%) | 0 (0.0%) |
| 7+ Person Households | 0 (0.0%) | 0 (0.0%) |
| Total | 573 (65.5%) | 302 (34.5%) |
Female Fertility in Wheatland County
Fertility by Age in Wheatland County
Average fertility rate in Wheatland County is 16.0 births per 1,000 women. Women in the age bracket of 20 to 34 years have the highest fertility rate with 40.0 births per 1,000 women. Women in the age bracket of 20 to 34 years acount for 100.0% of all women with births.
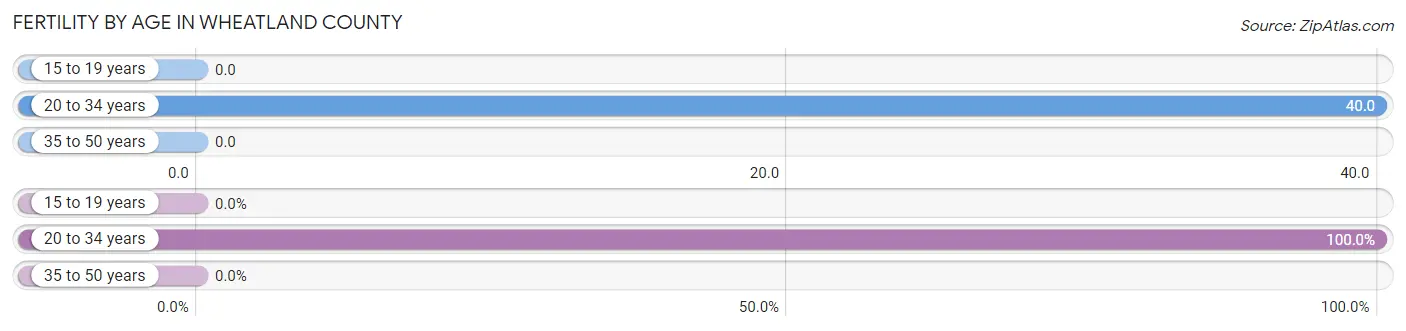
| Age Bracket | Women with Births | Births / 1,000 Women |
| 15 to 19 years | 0 (0.0%) | 0.0 |
| 20 to 34 years | 7 (100.0%) | 40.0 |
| 35 to 50 years | 0 (0.0%) | 0.0 |
| Total | 7 (100.0%) | 16.0 |
Fertility by Age by Marriage Status in Wheatland County
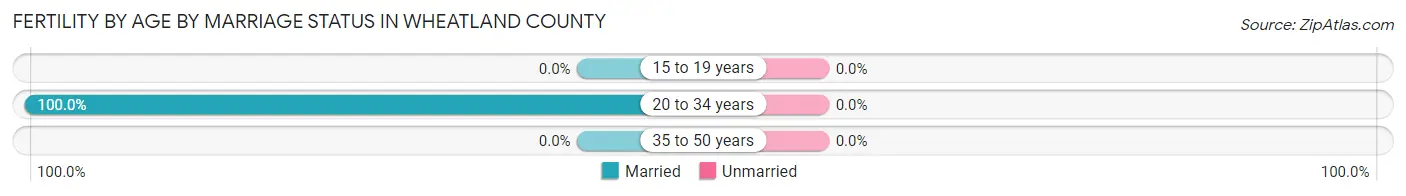
| Age Bracket | Married | Unmarried |
| 15 to 19 years | 0 (0.0%) | 0 (0.0%) |
| 20 to 34 years | 7 (100.0%) | 0 (0.0%) |
| 35 to 50 years | 0 (0.0%) | 0 (0.0%) |
| Total | 7 (100.0%) | 0 (0.0%) |
Fertility by Education in Wheatland County
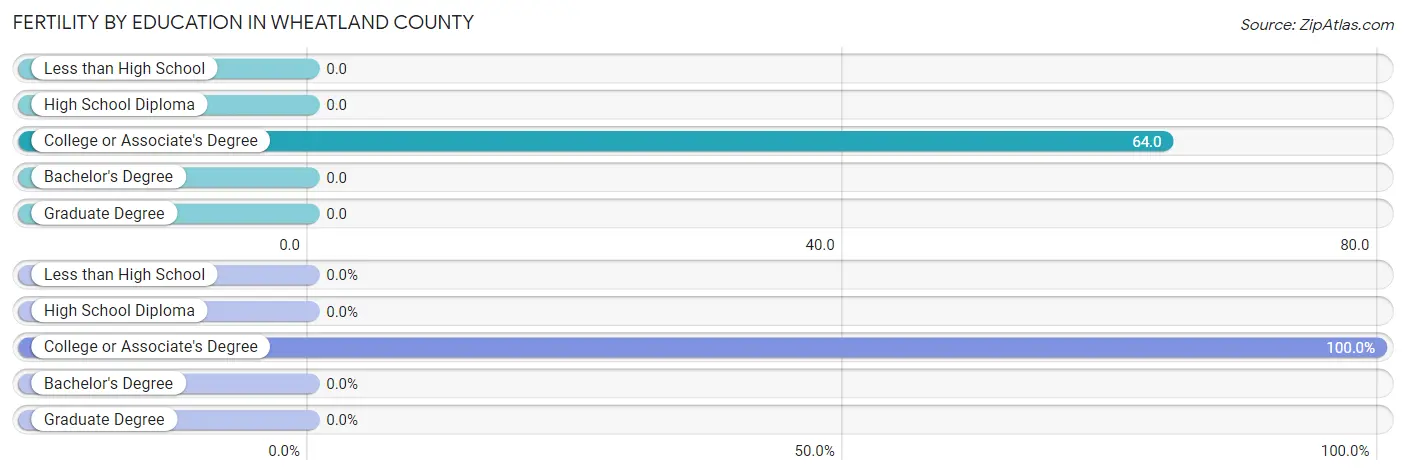
| Educational Attainment | Women with Births | Births / 1,000 Women |
| Less than High School | 0 (0.0%) | 0.0 |
| High School Diploma | 0 (0.0%) | 0.0 |
| College or Associate's Degree | 7 (100.0%) | 64.0 |
| Bachelor's Degree | 0 (0.0%) | 0.0 |
| Graduate Degree | 0 (0.0%) | 0.0 |
| Total | 7 (100.0%) | 16.0 |
Fertility by Education by Marriage Status in Wheatland County
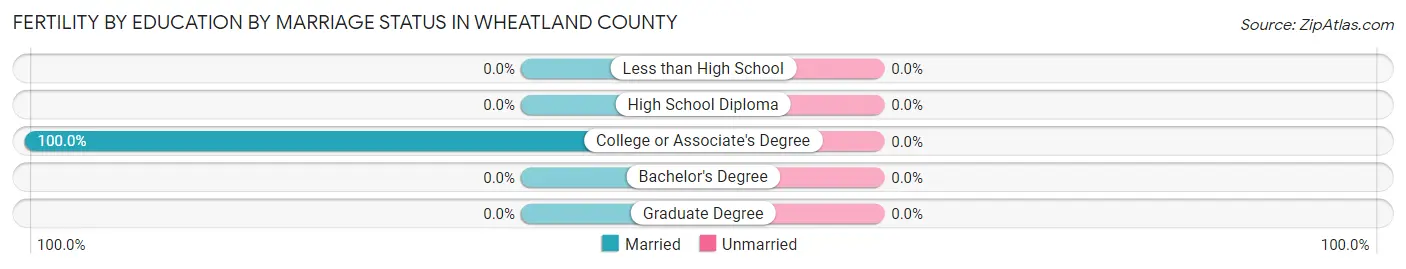
| Educational Attainment | Married | Unmarried |
| Less than High School | 0 (0.0%) | 0 (0.0%) |
| High School Diploma | 0 (0.0%) | 0 (0.0%) |
| College or Associate's Degree | 7 (100.0%) | 0 (0.0%) |
| Bachelor's Degree | 0 (0.0%) | 0 (0.0%) |
| Graduate Degree | 0 (0.0%) | 0 (0.0%) |
| Total | 7 (100.0%) | 0 (0.0%) |
Income in Wheatland County
Income Overview in Wheatland County
Per Capita Income in Wheatland County is $28,410, while median incomes of families and households are $59,766 and $48,272 respectively.
| Characteristic | Number | Measure |
| Per Capita Income | 2,060 | $28,410 |
| Median Family Income | 573 | $59,766 |
| Mean Family Income | 573 | $76,392 |
| Median Household Income | 875 | $48,272 |
| Mean Household Income | 875 | $63,128 |
| Income Deficit | 573 | $26,129 |
| Wage / Income Gap (%) | 2,060 | 31.08% |
| Wage / Income Gap ($) | 2,060 | 68.92¢ per $1 |
| Gini / Inequality Index | 2,060 | 0.50 |
Earnings by Sex in Wheatland County
Average Earnings in Wheatland County are $33,891, $40,368 for men and $27,821 for women, a difference of 31.1%.
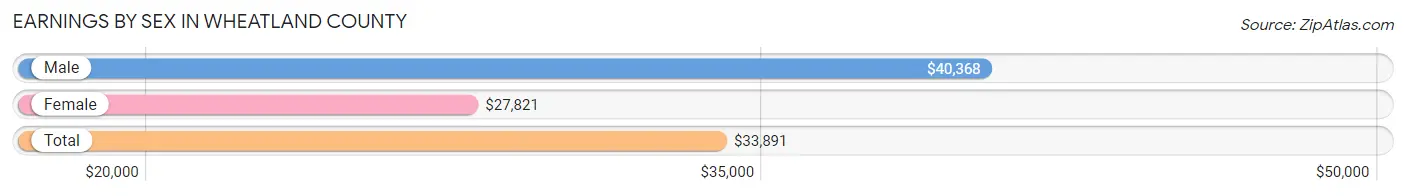
| Sex | Number | Average Earnings |
| Male | 446 (47.8%) | $40,368 |
| Female | 487 (52.2%) | $27,821 |
| Total | 933 (100.0%) | $33,891 |
Earnings by Sex by Income Bracket in Wheatland County
The most common earnings brackets in Wheatland County are $30,000 to $34,999 for men (60 | 13.5%) and $100,000+ for women (52 | 10.7%).
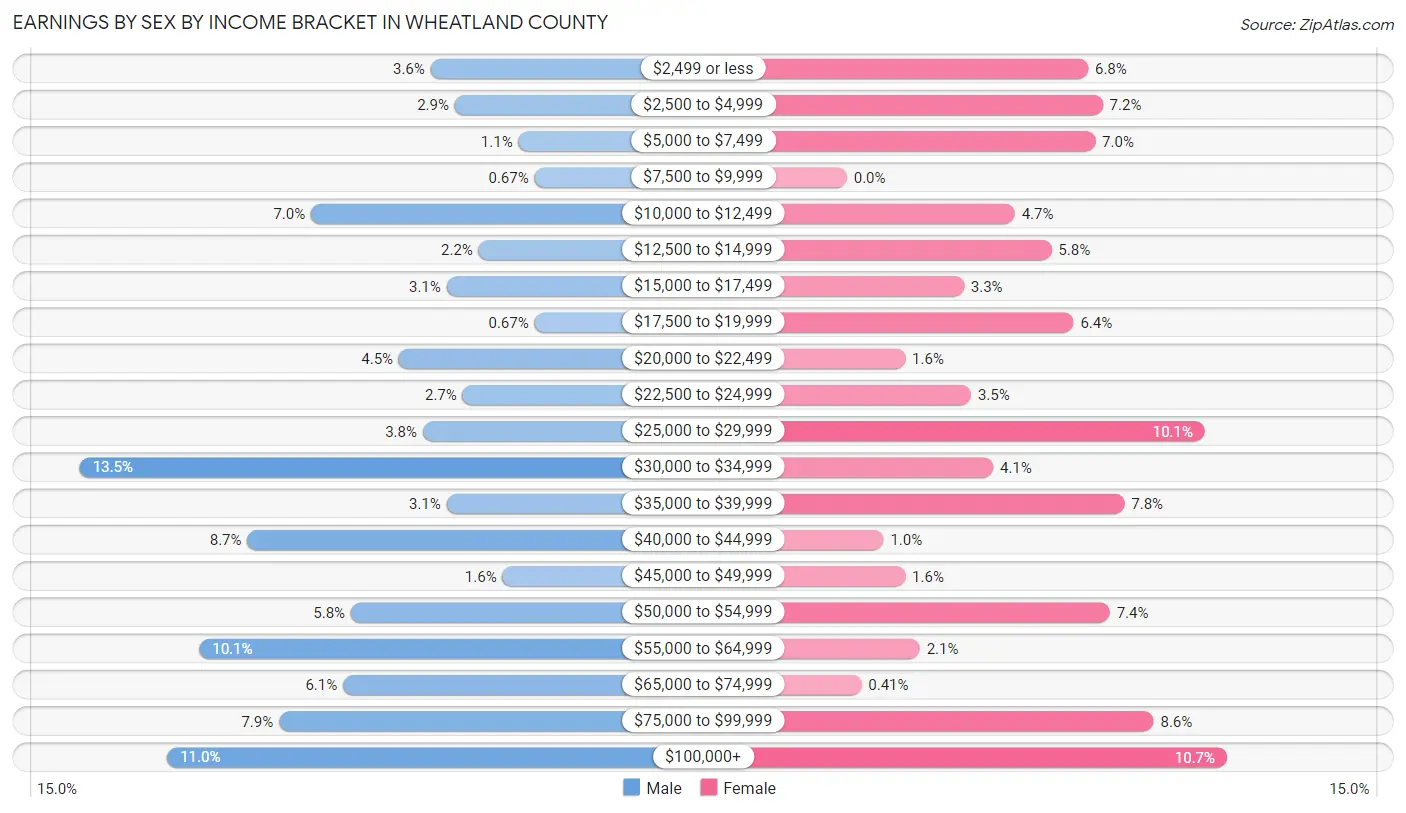
| Income | Male | Female |
| $2,499 or less | 16 (3.6%) | 33 (6.8%) |
| $2,500 to $4,999 | 13 (2.9%) | 35 (7.2%) |
| $5,000 to $7,499 | 5 (1.1%) | 34 (7.0%) |
| $7,500 to $9,999 | 3 (0.7%) | 0 (0.0%) |
| $10,000 to $12,499 | 31 (7.0%) | 23 (4.7%) |
| $12,500 to $14,999 | 10 (2.2%) | 28 (5.8%) |
| $15,000 to $17,499 | 14 (3.1%) | 16 (3.3%) |
| $17,500 to $19,999 | 3 (0.7%) | 31 (6.4%) |
| $20,000 to $22,499 | 20 (4.5%) | 8 (1.6%) |
| $22,500 to $24,999 | 12 (2.7%) | 17 (3.5%) |
| $25,000 to $29,999 | 17 (3.8%) | 49 (10.1%) |
| $30,000 to $34,999 | 60 (13.5%) | 20 (4.1%) |
| $35,000 to $39,999 | 14 (3.1%) | 38 (7.8%) |
| $40,000 to $44,999 | 39 (8.7%) | 5 (1.0%) |
| $45,000 to $49,999 | 7 (1.6%) | 8 (1.6%) |
| $50,000 to $54,999 | 26 (5.8%) | 36 (7.4%) |
| $55,000 to $64,999 | 45 (10.1%) | 10 (2.1%) |
| $65,000 to $74,999 | 27 (6.0%) | 2 (0.4%) |
| $75,000 to $99,999 | 35 (7.9%) | 42 (8.6%) |
| $100,000+ | 49 (11.0%) | 52 (10.7%) |
| Total | 446 (100.0%) | 487 (100.0%) |
Earnings by Sex by Educational Attainment in Wheatland County
Average earnings in Wheatland County are $39,286 for men and $29,429 for women, a difference of 25.1%. Men with an educational attainment of less than high school enjoy the highest average annual earnings of $54,917, while those with high school diploma education earn the least with $30,556. Women with an educational attainment of graduate degree earn the most with the average annual earnings of $112,537, while those with less than high school education have the smallest earnings of $5,573.
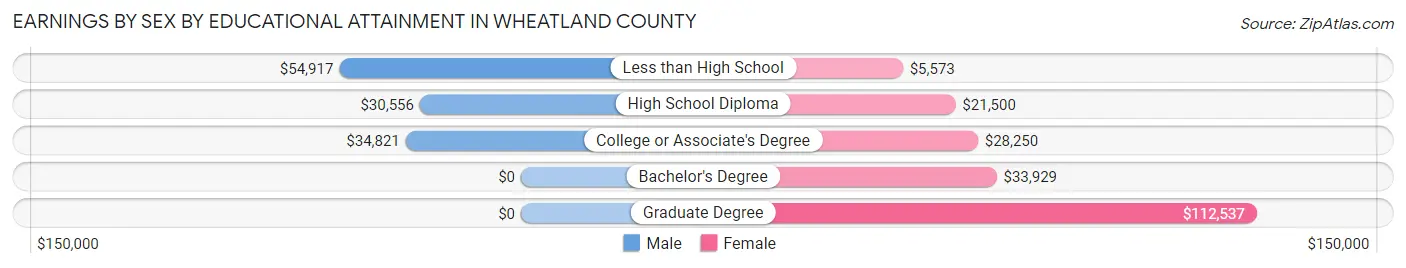
| Educational Attainment | Male Income | Female Income |
| Less than High School | $54,917 | $5,573 |
| High School Diploma | $30,556 | $21,500 |
| College or Associate's Degree | $34,821 | $28,250 |
| Bachelor's Degree | - | - |
| Graduate Degree | - | - |
| Total | $39,286 | $29,429 |
Family Income in Wheatland County
Family Income Brackets in Wheatland County
According to the Wheatland County family income data, there are 121 families falling into the $50,000 to $74,999 income range, which is the most common income bracket and makes up 21.1% of all families. Conversely, the $10,000 to $14,999 income bracket is the least frequent group with only 5 families (0.9%) belonging to this category.
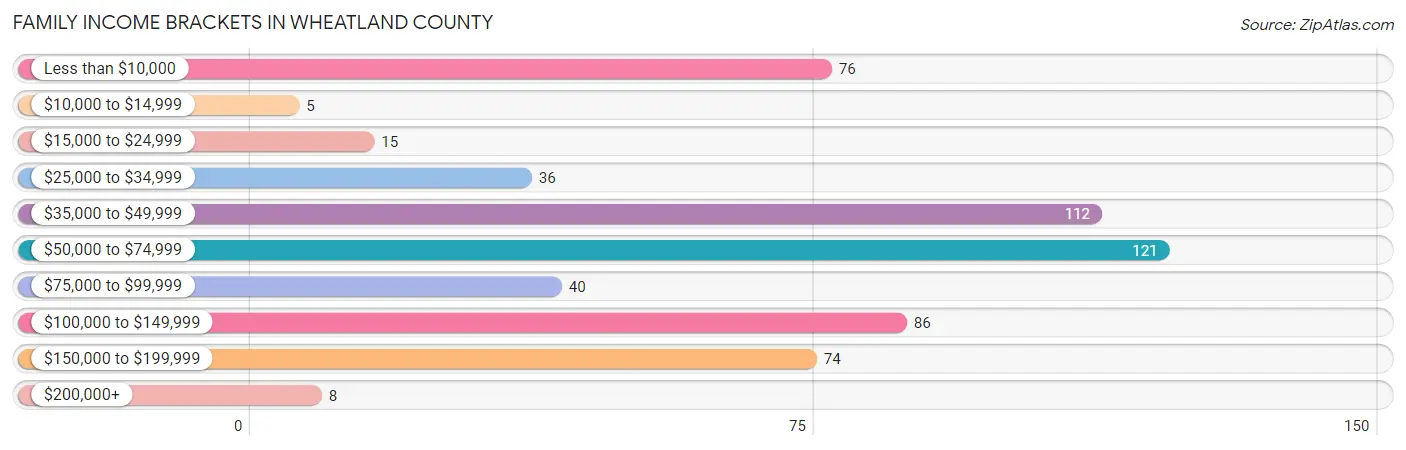
| Income Bracket | # Families | % Families |
| Less than $10,000 | 76 | 13.3% |
| $10,000 to $14,999 | 5 | 0.9% |
| $15,000 to $24,999 | 15 | 2.6% |
| $25,000 to $34,999 | 36 | 6.3% |
| $35,000 to $49,999 | 112 | 19.5% |
| $50,000 to $74,999 | 121 | 21.1% |
| $75,000 to $99,999 | 40 | 7.0% |
| $100,000 to $149,999 | 86 | 15.0% |
| $150,000 to $199,999 | 74 | 12.9% |
| $200,000+ | 8 | 1.4% |
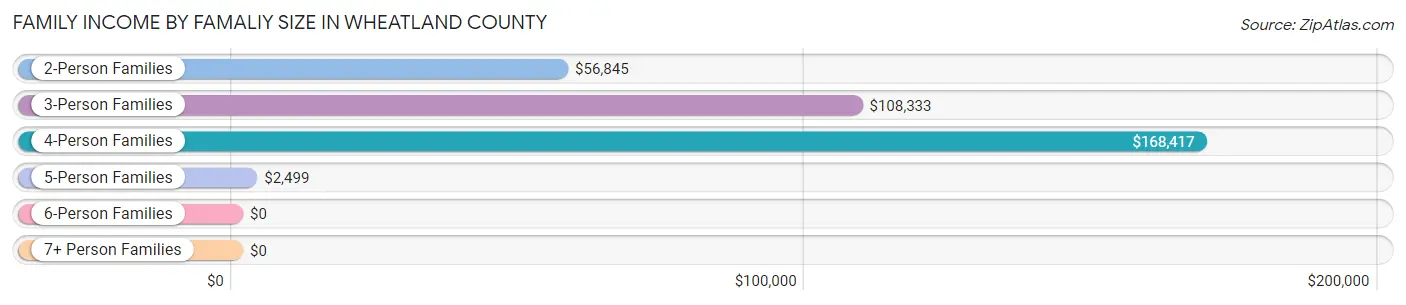
Family Income by Famaliy Size in Wheatland County
4-person families (85 | 14.8%) account for the highest median family income in Wheatland County with $168,417 per family, while 4-person families (85 | 14.8%) have the highest median income of $42,104 per family member.
| Income Bracket | # Families | Median Income |
| 2-Person Families | 295 (51.5%) | $56,845 |
| 3-Person Families | 82 (14.3%) | $108,333 |
| 4-Person Families | 85 (14.8%) | $168,417 |
| 5-Person Families | 111 (19.4%) | $2,499 |
| 6-Person Families | 0 (0.0%) | $0 |
| 7+ Person Families | 0 (0.0%) | $0 |
| Total | 573 (100.0%) | $59,766 |
Family Income by Number of Earners in Wheatland County
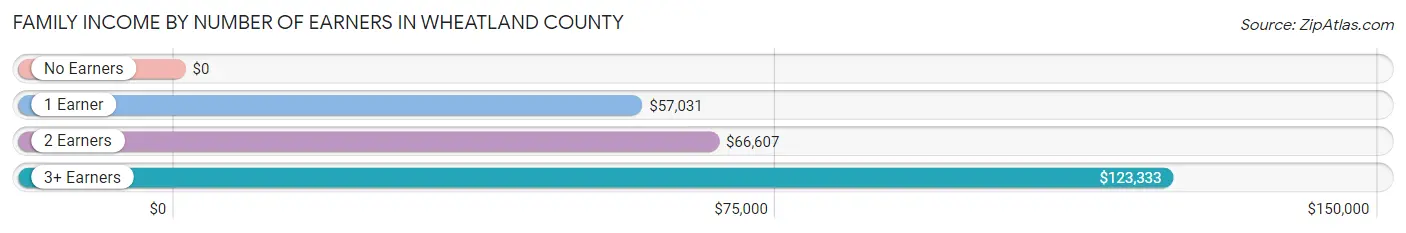
| Number of Earners | # Families | Median Income |
| No Earners | 160 (27.9%) | $0 |
| 1 Earner | 154 (26.9%) | $57,031 |
| 2 Earners | 231 (40.3%) | $66,607 |
| 3+ Earners | 28 (4.9%) | $123,333 |
| Total | 573 (100.0%) | $59,766 |
Household Income in Wheatland County
Household Income Brackets in Wheatland County
With 168 households falling in the category, the $50,000 to $74,999 income range is the most frequent in Wheatland County, accounting for 19.2% of all households. In contrast, only 22 households (2.5%) fall into the $10,000 to $14,999 income bracket, making it the least populous group.
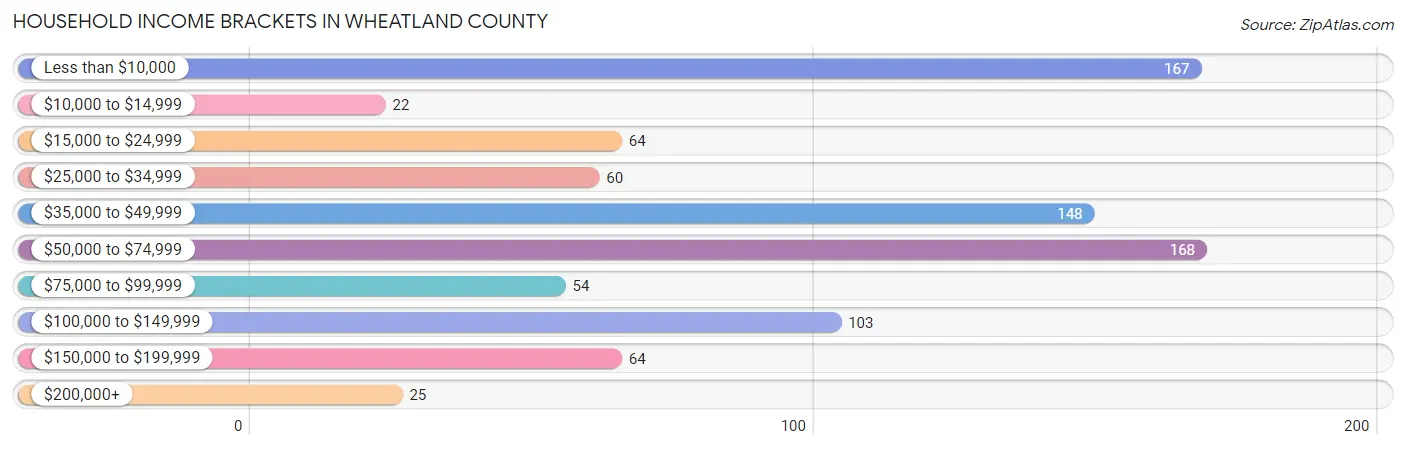
| Income Bracket | # Households | % Households |
| Less than $10,000 | 167 | 19.1% |
| $10,000 to $14,999 | 22 | 2.5% |
| $15,000 to $24,999 | 64 | 7.3% |
| $25,000 to $34,999 | 60 | 6.9% |
| $35,000 to $49,999 | 148 | 16.9% |
| $50,000 to $74,999 | 168 | 19.2% |
| $75,000 to $99,999 | 54 | 6.2% |
| $100,000 to $149,999 | 103 | 11.8% |
| $150,000 to $199,999 | 64 | 7.3% |
| $200,000+ | 25 | 2.9% |
Household Income by Householder Age in Wheatland County
The median household income in Wheatland County is $48,272, with the highest median household income of $58,194 found in the 45 to 64 years age bracket for the primary householder. A total of 300 households (34.3%) fall into this category. Meanwhile, the 15 to 24 years age bracket for the primary householder has the lowest median household income of $0, with 7 households (0.8%) in this group.
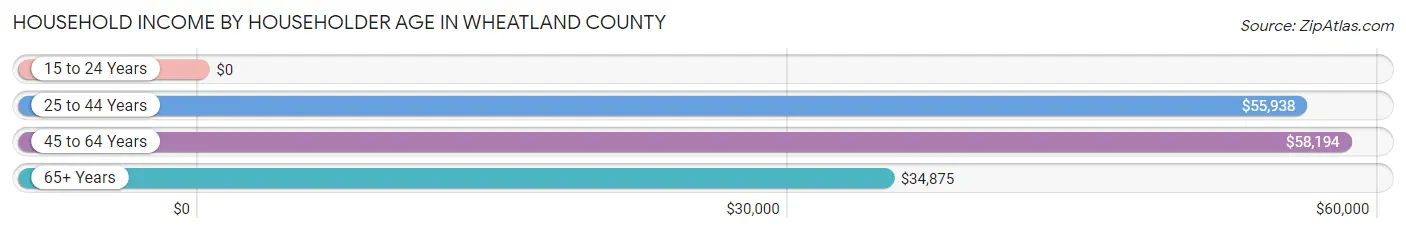
| Income Bracket | # Households | Median Income |
| 15 to 24 Years | 7 (0.8%) | $0 |
| 25 to 44 Years | 173 (19.8%) | $55,938 |
| 45 to 64 Years | 300 (34.3%) | $58,194 |
| 65+ Years | 395 (45.1%) | $34,875 |
| Total | 875 (100.0%) | $48,272 |
Poverty in Wheatland County
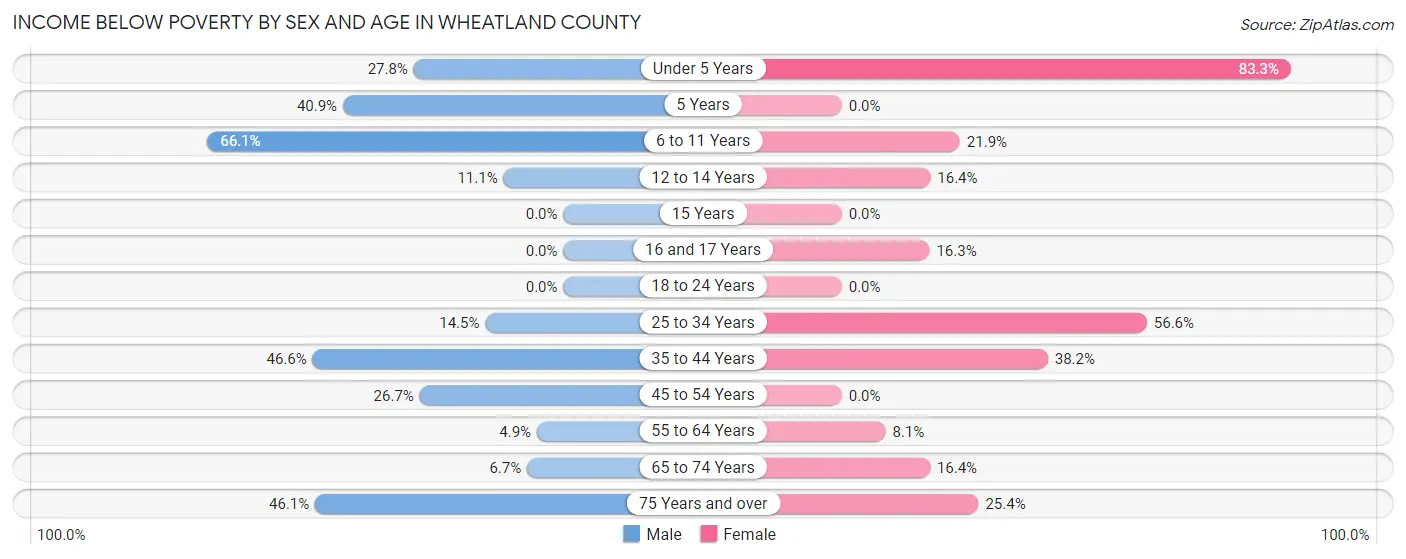
Income Below Poverty by Sex and Age in Wheatland County
With 22.1% poverty level for males and 23.1% for females among the residents of Wheatland County, 6 to 11 year old males and under 5 year old females are the most vulnerable to poverty, with 37 males (66.1%) and 20 females (83.3%) in their respective age groups living below the poverty level.
| Age Bracket | Male | Female |
| Under 5 Years | 10 (27.8%) | 20 (83.3%) |
| 5 Years | 9 (40.9%) | 0 (0.0%) |
| 6 to 11 Years | 37 (66.1%) | 16 (21.9%) |
| 12 to 14 Years | 8 (11.1%) | 12 (16.4%) |
| 15 Years | 0 (0.0%) | 0 (0.0%) |
| 16 and 17 Years | 0 (0.0%) | 7 (16.3%) |
| 18 to 24 Years | 0 (0.0%) | 0 (0.0%) |
| 25 to 34 Years | 10 (14.5%) | 77 (56.6%) |
| 35 to 44 Years | 27 (46.6%) | 52 (38.2%) |
| 45 to 54 Years | 40 (26.7%) | 0 (0.0%) |
| 55 to 64 Years | 5 (4.9%) | 10 (8.1%) |
| 65 to 74 Years | 12 (6.7%) | 27 (16.4%) |
| 75 Years and over | 47 (46.1%) | 34 (25.4%) |
| Total | 205 (22.1%) | 255 (23.1%) |
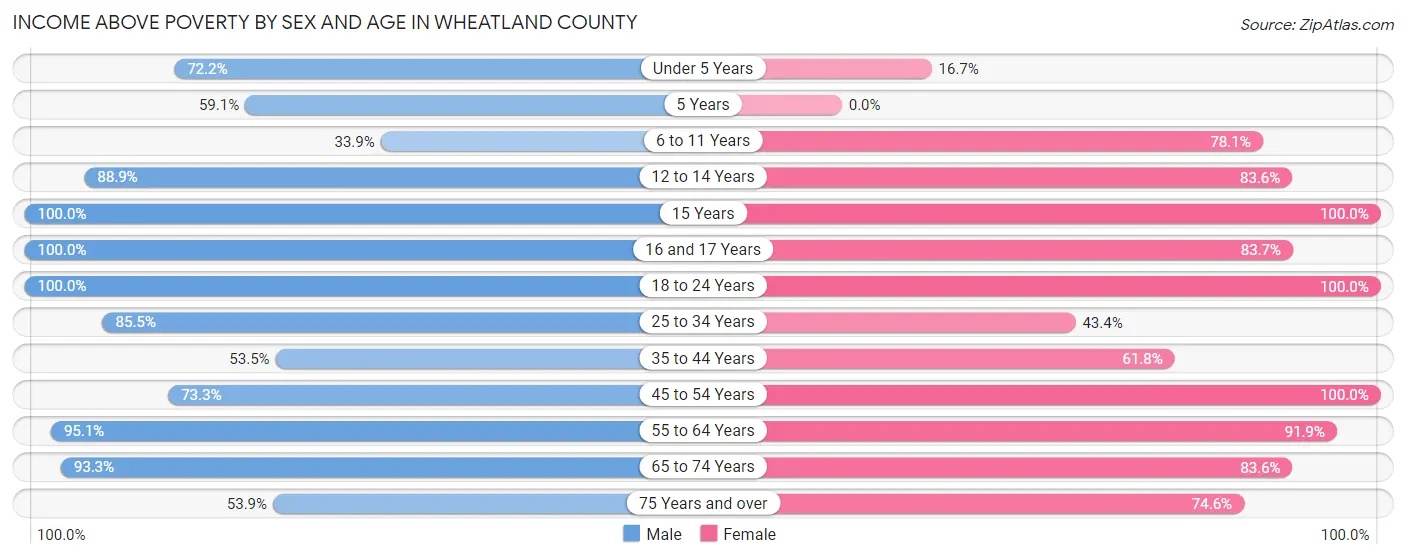
Income Above Poverty by Sex and Age in Wheatland County
According to the poverty statistics in Wheatland County, males aged 15 years and females aged 15 years are the age groups that are most secure financially, with 100.0% of males and 100.0% of females in these age groups living above the poverty line.
| Age Bracket | Male | Female |
| Under 5 Years | 26 (72.2%) | 4 (16.7%) |
| 5 Years | 13 (59.1%) | 0 (0.0%) |
| 6 to 11 Years | 19 (33.9%) | 57 (78.1%) |
| 12 to 14 Years | 64 (88.9%) | 61 (83.6%) |
| 15 Years | 8 (100.0%) | 4 (100.0%) |
| 16 and 17 Years | 20 (100.0%) | 36 (83.7%) |
| 18 to 24 Years | 53 (100.0%) | 51 (100.0%) |
| 25 to 34 Years | 59 (85.5%) | 59 (43.4%) |
| 35 to 44 Years | 31 (53.4%) | 84 (61.8%) |
| 45 to 54 Years | 110 (73.3%) | 141 (100.0%) |
| 55 to 64 Years | 97 (95.1%) | 113 (91.9%) |
| 65 to 74 Years | 166 (93.3%) | 138 (83.6%) |
| 75 Years and over | 55 (53.9%) | 100 (74.6%) |
| Total | 721 (77.9%) | 848 (76.9%) |
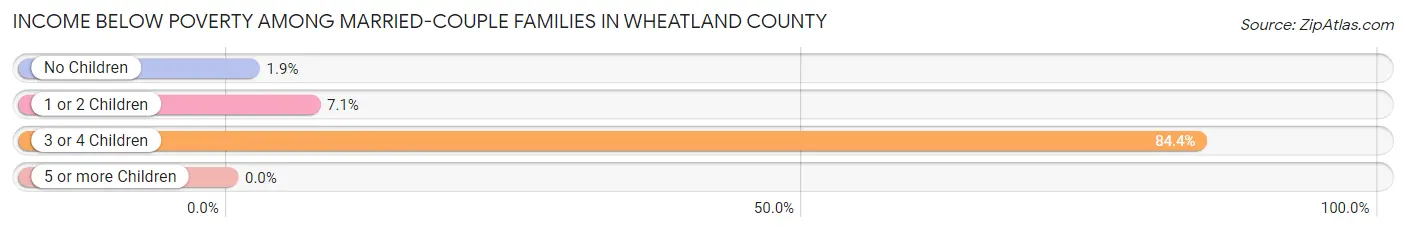
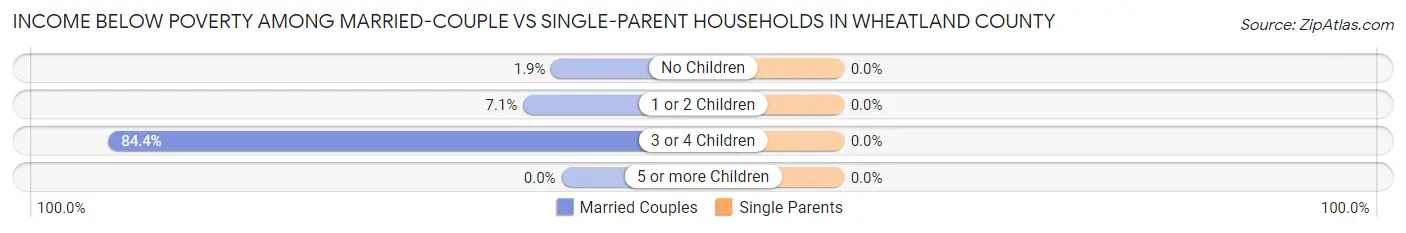
Income Below Poverty Among Married-Couple Families in Wheatland County
The poverty statistics for married-couple families in Wheatland County show that 19.8% or 94 of the total 474 families live below the poverty line. Families with 3 or 4 children have the highest poverty rate of 84.4%, comprising of 81 families. On the other hand, families with no children have the lowest poverty rate of 1.9%, which includes 5 families.
| Children | Above Poverty | Below Poverty |
| No Children | 261 (98.1%) | 5 (1.9%) |
| 1 or 2 Children | 104 (92.9%) | 8 (7.1%) |
| 3 or 4 Children | 15 (15.6%) | 81 (84.4%) |
| 5 or more Children | 0 (0.0%) | 0 (0.0%) |
| Total | 380 (80.2%) | 94 (19.8%) |
Income Below Poverty Among Single-Parent Households in Wheatland County
| Children | Single Father | Single Mother |
| No Children | 0 (0.0%) | 0 (0.0%) |
| 1 or 2 Children | 0 (0.0%) | 0 (0.0%) |
| 3 or 4 Children | 0 (0.0%) | 0 (0.0%) |
| 5 or more Children | 0 (0.0%) | 0 (0.0%) |
| Total | 0 (0.0%) | 0 (0.0%) |
Income Below Poverty Among Married-Couple vs Single-Parent Households in Wheatland County
| Children | Married-Couple Families | Single-Parent Households |
| No Children | 5 (1.9%) | 0 (0.0%) |
| 1 or 2 Children | 8 (7.1%) | 0 (0.0%) |
| 3 or 4 Children | 81 (84.4%) | 0 (0.0%) |
| 5 or more Children | 0 (0.0%) | 0 (0.0%) |
| Total | 94 (19.8%) | 0 (0.0%) |
Employment Characteristics in Wheatland County
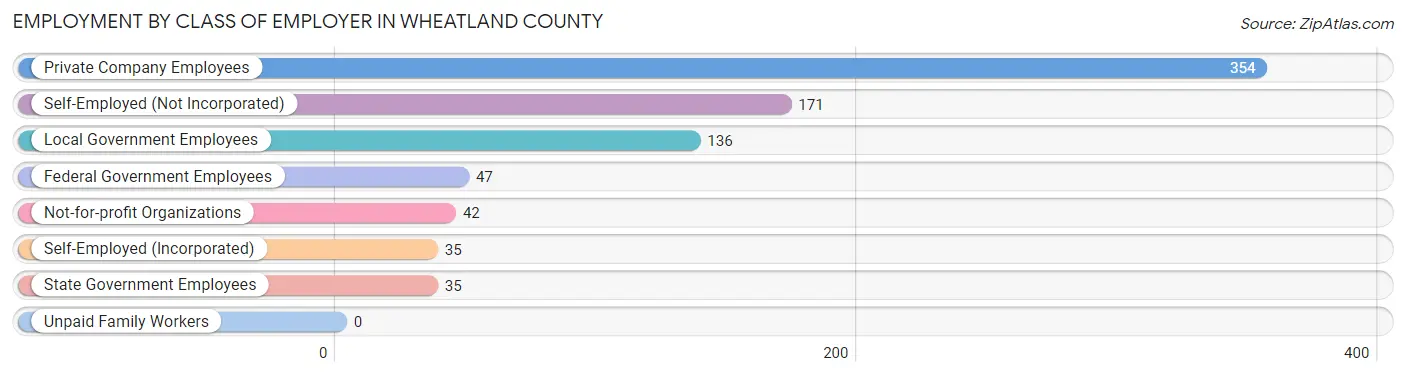
Employment by Class of Employer in Wheatland County
Among the 820 employed individuals in Wheatland County, private company employees (354 | 43.2%), self-employed (not incorporated) (171 | 20.8%), and local government employees (136 | 16.6%) make up the most common classes of employment.
| Employer Class | # Employees | % Employees |
| Private Company Employees | 354 | 43.2% |
| Self-Employed (Incorporated) | 35 | 4.3% |
| Self-Employed (Not Incorporated) | 171 | 20.8% |
| Not-for-profit Organizations | 42 | 5.1% |
| Local Government Employees | 136 | 16.6% |
| State Government Employees | 35 | 4.3% |
| Federal Government Employees | 47 | 5.7% |
| Unpaid Family Workers | 0 | 0.0% |
| Total | 820 | 100.0% |
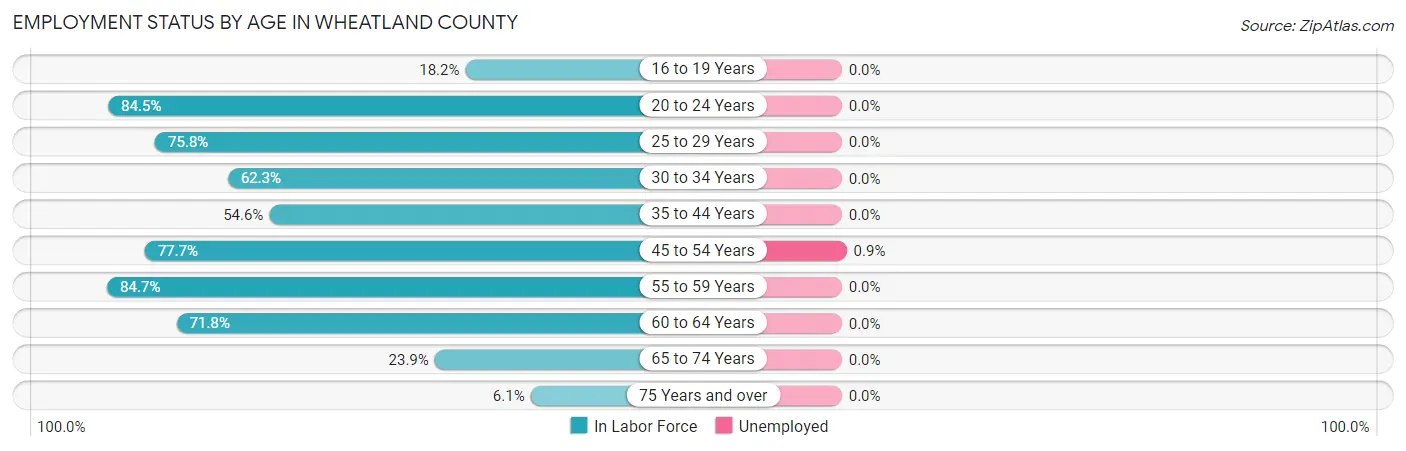
Employment Status by Age in Wheatland County
According to the labor force statistics for Wheatland County, out of the total population over 16 years of age (1,692), 49.0% or 829 individuals are in the labor force, with 0.2% or 2 of them unemployed. The age group with the highest labor force participation rate is 55 to 59 years, with 84.7% or 61 individuals in the labor force. Within the labor force, the 45 to 54 years age range has the highest percentage of unemployed individuals, with 0.9% or 2 of them being unemployed.
| Age Bracket | In Labor Force | Unemployed |
| 16 to 19 Years | 18 (18.2%) | 0 (0.0%) |
| 20 to 24 Years | 60 (84.5%) | 0 (0.0%) |
| 25 to 29 Years | 72 (75.8%) | 0 (0.0%) |
| 30 to 34 Years | 71 (62.3%) | 0 (0.0%) |
| 35 to 44 Years | 107 (54.6%) | 0 (0.0%) |
| 45 to 54 Years | 230 (77.7%) | 2 (0.9%) |
| 55 to 59 Years | 61 (84.7%) | 0 (0.0%) |
| 60 to 64 Years | 112 (71.8%) | 0 (0.0%) |
| 65 to 74 Years | 83 (23.9%) | 0 (0.0%) |
| 75 Years and over | 15 (6.1%) | 0 (0.0%) |
| Total | 829 (49.0%) | 2 (0.2%) |
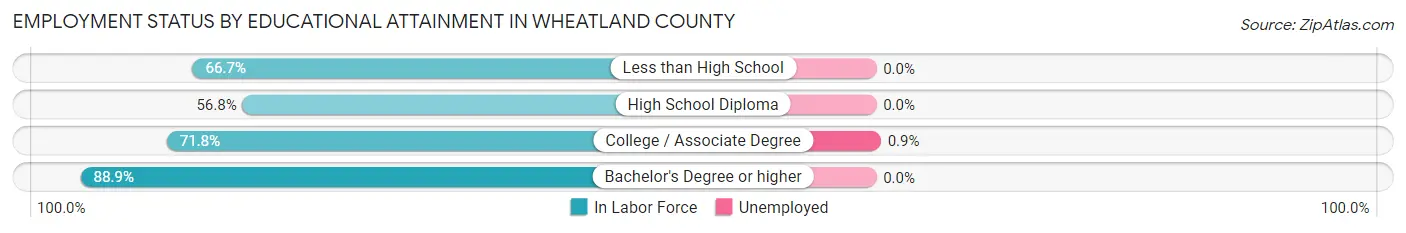
Employment Status by Educational Attainment in Wheatland County
According to labor force statistics for Wheatland County, 70.3% of individuals (653) out of the total population between 25 and 64 years of age (929) are in the labor force, with 0.3% or 2 of them being unemployed. The group with the highest labor force participation rate are those with the educational attainment of bachelor's degree or higher, with 88.9% or 185 individuals in the labor force. Within the labor force, individuals with college / associate degree education have the highest percentage of unemployment, with 0.9% or 2 of them being unemployed.
| Educational Attainment | In Labor Force | Unemployed |
| Less than High School | 66 (66.7%) | 0 (0.0%) |
| High School Diploma | 168 (56.8%) | 0 (0.0%) |
| College / Associate Degree | 234 (71.8%) | 3 (0.9%) |
| Bachelor's Degree or higher | 185 (88.9%) | 0 (0.0%) |
| Total | 653 (70.3%) | 3 (0.3%) |
Employment Occupations by Sex in Wheatland County
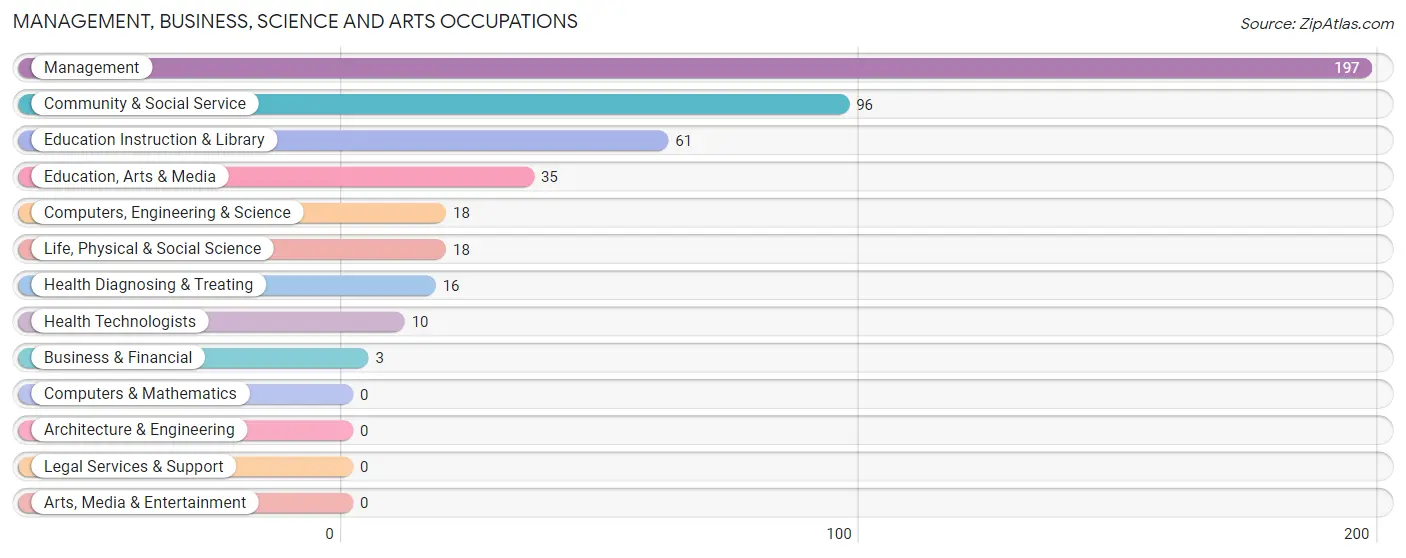
Management, Business, Science and Arts Occupations
The most common Management, Business, Science and Arts occupations in Wheatland County are Management (197 | 23.8%), Community & Social Service (96 | 11.6%), Education Instruction & Library (61 | 7.4%), Education, Arts & Media (35 | 4.2%), and Computers, Engineering & Science (18 | 2.2%).
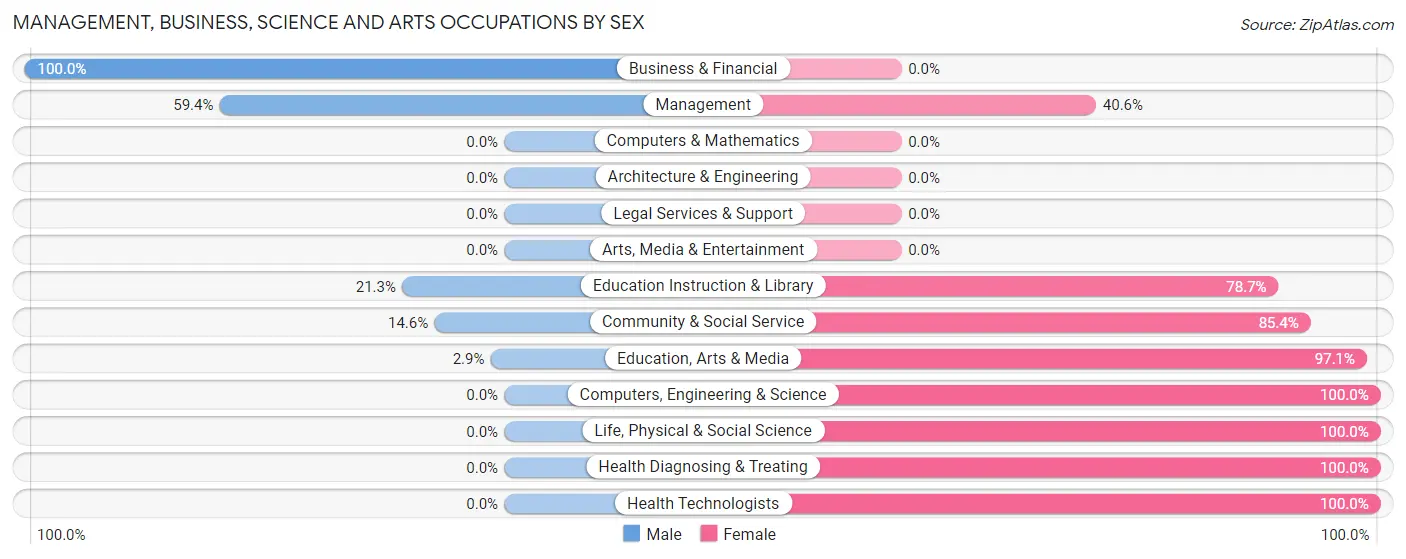
Management, Business, Science and Arts Occupations by Sex
Within the Management, Business, Science and Arts occupations in Wheatland County, the most male-oriented occupations are Business & Financial (100.0%), Management (59.4%), and Education Instruction & Library (21.3%), while the most female-oriented occupations are Computers, Engineering & Science (100.0%), Life, Physical & Social Science (100.0%), and Health Diagnosing & Treating (100.0%).
| Occupation | Male | Female |
| Management | 117 (59.4%) | 80 (40.6%) |
| Business & Financial | 3 (100.0%) | 0 (0.0%) |
| Computers, Engineering & Science | 0 (0.0%) | 18 (100.0%) |
| Computers & Mathematics | 0 (0.0%) | 0 (0.0%) |
| Architecture & Engineering | 0 (0.0%) | 0 (0.0%) |
| Life, Physical & Social Science | 0 (0.0%) | 18 (100.0%) |
| Community & Social Service | 14 (14.6%) | 82 (85.4%) |
| Education, Arts & Media | 1 (2.9%) | 34 (97.1%) |
| Legal Services & Support | 0 (0.0%) | 0 (0.0%) |
| Education Instruction & Library | 13 (21.3%) | 48 (78.7%) |
| Arts, Media & Entertainment | 0 (0.0%) | 0 (0.0%) |
| Health Diagnosing & Treating | 0 (0.0%) | 16 (100.0%) |
| Health Technologists | 0 (0.0%) | 10 (100.0%) |
| Total (Category) | 134 (40.6%) | 196 (59.4%) |
| Total (Overall) | 392 (47.4%) | 435 (52.6%) |
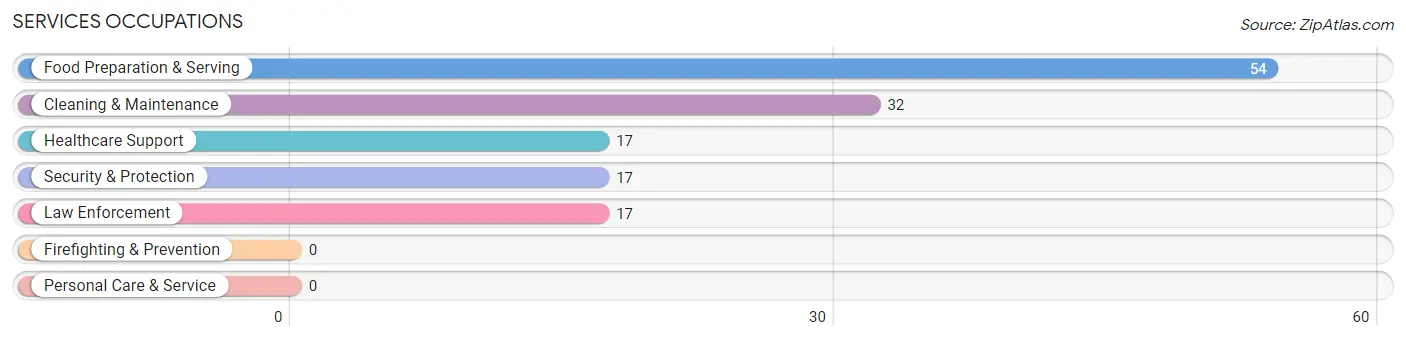
Services Occupations
The most common Services occupations in Wheatland County are Food Preparation & Serving (54 | 6.5%), Cleaning & Maintenance (32 | 3.9%), Healthcare Support (17 | 2.1%), Security & Protection (17 | 2.1%), and Law Enforcement (17 | 2.1%).
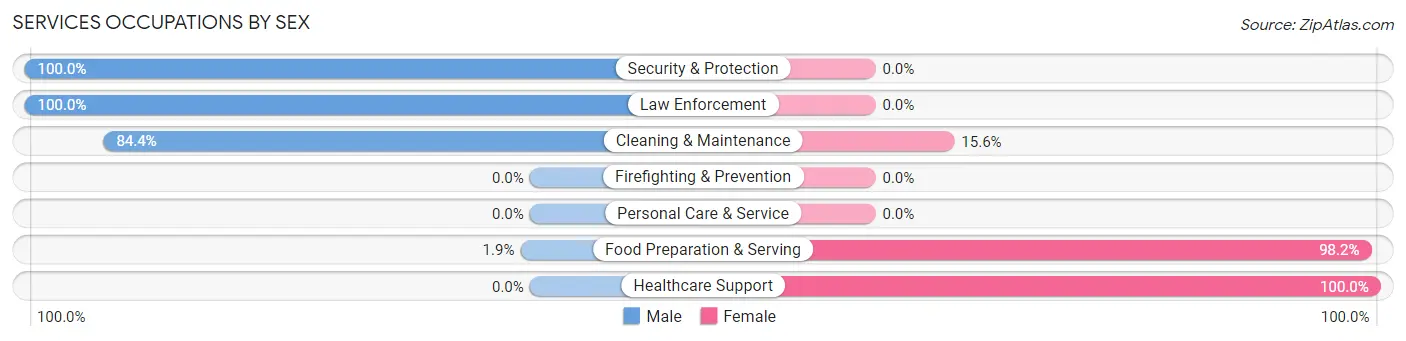
Services Occupations by Sex
Within the Services occupations in Wheatland County, the most male-oriented occupations are Security & Protection (100.0%), Law Enforcement (100.0%), and Cleaning & Maintenance (84.4%), while the most female-oriented occupations are Healthcare Support (100.0%), Food Preparation & Serving (98.2%), and Cleaning & Maintenance (15.6%).
| Occupation | Male | Female |
| Healthcare Support | 0 (0.0%) | 17 (100.0%) |
| Security & Protection | 17 (100.0%) | 0 (0.0%) |
| Firefighting & Prevention | 0 (0.0%) | 0 (0.0%) |
| Law Enforcement | 17 (100.0%) | 0 (0.0%) |
| Food Preparation & Serving | 1 (1.8%) | 53 (98.2%) |
| Cleaning & Maintenance | 27 (84.4%) | 5 (15.6%) |
| Personal Care & Service | 0 (0.0%) | 0 (0.0%) |
| Total (Category) | 45 (37.5%) | 75 (62.5%) |
| Total (Overall) | 392 (47.4%) | 435 (52.6%) |
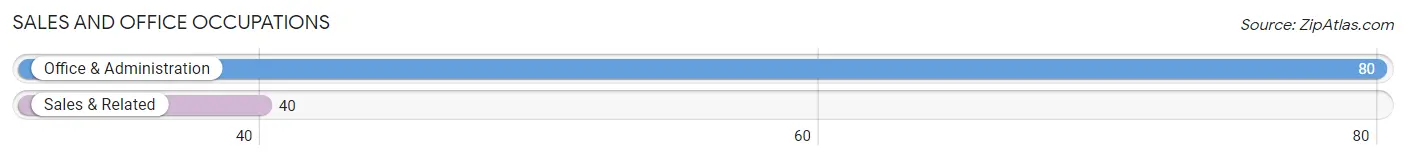
Sales and Office Occupations
The most common Sales and Office occupations in Wheatland County are Office & Administration (80 | 9.7%), and Sales & Related (40 | 4.8%).
Sales and Office Occupations by Sex
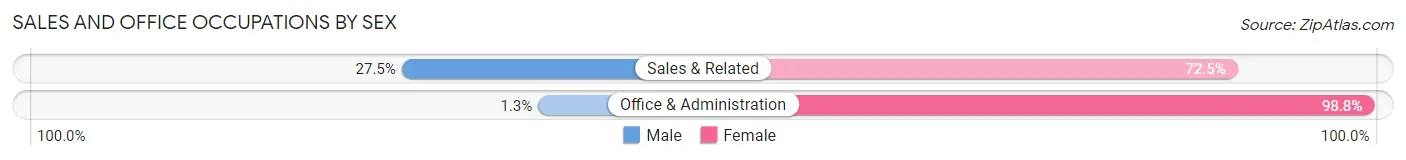
| Occupation | Male | Female |
| Sales & Related | 11 (27.5%) | 29 (72.5%) |
| Office & Administration | 1 (1.3%) | 79 (98.8%) |
| Total (Category) | 12 (10.0%) | 108 (90.0%) |
| Total (Overall) | 392 (47.4%) | 435 (52.6%) |
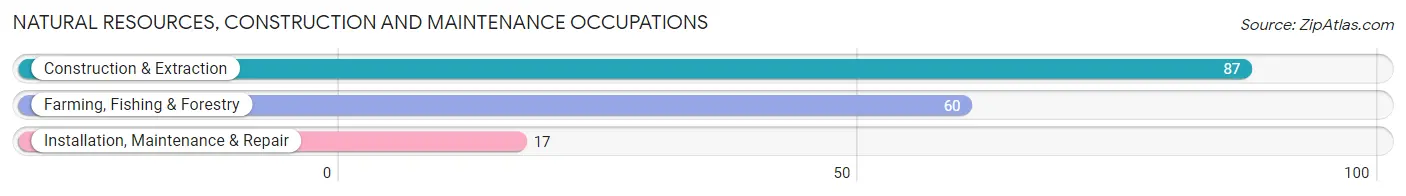
Natural Resources, Construction and Maintenance Occupations
The most common Natural Resources, Construction and Maintenance occupations in Wheatland County are Construction & Extraction (87 | 10.5%), Farming, Fishing & Forestry (60 | 7.3%), and Installation, Maintenance & Repair (17 | 2.1%).
Natural Resources, Construction and Maintenance Occupations by Sex
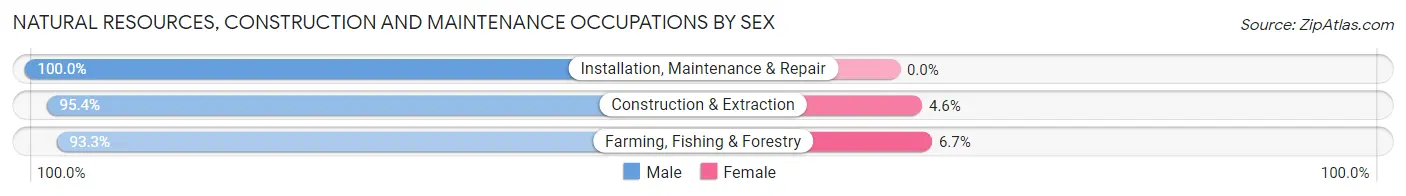
| Occupation | Male | Female |
| Farming, Fishing & Forestry | 56 (93.3%) | 4 (6.7%) |
| Construction & Extraction | 83 (95.4%) | 4 (4.6%) |
| Installation, Maintenance & Repair | 17 (100.0%) | 0 (0.0%) |
| Total (Category) | 156 (95.1%) | 8 (4.9%) |
| Total (Overall) | 392 (47.4%) | 435 (52.6%) |
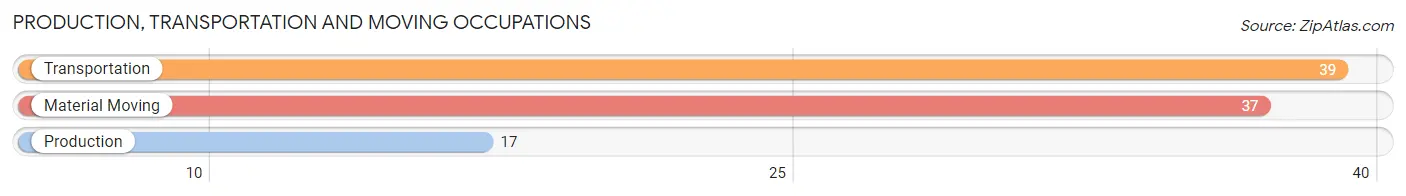
Production, Transportation and Moving Occupations
The most common Production, Transportation and Moving occupations in Wheatland County are Transportation (39 | 4.7%), Material Moving (37 | 4.5%), and Production (17 | 2.1%).
Production, Transportation and Moving Occupations by Sex
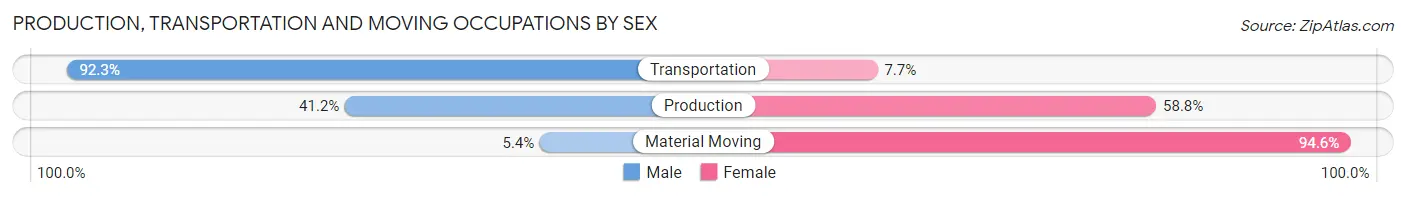
| Occupation | Male | Female |
| Production | 7 (41.2%) | 10 (58.8%) |
| Transportation | 36 (92.3%) | 3 (7.7%) |
| Material Moving | 2 (5.4%) | 35 (94.6%) |
| Total (Category) | 45 (48.4%) | 48 (51.6%) |
| Total (Overall) | 392 (47.4%) | 435 (52.6%) |
Employment Industries by Sex in Wheatland County
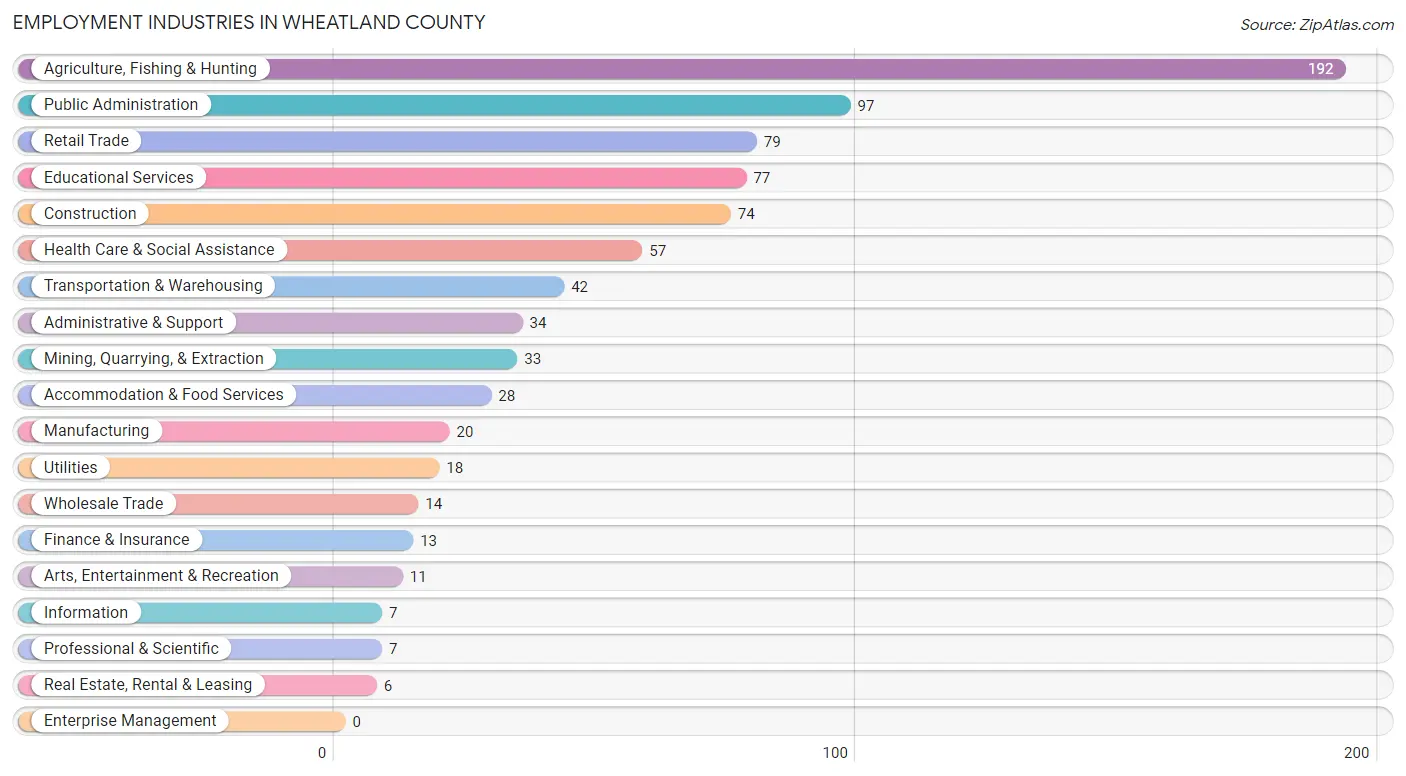
Employment Industries in Wheatland County
The major employment industries in Wheatland County include Agriculture, Fishing & Hunting (192 | 23.2%), Public Administration (97 | 11.7%), Retail Trade (79 | 9.6%), Educational Services (77 | 9.3%), and Construction (74 | 8.9%).
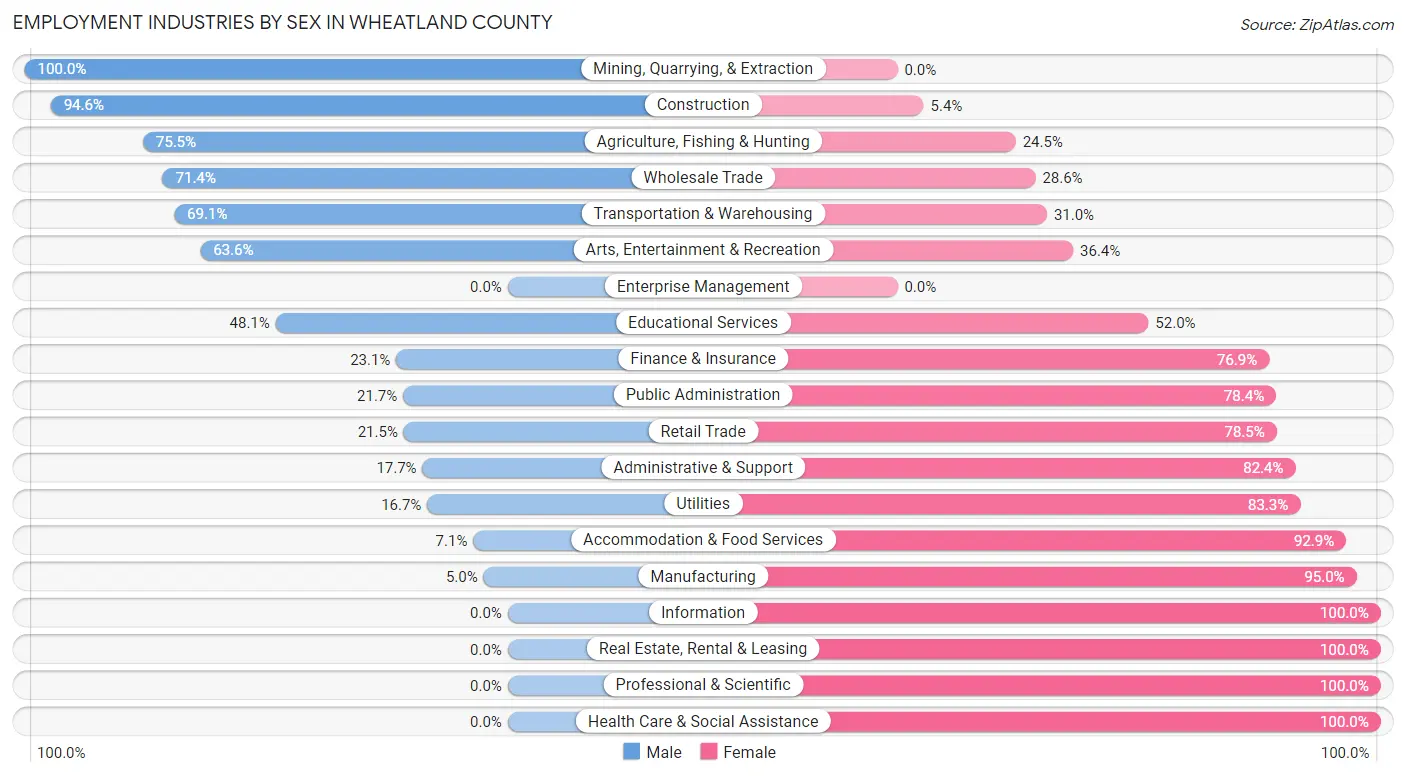
Employment Industries by Sex in Wheatland County
The Wheatland County industries that see more men than women are Mining, Quarrying, & Extraction (100.0%), Construction (94.6%), and Agriculture, Fishing & Hunting (75.5%), whereas the industries that tend to have a higher number of women are Information (100.0%), Real Estate, Rental & Leasing (100.0%), and Professional & Scientific (100.0%).
| Industry | Male | Female |
| Agriculture, Fishing & Hunting | 145 (75.5%) | 47 (24.5%) |
| Mining, Quarrying, & Extraction | 33 (100.0%) | 0 (0.0%) |
| Construction | 70 (94.6%) | 4 (5.4%) |
| Manufacturing | 1 (5.0%) | 19 (95.0%) |
| Wholesale Trade | 10 (71.4%) | 4 (28.6%) |
| Retail Trade | 17 (21.5%) | 62 (78.5%) |
| Transportation & Warehousing | 29 (69.1%) | 13 (30.9%) |
| Utilities | 3 (16.7%) | 15 (83.3%) |
| Information | 0 (0.0%) | 7 (100.0%) |
| Finance & Insurance | 3 (23.1%) | 10 (76.9%) |
| Real Estate, Rental & Leasing | 0 (0.0%) | 6 (100.0%) |
| Professional & Scientific | 0 (0.0%) | 7 (100.0%) |
| Enterprise Management | 0 (0.0%) | 0 (0.0%) |
| Administrative & Support | 6 (17.6%) | 28 (82.4%) |
| Educational Services | 37 (48.0%) | 40 (51.9%) |
| Health Care & Social Assistance | 0 (0.0%) | 57 (100.0%) |
| Arts, Entertainment & Recreation | 7 (63.6%) | 4 (36.4%) |
| Accommodation & Food Services | 2 (7.1%) | 26 (92.9%) |
| Public Administration | 21 (21.6%) | 76 (78.3%) |
| Total | 392 (47.4%) | 435 (52.6%) |
Education in Wheatland County
School Enrollment in Wheatland County
The most common levels of schooling among the 420 students in Wheatland County are middle school (173 | 41.2%), high school (101 | 24.0%), and elementary school (92 | 21.9%).
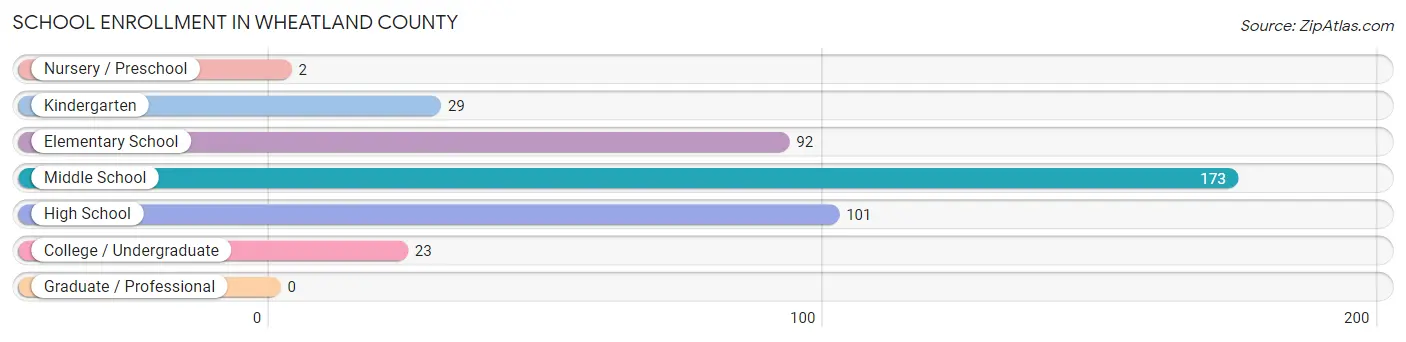
| School Level | # Students | % Students |
| Nursery / Preschool | 2 | 0.5% |
| Kindergarten | 29 | 6.9% |
| Elementary School | 92 | 21.9% |
| Middle School | 173 | 41.2% |
| High School | 101 | 24.0% |
| College / Undergraduate | 23 | 5.5% |
| Graduate / Professional | 0 | 0.0% |
| Total | 420 | 100.0% |
School Enrollment by Age by Funding Source in Wheatland County
Out of a total of 420 students who are enrolled in schools in Wheatland County, 26 (6.2%) attend a private institution, while the remaining 394 (93.8%) are enrolled in public schools. The age group of 5 to 9 year old has the highest likelihood of being enrolled in private schools, with 22 (20.6% in the age bracket) enrolled. Conversely, the age group of 10 to 14 year olds has the lowest likelihood of being enrolled in a private school, with 189 (100.0% in the age bracket) attending a public institution.
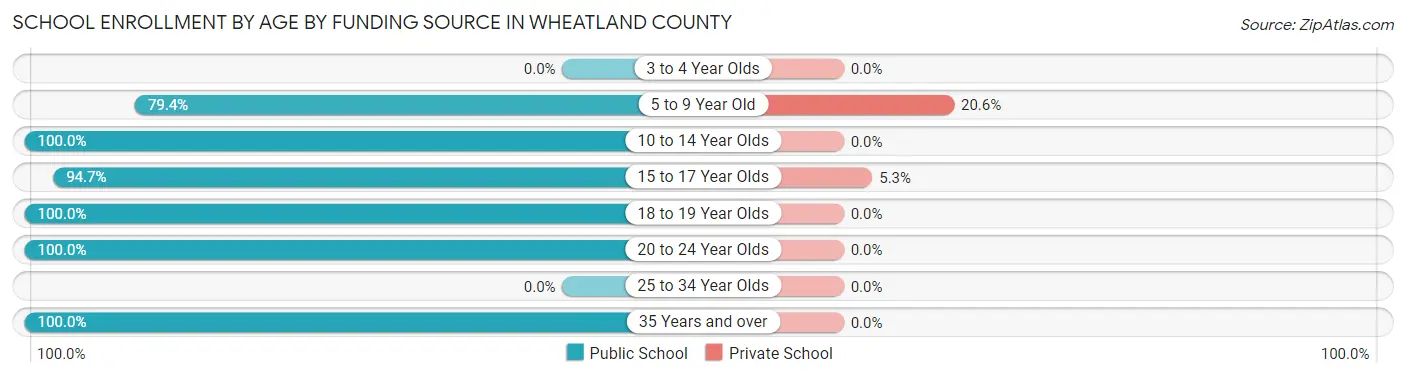
| Age Bracket | Public School | Private School |
| 3 to 4 Year Olds | 0 (0.0%) | 0 (0.0%) |
| 5 to 9 Year Old | 85 (79.4%) | 22 (20.6%) |
| 10 to 14 Year Olds | 189 (100.0%) | 0 (0.0%) |
| 15 to 17 Year Olds | 71 (94.7%) | 4 (5.3%) |
| 18 to 19 Year Olds | 26 (100.0%) | 0 (0.0%) |
| 20 to 24 Year Olds | 8 (100.0%) | 0 (0.0%) |
| 25 to 34 Year Olds | 0 (0.0%) | 0 (0.0%) |
| 35 Years and over | 15 (100.0%) | 0 (0.0%) |
| Total | 394 (93.8%) | 26 (6.2%) |
Educational Attainment by Field of Study in Wheatland County
Bio, nature & agricultural (83 | 26.4%), education (81 | 25.7%), business (49 | 15.6%), psychology (40 | 12.7%), and science & technology (27 | 8.6%) are the most common fields of study among 315 individuals in Wheatland County who have obtained a bachelor's degree or higher.
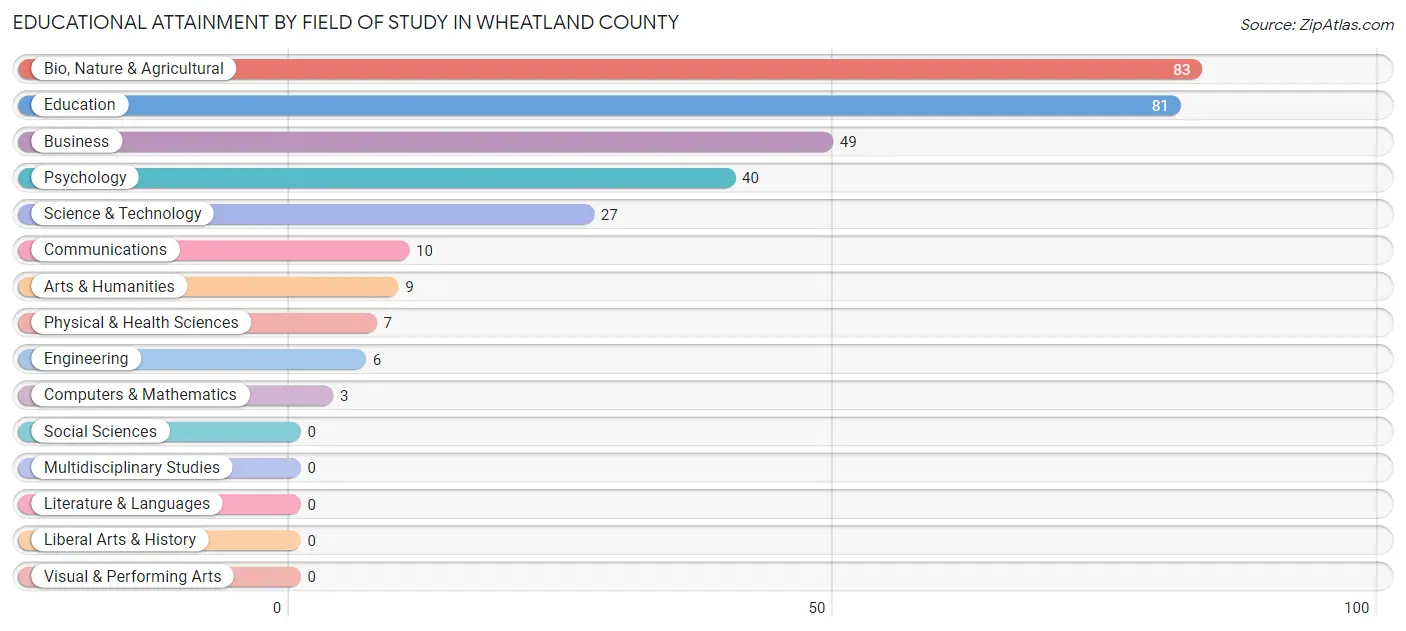
| Field of Study | # Graduates | % Graduates |
| Computers & Mathematics | 3 | 0.9% |
| Bio, Nature & Agricultural | 83 | 26.4% |
| Physical & Health Sciences | 7 | 2.2% |
| Psychology | 40 | 12.7% |
| Social Sciences | 0 | 0.0% |
| Engineering | 6 | 1.9% |
| Multidisciplinary Studies | 0 | 0.0% |
| Science & Technology | 27 | 8.6% |
| Business | 49 | 15.6% |
| Education | 81 | 25.7% |
| Literature & Languages | 0 | 0.0% |
| Liberal Arts & History | 0 | 0.0% |
| Visual & Performing Arts | 0 | 0.0% |
| Communications | 10 | 3.2% |
| Arts & Humanities | 9 | 2.9% |
| Total | 315 | 100.0% |
Transportation & Commute in Wheatland County
Vehicle Availability by Sex in Wheatland County
The most prevalent vehicle ownership categories in Wheatland County are males with 2 vehicles (113, accounting for 31.0%) and females with 2 vehicles (137, making up 27.8%).
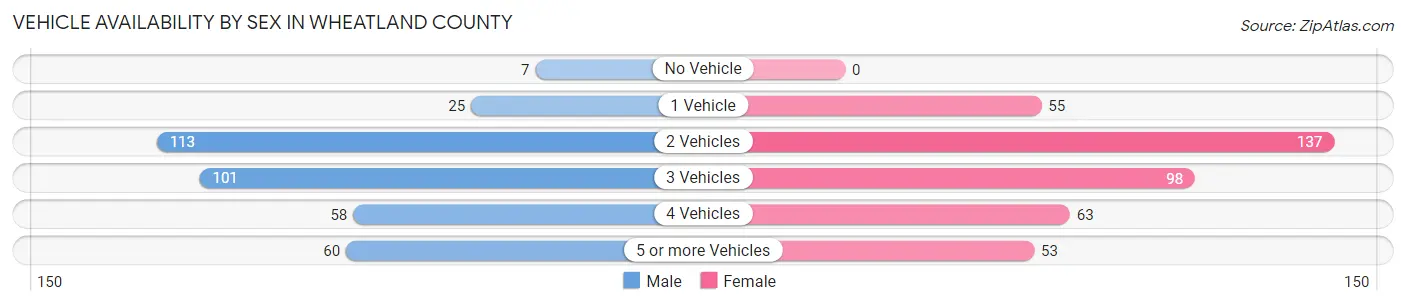
| Vehicles Available | Male | Female |
| No Vehicle | 7 (1.9%) | 0 (0.0%) |
| 1 Vehicle | 25 (6.9%) | 55 (13.6%) |
| 2 Vehicles | 113 (31.0%) | 137 (33.7%) |
| 3 Vehicles | 101 (27.8%) | 98 (24.1%) |
| 4 Vehicles | 58 (15.9%) | 63 (15.5%) |
| 5 or more Vehicles | 60 (16.5%) | 53 (13.1%) |
| Total | 364 (100.0%) | 406 (100.0%) |
Commute Time in Wheatland County
The most frequently occuring commute durations in Wheatland County are 5 to 9 minutes (191 commuters, 30.1%), 10 to 14 minutes (143 commuters, 22.5%), and less than 5 minutes (84 commuters, 13.2%).
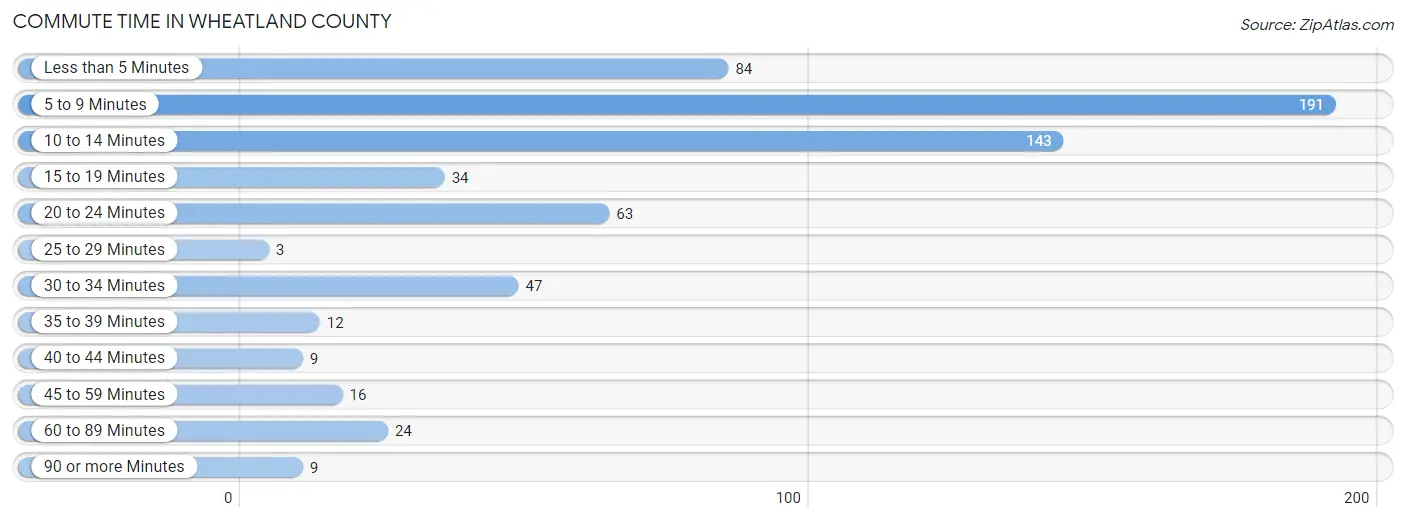
| Commute Time | # Commuters | % Commuters |
| Less than 5 Minutes | 84 | 13.2% |
| 5 to 9 Minutes | 191 | 30.1% |
| 10 to 14 Minutes | 143 | 22.5% |
| 15 to 19 Minutes | 34 | 5.3% |
| 20 to 24 Minutes | 63 | 9.9% |
| 25 to 29 Minutes | 3 | 0.5% |
| 30 to 34 Minutes | 47 | 7.4% |
| 35 to 39 Minutes | 12 | 1.9% |
| 40 to 44 Minutes | 9 | 1.4% |
| 45 to 59 Minutes | 16 | 2.5% |
| 60 to 89 Minutes | 24 | 3.8% |
| 90 or more Minutes | 9 | 1.4% |
Commute Time by Sex in Wheatland County
The most common commute times in Wheatland County are 5 to 9 minutes (67 commuters, 24.6%) for males and 5 to 9 minutes (124 commuters, 34.2%) for females.
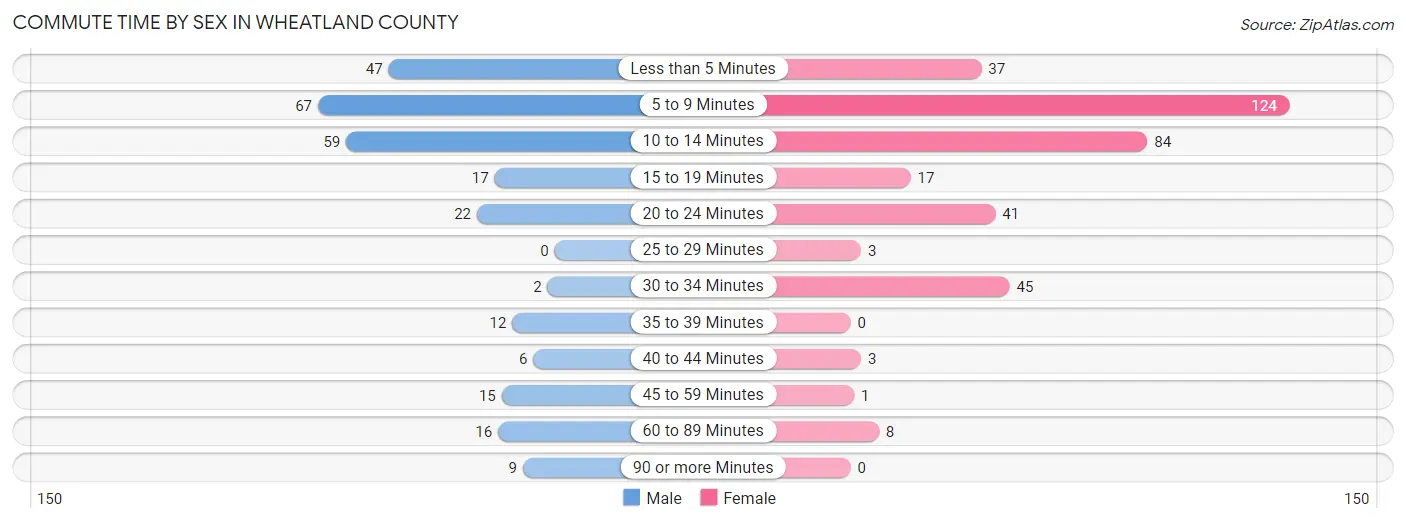
| Commute Time | Male | Female |
| Less than 5 Minutes | 47 (17.3%) | 37 (10.2%) |
| 5 to 9 Minutes | 67 (24.6%) | 124 (34.2%) |
| 10 to 14 Minutes | 59 (21.7%) | 84 (23.1%) |
| 15 to 19 Minutes | 17 (6.2%) | 17 (4.7%) |
| 20 to 24 Minutes | 22 (8.1%) | 41 (11.3%) |
| 25 to 29 Minutes | 0 (0.0%) | 3 (0.8%) |
| 30 to 34 Minutes | 2 (0.7%) | 45 (12.4%) |
| 35 to 39 Minutes | 12 (4.4%) | 0 (0.0%) |
| 40 to 44 Minutes | 6 (2.2%) | 3 (0.8%) |
| 45 to 59 Minutes | 15 (5.5%) | 1 (0.3%) |
| 60 to 89 Minutes | 16 (5.9%) | 8 (2.2%) |
| 90 or more Minutes | 9 (3.3%) | 0 (0.0%) |
Time of Departure to Work by Sex in Wheatland County
The most frequent times of departure to work in Wheatland County are 7:00 AM to 7:29 AM (86, 31.6%) for males and 7:00 AM to 7:29 AM (100, 27.6%) for females.
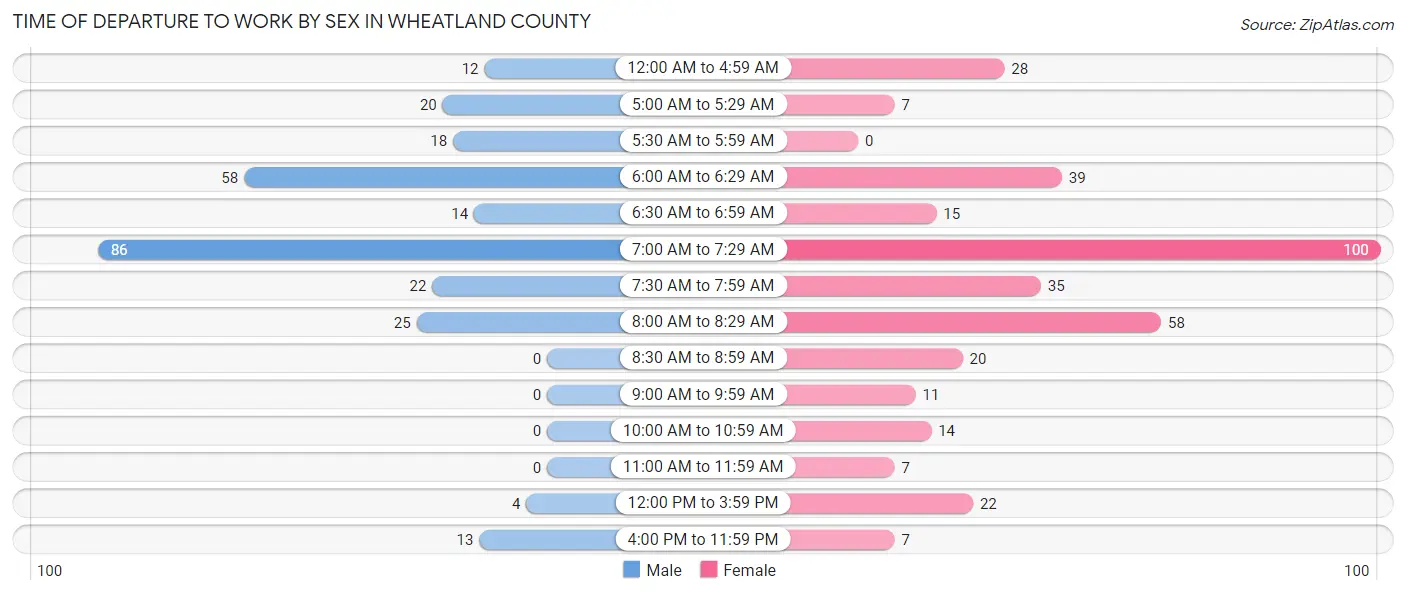
| Time of Departure | Male | Female |
| 12:00 AM to 4:59 AM | 12 (4.4%) | 28 (7.7%) |
| 5:00 AM to 5:29 AM | 20 (7.3%) | 7 (1.9%) |
| 5:30 AM to 5:59 AM | 18 (6.6%) | 0 (0.0%) |
| 6:00 AM to 6:29 AM | 58 (21.3%) | 39 (10.7%) |
| 6:30 AM to 6:59 AM | 14 (5.1%) | 15 (4.1%) |
| 7:00 AM to 7:29 AM | 86 (31.6%) | 100 (27.6%) |
| 7:30 AM to 7:59 AM | 22 (8.1%) | 35 (9.6%) |
| 8:00 AM to 8:29 AM | 25 (9.2%) | 58 (16.0%) |
| 8:30 AM to 8:59 AM | 0 (0.0%) | 20 (5.5%) |
| 9:00 AM to 9:59 AM | 0 (0.0%) | 11 (3.0%) |
| 10:00 AM to 10:59 AM | 0 (0.0%) | 14 (3.9%) |
| 11:00 AM to 11:59 AM | 0 (0.0%) | 7 (1.9%) |
| 12:00 PM to 3:59 PM | 4 (1.5%) | 22 (6.1%) |
| 4:00 PM to 11:59 PM | 13 (4.8%) | 7 (1.9%) |
| Total | 272 (100.0%) | 363 (100.0%) |
Housing Occupancy in Wheatland County
Occupancy by Ownership in Wheatland County
Of the total 875 dwellings in Wheatland County, owner-occupied units account for 677 (77.4%), while renter-occupied units make up 198 (22.6%).
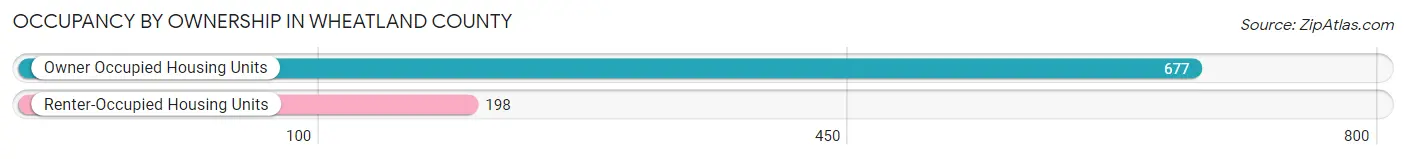
| Occupancy | # Housing Units | % Housing Units |
| Owner Occupied Housing Units | 677 | 77.4% |
| Renter-Occupied Housing Units | 198 | 22.6% |
| Total Occupied Housing Units | 875 | 100.0% |
Occupancy by Household Size in Wheatland County
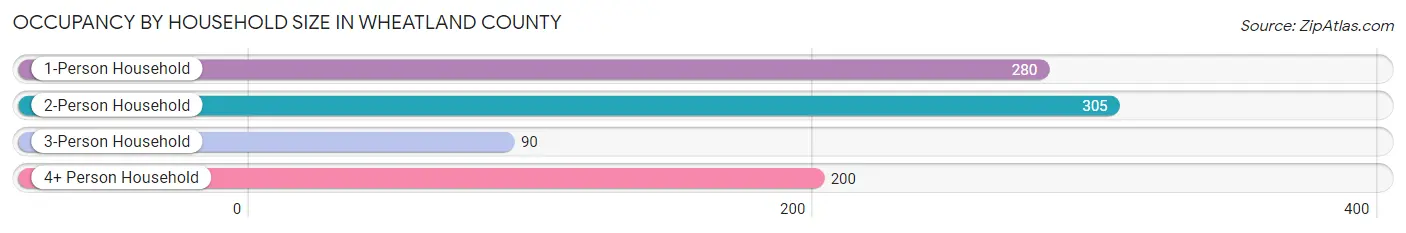
| Household Size | # Housing Units | % Housing Units |
| 1-Person Household | 280 | 32.0% |
| 2-Person Household | 305 | 34.9% |
| 3-Person Household | 90 | 10.3% |
| 4+ Person Household | 200 | 22.9% |
| Total Housing Units | 875 | 100.0% |
Occupancy by Ownership by Household Size in Wheatland County
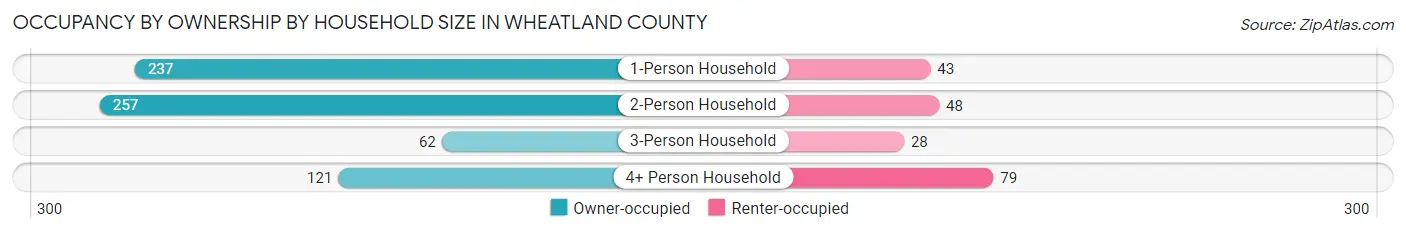
| Household Size | Owner-occupied | Renter-occupied |
| 1-Person Household | 237 (84.6%) | 43 (15.4%) |
| 2-Person Household | 257 (84.3%) | 48 (15.7%) |
| 3-Person Household | 62 (68.9%) | 28 (31.1%) |
| 4+ Person Household | 121 (60.5%) | 79 (39.5%) |
| Total Housing Units | 677 (77.4%) | 198 (22.6%) |
Occupancy by Educational Attainment in Wheatland County
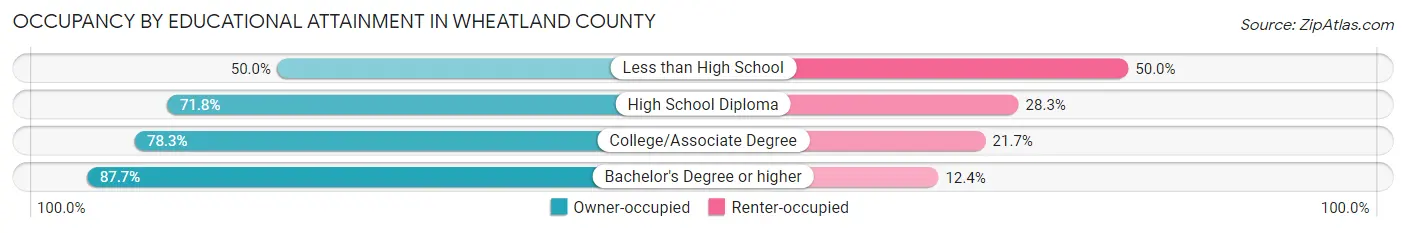
| Household Size | Owner-occupied | Renter-occupied |
| Less than High School | 18 (50.0%) | 18 (50.0%) |
| High School Diploma | 226 (71.8%) | 89 (28.2%) |
| College/Associate Degree | 220 (78.3%) | 61 (21.7%) |
| Bachelor's Degree or higher | 213 (87.6%) | 30 (12.3%) |
Occupancy by Age of Householder in Wheatland County
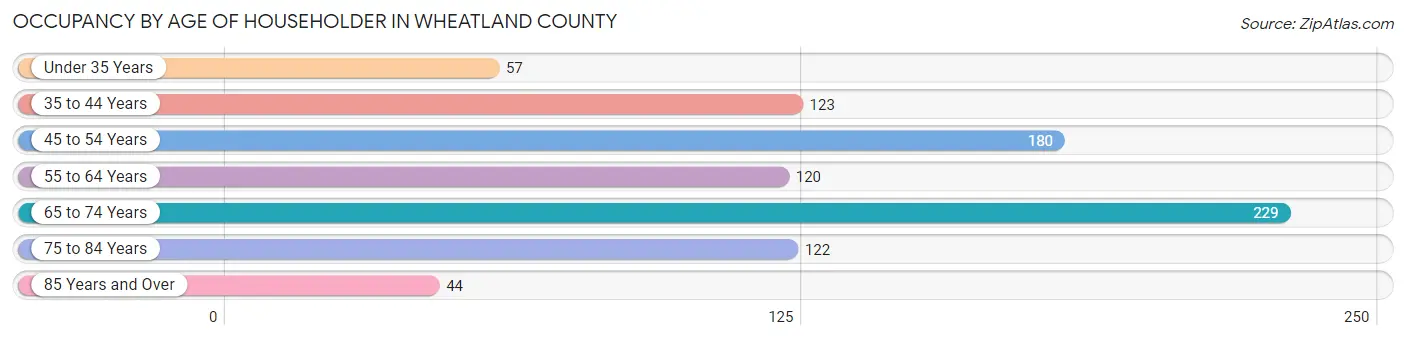
| Age Bracket | # Households | % Households |
| Under 35 Years | 57 | 6.5% |
| 35 to 44 Years | 123 | 14.1% |
| 45 to 54 Years | 180 | 20.6% |
| 55 to 64 Years | 120 | 13.7% |
| 65 to 74 Years | 229 | 26.2% |
| 75 to 84 Years | 122 | 13.9% |
| 85 Years and Over | 44 | 5.0% |
| Total | 875 | 100.0% |
Housing Finances in Wheatland County
Median Income by Occupancy in Wheatland County
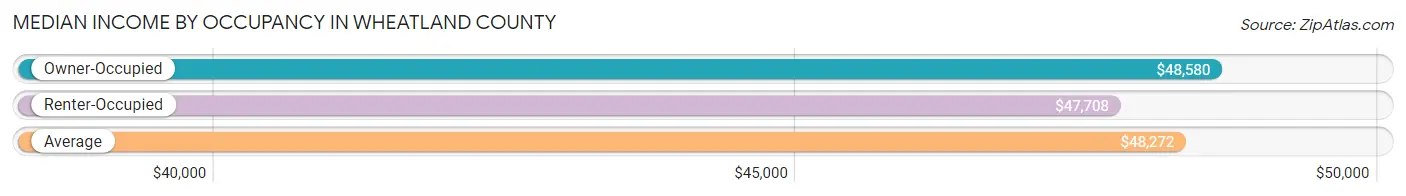
| Occupancy Type | # Households | Median Income |
| Owner-Occupied | 677 (77.4%) | $48,580 |
| Renter-Occupied | 198 (22.6%) | $47,708 |
| Average | 875 (100.0%) | $48,272 |
Occupancy by Householder Income Bracket in Wheatland County
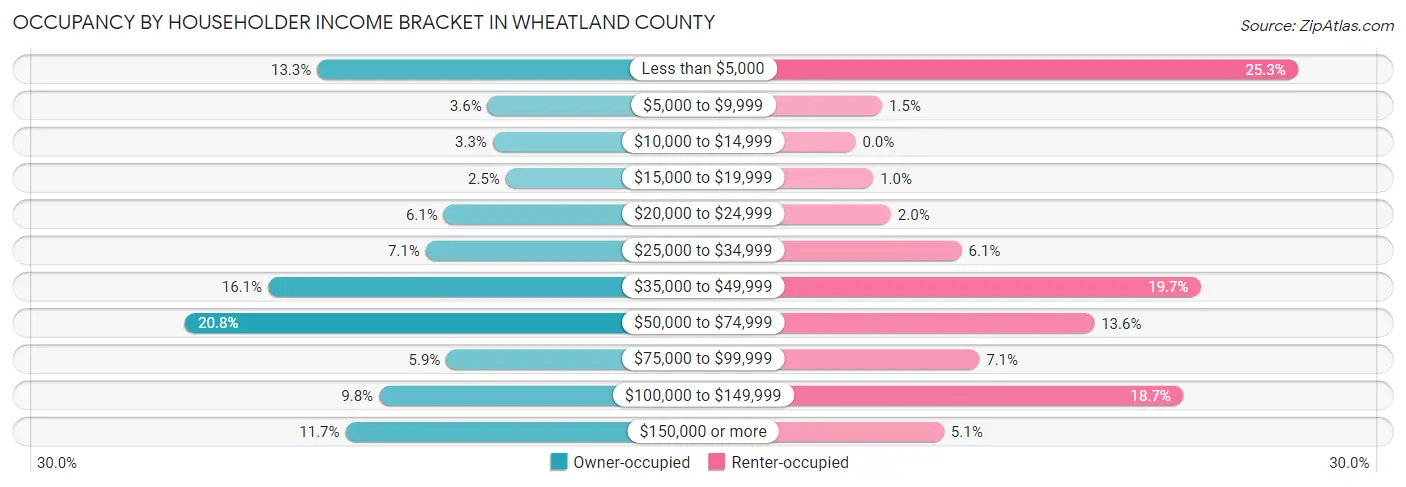
| Income Bracket | Owner-occupied | Renter-occupied |
| Less than $5,000 | 90 (13.3%) | 50 (25.3%) |
| $5,000 to $9,999 | 24 (3.5%) | 3 (1.5%) |
| $10,000 to $14,999 | 22 (3.3%) | 0 (0.0%) |
| $15,000 to $19,999 | 17 (2.5%) | 2 (1.0%) |
| $20,000 to $24,999 | 41 (6.1%) | 4 (2.0%) |
| $25,000 to $34,999 | 48 (7.1%) | 12 (6.1%) |
| $35,000 to $49,999 | 109 (16.1%) | 39 (19.7%) |
| $50,000 to $74,999 | 141 (20.8%) | 27 (13.6%) |
| $75,000 to $99,999 | 40 (5.9%) | 14 (7.1%) |
| $100,000 to $149,999 | 66 (9.8%) | 37 (18.7%) |
| $150,000 or more | 79 (11.7%) | 10 (5.1%) |
| Total | 677 (100.0%) | 198 (100.0%) |
Monthly Housing Cost Tiers in Wheatland County
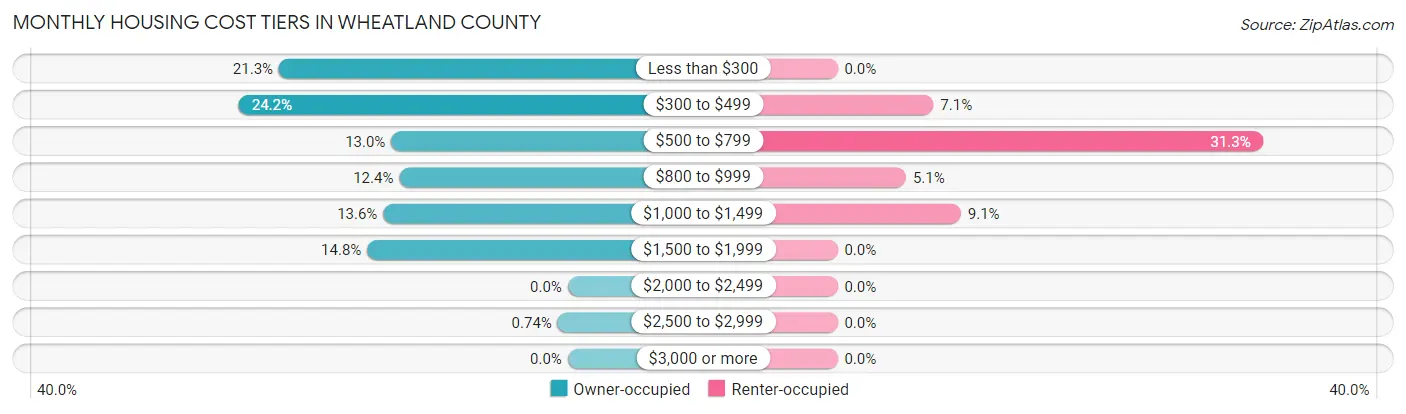
| Monthly Cost | Owner-occupied | Renter-occupied |
| Less than $300 | 144 (21.3%) | 0 (0.0%) |
| $300 to $499 | 164 (24.2%) | 14 (7.1%) |
| $500 to $799 | 88 (13.0%) | 62 (31.3%) |
| $800 to $999 | 84 (12.4%) | 10 (5.1%) |
| $1,000 to $1,499 | 92 (13.6%) | 18 (9.1%) |
| $1,500 to $1,999 | 100 (14.8%) | 0 (0.0%) |
| $2,000 to $2,499 | 0 (0.0%) | 0 (0.0%) |
| $2,500 to $2,999 | 5 (0.7%) | 0 (0.0%) |
| $3,000 or more | 0 (0.0%) | 0 (0.0%) |
| Total | 677 (100.0%) | 198 (100.0%) |
Physical Housing Characteristics in Wheatland County
Housing Structures in Wheatland County
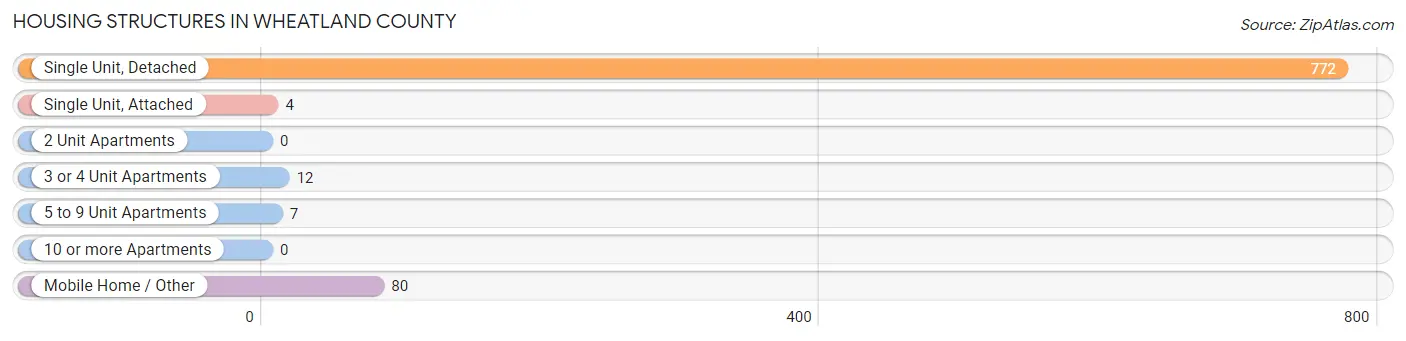
| Structure Type | # Housing Units | % Housing Units |
| Single Unit, Detached | 772 | 88.2% |
| Single Unit, Attached | 4 | 0.5% |
| 2 Unit Apartments | 0 | 0.0% |
| 3 or 4 Unit Apartments | 12 | 1.4% |
| 5 to 9 Unit Apartments | 7 | 0.8% |
| 10 or more Apartments | 0 | 0.0% |
| Mobile Home / Other | 80 | 9.1% |
| Total | 875 | 100.0% |
Housing Structures by Occupancy in Wheatland County
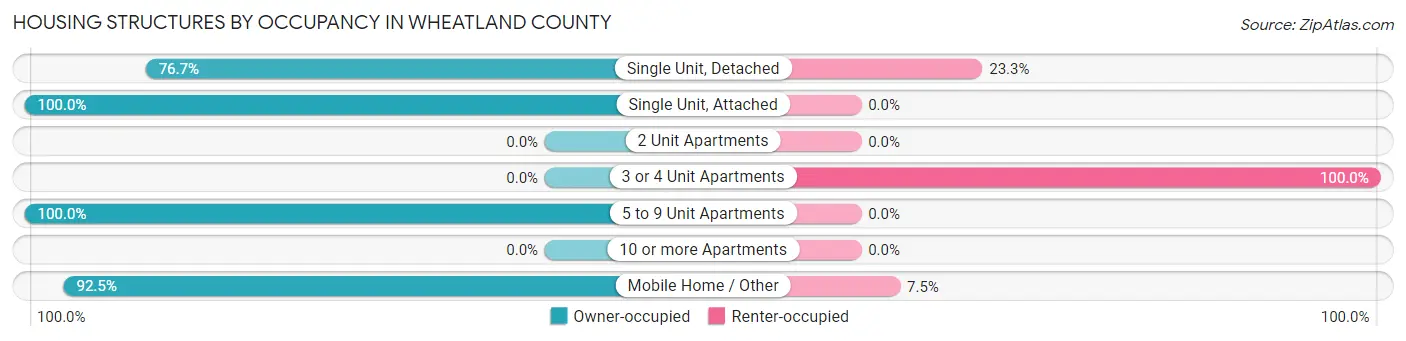
| Structure Type | Owner-occupied | Renter-occupied |
| Single Unit, Detached | 592 (76.7%) | 180 (23.3%) |
| Single Unit, Attached | 4 (100.0%) | 0 (0.0%) |
| 2 Unit Apartments | 0 (0.0%) | 0 (0.0%) |
| 3 or 4 Unit Apartments | 0 (0.0%) | 12 (100.0%) |
| 5 to 9 Unit Apartments | 7 (100.0%) | 0 (0.0%) |
| 10 or more Apartments | 0 (0.0%) | 0 (0.0%) |
| Mobile Home / Other | 74 (92.5%) | 6 (7.5%) |
| Total | 677 (77.4%) | 198 (22.6%) |
Housing Structures by Number of Rooms in Wheatland County
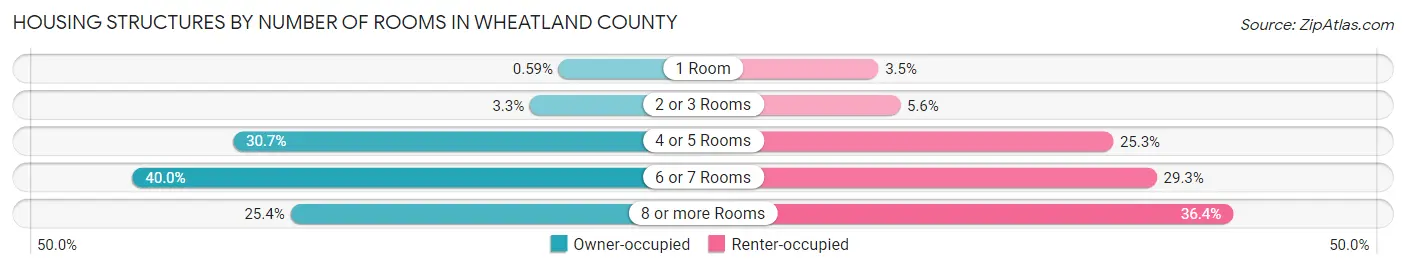
| Number of Rooms | Owner-occupied | Renter-occupied |
| 1 Room | 4 (0.6%) | 7 (3.5%) |
| 2 or 3 Rooms | 22 (3.3%) | 11 (5.6%) |
| 4 or 5 Rooms | 208 (30.7%) | 50 (25.3%) |
| 6 or 7 Rooms | 271 (40.0%) | 58 (29.3%) |
| 8 or more Rooms | 172 (25.4%) | 72 (36.4%) |
| Total | 677 (100.0%) | 198 (100.0%) |
Housing Structure by Heating Type in Wheatland County
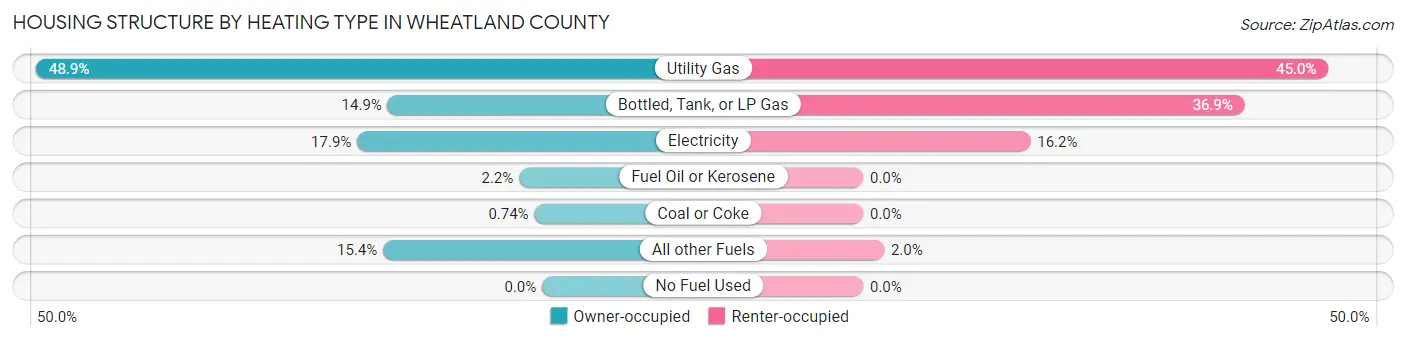
| Heating Type | Owner-occupied | Renter-occupied |
| Utility Gas | 331 (48.9%) | 89 (45.0%) |
| Bottled, Tank, or LP Gas | 101 (14.9%) | 73 (36.9%) |
| Electricity | 121 (17.9%) | 32 (16.2%) |
| Fuel Oil or Kerosene | 15 (2.2%) | 0 (0.0%) |
| Coal or Coke | 5 (0.7%) | 0 (0.0%) |
| All other Fuels | 104 (15.4%) | 4 (2.0%) |
| No Fuel Used | 0 (0.0%) | 0 (0.0%) |
| Total | 677 (100.0%) | 198 (100.0%) |
Household Vehicle Usage in Wheatland County
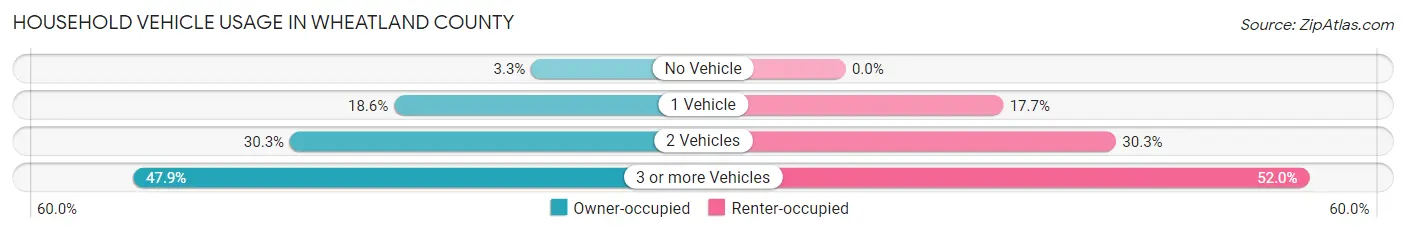
| Vehicles per Household | Owner-occupied | Renter-occupied |
| No Vehicle | 22 (3.3%) | 0 (0.0%) |
| 1 Vehicle | 126 (18.6%) | 35 (17.7%) |
| 2 Vehicles | 205 (30.3%) | 60 (30.3%) |
| 3 or more Vehicles | 324 (47.9%) | 103 (52.0%) |
| Total | 677 (100.0%) | 198 (100.0%) |
Real Estate & Mortgages in Wheatland County
Real Estate and Mortgage Overview in Wheatland County
| Characteristic | Without Mortgage | With Mortgage |
| Housing Units | 418 | 259 |
| Median Property Value | $154,200 | $197,500 |
| Median Household Income | $40,000 | $49 |
| Monthly Housing Costs | $397 | $0 |
| Real Estate Taxes | $878 | $1 |
Property Value by Mortgage Status in Wheatland County
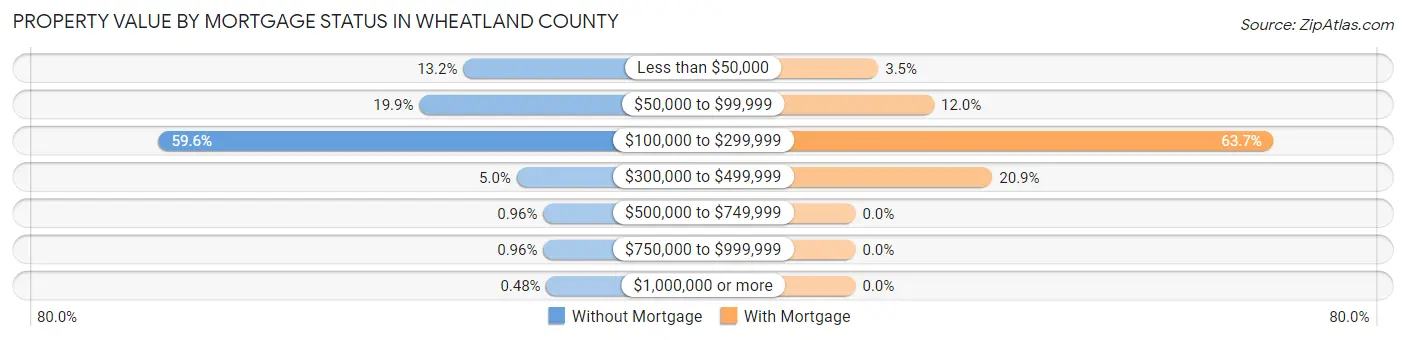
| Property Value | Without Mortgage | With Mortgage |
| Less than $50,000 | 55 (13.2%) | 9 (3.5%) |
| $50,000 to $99,999 | 83 (19.9%) | 31 (12.0%) |
| $100,000 to $299,999 | 249 (59.6%) | 165 (63.7%) |
| $300,000 to $499,999 | 21 (5.0%) | 54 (20.8%) |
| $500,000 to $749,999 | 4 (1.0%) | 0 (0.0%) |
| $750,000 to $999,999 | 4 (1.0%) | 0 (0.0%) |
| $1,000,000 or more | 2 (0.5%) | 0 (0.0%) |
| Total | 418 (100.0%) | 259 (100.0%) |
Household Income by Mortgage Status in Wheatland County
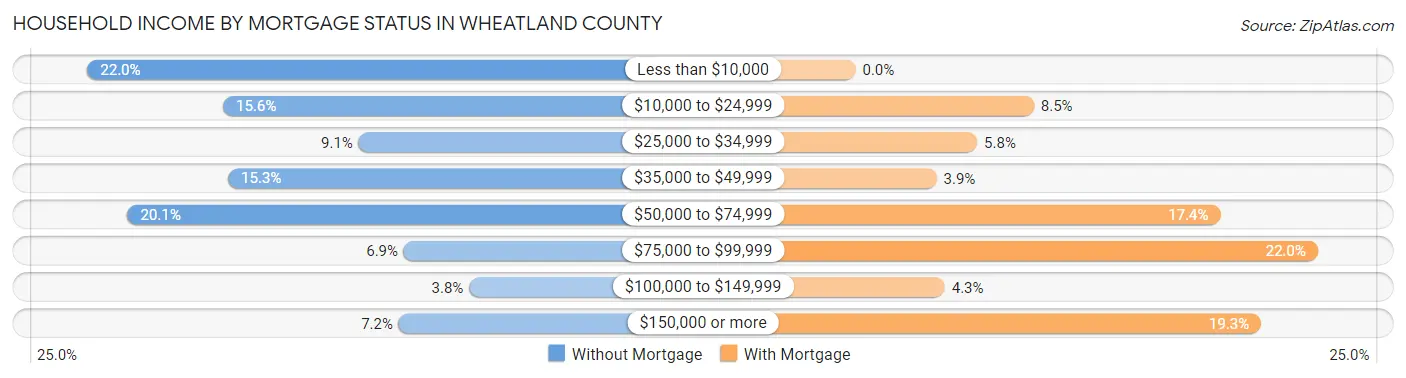
| Household Income | Without Mortgage | With Mortgage |
| Less than $10,000 | 92 (22.0%) | 0 (0.0%) |
| $10,000 to $24,999 | 65 (15.5%) | 22 (8.5%) |
| $25,000 to $34,999 | 38 (9.1%) | 15 (5.8%) |
| $35,000 to $49,999 | 64 (15.3%) | 10 (3.9%) |
| $50,000 to $74,999 | 84 (20.1%) | 45 (17.4%) |
| $75,000 to $99,999 | 29 (6.9%) | 57 (22.0%) |
| $100,000 to $149,999 | 16 (3.8%) | 11 (4.3%) |
| $150,000 or more | 30 (7.2%) | 50 (19.3%) |
| Total | 418 (100.0%) | 259 (100.0%) |
Property Value to Household Income Ratio in Wheatland County
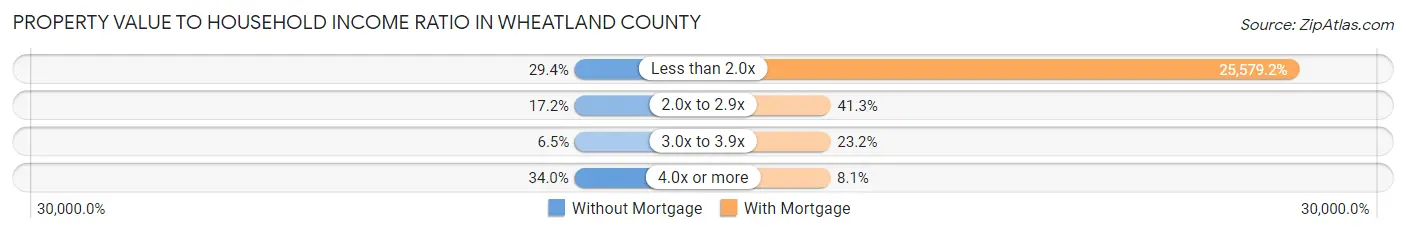
| Value-to-Income Ratio | Without Mortgage | With Mortgage |
| Less than 2.0x | 123 (29.4%) | 66,250 (25,579.2%) |
| 2.0x to 2.9x | 72 (17.2%) | 107 (41.3%) |
| 3.0x to 3.9x | 27 (6.5%) | 60 (23.2%) |
| 4.0x or more | 142 (34.0%) | 21 (8.1%) |
| Total | 418 (100.0%) | 259 (100.0%) |
Real Estate Taxes by Mortgage Status in Wheatland County
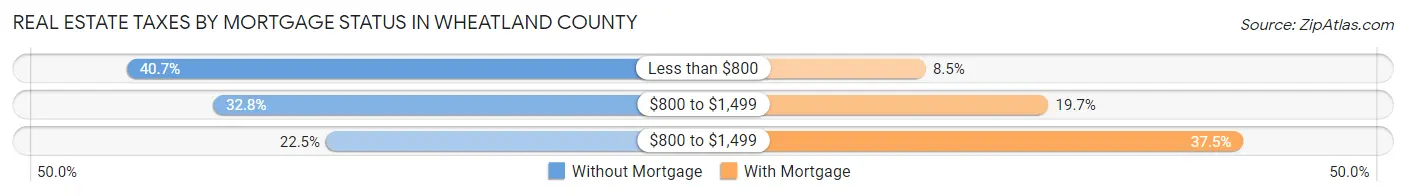
| Property Taxes | Without Mortgage | With Mortgage |
| Less than $800 | 170 (40.7%) | 22 (8.5%) |
| $800 to $1,499 | 137 (32.8%) | 51 (19.7%) |
| $800 to $1,499 | 94 (22.5%) | 97 (37.4%) |
| Total | 418 (100.0%) | 259 (100.0%) |
Health & Disability in Wheatland County
Health Insurance Coverage by Age in Wheatland County
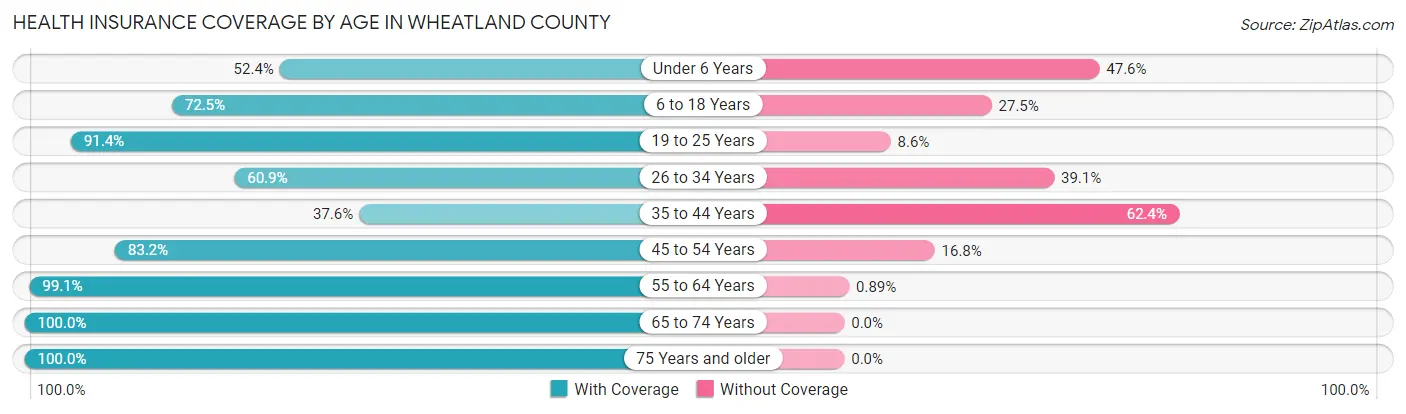
| Age Bracket | With Coverage | Without Coverage |
| Under 6 Years | 43 (52.4%) | 39 (47.6%) |
| 6 to 18 Years | 272 (72.5%) | 103 (27.5%) |
| 19 to 25 Years | 74 (91.4%) | 7 (8.6%) |
| 26 to 34 Years | 123 (60.9%) | 79 (39.1%) |
| 35 to 44 Years | 73 (37.6%) | 121 (62.4%) |
| 45 to 54 Years | 242 (83.2%) | 49 (16.8%) |
| 55 to 64 Years | 223 (99.1%) | 2 (0.9%) |
| 65 to 74 Years | 343 (100.0%) | 0 (0.0%) |
| 75 Years and older | 236 (100.0%) | 0 (0.0%) |
| Total | 1,629 (80.3%) | 400 (19.7%) |
Health Insurance Coverage by Citizenship Status in Wheatland County
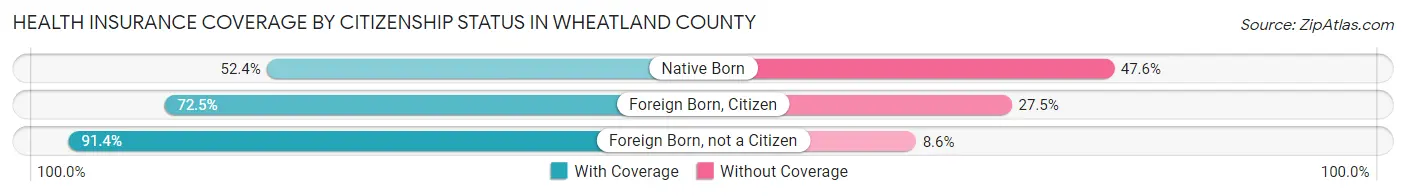
| Citizenship Status | With Coverage | Without Coverage |
| Native Born | 43 (52.4%) | 39 (47.6%) |
| Foreign Born, Citizen | 272 (72.5%) | 103 (27.5%) |
| Foreign Born, not a Citizen | 74 (91.4%) | 7 (8.6%) |
Health Insurance Coverage by Household Income in Wheatland County
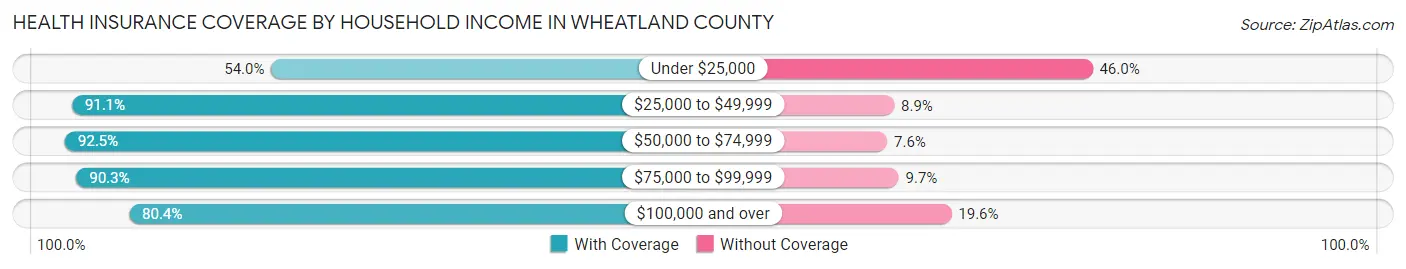
| Household Income | With Coverage | Without Coverage |
| Under $25,000 | 238 (54.0%) | 203 (46.0%) |
| $25,000 to $49,999 | 401 (91.1%) | 39 (8.9%) |
| $50,000 to $74,999 | 343 (92.4%) | 28 (7.5%) |
| $75,000 to $99,999 | 121 (90.3%) | 13 (9.7%) |
| $100,000 and over | 476 (80.4%) | 116 (19.6%) |
Public vs Private Health Insurance Coverage by Age in Wheatland County
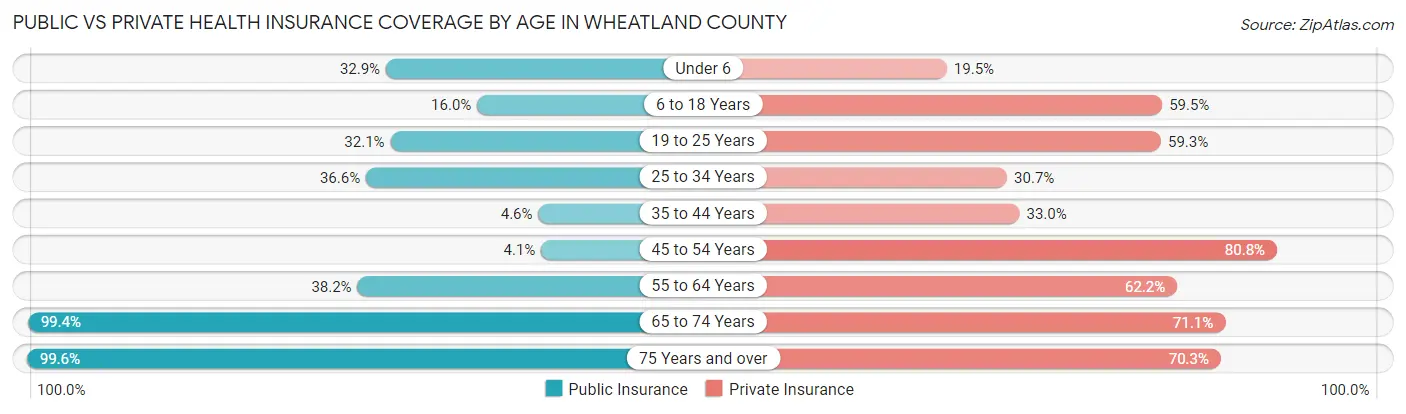
| Age Bracket | Public Insurance | Private Insurance |
| Under 6 | 27 (32.9%) | 16 (19.5%) |
| 6 to 18 Years | 60 (16.0%) | 223 (59.5%) |
| 19 to 25 Years | 26 (32.1%) | 48 (59.3%) |
| 25 to 34 Years | 74 (36.6%) | 62 (30.7%) |
| 35 to 44 Years | 9 (4.6%) | 64 (33.0%) |
| 45 to 54 Years | 12 (4.1%) | 235 (80.8%) |
| 55 to 64 Years | 86 (38.2%) | 140 (62.2%) |
| 65 to 74 Years | 341 (99.4%) | 244 (71.1%) |
| 75 Years and over | 235 (99.6%) | 166 (70.3%) |
| Total | 870 (42.9%) | 1,198 (59.0%) |
Disability Status by Sex by Age in Wheatland County
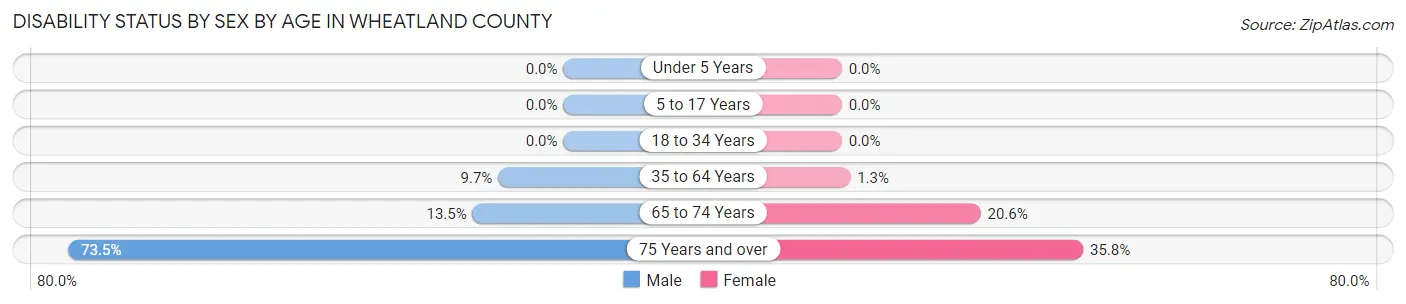
| Age Bracket | Male | Female |
| Under 5 Years | 0 (0.0%) | 0 (0.0%) |
| 5 to 17 Years | 0 (0.0%) | 0 (0.0%) |
| 18 to 34 Years | 0 (0.0%) | 0 (0.0%) |
| 35 to 64 Years | 30 (9.7%) | 5 (1.3%) |
| 65 to 74 Years | 24 (13.5%) | 34 (20.6%) |
| 75 Years and over | 75 (73.5%) | 48 (35.8%) |
Disability Class by Sex by Age in Wheatland County
Disability Class: Hearing Difficulty
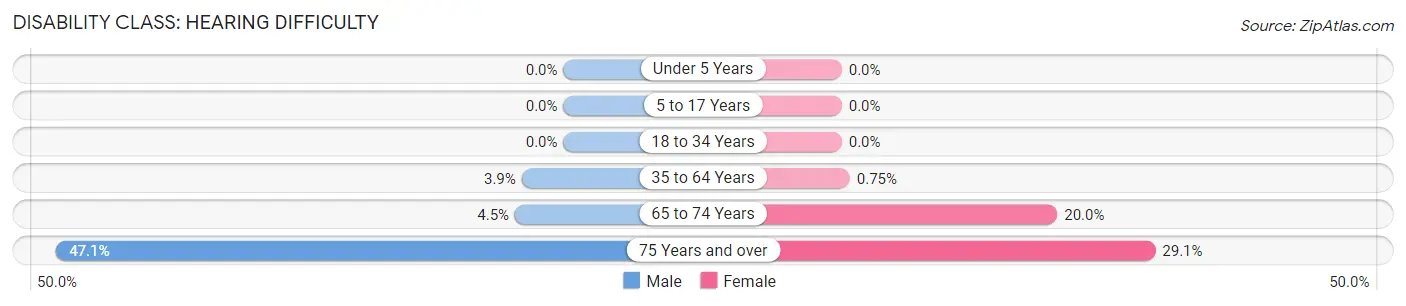
| Age Bracket | Male | Female |
| Under 5 Years | 0 (0.0%) | 0 (0.0%) |
| 5 to 17 Years | 0 (0.0%) | 0 (0.0%) |
| 18 to 34 Years | 0 (0.0%) | 0 (0.0%) |
| 35 to 64 Years | 12 (3.9%) | 3 (0.7%) |
| 65 to 74 Years | 8 (4.5%) | 33 (20.0%) |
| 75 Years and over | 48 (47.1%) | 39 (29.1%) |
Disability Class: Vision Difficulty
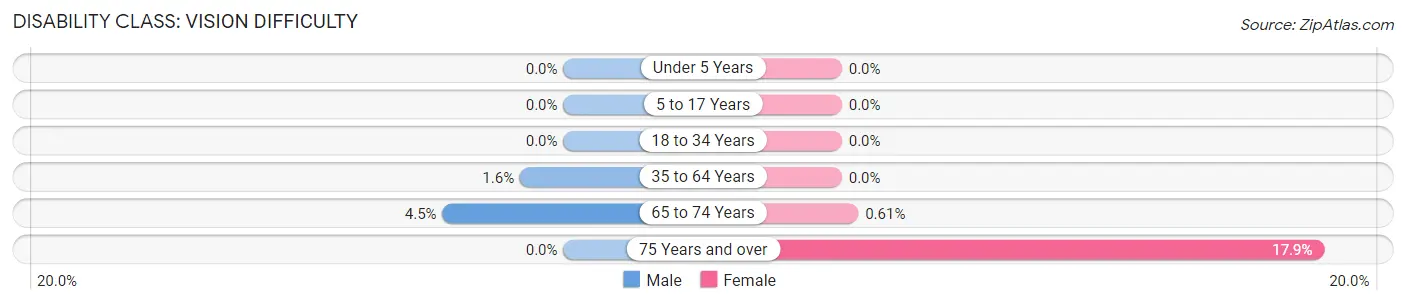
| Age Bracket | Male | Female |
| Under 5 Years | 0 (0.0%) | 0 (0.0%) |
| 5 to 17 Years | 0 (0.0%) | 0 (0.0%) |
| 18 to 34 Years | 0 (0.0%) | 0 (0.0%) |
| 35 to 64 Years | 5 (1.6%) | 0 (0.0%) |
| 65 to 74 Years | 8 (4.5%) | 1 (0.6%) |
| 75 Years and over | 0 (0.0%) | 24 (17.9%) |
Disability Class: Cognitive Difficulty
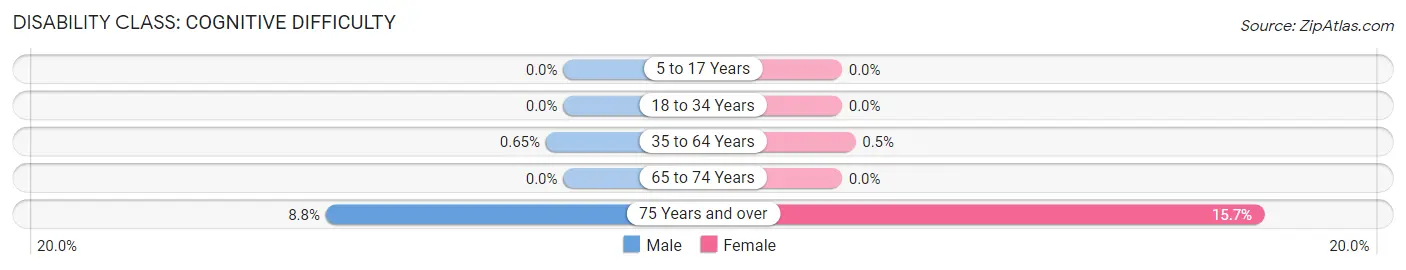
| Age Bracket | Male | Female |
| 5 to 17 Years | 0 (0.0%) | 0 (0.0%) |
| 18 to 34 Years | 0 (0.0%) | 0 (0.0%) |
| 35 to 64 Years | 2 (0.6%) | 2 (0.5%) |
| 65 to 74 Years | 0 (0.0%) | 0 (0.0%) |
| 75 Years and over | 9 (8.8%) | 21 (15.7%) |
Disability Class: Ambulatory Difficulty
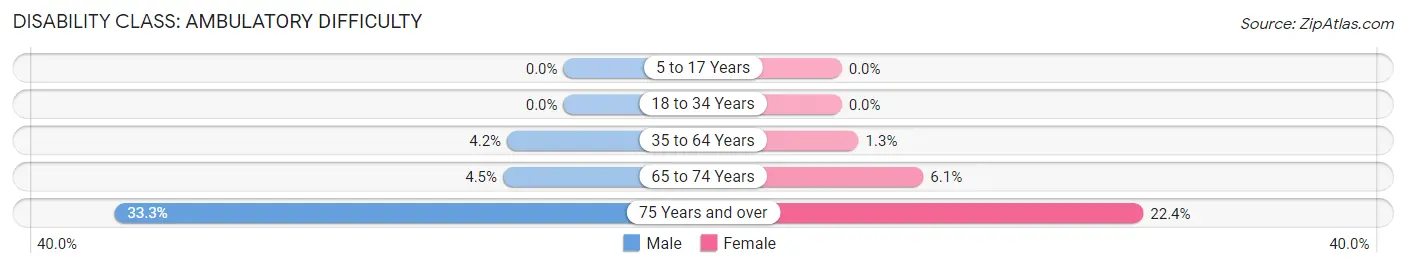
| Age Bracket | Male | Female |
| 5 to 17 Years | 0 (0.0%) | 0 (0.0%) |
| 18 to 34 Years | 0 (0.0%) | 0 (0.0%) |
| 35 to 64 Years | 13 (4.2%) | 5 (1.3%) |
| 65 to 74 Years | 8 (4.5%) | 10 (6.1%) |
| 75 Years and over | 34 (33.3%) | 30 (22.4%) |
Disability Class: Self-Care Difficulty
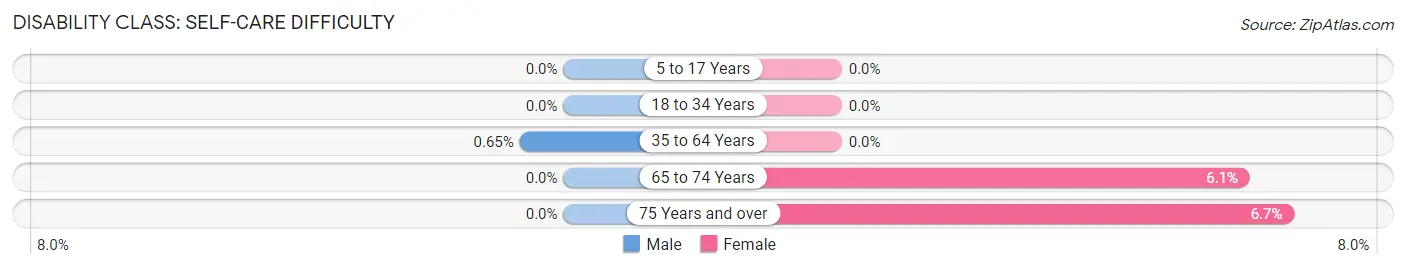
| Age Bracket | Male | Female |
| 5 to 17 Years | 0 (0.0%) | 0 (0.0%) |
| 18 to 34 Years | 0 (0.0%) | 0 (0.0%) |
| 35 to 64 Years | 2 (0.6%) | 0 (0.0%) |
| 65 to 74 Years | 0 (0.0%) | 10 (6.1%) |
| 75 Years and over | 0 (0.0%) | 9 (6.7%) |
Technology Access in Wheatland County
Computing Device Access in Wheatland County
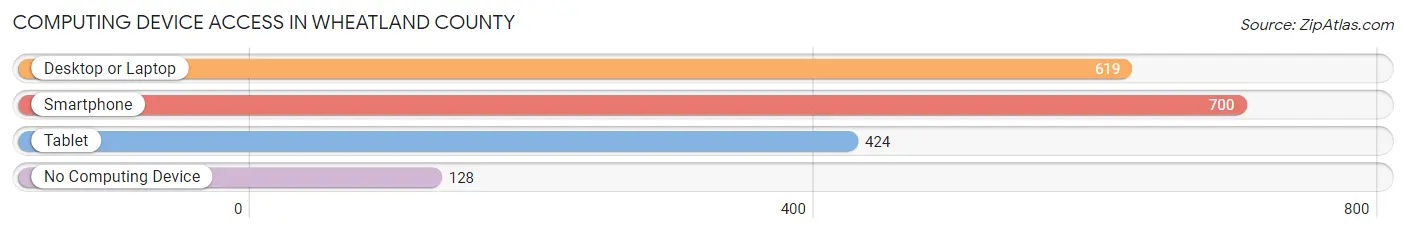
| Device Type | # Households | % Households |
| Desktop or Laptop | 619 | 70.7% |
| Smartphone | 700 | 80.0% |
| Tablet | 424 | 48.5% |
| No Computing Device | 128 | 14.6% |
| Total | 875 | 100.0% |
Internet Access in Wheatland County
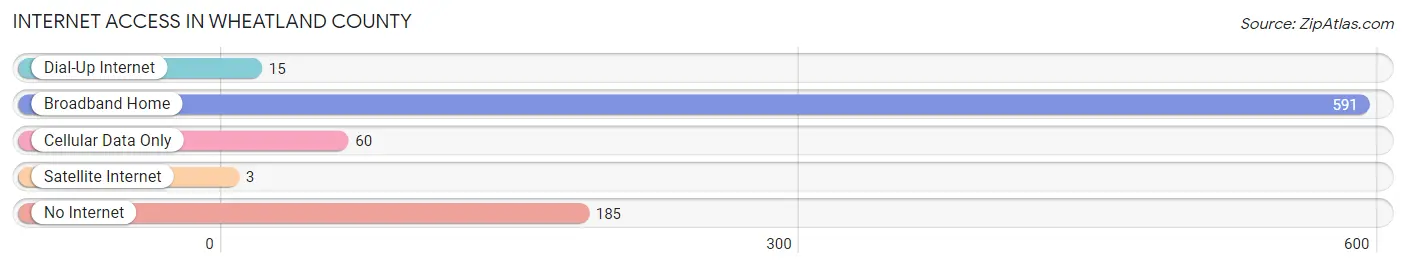
| Internet Type | # Households | % Households |
| Dial-Up Internet | 15 | 1.7% |
| Broadband Home | 591 | 67.5% |
| Cellular Data Only | 60 | 6.9% |
| Satellite Internet | 3 | 0.3% |
| No Internet | 185 | 21.1% |
| Total | 875 | 100.0% |
Wheatland County Summary
Wheatland County, Montana is located in the north-central part of the state, and is bordered by Fergus County to the north, Musselshell County to the east, Golden Valley County to the south, and Judith Basin County to the west. The county seat is Harlowton, and the county has a total area of 1,845 square miles.
History
Wheatland County was established in 1919, and was named for the abundance of wheat grown in the area. The county was originally part of Fergus County, and was created from parts of Fergus, Musselshell, and Golden Valley counties. The county was organized in 1920, and the first county commissioners were elected in 1921.
Geography
Wheatland County is located in the north-central part of Montana, and is bordered by Fergus County to the north, Musselshell County to the east, Golden Valley County to the south, and Judith Basin County to the west. The county has a total area of 1,845 square miles, and is mostly covered by prairie and rolling hills. The county is home to the Little Belt Mountains, which are located in the northern part of the county. The county also contains the Judith River, which flows through the county from north to south.
Economy
Wheatland County’s economy is largely based on agriculture, with wheat, barley, and hay being the primary crops. The county is also home to several ranches, which raise cattle, sheep, and horses. The county is also home to several oil and gas fields, which provide jobs and revenue for the county.
Demographics
As of the 2010 census, Wheatland County had a population of 2,945. The population is spread out with a median age of 44.7 years. The racial makeup of the county is 97.2% White, 0.3% Native American, 0.2% Asian, 0.1% Black or African American, 0.1% Pacific Islander, 0.7% from other races, and 1.4% from two or more races. The median household income is $41,944, and the per capita income is $20,945. The county has a poverty rate of 11.2%.
Wheatland County is a rural county with a small population, but it is a beautiful area with a rich history and a strong agricultural economy. The county is home to several ranches, oil and gas fields, and a variety of crops, making it an important part of the Montana economy.
Common Questions
What is the Total Population of Wheatland County?
Total Population of Wheatland County is 2,060.
What is the Total Male Population of Wheatland County?
Total Male Population of Wheatland County is 942.
What is the Total Female Population of Wheatland County?
Total Female Population of Wheatland County is 1,118.
What is the Ratio of Males per 100 Females in Wheatland County?
There are 84.26 Males per 100 Females in Wheatland County.
What is the Ratio of Females per 100 Males in Wheatland County?
There are 118.68 Females per 100 Males in Wheatland County.
What is the Median Population Age in Wheatland County?
Median Population Age in Wheatland County is 49.1 Years.
What is the Average Family Size in Wheatland County
Average Family Size in Wheatland County is 2.8 People.
What is the Average Household Size in Wheatland County
Average Household Size in Wheatland County is 2.3 People.
What is Per Capita Income in Wheatland County?
Per Capita income in Wheatland County is $28,410.
What is the Median Family Income in Wheatland County?
Median Family Income in Wheatland County is $59,766.
What is the Median Household income in Wheatland County?
Median Household Income in Wheatland County is $48,272.
What is Income or Wage Gap in Wheatland County?
Income or Wage Gap in Wheatland County is 31.1%.
Women in Wheatland County earn 68.9 cents for every dollar earned by a man.
What is Family Income Deficit in Wheatland County?
Family Income Deficit in Wheatland County is $26,129.
Families that are below poverty line in Wheatland County earn $26,129 less on average than the poverty threshold level.
What is Inequality or Gini Index in Wheatland County?
Inequality or Gini Index in Wheatland County is 0.50.
How Large is the Labor Force in Wheatland County?
There are 829 People in the Labor Forcein in Wheatland County.
What is the Percentage of People in the Labor Force in Wheatland County?
49.0% of People are in the Labor Force in Wheatland County.
What is the Unemployment Rate in Wheatland County?
Unemployment Rate in Wheatland County is 0.2%.