Treasure County, MT
Treasure County Map
Treasure County Overview
680
TOTAL POPULATION
359
MALE POPULATION
321
FEMALE POPULATION
111.84
MALES / 100 FEMALES
89.42
FEMALES / 100 MALES
54.3
MEDIAN AGE
2.5
AVG FAMILY SIZE
2.0
AVG HOUSEHOLD SIZE
$37,349
PER CAPITA INCOME
$79,792
AVG FAMILY INCOME
$70,096
AVG HOUSEHOLD INCOME
19.2%
WAGE / INCOME GAP [ % ]
80.8¢/ $1
WAGE / INCOME GAP [ $ ]
0.42
INEQUALITY / GINI INDEX
368
LABOR FORCE [ PEOPLE ]
64.4%
PERCENT IN LABOR FORCE
1.1%
UNEMPLOYMENT RATE
Treasure County Area Codes
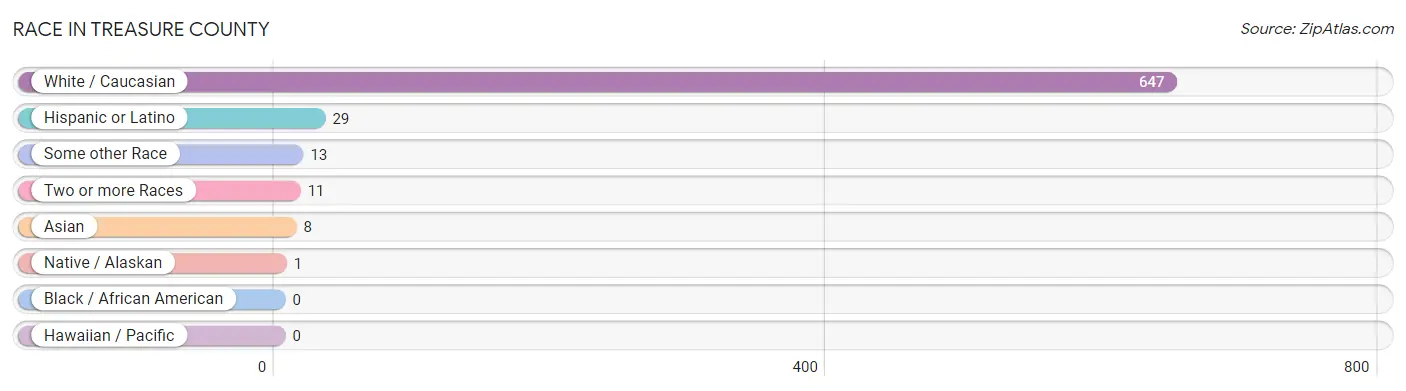
Race in Treasure County
The most populous races in Treasure County are White / Caucasian (647 | 95.2%), Hispanic or Latino (29 | 4.3%), and Some other Race (13 | 1.9%).
| Race | # Population | % Population |
| Asian | 8 | 1.2% |
| Black / African American | 0 | 0.0% |
| Hawaiian / Pacific | 0 | 0.0% |
| Hispanic or Latino | 29 | 4.3% |
| Native / Alaskan | 1 | 0.2% |
| White / Caucasian | 647 | 95.2% |
| Two or more Races | 11 | 1.6% |
| Some other Race | 13 | 1.9% |
| Total | 680 | 100.0% |
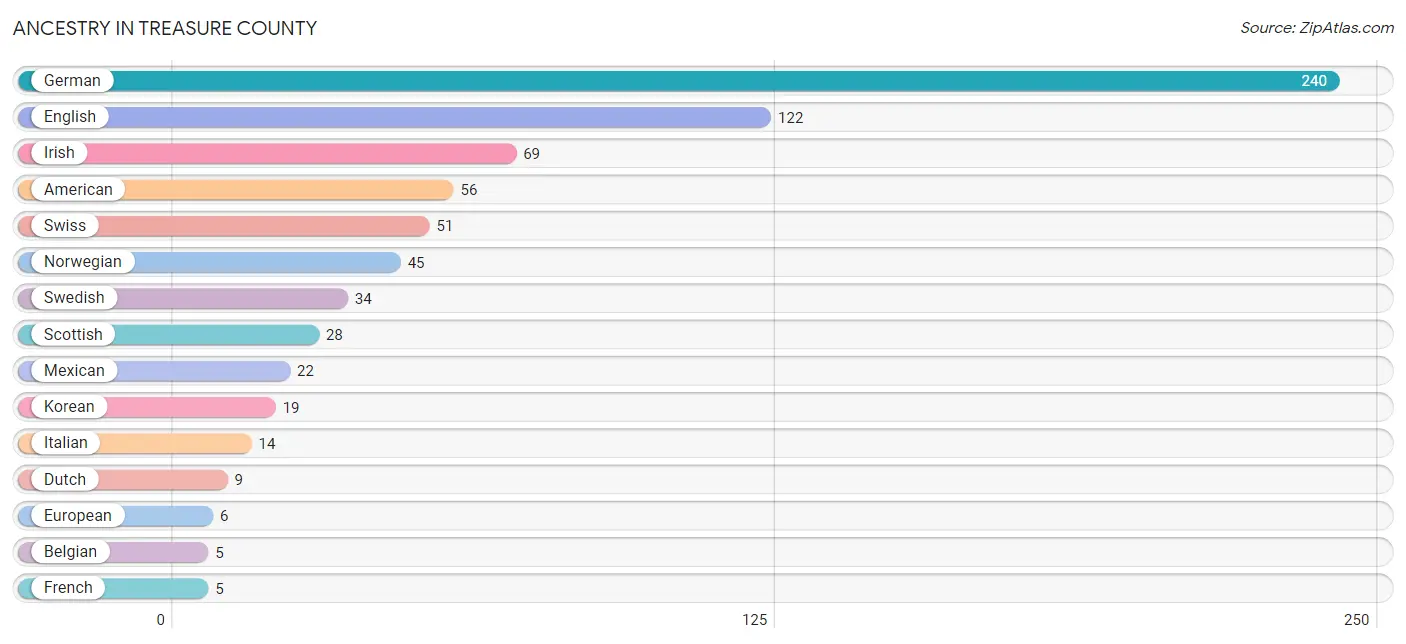
Ancestry in Treasure County
The most populous ancestries reported in Treasure County are German (240 | 35.3%), English (122 | 17.9%), Irish (69 | 10.2%), American (56 | 8.2%), and Swiss (51 | 7.5%), together accounting for 79.1% of all Treasure County residents.
| Ancestry | # Population | % Population |
| American | 56 | 8.2% |
| Belgian | 5 | 0.7% |
| Danish | 4 | 0.6% |
| Dutch | 9 | 1.3% |
| English | 122 | 17.9% |
| European | 6 | 0.9% |
| Finnish | 3 | 0.4% |
| French | 5 | 0.7% |
| German | 240 | 35.3% |
| Irish | 69 | 10.2% |
| Italian | 14 | 2.1% |
| Korean | 19 | 2.8% |
| Mexican | 22 | 3.2% |
| Norwegian | 45 | 6.6% |
| Polish | 4 | 0.6% |
| Portuguese | 3 | 0.4% |
| Puerto Rican | 2 | 0.3% |
| Russian | 1 | 0.2% |
| Scotch-Irish | 1 | 0.2% |
| Scottish | 28 | 4.1% |
| Swedish | 34 | 5.0% |
| Swiss | 51 | 7.5% |
| Ukrainian | 2 | 0.3% | View All 23 Rows |
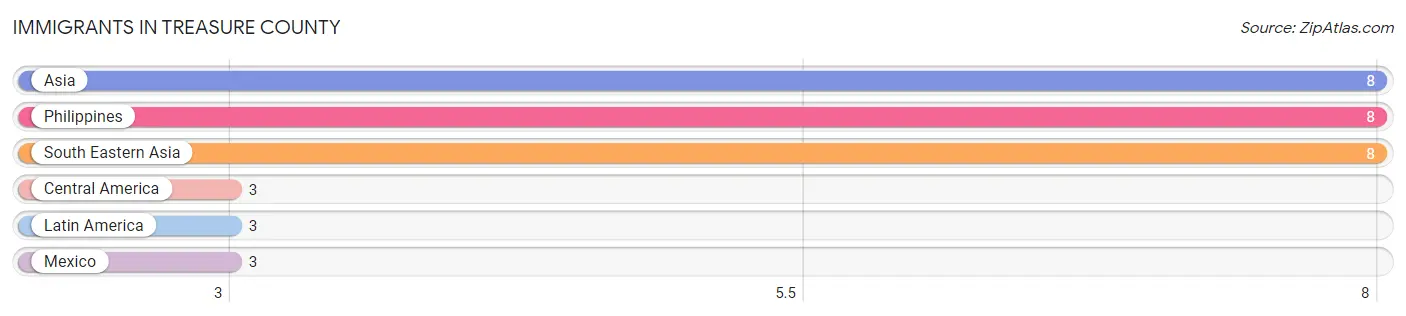
Immigrants in Treasure County
The most numerous immigrant groups reported in Treasure County came from Asia (8 | 1.2%), Philippines (8 | 1.2%), South Eastern Asia (8 | 1.2%), Central America (3 | 0.4%), and Latin America (3 | 0.4%), together accounting for 4.4% of all Treasure County residents.
| Immigration Origin | # Population | % Population |
| Asia | 8 | 1.2% |
| Central America | 3 | 0.4% |
| Latin America | 3 | 0.4% |
| Mexico | 3 | 0.4% |
| Philippines | 8 | 1.2% |
| South Eastern Asia | 8 | 1.2% | View All 6 Rows |
Sex and Age in Treasure County
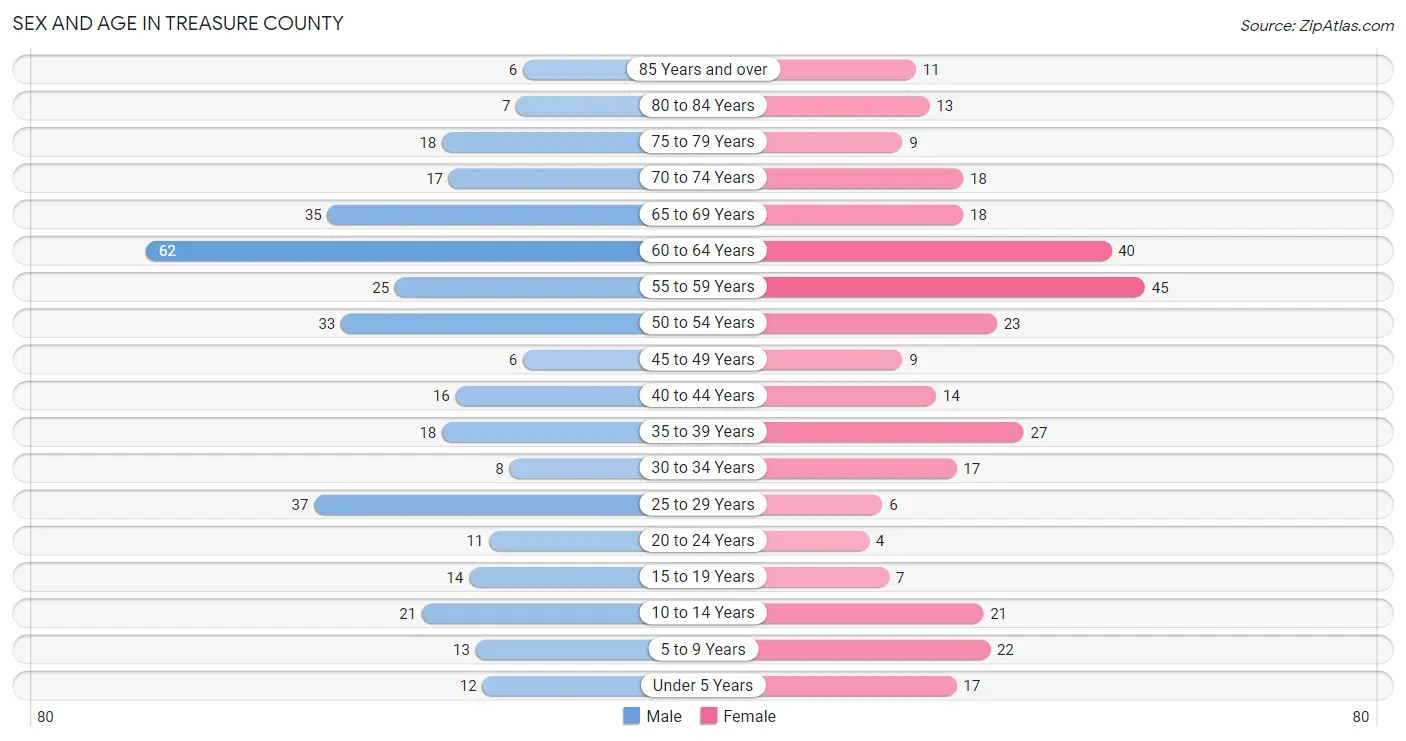
Sex and Age in Treasure County
The most populous age groups in Treasure County are 60 to 64 Years (62 | 17.3%) for men and 55 to 59 Years (45 | 14.0%) for women.
| Age Bracket | Male | Female |
| Under 5 Years | 12 (3.3%) | 17 (5.3%) |
| 5 to 9 Years | 13 (3.6%) | 22 (6.9%) |
| 10 to 14 Years | 21 (5.9%) | 21 (6.5%) |
| 15 to 19 Years | 14 (3.9%) | 7 (2.2%) |
| 20 to 24 Years | 11 (3.1%) | 4 (1.3%) |
| 25 to 29 Years | 37 (10.3%) | 6 (1.9%) |
| 30 to 34 Years | 8 (2.2%) | 17 (5.3%) |
| 35 to 39 Years | 18 (5.0%) | 27 (8.4%) |
| 40 to 44 Years | 16 (4.5%) | 14 (4.4%) |
| 45 to 49 Years | 6 (1.7%) | 9 (2.8%) |
| 50 to 54 Years | 33 (9.2%) | 23 (7.2%) |
| 55 to 59 Years | 25 (7.0%) | 45 (14.0%) |
| 60 to 64 Years | 62 (17.3%) | 40 (12.5%) |
| 65 to 69 Years | 35 (9.8%) | 18 (5.6%) |
| 70 to 74 Years | 17 (4.7%) | 18 (5.6%) |
| 75 to 79 Years | 18 (5.0%) | 9 (2.8%) |
| 80 to 84 Years | 7 (1.9%) | 13 (4.1%) |
| 85 Years and over | 6 (1.7%) | 11 (3.4%) |
| Total | 359 (100.0%) | 321 (100.0%) |
Families and Households in Treasure County
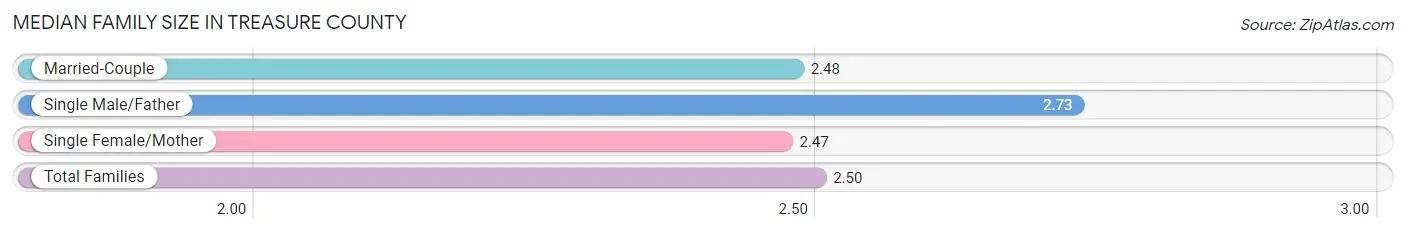
Median Family Size in Treasure County
The median family size in Treasure County is 2.50 persons per family, with single male/father families (15 | 6.9%) accounting for the largest median family size of 2.73 persons per family. On the other hand, single female/mother families (17 | 7.9%) represent the smallest median family size with 2.47 persons per family.
| Family Type | # Families | Family Size |
| Married-Couple | 184 (85.2%) | 2.48 |
| Single Male/Father | 15 (6.9%) | 2.73 |
| Single Female/Mother | 17 (7.9%) | 2.47 |
| Total Families | 216 (100.0%) | 2.50 |
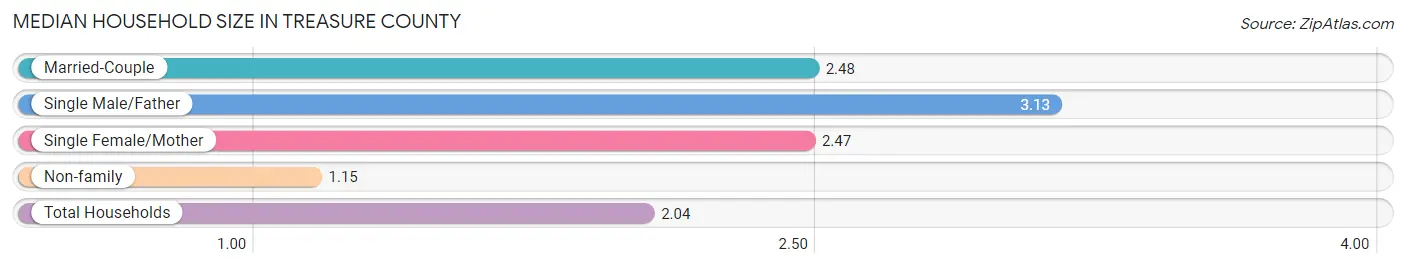
Median Household Size in Treasure County
The median household size in Treasure County is 2.04 persons per household, with single male/father households (15 | 4.5%) accounting for the largest median household size of 3.13 persons per household. non-family households (117 | 35.1%) represent the smallest median household size with 1.15 persons per household.
| Household Type | # Households | Household Size |
| Married-Couple | 184 (55.3%) | 2.48 |
| Single Male/Father | 15 (4.5%) | 3.13 |
| Single Female/Mother | 17 (5.1%) | 2.47 |
| Non-family | 117 (35.1%) | 1.15 |
| Total Households | 333 (100.0%) | 2.04 |
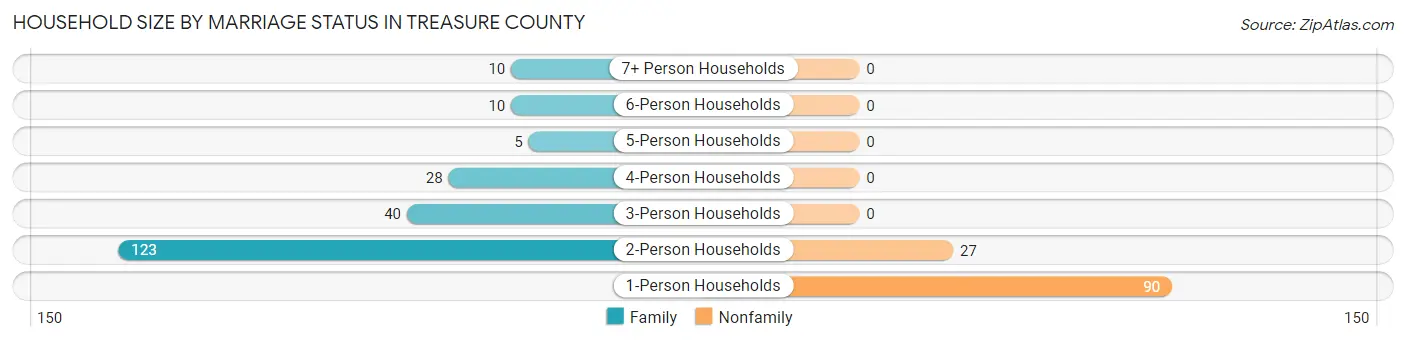
Household Size by Marriage Status in Treasure County
Out of a total of 333 households in Treasure County, 216 (64.9%) are family households, while 117 (35.1%) are nonfamily households. The most numerous type of family households are 2-person households, comprising 123, and the most common type of nonfamily households are 1-person households, comprising 90.
| Household Size | Family Households | Nonfamily Households |
| 1-Person Households | - | 90 (27.0%) |
| 2-Person Households | 123 (36.9%) | 27 (8.1%) |
| 3-Person Households | 40 (12.0%) | 0 (0.0%) |
| 4-Person Households | 28 (8.4%) | 0 (0.0%) |
| 5-Person Households | 5 (1.5%) | 0 (0.0%) |
| 6-Person Households | 10 (3.0%) | 0 (0.0%) |
| 7+ Person Households | 10 (3.0%) | 0 (0.0%) |
| Total | 216 (64.9%) | 117 (35.1%) |
Female Fertility in Treasure County
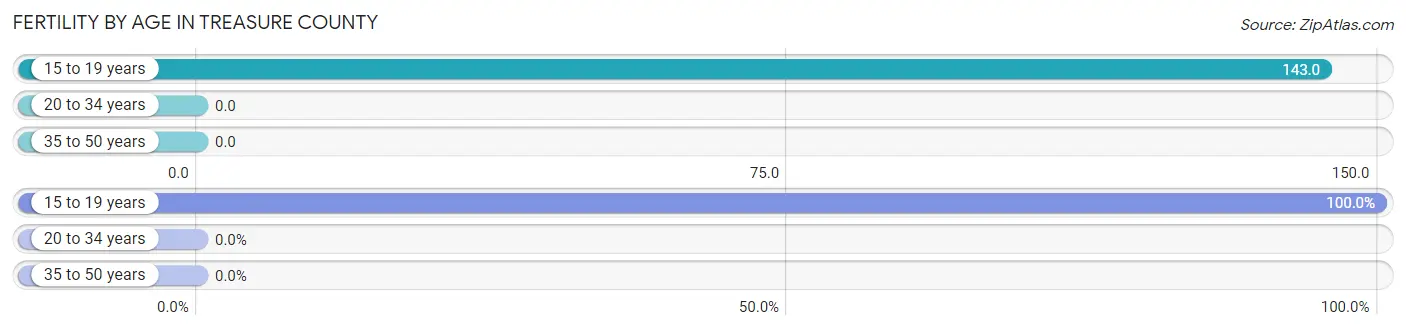
Fertility by Age in Treasure County
Average fertility rate in Treasure County is 11.0 births per 1,000 women. Women in the age bracket of 15 to 19 years have the highest fertility rate with 143.0 births per 1,000 women. Women in the age bracket of 15 to 19 years acount for 100.0% of all women with births.
| Age Bracket | Women with Births | Births / 1,000 Women |
| 15 to 19 years | 1 (100.0%) | 143.0 |
| 20 to 34 years | 0 (0.0%) | 0.0 |
| 35 to 50 years | 0 (0.0%) | 0.0 |
| Total | 1 (100.0%) | 11.0 |
Fertility by Age by Marriage Status in Treasure County
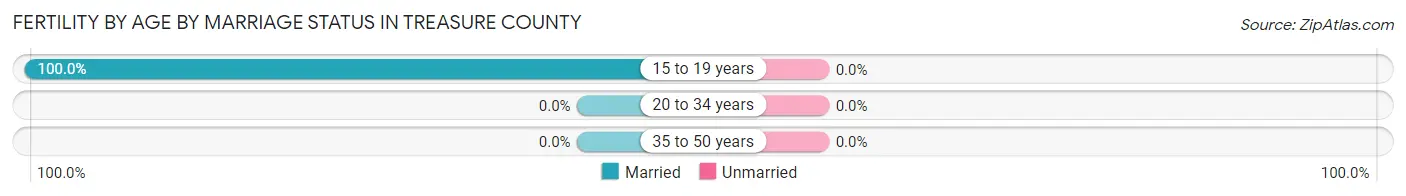
| Age Bracket | Married | Unmarried |
| 15 to 19 years | 1 (100.0%) | 0 (0.0%) |
| 20 to 34 years | 0 (0.0%) | 0 (0.0%) |
| 35 to 50 years | 0 (0.0%) | 0 (0.0%) |
| Total | 1 (100.0%) | 0 (0.0%) |
Fertility by Education in Treasure County
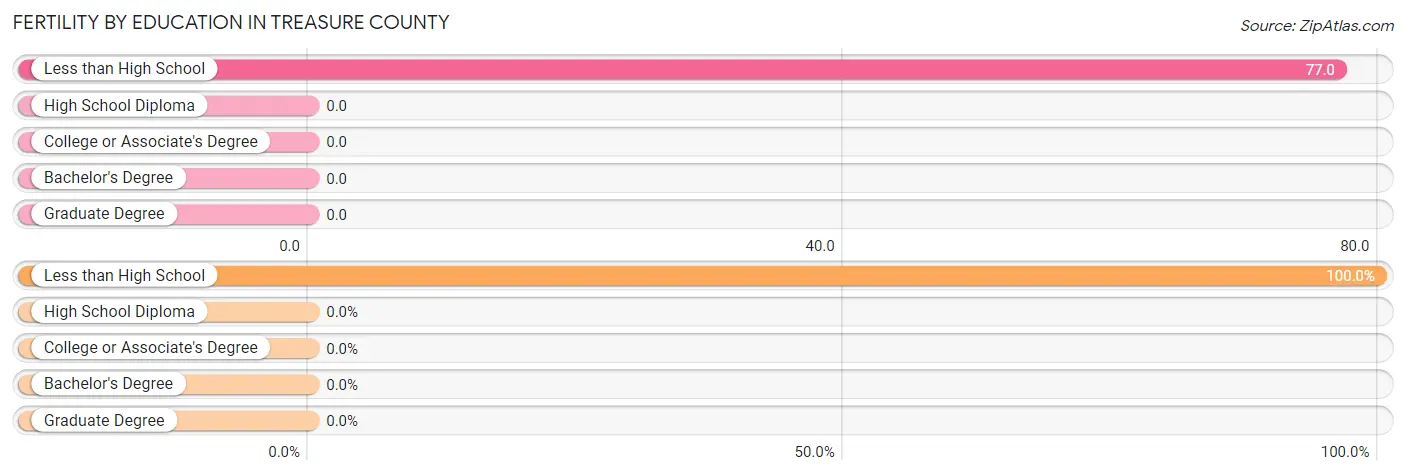
| Educational Attainment | Women with Births | Births / 1,000 Women |
| Less than High School | 1 (100.0%) | 77.0 |
| High School Diploma | 0 (0.0%) | 0.0 |
| College or Associate's Degree | 0 (0.0%) | 0.0 |
| Bachelor's Degree | 0 (0.0%) | 0.0 |
| Graduate Degree | 0 (0.0%) | 0.0 |
| Total | 1 (100.0%) | 11.0 |
Fertility by Education by Marriage Status in Treasure County
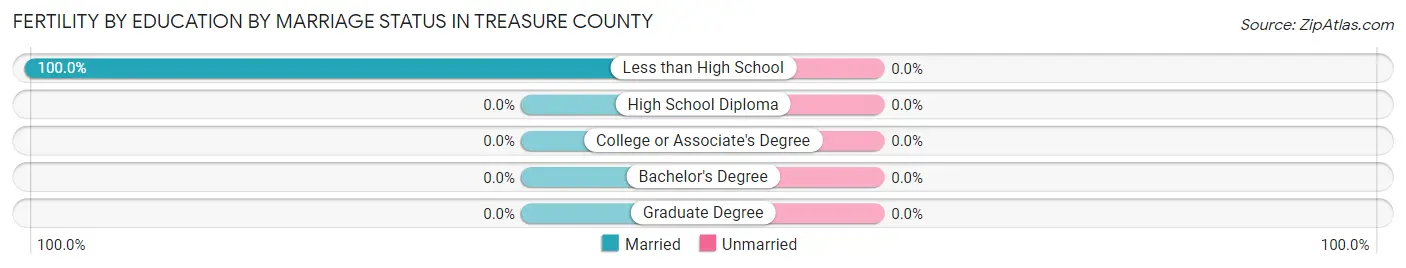
| Educational Attainment | Married | Unmarried |
| Less than High School | 1 (100.0%) | 0 (0.0%) |
| High School Diploma | 0 (0.0%) | 0 (0.0%) |
| College or Associate's Degree | 0 (0.0%) | 0 (0.0%) |
| Bachelor's Degree | 0 (0.0%) | 0 (0.0%) |
| Graduate Degree | 0 (0.0%) | 0 (0.0%) |
| Total | 1 (100.0%) | 0 (0.0%) |
Income in Treasure County
Income Overview in Treasure County
Per Capita Income in Treasure County is $37,349, while median incomes of families and households are $79,792 and $70,096 respectively.
| Characteristic | Number | Measure |
| Per Capita Income | 680 | $37,349 |
| Median Family Income | 216 | $79,792 |
| Mean Family Income | 216 | $88,781 |
| Median Household Income | 333 | $70,096 |
| Mean Household Income | 333 | $77,659 |
| Income Deficit | 216 | $0 |
| Wage / Income Gap (%) | 680 | 19.23% |
| Wage / Income Gap ($) | 680 | 80.77¢ per $1 |
| Gini / Inequality Index | 680 | 0.42 |
Earnings by Sex in Treasure County
Average Earnings in Treasure County are $38,576, $40,903 for men and $33,036 for women, a difference of 19.2%.
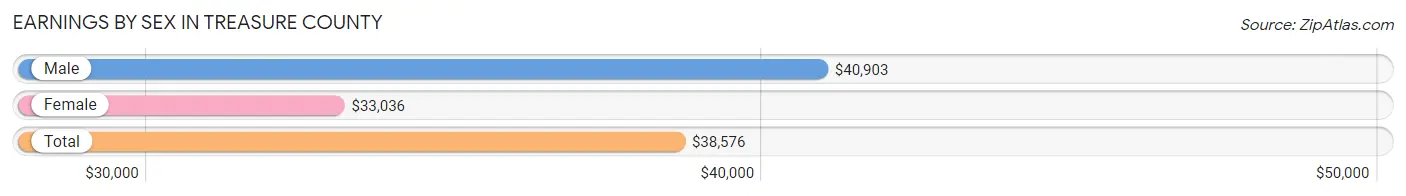
| Sex | Number | Average Earnings |
| Male | 261 (60.0%) | $40,903 |
| Female | 174 (40.0%) | $33,036 |
| Total | 435 (100.0%) | $38,576 |
Earnings by Sex by Income Bracket in Treasure County
The most common earnings brackets in Treasure County are $35,000 to $39,999 for men (59 | 22.6%) and $30,000 to $34,999 for women (35 | 20.1%).
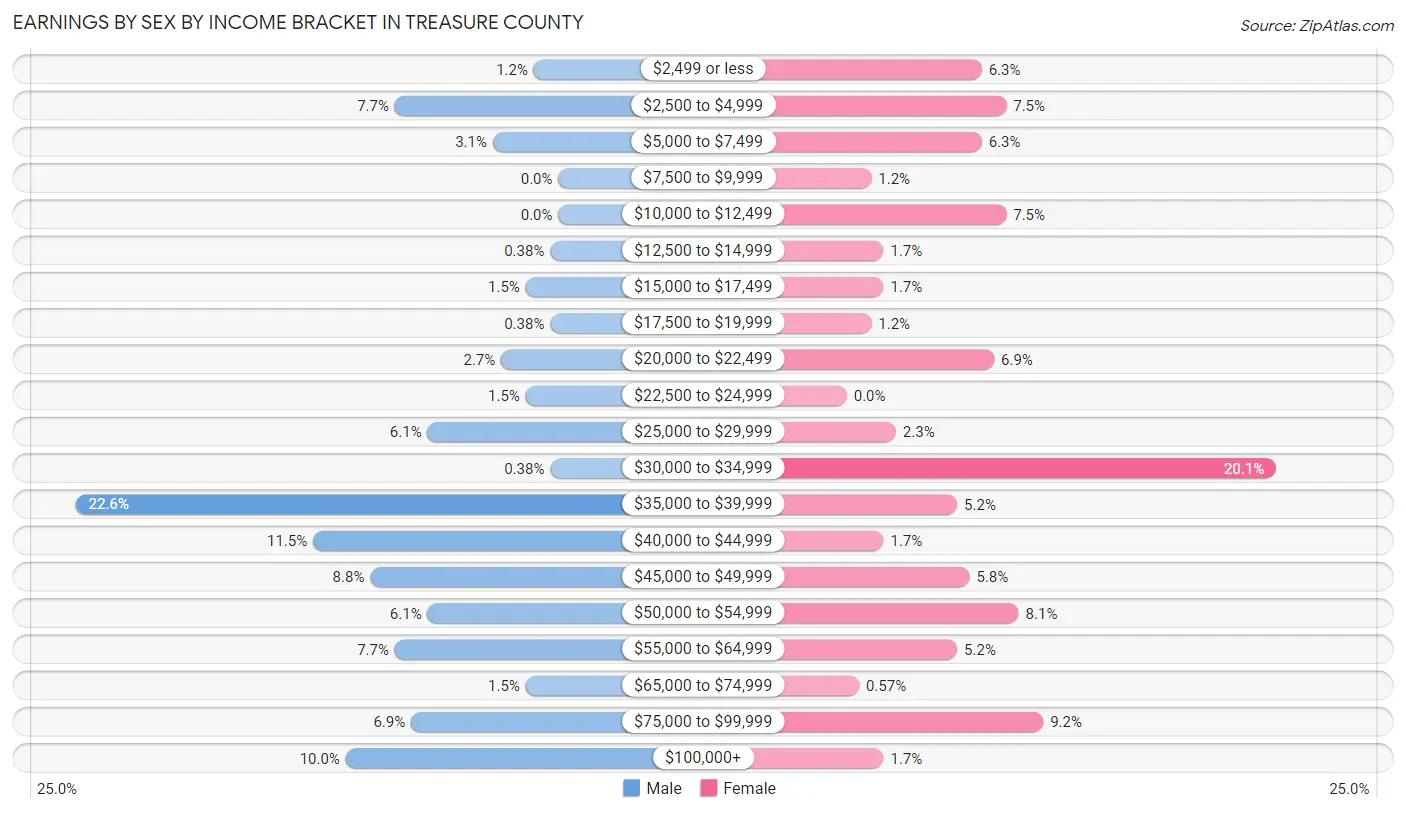
| Income | Male | Female |
| $2,499 or less | 3 (1.1%) | 11 (6.3%) |
| $2,500 to $4,999 | 20 (7.7%) | 13 (7.5%) |
| $5,000 to $7,499 | 8 (3.1%) | 11 (6.3%) |
| $7,500 to $9,999 | 0 (0.0%) | 2 (1.1%) |
| $10,000 to $12,499 | 0 (0.0%) | 13 (7.5%) |
| $12,500 to $14,999 | 1 (0.4%) | 3 (1.7%) |
| $15,000 to $17,499 | 4 (1.5%) | 3 (1.7%) |
| $17,500 to $19,999 | 1 (0.4%) | 2 (1.1%) |
| $20,000 to $22,499 | 7 (2.7%) | 12 (6.9%) |
| $22,500 to $24,999 | 4 (1.5%) | 0 (0.0%) |
| $25,000 to $29,999 | 16 (6.1%) | 4 (2.3%) |
| $30,000 to $34,999 | 1 (0.4%) | 35 (20.1%) |
| $35,000 to $39,999 | 59 (22.6%) | 9 (5.2%) |
| $40,000 to $44,999 | 30 (11.5%) | 3 (1.7%) |
| $45,000 to $49,999 | 23 (8.8%) | 10 (5.8%) |
| $50,000 to $54,999 | 16 (6.1%) | 14 (8.1%) |
| $55,000 to $64,999 | 20 (7.7%) | 9 (5.2%) |
| $65,000 to $74,999 | 4 (1.5%) | 1 (0.6%) |
| $75,000 to $99,999 | 18 (6.9%) | 16 (9.2%) |
| $100,000+ | 26 (10.0%) | 3 (1.7%) |
| Total | 261 (100.0%) | 174 (100.0%) |
Earnings by Sex by Educational Attainment in Treasure County
Average earnings in Treasure County are $42,083 for men and $33,393 for women, a difference of 20.6%. Men with an educational attainment of graduate degree enjoy the highest average annual earnings of $134,375, while those with college or associate's degree education earn the least with $39,135. Women with an educational attainment of graduate degree earn the most with the average annual earnings of $62,083, while those with high school diploma education have the smallest earnings of $20,227.
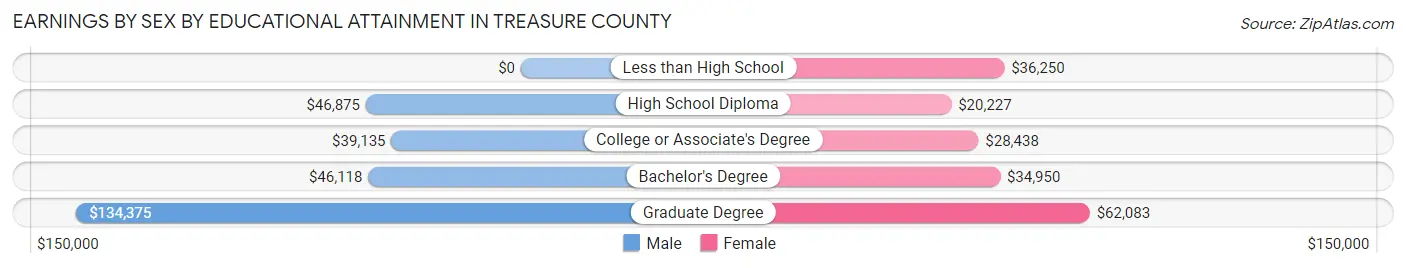
| Educational Attainment | Male Income | Female Income |
| Less than High School | - | - |
| High School Diploma | $46,875 | $20,227 |
| College or Associate's Degree | $39,135 | $28,438 |
| Bachelor's Degree | $46,118 | $34,950 |
| Graduate Degree | $134,375 | $62,083 |
| Total | $42,083 | $33,393 |
Family Income in Treasure County
Family Income Brackets in Treasure County
According to the Treasure County family income data, there are 72 families falling into the $75,000 to $99,999 income range, which is the most common income bracket and makes up 33.3% of all families.
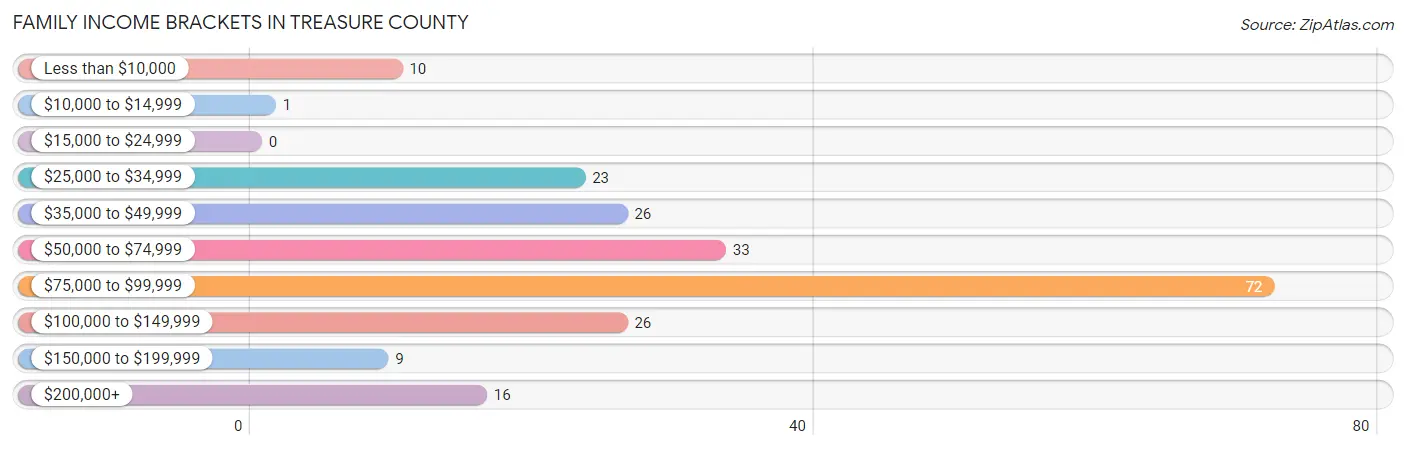
| Income Bracket | # Families | % Families |
| Less than $10,000 | 10 | 4.6% |
| $10,000 to $14,999 | 1 | 0.5% |
| $15,000 to $24,999 | 0 | 0.0% |
| $25,000 to $34,999 | 23 | 10.6% |
| $35,000 to $49,999 | 26 | 12.0% |
| $50,000 to $74,999 | 33 | 15.3% |
| $75,000 to $99,999 | 72 | 33.3% |
| $100,000 to $149,999 | 26 | 12.0% |
| $150,000 to $199,999 | 9 | 4.2% |
| $200,000+ | 16 | 7.4% |
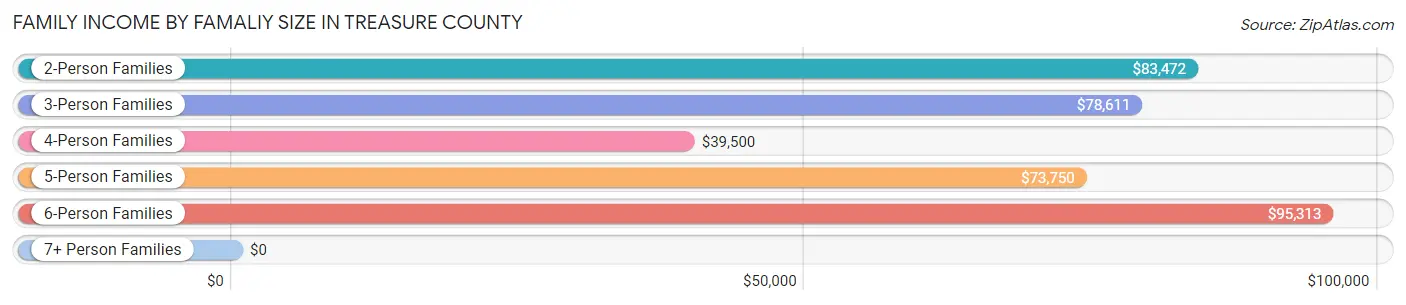
Family Income by Famaliy Size in Treasure County
6-person families (18 | 8.3%) account for the highest median family income in Treasure County with $95,313 per family, while 2-person families (123 | 56.9%) have the highest median income of $41,736 per family member.
| Income Bracket | # Families | Median Income |
| 2-Person Families | 123 (56.9%) | $83,472 |
| 3-Person Families | 40 (18.5%) | $78,611 |
| 4-Person Families | 28 (13.0%) | $39,500 |
| 5-Person Families | 5 (2.3%) | $73,750 |
| 6-Person Families | 18 (8.3%) | $95,313 |
| 7+ Person Families | 2 (0.9%) | $0 |
| Total | 216 (100.0%) | $79,792 |
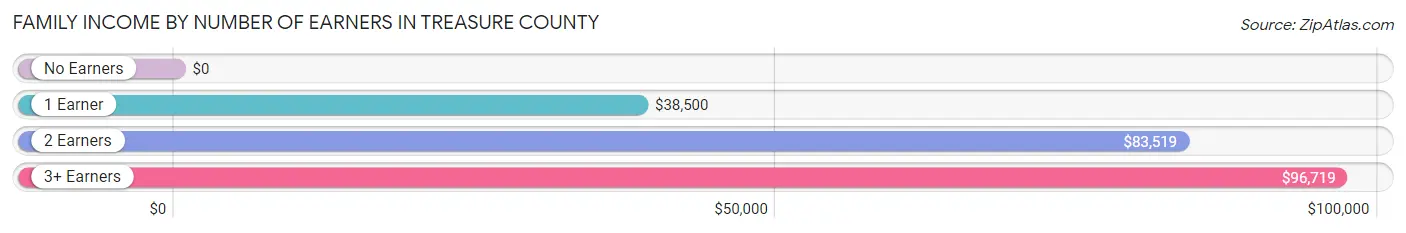
Family Income by Number of Earners in Treasure County
| Number of Earners | # Families | Median Income |
| No Earners | 23 (10.6%) | $0 |
| 1 Earner | 42 (19.4%) | $38,500 |
| 2 Earners | 136 (63.0%) | $83,519 |
| 3+ Earners | 15 (6.9%) | $96,719 |
| Total | 216 (100.0%) | $79,792 |
Household Income in Treasure County
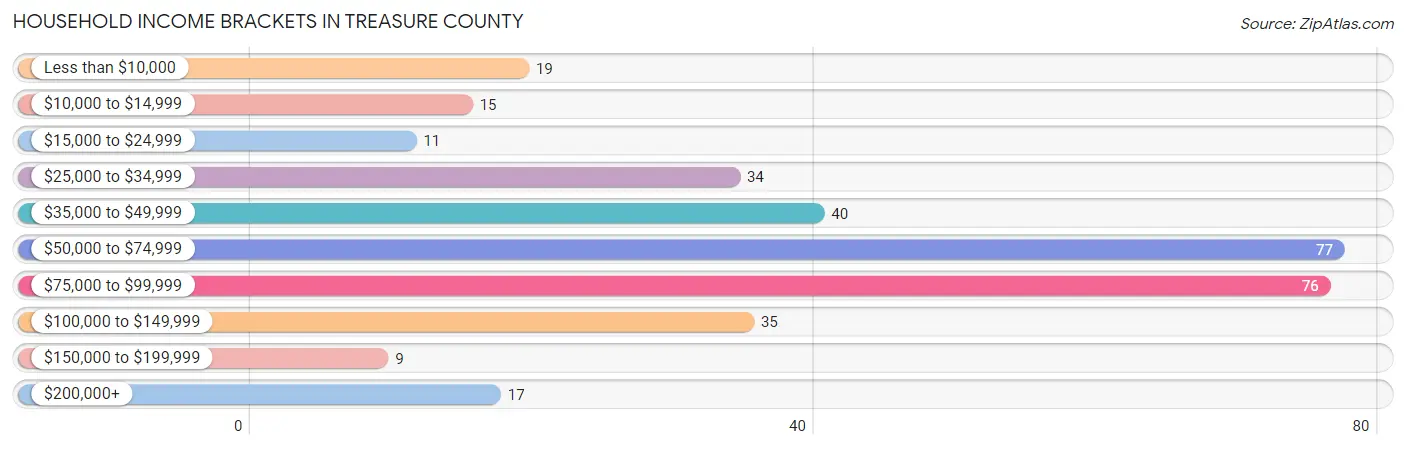
Household Income Brackets in Treasure County
With 77 households falling in the category, the $50,000 to $74,999 income range is the most frequent in Treasure County, accounting for 23.1% of all households. In contrast, only 9 households (2.7%) fall into the $150,000 to $199,999 income bracket, making it the least populous group.
| Income Bracket | # Households | % Households |
| Less than $10,000 | 19 | 5.7% |
| $10,000 to $14,999 | 15 | 4.5% |
| $15,000 to $24,999 | 11 | 3.3% |
| $25,000 to $34,999 | 34 | 10.2% |
| $35,000 to $49,999 | 40 | 12.0% |
| $50,000 to $74,999 | 77 | 23.1% |
| $75,000 to $99,999 | 76 | 22.8% |
| $100,000 to $149,999 | 35 | 10.5% |
| $150,000 to $199,999 | 9 | 2.7% |
| $200,000+ | 17 | 5.1% |
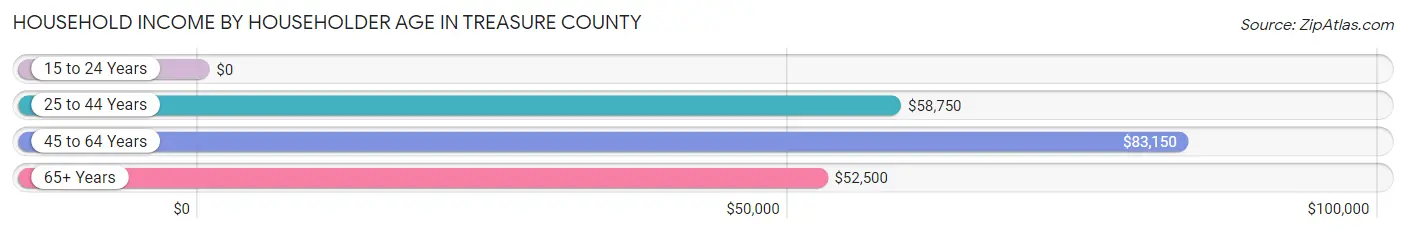
Household Income by Householder Age in Treasure County
The median household income in Treasure County is $70,096, with the highest median household income of $83,150 found in the 45 to 64 years age bracket for the primary householder. A total of 127 households (38.1%) fall into this category. Meanwhile, the 15 to 24 years age bracket for the primary householder has the lowest median household income of $0, with 4 households (1.2%) in this group.
| Income Bracket | # Households | Median Income |
| 15 to 24 Years | 4 (1.2%) | $0 |
| 25 to 44 Years | 96 (28.8%) | $58,750 |
| 45 to 64 Years | 127 (38.1%) | $83,150 |
| 65+ Years | 106 (31.8%) | $52,500 |
| Total | 333 (100.0%) | $70,096 |
Poverty in Treasure County
Income Below Poverty by Sex and Age in Treasure County
With 7.5% poverty level for males and 12.5% for females among the residents of Treasure County, under 5 year old males and 6 to 11 year old females are the most vulnerable to poverty, with 3 males (25.0%) and 9 females (27.3%) in their respective age groups living below the poverty level.
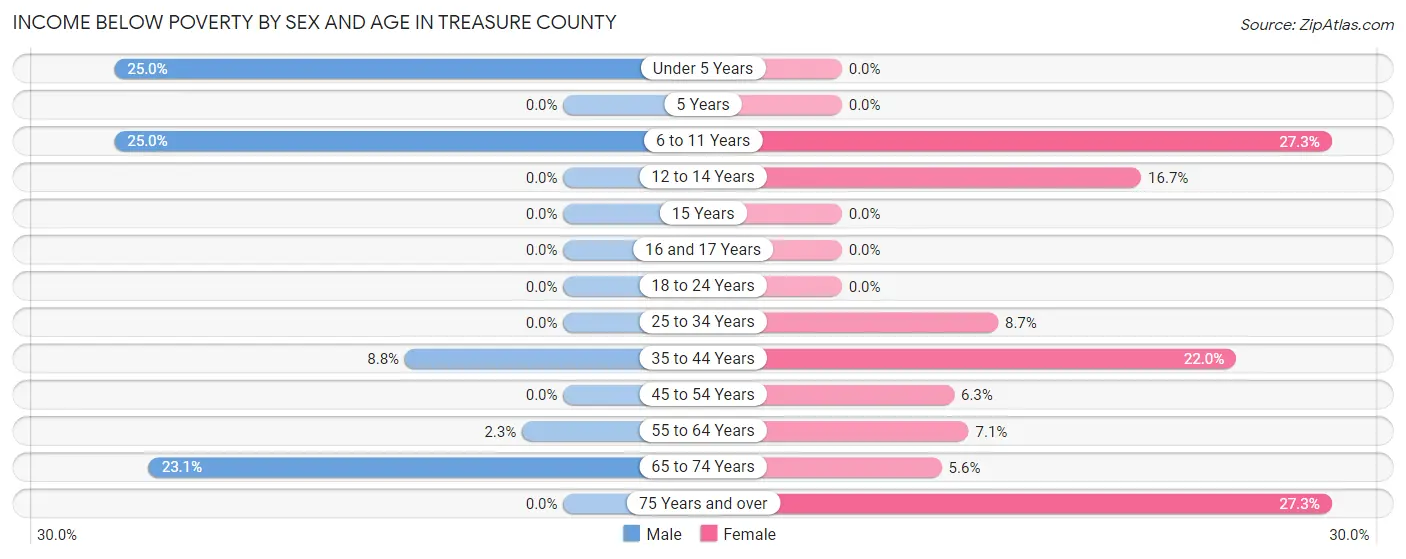
| Age Bracket | Male | Female |
| Under 5 Years | 3 (25.0%) | 0 (0.0%) |
| 5 Years | 0 (0.0%) | 0 (0.0%) |
| 6 to 11 Years | 7 (25.0%) | 9 (27.3%) |
| 12 to 14 Years | 0 (0.0%) | 1 (16.7%) |
| 15 Years | 0 (0.0%) | 0 (0.0%) |
| 16 and 17 Years | 0 (0.0%) | 0 (0.0%) |
| 18 to 24 Years | 0 (0.0%) | 0 (0.0%) |
| 25 to 34 Years | 0 (0.0%) | 2 (8.7%) |
| 35 to 44 Years | 3 (8.8%) | 9 (22.0%) |
| 45 to 54 Years | 0 (0.0%) | 2 (6.2%) |
| 55 to 64 Years | 2 (2.3%) | 6 (7.1%) |
| 65 to 74 Years | 12 (23.1%) | 2 (5.6%) |
| 75 Years and over | 0 (0.0%) | 9 (27.3%) |
| Total | 27 (7.5%) | 40 (12.5%) |
Income Above Poverty by Sex and Age in Treasure County
According to the poverty statistics in Treasure County, males aged 12 to 14 years and females aged under 5 years are the age groups that are most secure financially, with 100.0% of males and 100.0% of females in these age groups living above the poverty line.
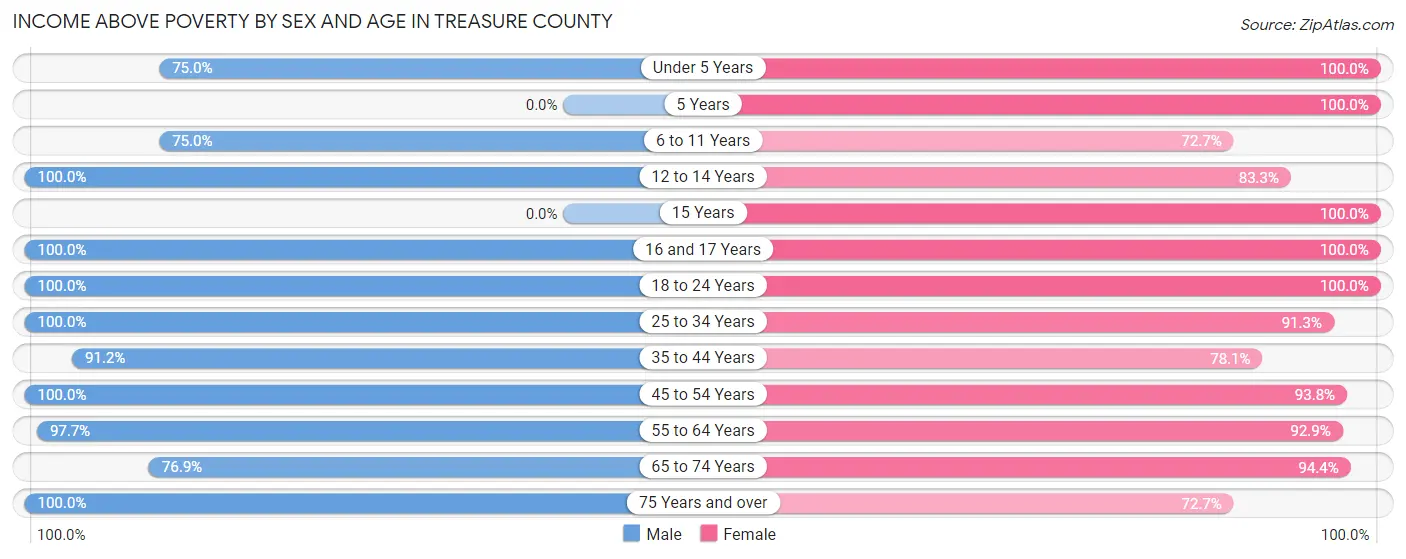
| Age Bracket | Male | Female |
| Under 5 Years | 9 (75.0%) | 17 (100.0%) |
| 5 Years | 0 (0.0%) | 4 (100.0%) |
| 6 to 11 Years | 21 (75.0%) | 24 (72.7%) |
| 12 to 14 Years | 6 (100.0%) | 5 (83.3%) |
| 15 Years | 0 (0.0%) | 3 (100.0%) |
| 16 and 17 Years | 6 (100.0%) | 3 (100.0%) |
| 18 to 24 Years | 19 (100.0%) | 5 (100.0%) |
| 25 to 34 Years | 45 (100.0%) | 21 (91.3%) |
| 35 to 44 Years | 31 (91.2%) | 32 (78.0%) |
| 45 to 54 Years | 39 (100.0%) | 30 (93.8%) |
| 55 to 64 Years | 85 (97.7%) | 79 (92.9%) |
| 65 to 74 Years | 40 (76.9%) | 34 (94.4%) |
| 75 Years and over | 31 (100.0%) | 24 (72.7%) |
| Total | 332 (92.5%) | 281 (87.5%) |
Income Below Poverty Among Married-Couple Families in Treasure County
The poverty statistics for married-couple families in Treasure County show that 2.2% or 4 of the total 184 families live below the poverty line. Families with 3 or 4 children have the highest poverty rate of 15.4%, comprising of 2 families. On the other hand, families with 1 or 2 children have the lowest poverty rate of 0.0%, which includes 0 families.
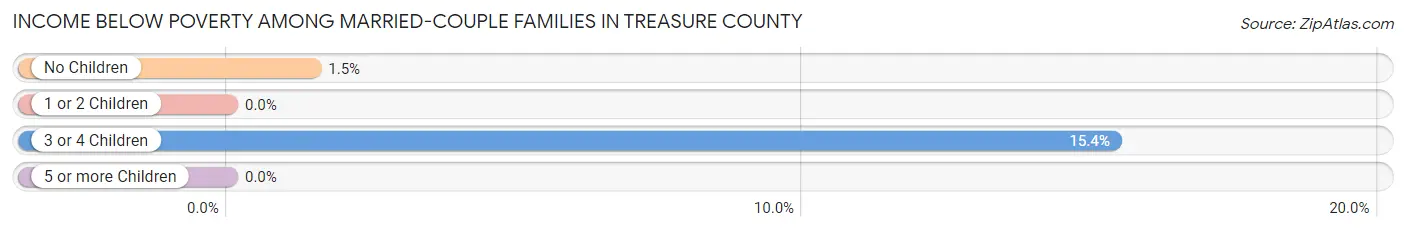
| Children | Above Poverty | Below Poverty |
| No Children | 136 (98.6%) | 2 (1.5%) |
| 1 or 2 Children | 31 (100.0%) | 0 (0.0%) |
| 3 or 4 Children | 11 (84.6%) | 2 (15.4%) |
| 5 or more Children | 2 (100.0%) | 0 (0.0%) |
| Total | 180 (97.8%) | 4 (2.2%) |
Income Below Poverty Among Single-Parent Households in Treasure County
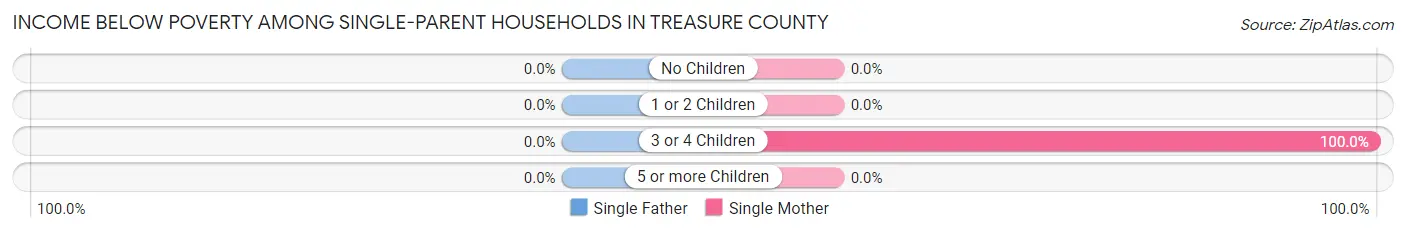
| Children | Single Father | Single Mother |
| No Children | 0 (0.0%) | 0 (0.0%) |
| 1 or 2 Children | 0 (0.0%) | 0 (0.0%) |
| 3 or 4 Children | 0 (0.0%) | 9 (100.0%) |
| 5 or more Children | 0 (0.0%) | 0 (0.0%) |
| Total | 0 (0.0%) | 9 (52.9%) |
Income Below Poverty Among Married-Couple vs Single-Parent Households in Treasure County
The poverty data for Treasure County shows that 4 of the married-couple family households (2.2%) and 9 of the single-parent households (28.1%) are living below the poverty level. Within the married-couple family households, those with 3 or 4 children have the highest poverty rate, with 2 households (15.4%) falling below the poverty line. Among the single-parent households, those with 3 or 4 children have the highest poverty rate, with 9 household (47.4%) living below poverty.
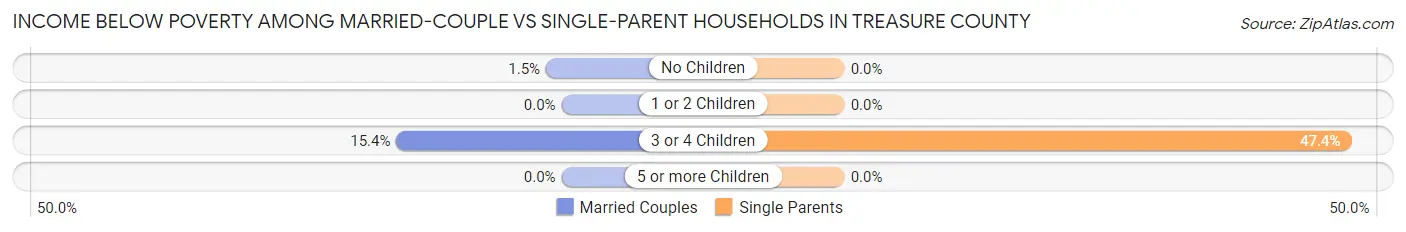
| Children | Married-Couple Families | Single-Parent Households |
| No Children | 2 (1.5%) | 0 (0.0%) |
| 1 or 2 Children | 0 (0.0%) | 0 (0.0%) |
| 3 or 4 Children | 2 (15.4%) | 9 (47.4%) |
| 5 or more Children | 0 (0.0%) | 0 (0.0%) |
| Total | 4 (2.2%) | 9 (28.1%) |
Employment Characteristics in Treasure County
Employment by Class of Employer in Treasure County
Among the 361 employed individuals in Treasure County, private company employees (175 | 48.5%), self-employed (incorporated) (47 | 13.0%), and local government employees (42 | 11.6%) make up the most common classes of employment.
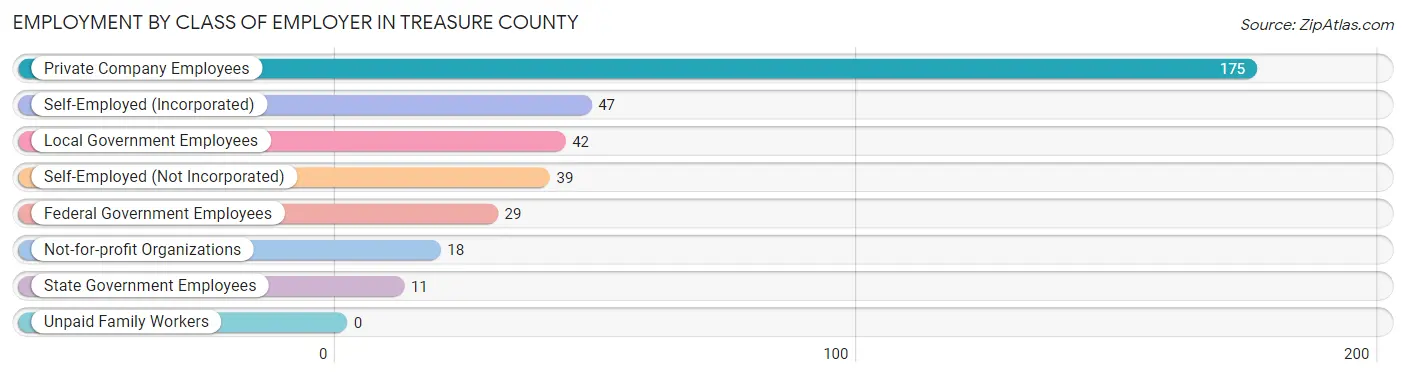
| Employer Class | # Employees | % Employees |
| Private Company Employees | 175 | 48.5% |
| Self-Employed (Incorporated) | 47 | 13.0% |
| Self-Employed (Not Incorporated) | 39 | 10.8% |
| Not-for-profit Organizations | 18 | 5.0% |
| Local Government Employees | 42 | 11.6% |
| State Government Employees | 11 | 3.0% |
| Federal Government Employees | 29 | 8.0% |
| Unpaid Family Workers | 0 | 0.0% |
| Total | 361 | 100.0% |
Employment Status by Age in Treasure County
According to the labor force statistics for Treasure County, out of the total population over 16 years of age (571), 64.4% or 368 individuals are in the labor force, with 1.1% or 4 of them unemployed. The age group with the highest labor force participation rate is 20 to 24 years, with 100.0% or 15 individuals in the labor force. Within the labor force, the 16 to 19 years age range has the highest percentage of unemployed individuals, with 100.0% or 3 of them being unemployed.
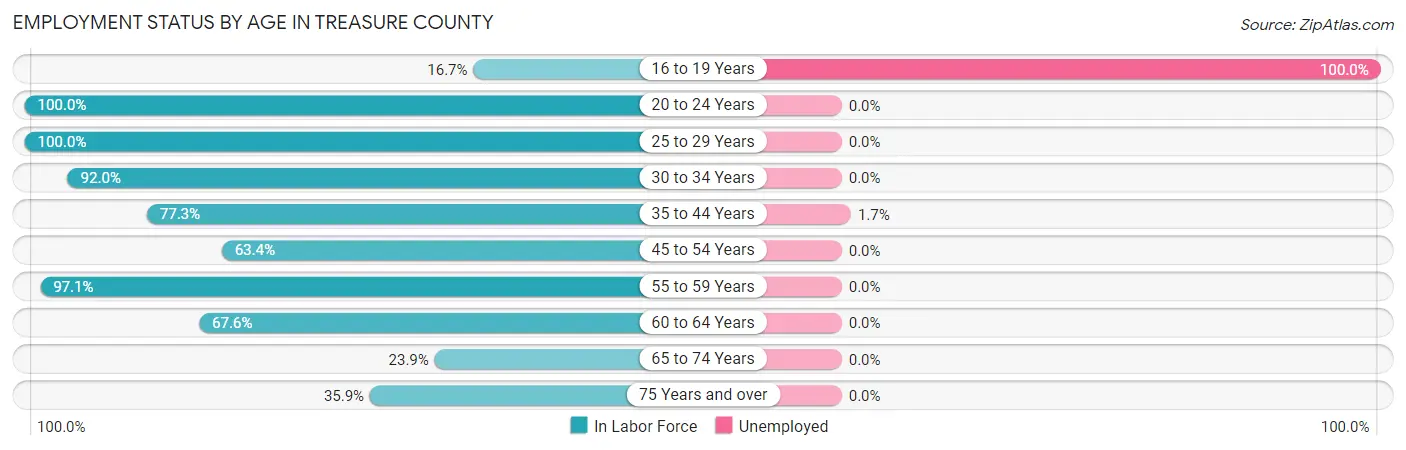
| Age Bracket | In Labor Force | Unemployed |
| 16 to 19 Years | 3 (16.7%) | 3 (100.0%) |
| 20 to 24 Years | 15 (100.0%) | 0 (0.0%) |
| 25 to 29 Years | 43 (100.0%) | 0 (0.0%) |
| 30 to 34 Years | 23 (92.0%) | 0 (0.0%) |
| 35 to 44 Years | 58 (77.3%) | 1 (1.7%) |
| 45 to 54 Years | 45 (63.4%) | 0 (0.0%) |
| 55 to 59 Years | 68 (97.1%) | 0 (0.0%) |
| 60 to 64 Years | 69 (67.6%) | 0 (0.0%) |
| 65 to 74 Years | 21 (23.9%) | 0 (0.0%) |
| 75 Years and over | 23 (35.9%) | 0 (0.0%) |
| Total | 368 (64.4%) | 4 (1.1%) |
Employment Status by Educational Attainment in Treasure County
According to labor force statistics for Treasure County, 79.3% of individuals (306) out of the total population between 25 and 64 years of age (386) are in the labor force, with 0.3% or 1 of them being unemployed. The group with the highest labor force participation rate are those with the educational attainment of less than high school, with 100.0% or 20 individuals in the labor force. Within the labor force, individuals with bachelor's degree or higher education have the highest percentage of unemployment, with 0.8% or 1 of them being unemployed.
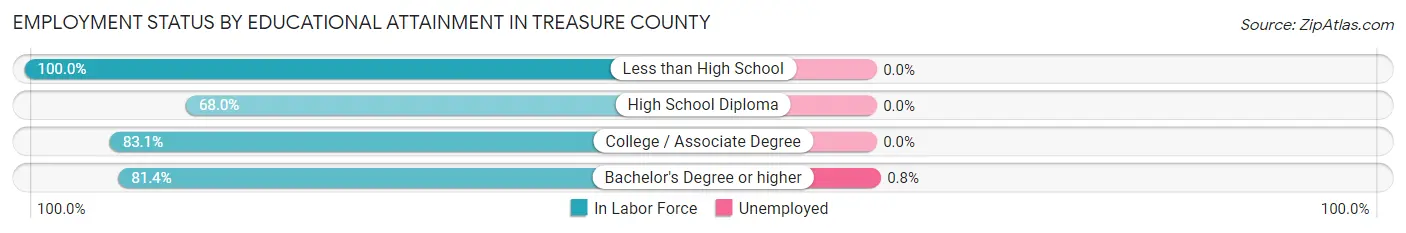
| Educational Attainment | In Labor Force | Unemployed |
| Less than High School | 20 (100.0%) | 0 (0.0%) |
| High School Diploma | 70 (68.0%) | 0 (0.0%) |
| College / Associate Degree | 98 (83.1%) | 0 (0.0%) |
| Bachelor's Degree or higher | 118 (81.4%) | 1 (0.8%) |
| Total | 306 (79.3%) | 1 (0.3%) |
Employment Occupations by Sex in Treasure County
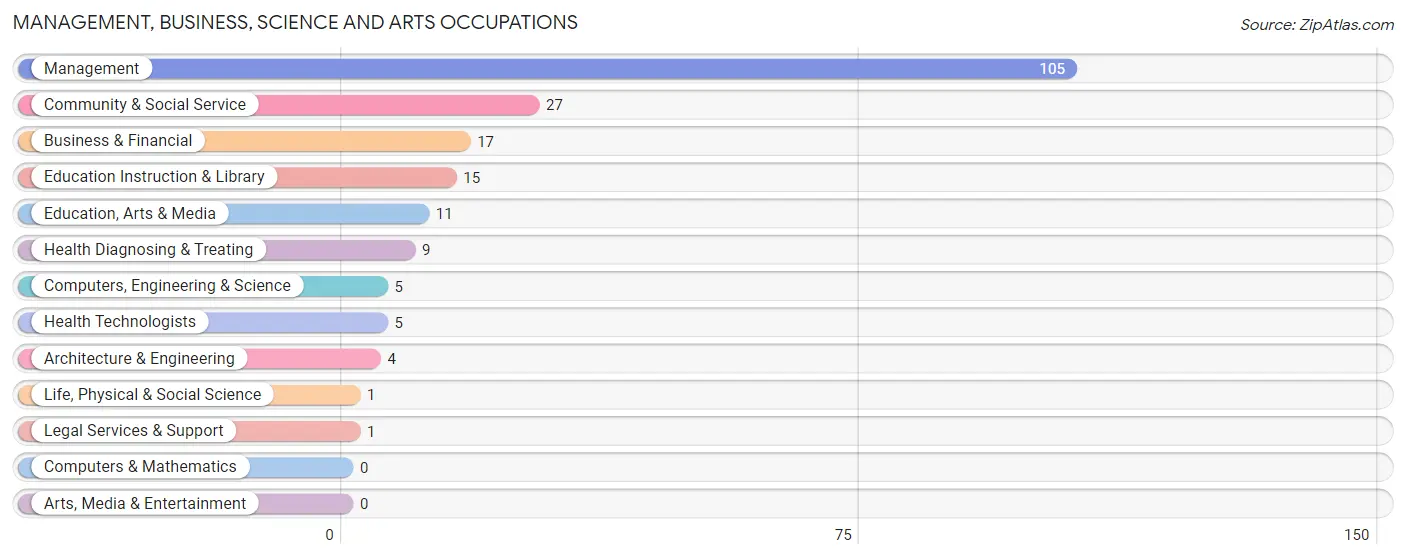
Management, Business, Science and Arts Occupations
The most common Management, Business, Science and Arts occupations in Treasure County are Management (105 | 28.8%), Community & Social Service (27 | 7.4%), Business & Financial (17 | 4.7%), Education Instruction & Library (15 | 4.1%), and Education, Arts & Media (11 | 3.0%).
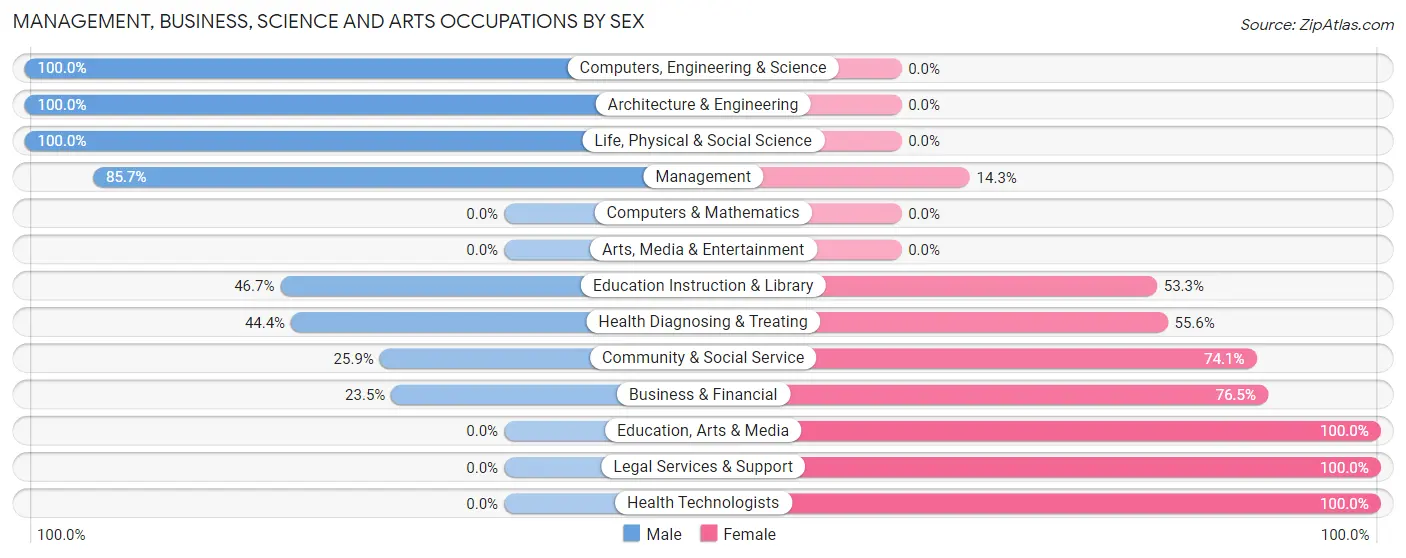
Management, Business, Science and Arts Occupations by Sex
Within the Management, Business, Science and Arts occupations in Treasure County, the most male-oriented occupations are Computers, Engineering & Science (100.0%), Architecture & Engineering (100.0%), and Life, Physical & Social Science (100.0%), while the most female-oriented occupations are Education, Arts & Media (100.0%), Legal Services & Support (100.0%), and Health Technologists (100.0%).
| Occupation | Male | Female |
| Management | 90 (85.7%) | 15 (14.3%) |
| Business & Financial | 4 (23.5%) | 13 (76.5%) |
| Computers, Engineering & Science | 5 (100.0%) | 0 (0.0%) |
| Computers & Mathematics | 0 (0.0%) | 0 (0.0%) |
| Architecture & Engineering | 4 (100.0%) | 0 (0.0%) |
| Life, Physical & Social Science | 1 (100.0%) | 0 (0.0%) |
| Community & Social Service | 7 (25.9%) | 20 (74.1%) |
| Education, Arts & Media | 0 (0.0%) | 11 (100.0%) |
| Legal Services & Support | 0 (0.0%) | 1 (100.0%) |
| Education Instruction & Library | 7 (46.7%) | 8 (53.3%) |
| Arts, Media & Entertainment | 0 (0.0%) | 0 (0.0%) |
| Health Diagnosing & Treating | 4 (44.4%) | 5 (55.6%) |
| Health Technologists | 0 (0.0%) | 5 (100.0%) |
| Total (Category) | 110 (67.5%) | 53 (32.5%) |
| Total (Overall) | 230 (63.2%) | 134 (36.8%) |
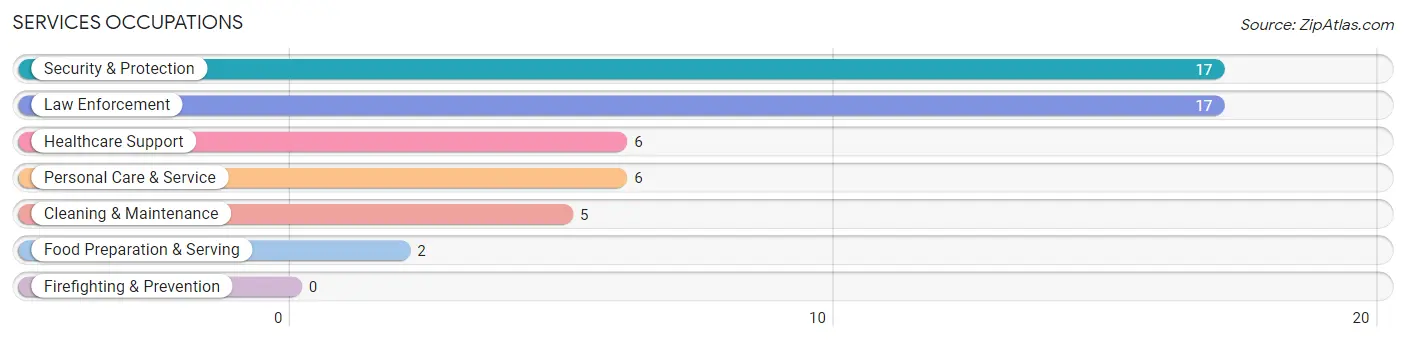
Services Occupations
The most common Services occupations in Treasure County are Security & Protection (17 | 4.7%), Law Enforcement (17 | 4.7%), Healthcare Support (6 | 1.7%), Personal Care & Service (6 | 1.7%), and Cleaning & Maintenance (5 | 1.4%).
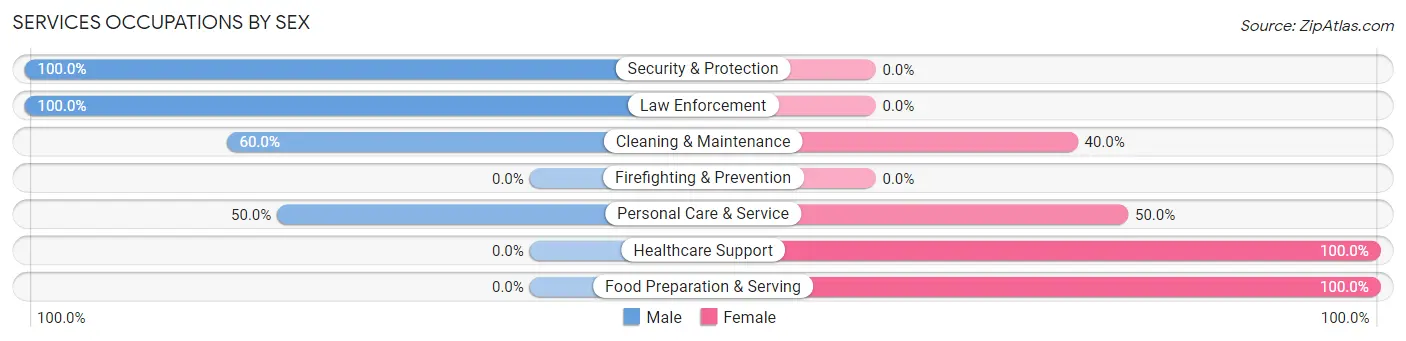
Services Occupations by Sex
Within the Services occupations in Treasure County, the most male-oriented occupations are Security & Protection (100.0%), Law Enforcement (100.0%), and Cleaning & Maintenance (60.0%), while the most female-oriented occupations are Healthcare Support (100.0%), Food Preparation & Serving (100.0%), and Personal Care & Service (50.0%).
| Occupation | Male | Female |
| Healthcare Support | 0 (0.0%) | 6 (100.0%) |
| Security & Protection | 17 (100.0%) | 0 (0.0%) |
| Firefighting & Prevention | 0 (0.0%) | 0 (0.0%) |
| Law Enforcement | 17 (100.0%) | 0 (0.0%) |
| Food Preparation & Serving | 0 (0.0%) | 2 (100.0%) |
| Cleaning & Maintenance | 3 (60.0%) | 2 (40.0%) |
| Personal Care & Service | 3 (50.0%) | 3 (50.0%) |
| Total (Category) | 23 (63.9%) | 13 (36.1%) |
| Total (Overall) | 230 (63.2%) | 134 (36.8%) |
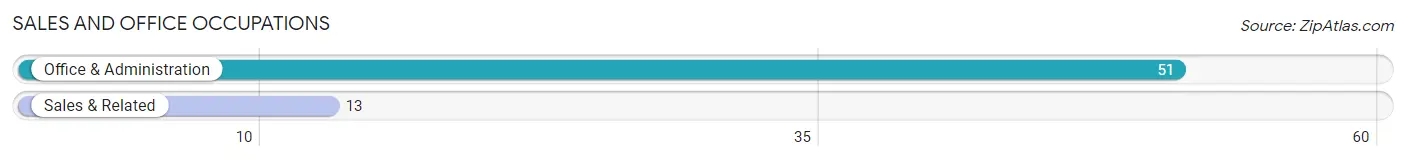
Sales and Office Occupations
The most common Sales and Office occupations in Treasure County are Office & Administration (51 | 14.0%), and Sales & Related (13 | 3.6%).
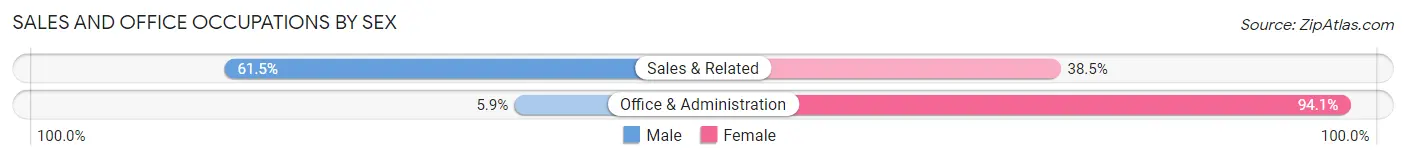
Sales and Office Occupations by Sex
| Occupation | Male | Female |
| Sales & Related | 8 (61.5%) | 5 (38.5%) |
| Office & Administration | 3 (5.9%) | 48 (94.1%) |
| Total (Category) | 11 (17.2%) | 53 (82.8%) |
| Total (Overall) | 230 (63.2%) | 134 (36.8%) |
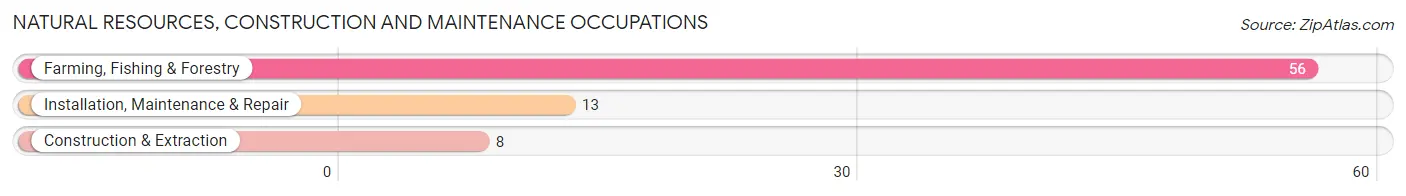
Natural Resources, Construction and Maintenance Occupations
The most common Natural Resources, Construction and Maintenance occupations in Treasure County are Farming, Fishing & Forestry (56 | 15.4%), Installation, Maintenance & Repair (13 | 3.6%), and Construction & Extraction (8 | 2.2%).
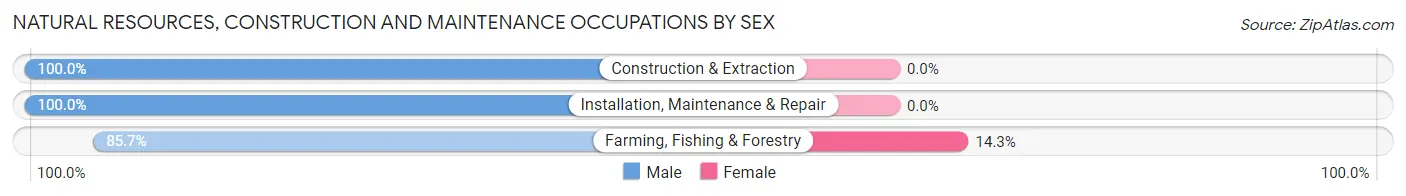
Natural Resources, Construction and Maintenance Occupations by Sex
| Occupation | Male | Female |
| Farming, Fishing & Forestry | 48 (85.7%) | 8 (14.3%) |
| Construction & Extraction | 8 (100.0%) | 0 (0.0%) |
| Installation, Maintenance & Repair | 13 (100.0%) | 0 (0.0%) |
| Total (Category) | 69 (89.6%) | 8 (10.4%) |
| Total (Overall) | 230 (63.2%) | 134 (36.8%) |
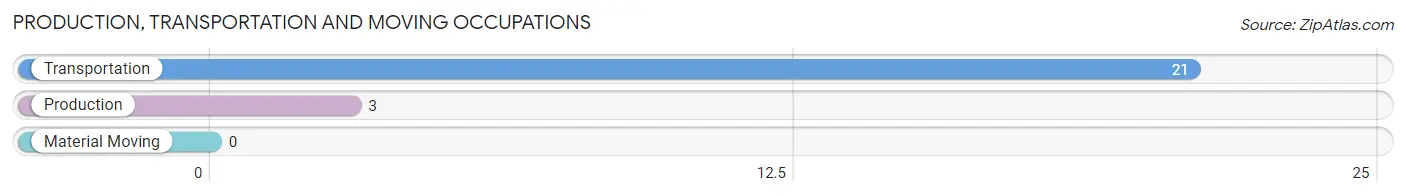
Production, Transportation and Moving Occupations
The most common Production, Transportation and Moving occupations in Treasure County are Transportation (21 | 5.8%), and Production (3 | 0.8%).
Production, Transportation and Moving Occupations by Sex
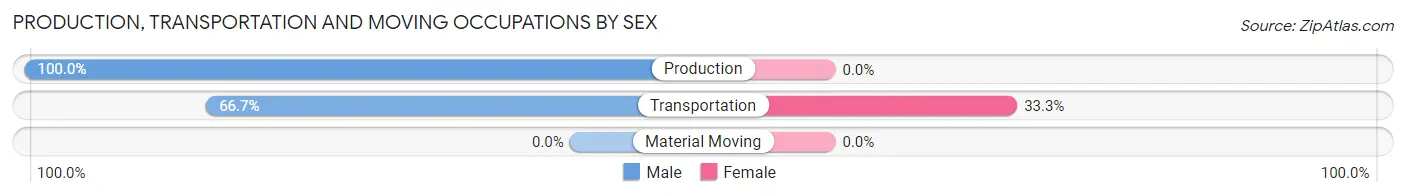
| Occupation | Male | Female |
| Production | 3 (100.0%) | 0 (0.0%) |
| Transportation | 14 (66.7%) | 7 (33.3%) |
| Material Moving | 0 (0.0%) | 0 (0.0%) |
| Total (Category) | 17 (70.8%) | 7 (29.2%) |
| Total (Overall) | 230 (63.2%) | 134 (36.8%) |
Employment Industries by Sex in Treasure County
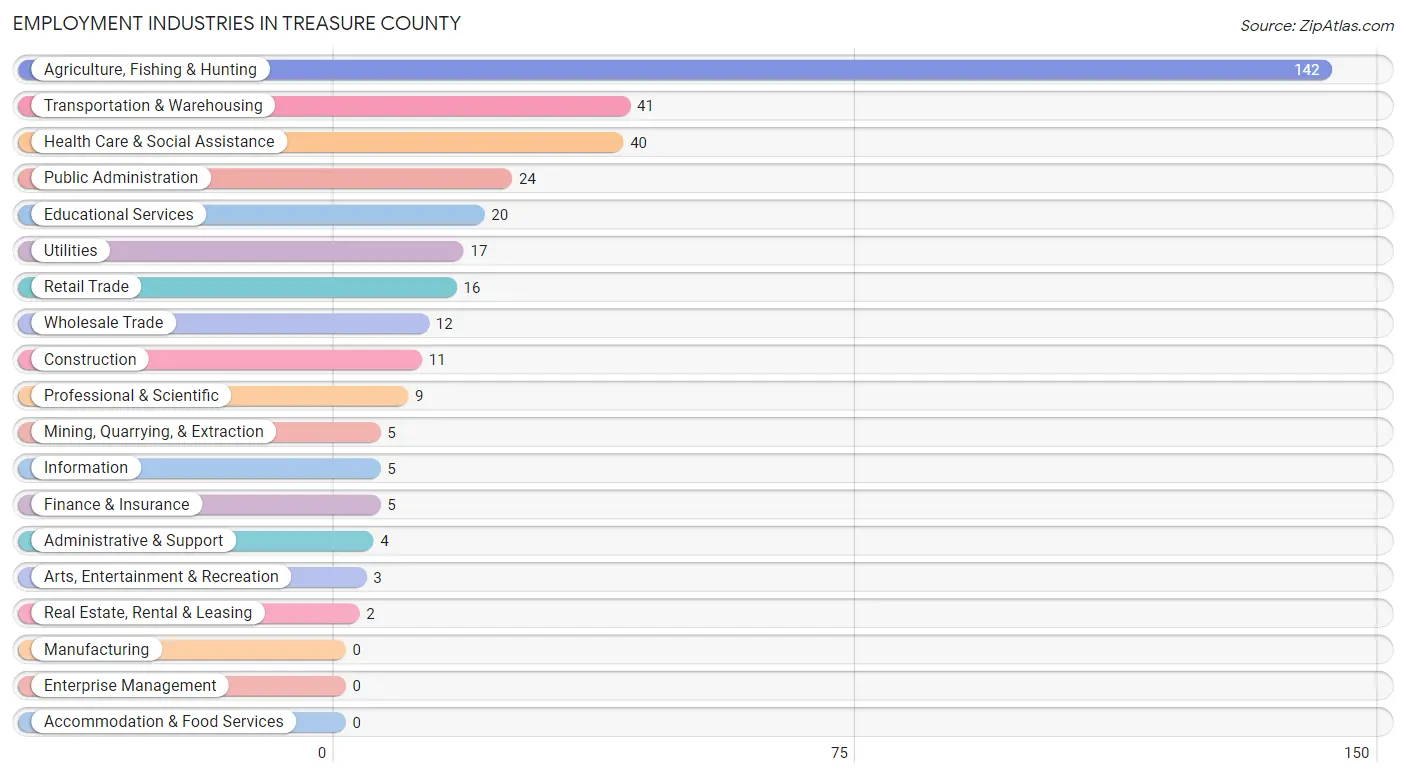
Employment Industries in Treasure County
The major employment industries in Treasure County include Agriculture, Fishing & Hunting (142 | 39.0%), Transportation & Warehousing (41 | 11.3%), Health Care & Social Assistance (40 | 11.0%), Public Administration (24 | 6.6%), and Educational Services (20 | 5.5%).
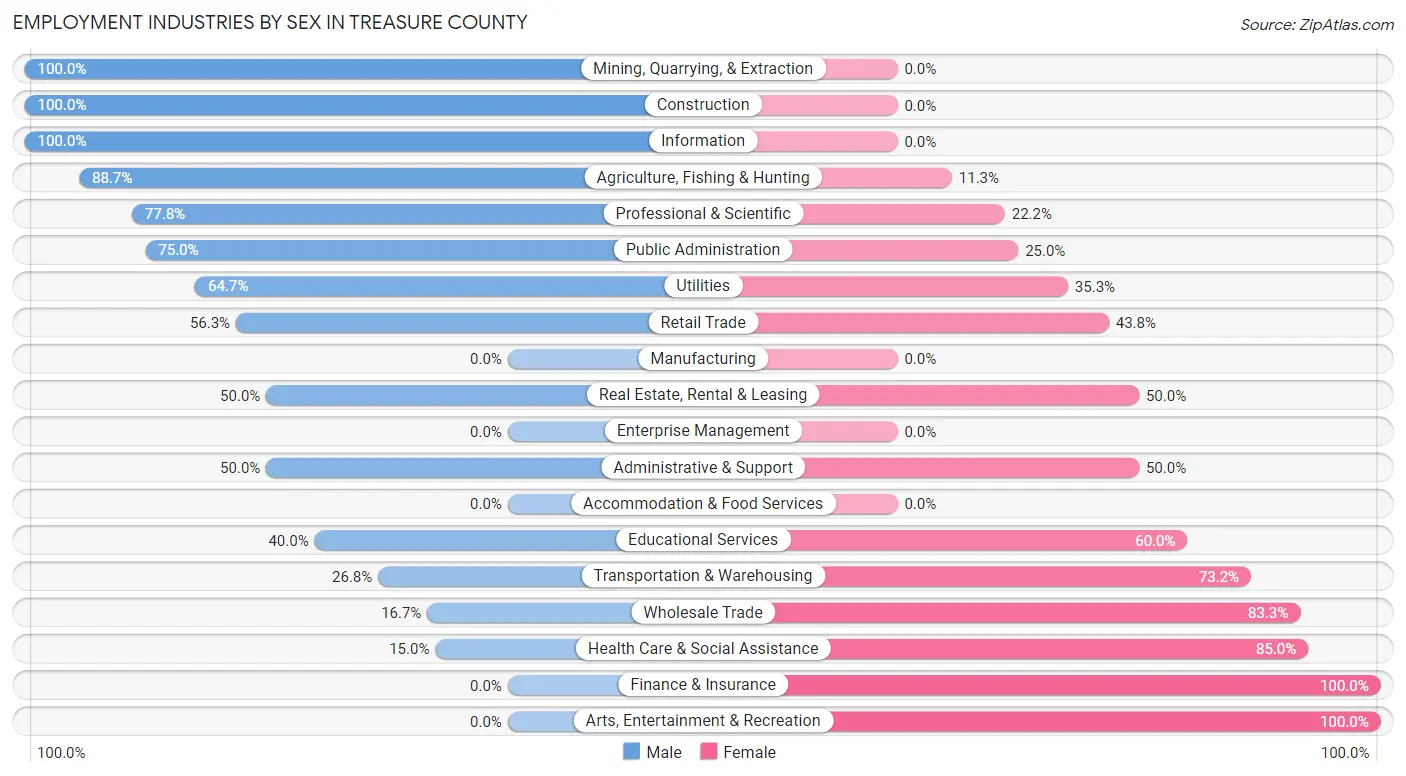
Employment Industries by Sex in Treasure County
The Treasure County industries that see more men than women are Mining, Quarrying, & Extraction (100.0%), Construction (100.0%), and Information (100.0%), whereas the industries that tend to have a higher number of women are Finance & Insurance (100.0%), Arts, Entertainment & Recreation (100.0%), and Health Care & Social Assistance (85.0%).
| Industry | Male | Female |
| Agriculture, Fishing & Hunting | 126 (88.7%) | 16 (11.3%) |
| Mining, Quarrying, & Extraction | 5 (100.0%) | 0 (0.0%) |
| Construction | 11 (100.0%) | 0 (0.0%) |
| Manufacturing | 0 (0.0%) | 0 (0.0%) |
| Wholesale Trade | 2 (16.7%) | 10 (83.3%) |
| Retail Trade | 9 (56.2%) | 7 (43.8%) |
| Transportation & Warehousing | 11 (26.8%) | 30 (73.2%) |
| Utilities | 11 (64.7%) | 6 (35.3%) |
| Information | 5 (100.0%) | 0 (0.0%) |
| Finance & Insurance | 0 (0.0%) | 5 (100.0%) |
| Real Estate, Rental & Leasing | 1 (50.0%) | 1 (50.0%) |
| Professional & Scientific | 7 (77.8%) | 2 (22.2%) |
| Enterprise Management | 0 (0.0%) | 0 (0.0%) |
| Administrative & Support | 2 (50.0%) | 2 (50.0%) |
| Educational Services | 8 (40.0%) | 12 (60.0%) |
| Health Care & Social Assistance | 6 (15.0%) | 34 (85.0%) |
| Arts, Entertainment & Recreation | 0 (0.0%) | 3 (100.0%) |
| Accommodation & Food Services | 0 (0.0%) | 0 (0.0%) |
| Public Administration | 18 (75.0%) | 6 (25.0%) |
| Total | 230 (63.2%) | 134 (36.8%) |
Education in Treasure County
School Enrollment in Treasure County
The most common levels of schooling among the 110 students in Treasure County are elementary school (41 | 37.3%), high school (22 | 20.0%), and middle school (19 | 17.3%).
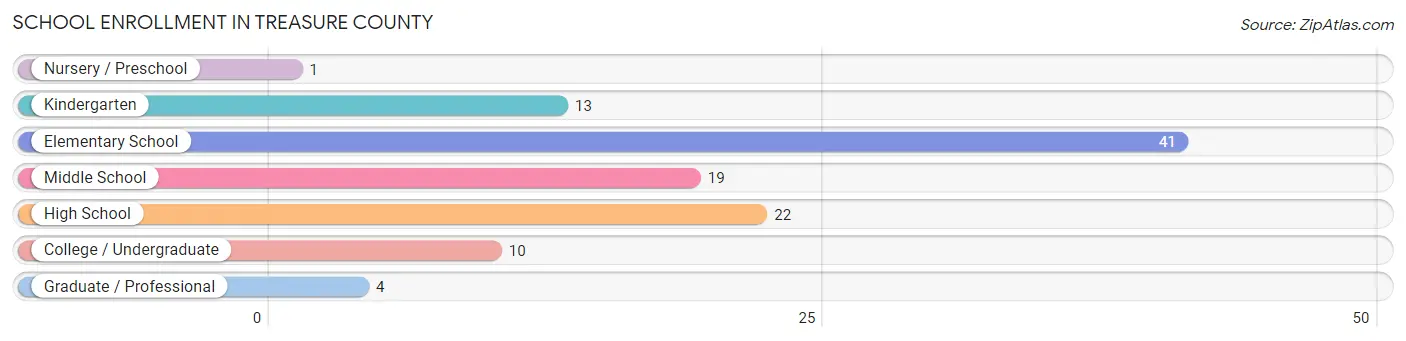
| School Level | # Students | % Students |
| Nursery / Preschool | 1 | 0.9% |
| Kindergarten | 13 | 11.8% |
| Elementary School | 41 | 37.3% |
| Middle School | 19 | 17.3% |
| High School | 22 | 20.0% |
| College / Undergraduate | 10 | 9.1% |
| Graduate / Professional | 4 | 3.6% |
| Total | 110 | 100.0% |
School Enrollment by Age by Funding Source in Treasure County
Out of a total of 110 students who are enrolled in schools in Treasure County, 34 (30.9%) attend a private institution, while the remaining 76 (69.1%) are enrolled in public schools. The age group of 18 to 19 year olds has the highest likelihood of being enrolled in private schools, with 6 (100.0% in the age bracket) enrolled. Conversely, the age group of 3 to 4 year olds has the lowest likelihood of being enrolled in a private school, with 1 (100.0% in the age bracket) attending a public institution.
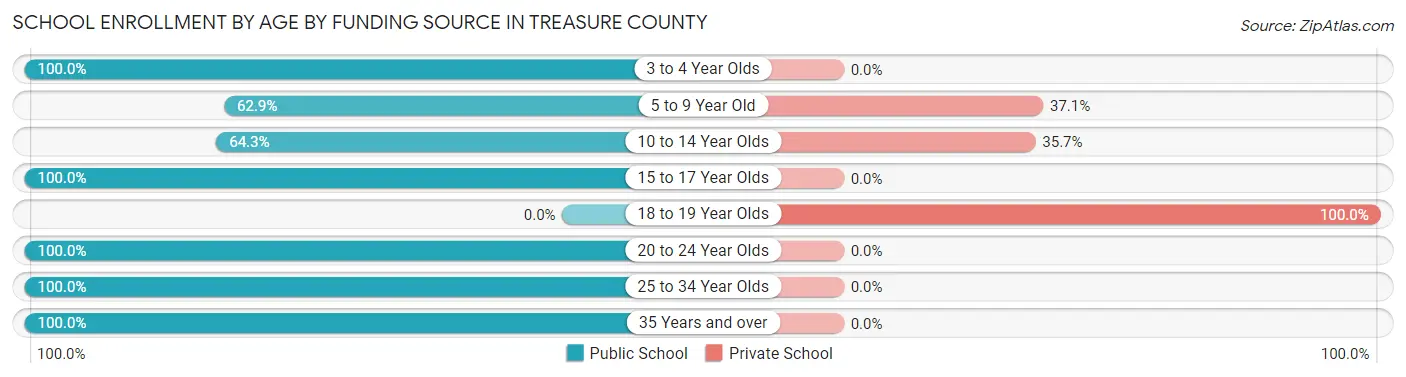
| Age Bracket | Public School | Private School |
| 3 to 4 Year Olds | 1 (100.0%) | 0 (0.0%) |
| 5 to 9 Year Old | 22 (62.9%) | 13 (37.1%) |
| 10 to 14 Year Olds | 27 (64.3%) | 15 (35.7%) |
| 15 to 17 Year Olds | 12 (100.0%) | 0 (0.0%) |
| 18 to 19 Year Olds | 0 (0.0%) | 6 (100.0%) |
| 20 to 24 Year Olds | 4 (100.0%) | 0 (0.0%) |
| 25 to 34 Year Olds | 4 (100.0%) | 0 (0.0%) |
| 35 Years and over | 6 (100.0%) | 0 (0.0%) |
| Total | 76 (69.1%) | 34 (30.9%) |
Educational Attainment by Field of Study in Treasure County
Business (36 | 20.2%), education (36 | 20.2%), computers & mathematics (29 | 16.3%), bio, nature & agricultural (27 | 15.2%), and science & technology (20 | 11.2%) are the most common fields of study among 178 individuals in Treasure County who have obtained a bachelor's degree or higher.
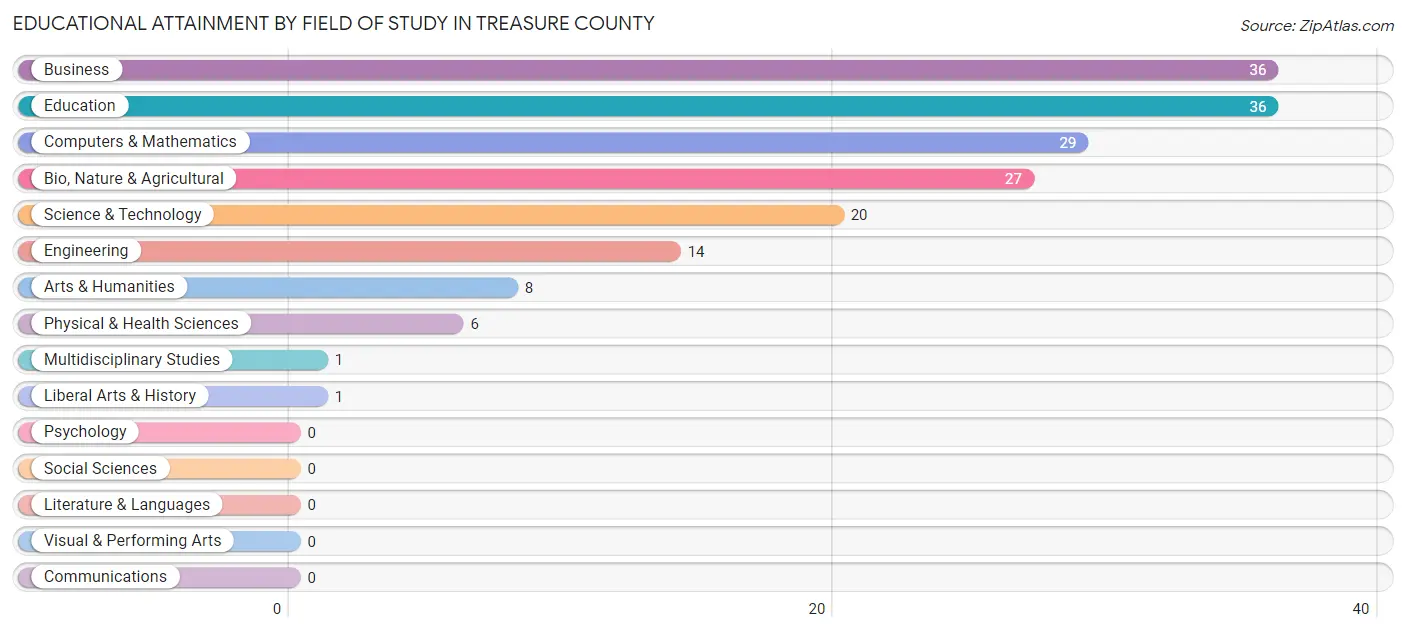
| Field of Study | # Graduates | % Graduates |
| Computers & Mathematics | 29 | 16.3% |
| Bio, Nature & Agricultural | 27 | 15.2% |
| Physical & Health Sciences | 6 | 3.4% |
| Psychology | 0 | 0.0% |
| Social Sciences | 0 | 0.0% |
| Engineering | 14 | 7.9% |
| Multidisciplinary Studies | 1 | 0.6% |
| Science & Technology | 20 | 11.2% |
| Business | 36 | 20.2% |
| Education | 36 | 20.2% |
| Literature & Languages | 0 | 0.0% |
| Liberal Arts & History | 1 | 0.6% |
| Visual & Performing Arts | 0 | 0.0% |
| Communications | 0 | 0.0% |
| Arts & Humanities | 8 | 4.5% |
| Total | 178 | 100.0% |
Transportation & Commute in Treasure County
Vehicle Availability by Sex in Treasure County
The most prevalent vehicle ownership categories in Treasure County are males with 2 vehicles (92, accounting for 40.4%) and females with 2 vehicles (53, making up 69.2%).
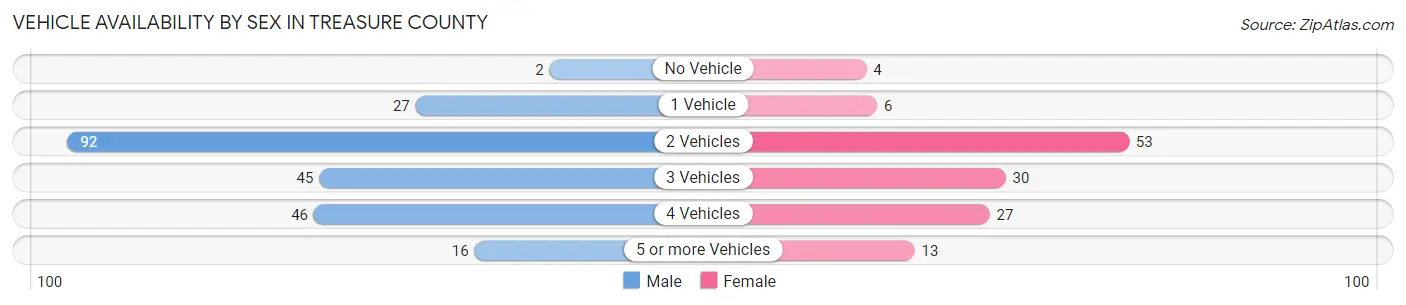
| Vehicles Available | Male | Female |
| No Vehicle | 2 (0.9%) | 4 (3.0%) |
| 1 Vehicle | 27 (11.8%) | 6 (4.5%) |
| 2 Vehicles | 92 (40.4%) | 53 (39.9%) |
| 3 Vehicles | 45 (19.7%) | 30 (22.6%) |
| 4 Vehicles | 46 (20.2%) | 27 (20.3%) |
| 5 or more Vehicles | 16 (7.0%) | 13 (9.8%) |
| Total | 228 (100.0%) | 133 (100.0%) |
Commute Time in Treasure County
The most frequently occuring commute durations in Treasure County are less than 5 minutes (90 commuters, 32.0%), 5 to 9 minutes (76 commuters, 27.1%), and 15 to 19 minutes (26 commuters, 9.2%).
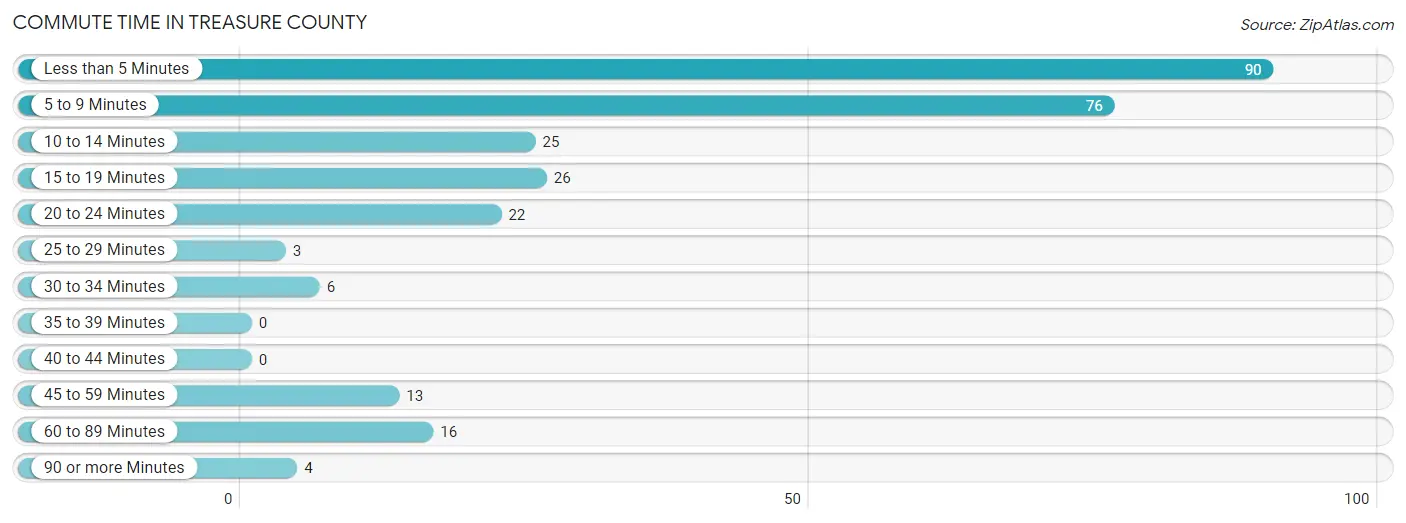
| Commute Time | # Commuters | % Commuters |
| Less than 5 Minutes | 90 | 32.0% |
| 5 to 9 Minutes | 76 | 27.1% |
| 10 to 14 Minutes | 25 | 8.9% |
| 15 to 19 Minutes | 26 | 9.2% |
| 20 to 24 Minutes | 22 | 7.8% |
| 25 to 29 Minutes | 3 | 1.1% |
| 30 to 34 Minutes | 6 | 2.1% |
| 35 to 39 Minutes | 0 | 0.0% |
| 40 to 44 Minutes | 0 | 0.0% |
| 45 to 59 Minutes | 13 | 4.6% |
| 60 to 89 Minutes | 16 | 5.7% |
| 90 or more Minutes | 4 | 1.4% |
Commute Time by Sex in Treasure County
The most common commute times in Treasure County are less than 5 minutes (58 commuters, 31.4%) for males and less than 5 minutes (32 commuters, 33.3%) for females.
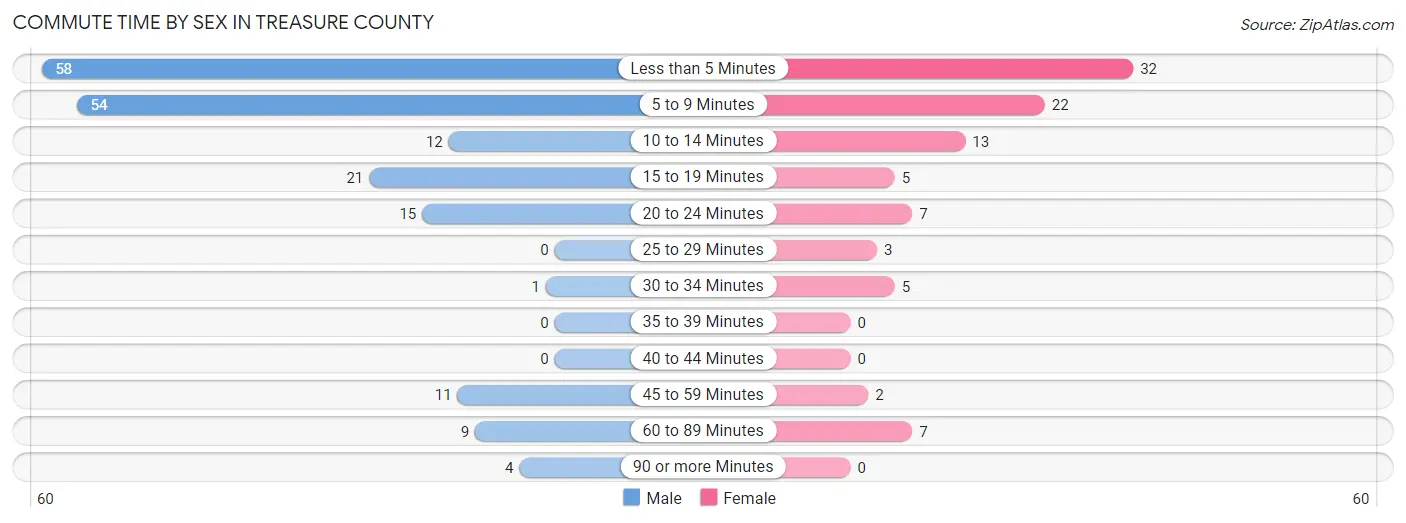
| Commute Time | Male | Female |
| Less than 5 Minutes | 58 (31.4%) | 32 (33.3%) |
| 5 to 9 Minutes | 54 (29.2%) | 22 (22.9%) |
| 10 to 14 Minutes | 12 (6.5%) | 13 (13.5%) |
| 15 to 19 Minutes | 21 (11.4%) | 5 (5.2%) |
| 20 to 24 Minutes | 15 (8.1%) | 7 (7.3%) |
| 25 to 29 Minutes | 0 (0.0%) | 3 (3.1%) |
| 30 to 34 Minutes | 1 (0.5%) | 5 (5.2%) |
| 35 to 39 Minutes | 0 (0.0%) | 0 (0.0%) |
| 40 to 44 Minutes | 0 (0.0%) | 0 (0.0%) |
| 45 to 59 Minutes | 11 (5.9%) | 2 (2.1%) |
| 60 to 89 Minutes | 9 (4.9%) | 7 (7.3%) |
| 90 or more Minutes | 4 (2.2%) | 0 (0.0%) |
Time of Departure to Work by Sex in Treasure County
The most frequent times of departure to work in Treasure County are 6:30 AM to 6:59 AM (73, 39.5%) for males and 7:30 AM to 7:59 AM (38, 39.6%) for females.
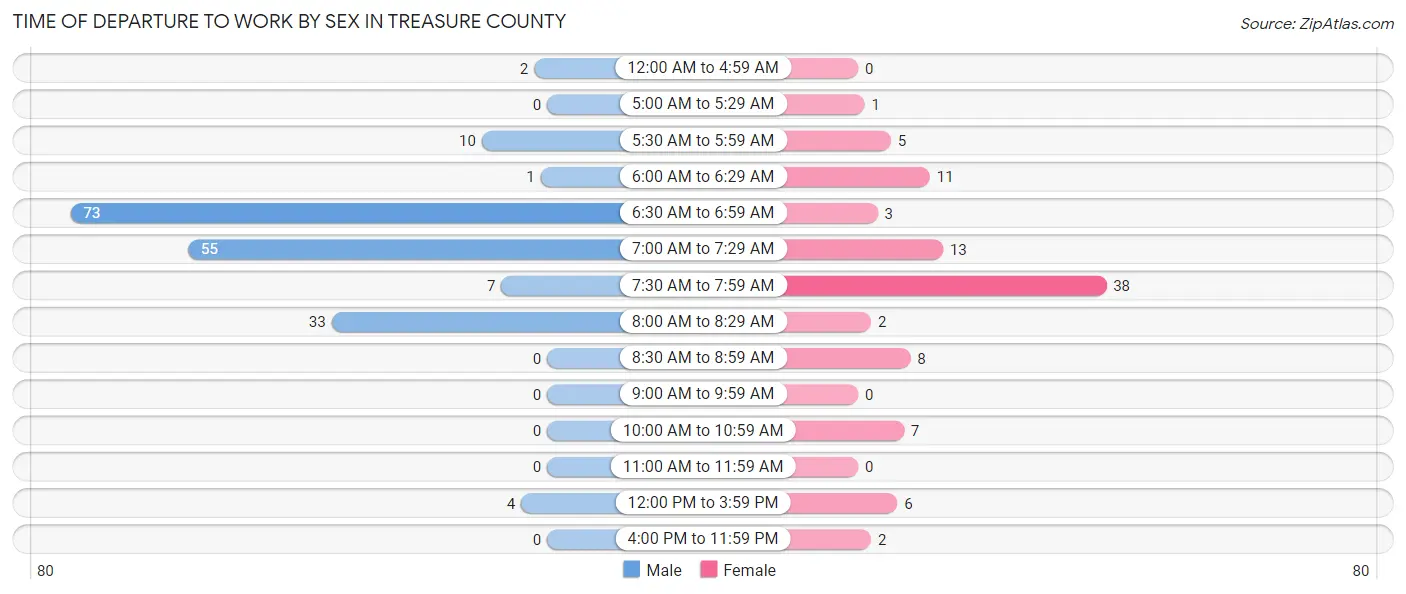
| Time of Departure | Male | Female |
| 12:00 AM to 4:59 AM | 2 (1.1%) | 0 (0.0%) |
| 5:00 AM to 5:29 AM | 0 (0.0%) | 1 (1.0%) |
| 5:30 AM to 5:59 AM | 10 (5.4%) | 5 (5.2%) |
| 6:00 AM to 6:29 AM | 1 (0.5%) | 11 (11.5%) |
| 6:30 AM to 6:59 AM | 73 (39.5%) | 3 (3.1%) |
| 7:00 AM to 7:29 AM | 55 (29.7%) | 13 (13.5%) |
| 7:30 AM to 7:59 AM | 7 (3.8%) | 38 (39.6%) |
| 8:00 AM to 8:29 AM | 33 (17.8%) | 2 (2.1%) |
| 8:30 AM to 8:59 AM | 0 (0.0%) | 8 (8.3%) |
| 9:00 AM to 9:59 AM | 0 (0.0%) | 0 (0.0%) |
| 10:00 AM to 10:59 AM | 0 (0.0%) | 7 (7.3%) |
| 11:00 AM to 11:59 AM | 0 (0.0%) | 0 (0.0%) |
| 12:00 PM to 3:59 PM | 4 (2.2%) | 6 (6.2%) |
| 4:00 PM to 11:59 PM | 0 (0.0%) | 2 (2.1%) |
| Total | 185 (100.0%) | 96 (100.0%) |
Housing Occupancy in Treasure County
Occupancy by Ownership in Treasure County
Of the total 333 dwellings in Treasure County, owner-occupied units account for 227 (68.2%), while renter-occupied units make up 106 (31.8%).
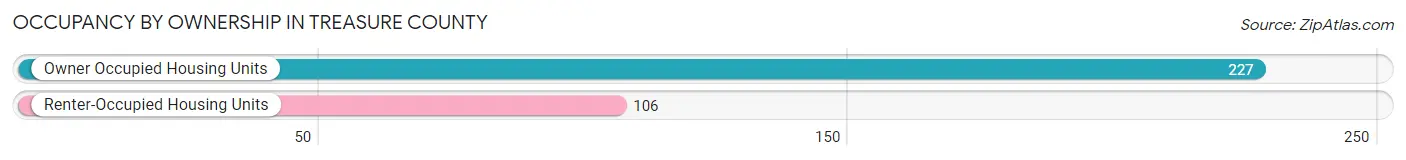
| Occupancy | # Housing Units | % Housing Units |
| Owner Occupied Housing Units | 227 | 68.2% |
| Renter-Occupied Housing Units | 106 | 31.8% |
| Total Occupied Housing Units | 333 | 100.0% |
Occupancy by Household Size in Treasure County
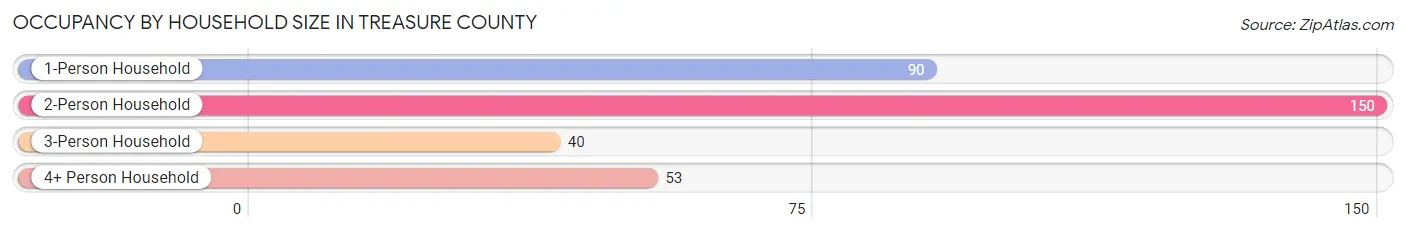
| Household Size | # Housing Units | % Housing Units |
| 1-Person Household | 90 | 27.0% |
| 2-Person Household | 150 | 45.1% |
| 3-Person Household | 40 | 12.0% |
| 4+ Person Household | 53 | 15.9% |
| Total Housing Units | 333 | 100.0% |
Occupancy by Ownership by Household Size in Treasure County
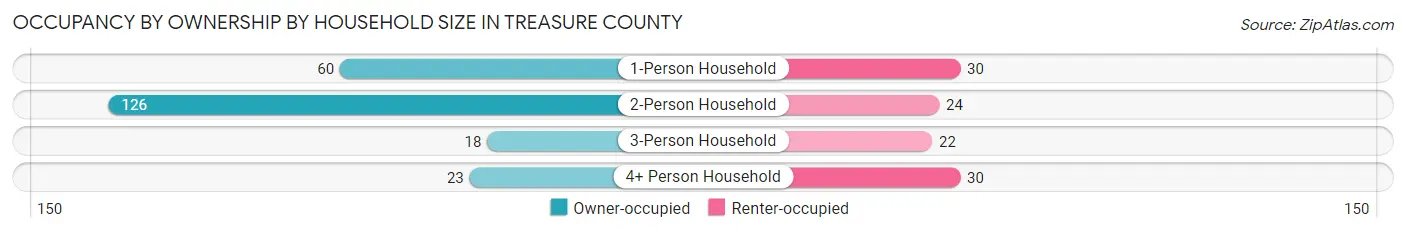
| Household Size | Owner-occupied | Renter-occupied |
| 1-Person Household | 60 (66.7%) | 30 (33.3%) |
| 2-Person Household | 126 (84.0%) | 24 (16.0%) |
| 3-Person Household | 18 (45.0%) | 22 (55.0%) |
| 4+ Person Household | 23 (43.4%) | 30 (56.6%) |
| Total Housing Units | 227 (68.2%) | 106 (31.8%) |
Occupancy by Educational Attainment in Treasure County
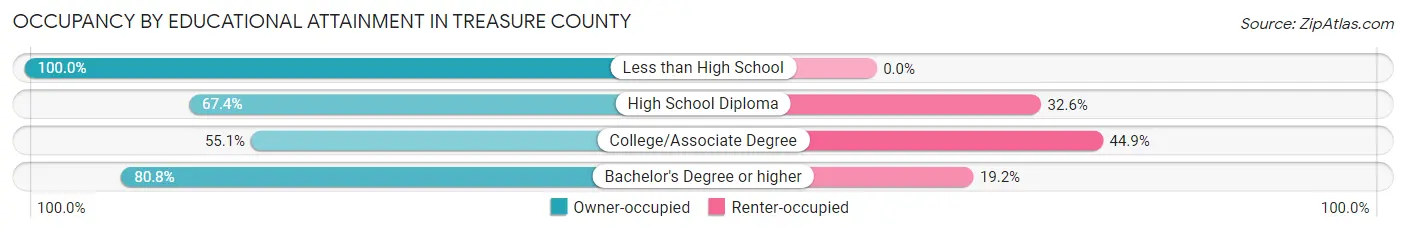
| Household Size | Owner-occupied | Renter-occupied |
| Less than High School | 15 (100.0%) | 0 (0.0%) |
| High School Diploma | 62 (67.4%) | 30 (32.6%) |
| College/Associate Degree | 70 (55.1%) | 57 (44.9%) |
| Bachelor's Degree or higher | 80 (80.8%) | 19 (19.2%) |
Occupancy by Age of Householder in Treasure County
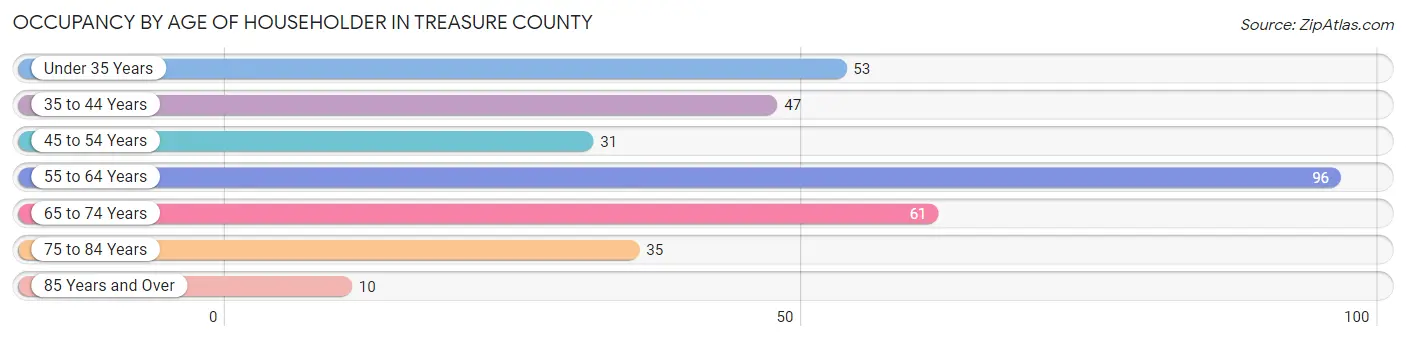
| Age Bracket | # Households | % Households |
| Under 35 Years | 53 | 15.9% |
| 35 to 44 Years | 47 | 14.1% |
| 45 to 54 Years | 31 | 9.3% |
| 55 to 64 Years | 96 | 28.8% |
| 65 to 74 Years | 61 | 18.3% |
| 75 to 84 Years | 35 | 10.5% |
| 85 Years and Over | 10 | 3.0% |
| Total | 333 | 100.0% |
Housing Finances in Treasure County
Median Income by Occupancy in Treasure County
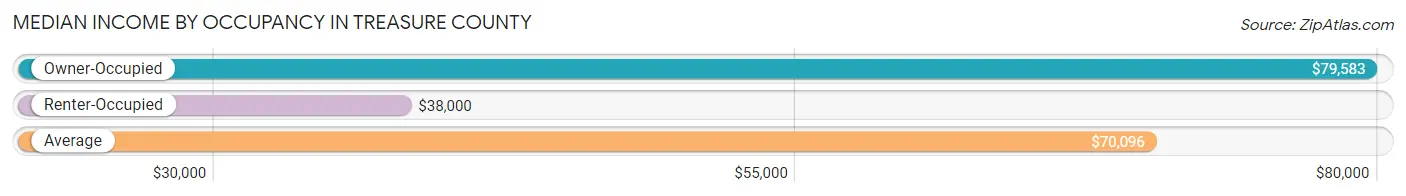
| Occupancy Type | # Households | Median Income |
| Owner-Occupied | 227 (68.2%) | $79,583 |
| Renter-Occupied | 106 (31.8%) | $38,000 |
| Average | 333 (100.0%) | $70,096 |
Occupancy by Householder Income Bracket in Treasure County
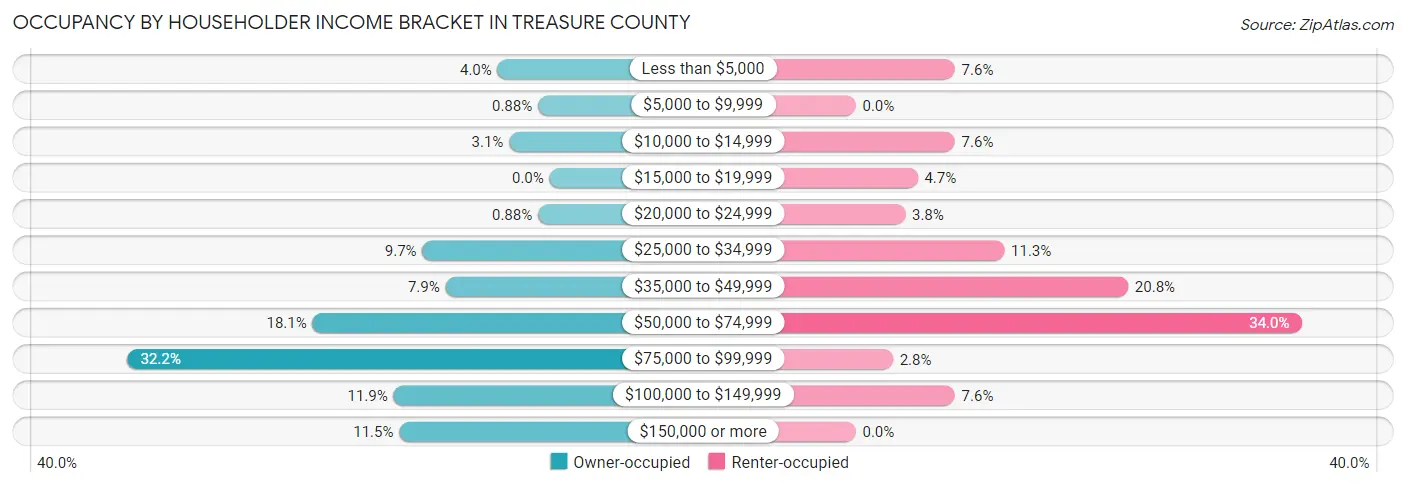
| Income Bracket | Owner-occupied | Renter-occupied |
| Less than $5,000 | 9 (4.0%) | 8 (7.5%) |
| $5,000 to $9,999 | 2 (0.9%) | 0 (0.0%) |
| $10,000 to $14,999 | 7 (3.1%) | 8 (7.5%) |
| $15,000 to $19,999 | 0 (0.0%) | 5 (4.7%) |
| $20,000 to $24,999 | 2 (0.9%) | 4 (3.8%) |
| $25,000 to $34,999 | 22 (9.7%) | 12 (11.3%) |
| $35,000 to $49,999 | 18 (7.9%) | 22 (20.7%) |
| $50,000 to $74,999 | 41 (18.1%) | 36 (34.0%) |
| $75,000 to $99,999 | 73 (32.2%) | 3 (2.8%) |
| $100,000 to $149,999 | 27 (11.9%) | 8 (7.5%) |
| $150,000 or more | 26 (11.5%) | 0 (0.0%) |
| Total | 227 (100.0%) | 106 (100.0%) |
Monthly Housing Cost Tiers in Treasure County
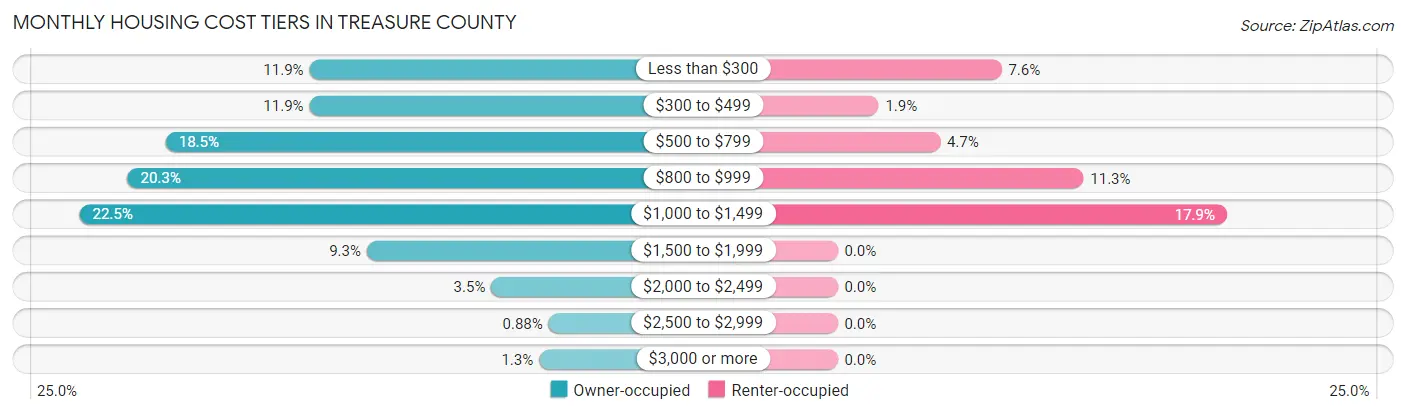
| Monthly Cost | Owner-occupied | Renter-occupied |
| Less than $300 | 27 (11.9%) | 8 (7.5%) |
| $300 to $499 | 27 (11.9%) | 2 (1.9%) |
| $500 to $799 | 42 (18.5%) | 5 (4.7%) |
| $800 to $999 | 46 (20.3%) | 12 (11.3%) |
| $1,000 to $1,499 | 51 (22.5%) | 19 (17.9%) |
| $1,500 to $1,999 | 21 (9.2%) | 0 (0.0%) |
| $2,000 to $2,499 | 8 (3.5%) | 0 (0.0%) |
| $2,500 to $2,999 | 2 (0.9%) | 0 (0.0%) |
| $3,000 or more | 3 (1.3%) | 0 (0.0%) |
| Total | 227 (100.0%) | 106 (100.0%) |
Physical Housing Characteristics in Treasure County
Housing Structures in Treasure County
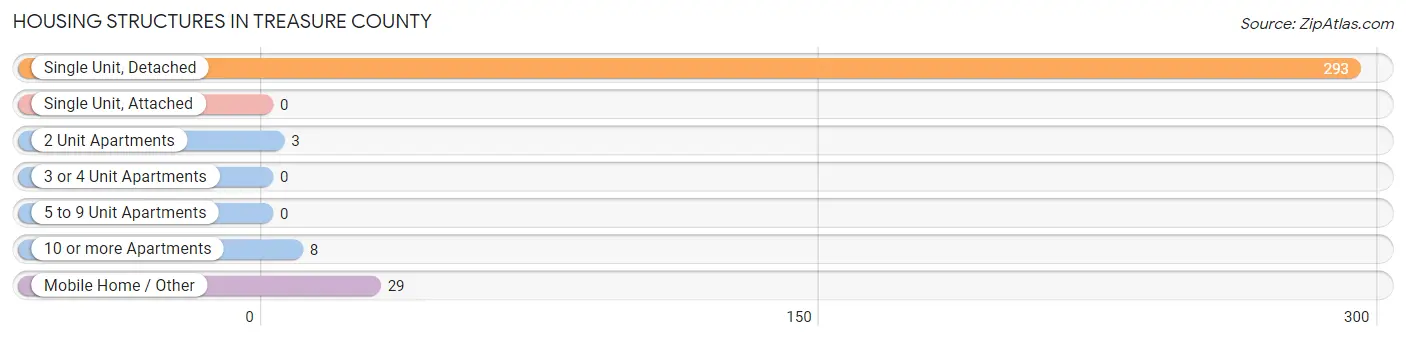
| Structure Type | # Housing Units | % Housing Units |
| Single Unit, Detached | 293 | 88.0% |
| Single Unit, Attached | 0 | 0.0% |
| 2 Unit Apartments | 3 | 0.9% |
| 3 or 4 Unit Apartments | 0 | 0.0% |
| 5 to 9 Unit Apartments | 0 | 0.0% |
| 10 or more Apartments | 8 | 2.4% |
| Mobile Home / Other | 29 | 8.7% |
| Total | 333 | 100.0% |
Housing Structures by Occupancy in Treasure County
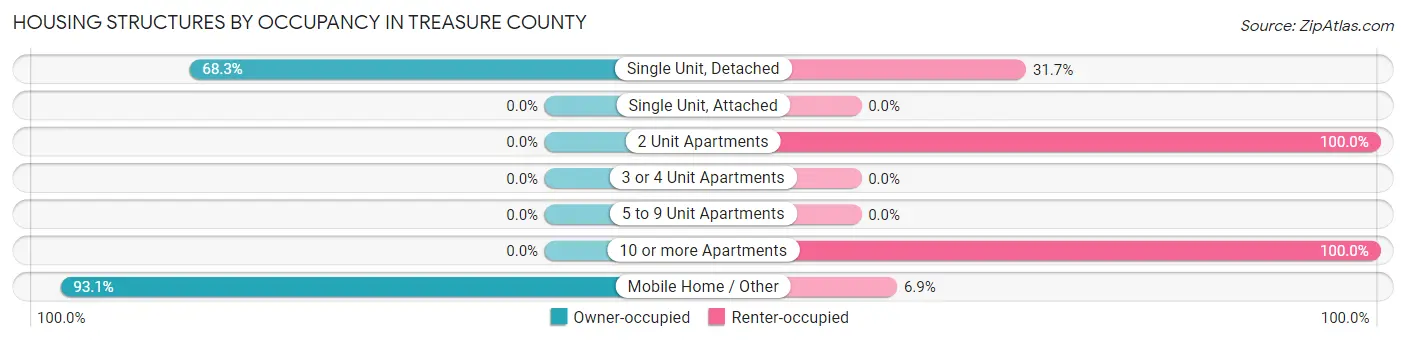
| Structure Type | Owner-occupied | Renter-occupied |
| Single Unit, Detached | 200 (68.3%) | 93 (31.7%) |
| Single Unit, Attached | 0 (0.0%) | 0 (0.0%) |
| 2 Unit Apartments | 0 (0.0%) | 3 (100.0%) |
| 3 or 4 Unit Apartments | 0 (0.0%) | 0 (0.0%) |
| 5 to 9 Unit Apartments | 0 (0.0%) | 0 (0.0%) |
| 10 or more Apartments | 0 (0.0%) | 8 (100.0%) |
| Mobile Home / Other | 27 (93.1%) | 2 (6.9%) |
| Total | 227 (68.2%) | 106 (31.8%) |
Housing Structures by Number of Rooms in Treasure County
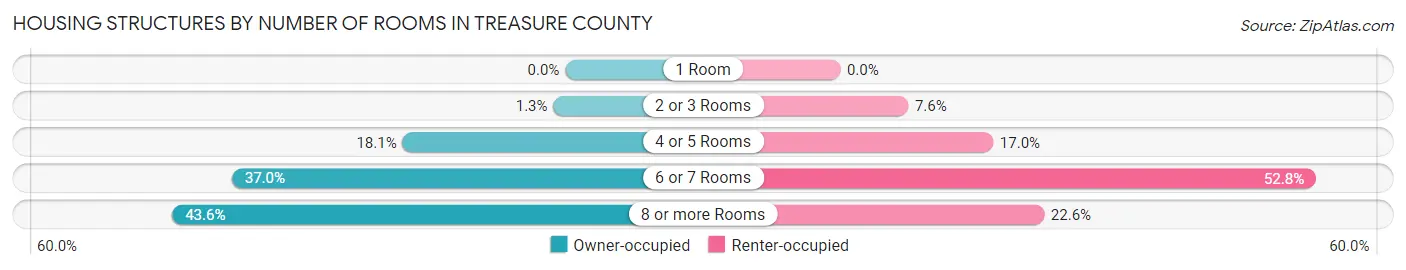
| Number of Rooms | Owner-occupied | Renter-occupied |
| 1 Room | 0 (0.0%) | 0 (0.0%) |
| 2 or 3 Rooms | 3 (1.3%) | 8 (7.5%) |
| 4 or 5 Rooms | 41 (18.1%) | 18 (17.0%) |
| 6 or 7 Rooms | 84 (37.0%) | 56 (52.8%) |
| 8 or more Rooms | 99 (43.6%) | 24 (22.6%) |
| Total | 227 (100.0%) | 106 (100.0%) |
Housing Structure by Heating Type in Treasure County
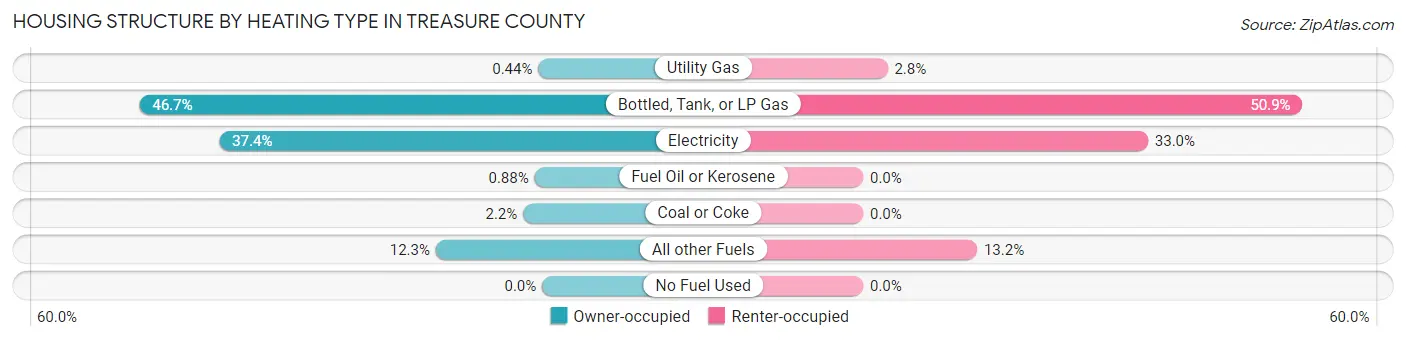
| Heating Type | Owner-occupied | Renter-occupied |
| Utility Gas | 1 (0.4%) | 3 (2.8%) |
| Bottled, Tank, or LP Gas | 106 (46.7%) | 54 (50.9%) |
| Electricity | 85 (37.4%) | 35 (33.0%) |
| Fuel Oil or Kerosene | 2 (0.9%) | 0 (0.0%) |
| Coal or Coke | 5 (2.2%) | 0 (0.0%) |
| All other Fuels | 28 (12.3%) | 14 (13.2%) |
| No Fuel Used | 0 (0.0%) | 0 (0.0%) |
| Total | 227 (100.0%) | 106 (100.0%) |
Household Vehicle Usage in Treasure County
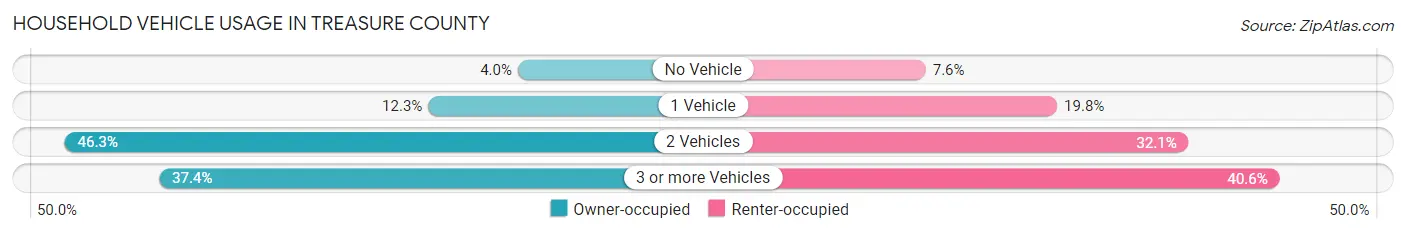
| Vehicles per Household | Owner-occupied | Renter-occupied |
| No Vehicle | 9 (4.0%) | 8 (7.5%) |
| 1 Vehicle | 28 (12.3%) | 21 (19.8%) |
| 2 Vehicles | 105 (46.3%) | 34 (32.1%) |
| 3 or more Vehicles | 85 (37.4%) | 43 (40.6%) |
| Total | 227 (100.0%) | 106 (100.0%) |
Real Estate & Mortgages in Treasure County
Real Estate and Mortgage Overview in Treasure County
| Characteristic | Without Mortgage | With Mortgage |
| Housing Units | 154 | 73 |
| Median Property Value | $212,500 | $205,800 |
| Median Household Income | $78,889 | $11 |
| Monthly Housing Costs | $658 | $0 |
| Real Estate Taxes | $1,217 | $4 |
Property Value by Mortgage Status in Treasure County
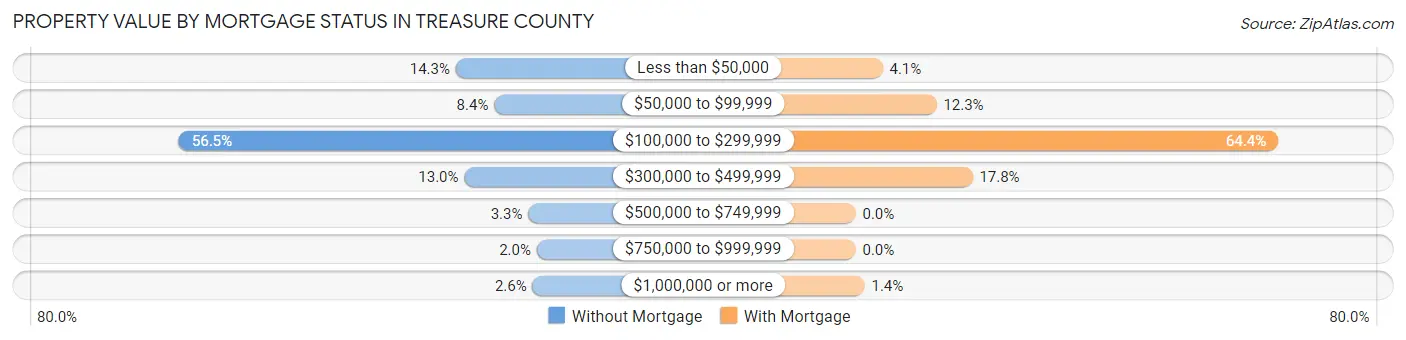
| Property Value | Without Mortgage | With Mortgage |
| Less than $50,000 | 22 (14.3%) | 3 (4.1%) |
| $50,000 to $99,999 | 13 (8.4%) | 9 (12.3%) |
| $100,000 to $299,999 | 87 (56.5%) | 47 (64.4%) |
| $300,000 to $499,999 | 20 (13.0%) | 13 (17.8%) |
| $500,000 to $749,999 | 5 (3.3%) | 0 (0.0%) |
| $750,000 to $999,999 | 3 (1.9%) | 0 (0.0%) |
| $1,000,000 or more | 4 (2.6%) | 1 (1.4%) |
| Total | 154 (100.0%) | 73 (100.0%) |
Household Income by Mortgage Status in Treasure County
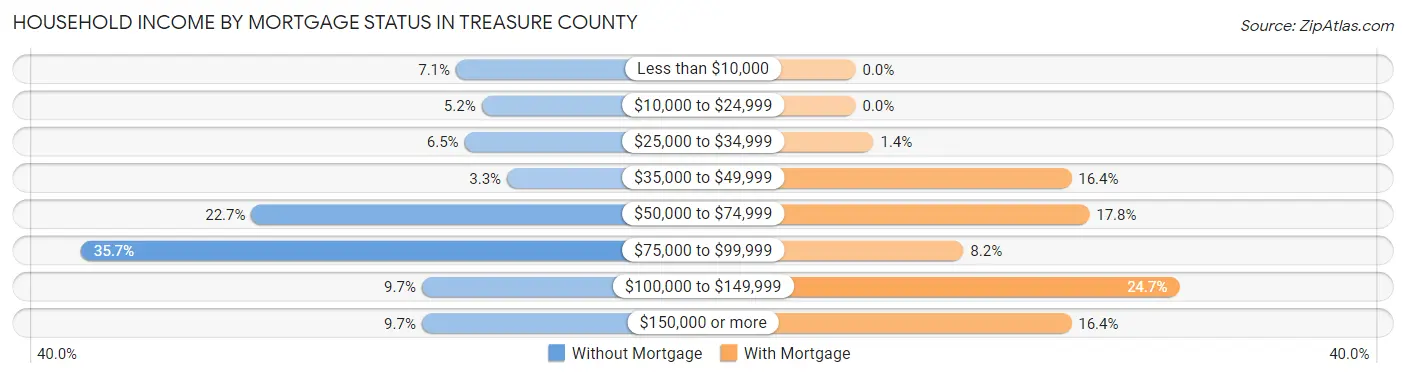
| Household Income | Without Mortgage | With Mortgage |
| Less than $10,000 | 11 (7.1%) | 0 (0.0%) |
| $10,000 to $24,999 | 8 (5.2%) | 0 (0.0%) |
| $25,000 to $34,999 | 10 (6.5%) | 1 (1.4%) |
| $35,000 to $49,999 | 5 (3.3%) | 12 (16.4%) |
| $50,000 to $74,999 | 35 (22.7%) | 13 (17.8%) |
| $75,000 to $99,999 | 55 (35.7%) | 6 (8.2%) |
| $100,000 to $149,999 | 15 (9.7%) | 18 (24.7%) |
| $150,000 or more | 15 (9.7%) | 12 (16.4%) |
| Total | 154 (100.0%) | 73 (100.0%) |
Property Value to Household Income Ratio in Treasure County
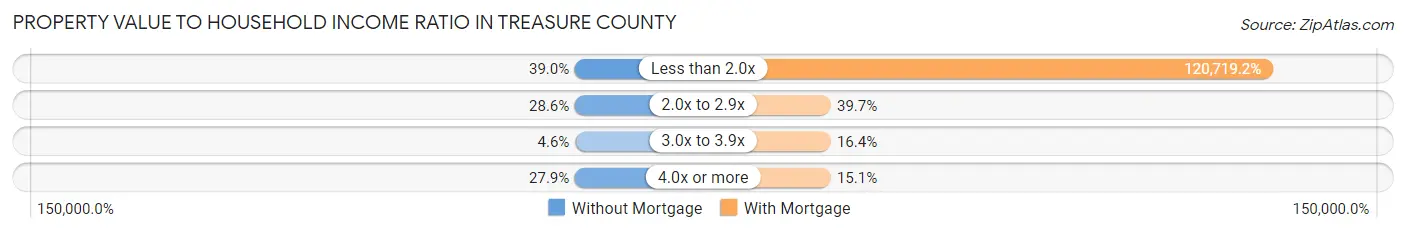
| Value-to-Income Ratio | Without Mortgage | With Mortgage |
| Less than 2.0x | 60 (39.0%) | 88,125 (120,719.2%) |
| 2.0x to 2.9x | 44 (28.6%) | 29 (39.7%) |
| 3.0x to 3.9x | 7 (4.5%) | 12 (16.4%) |
| 4.0x or more | 43 (27.9%) | 11 (15.1%) |
| Total | 154 (100.0%) | 73 (100.0%) |
Real Estate Taxes by Mortgage Status in Treasure County
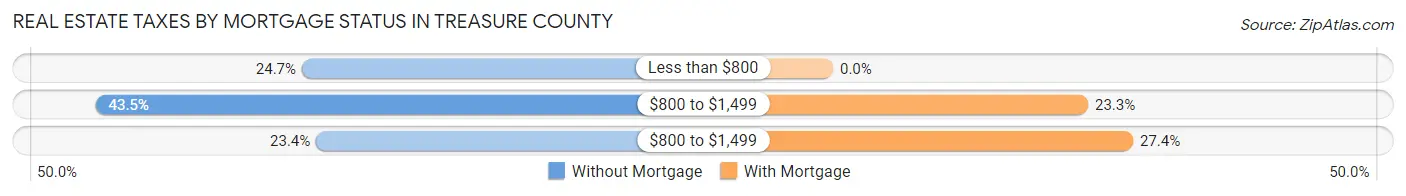
| Property Taxes | Without Mortgage | With Mortgage |
| Less than $800 | 38 (24.7%) | 0 (0.0%) |
| $800 to $1,499 | 67 (43.5%) | 17 (23.3%) |
| $800 to $1,499 | 36 (23.4%) | 20 (27.4%) |
| Total | 154 (100.0%) | 73 (100.0%) |
Health & Disability in Treasure County
Health Insurance Coverage by Age in Treasure County
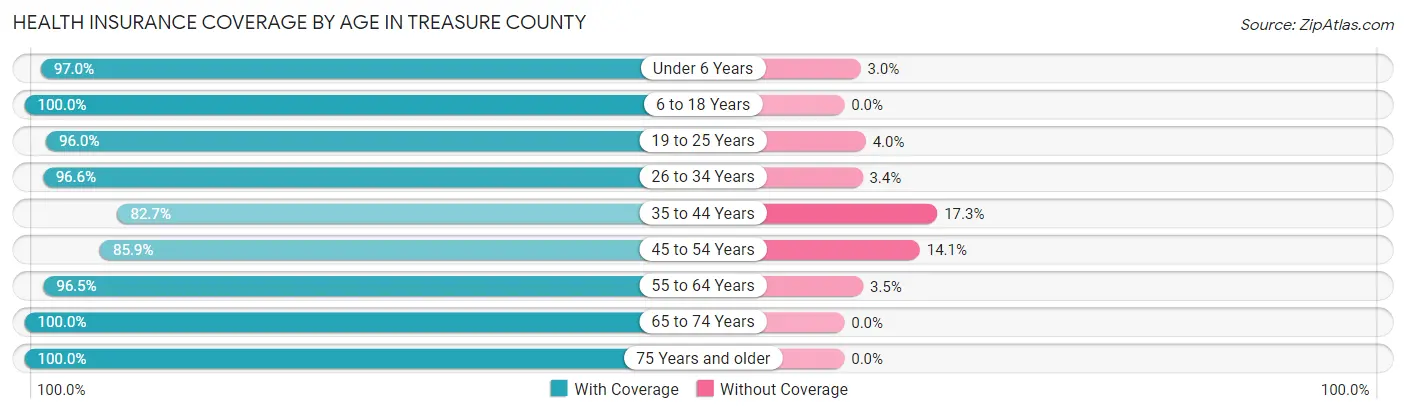
| Age Bracket | With Coverage | Without Coverage |
| Under 6 Years | 32 (97.0%) | 1 (3.0%) |
| 6 to 18 Years | 93 (100.0%) | 0 (0.0%) |
| 19 to 25 Years | 24 (96.0%) | 1 (4.0%) |
| 26 to 34 Years | 57 (96.6%) | 2 (3.4%) |
| 35 to 44 Years | 62 (82.7%) | 13 (17.3%) |
| 45 to 54 Years | 61 (85.9%) | 10 (14.1%) |
| 55 to 64 Years | 166 (96.5%) | 6 (3.5%) |
| 65 to 74 Years | 88 (100.0%) | 0 (0.0%) |
| 75 Years and older | 64 (100.0%) | 0 (0.0%) |
| Total | 647 (95.2%) | 33 (4.9%) |
Health Insurance Coverage by Citizenship Status in Treasure County
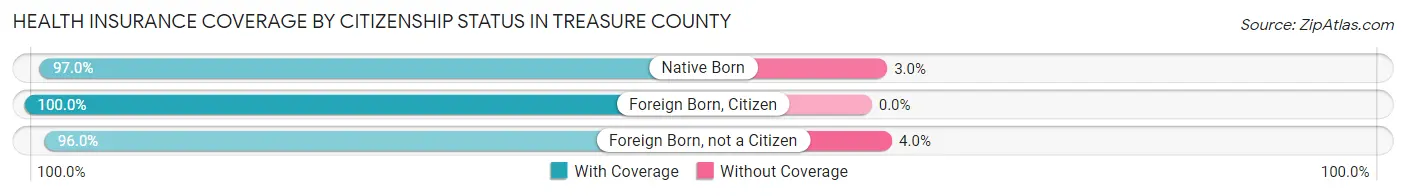
| Citizenship Status | With Coverage | Without Coverage |
| Native Born | 32 (97.0%) | 1 (3.0%) |
| Foreign Born, Citizen | 93 (100.0%) | 0 (0.0%) |
| Foreign Born, not a Citizen | 24 (96.0%) | 1 (4.0%) |
Health Insurance Coverage by Household Income in Treasure County
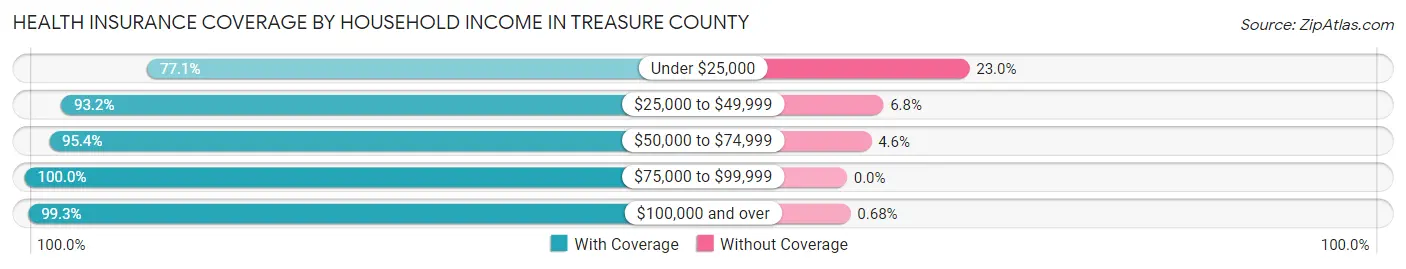
| Household Income | With Coverage | Without Coverage |
| Under $25,000 | 47 (77.0%) | 14 (23.0%) |
| $25,000 to $49,999 | 150 (93.2%) | 11 (6.8%) |
| $50,000 to $74,999 | 146 (95.4%) | 7 (4.6%) |
| $75,000 to $99,999 | 159 (100.0%) | 0 (0.0%) |
| $100,000 and over | 145 (99.3%) | 1 (0.7%) |
Public vs Private Health Insurance Coverage by Age in Treasure County
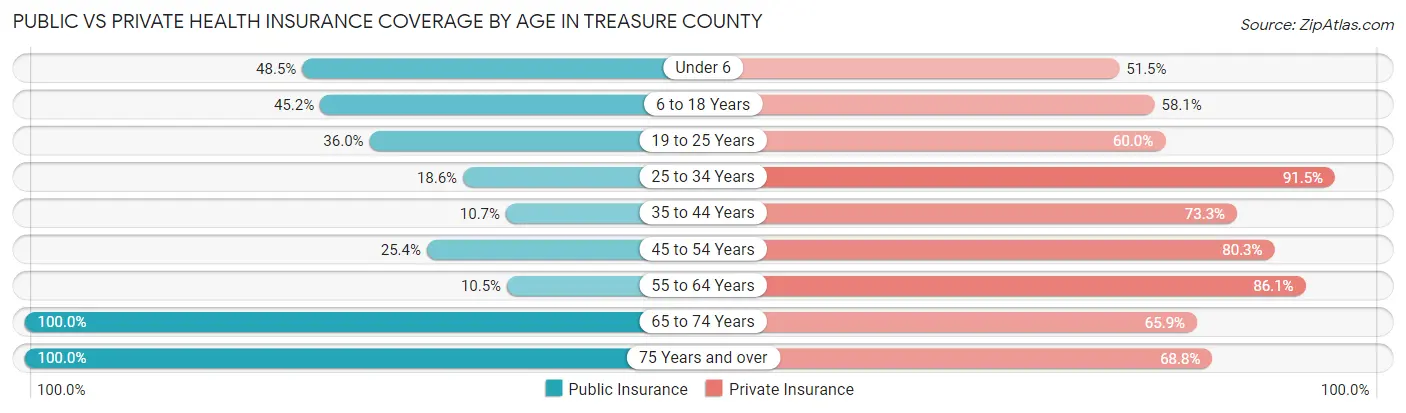
| Age Bracket | Public Insurance | Private Insurance |
| Under 6 | 16 (48.5%) | 17 (51.5%) |
| 6 to 18 Years | 42 (45.2%) | 54 (58.1%) |
| 19 to 25 Years | 9 (36.0%) | 15 (60.0%) |
| 25 to 34 Years | 11 (18.6%) | 54 (91.5%) |
| 35 to 44 Years | 8 (10.7%) | 55 (73.3%) |
| 45 to 54 Years | 18 (25.4%) | 57 (80.3%) |
| 55 to 64 Years | 18 (10.5%) | 148 (86.1%) |
| 65 to 74 Years | 88 (100.0%) | 58 (65.9%) |
| 75 Years and over | 64 (100.0%) | 44 (68.8%) |
| Total | 274 (40.3%) | 502 (73.8%) |
Disability Status by Sex by Age in Treasure County
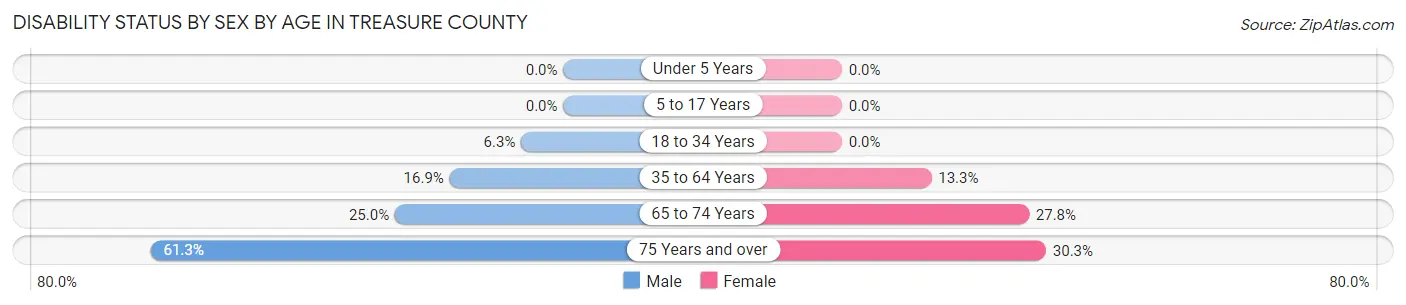
| Age Bracket | Male | Female |
| Under 5 Years | 0 (0.0%) | 0 (0.0%) |
| 5 to 17 Years | 0 (0.0%) | 0 (0.0%) |
| 18 to 34 Years | 4 (6.2%) | 0 (0.0%) |
| 35 to 64 Years | 27 (16.9%) | 21 (13.3%) |
| 65 to 74 Years | 13 (25.0%) | 10 (27.8%) |
| 75 Years and over | 19 (61.3%) | 10 (30.3%) |
Disability Class by Sex by Age in Treasure County
Disability Class: Hearing Difficulty
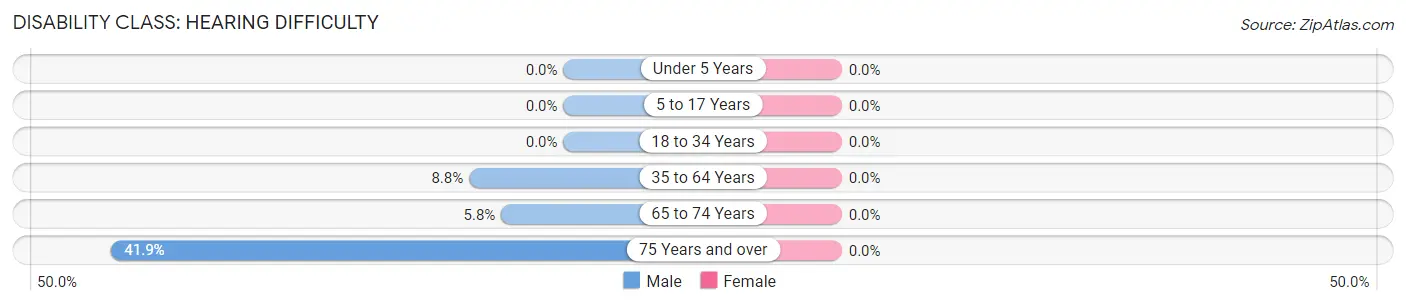
| Age Bracket | Male | Female |
| Under 5 Years | 0 (0.0%) | 0 (0.0%) |
| 5 to 17 Years | 0 (0.0%) | 0 (0.0%) |
| 18 to 34 Years | 0 (0.0%) | 0 (0.0%) |
| 35 to 64 Years | 14 (8.7%) | 0 (0.0%) |
| 65 to 74 Years | 3 (5.8%) | 0 (0.0%) |
| 75 Years and over | 13 (41.9%) | 0 (0.0%) |
Disability Class: Vision Difficulty
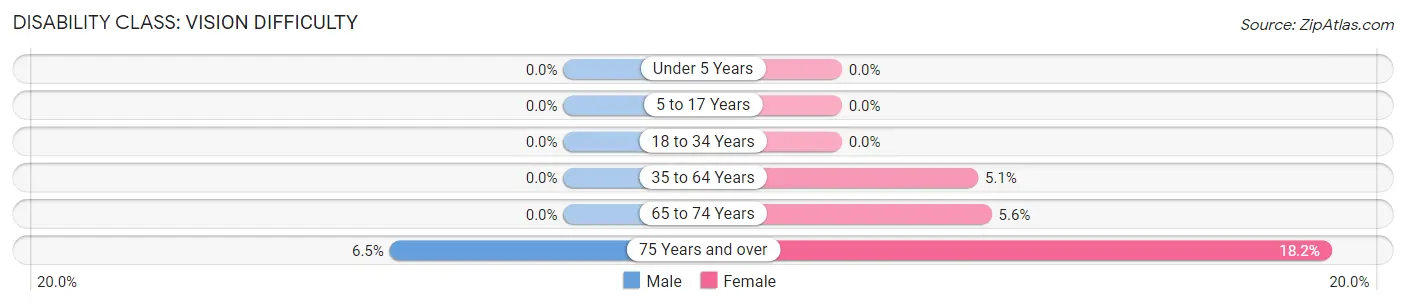
| Age Bracket | Male | Female |
| Under 5 Years | 0 (0.0%) | 0 (0.0%) |
| 5 to 17 Years | 0 (0.0%) | 0 (0.0%) |
| 18 to 34 Years | 0 (0.0%) | 0 (0.0%) |
| 35 to 64 Years | 0 (0.0%) | 8 (5.1%) |
| 65 to 74 Years | 0 (0.0%) | 2 (5.6%) |
| 75 Years and over | 2 (6.5%) | 6 (18.2%) |
Disability Class: Cognitive Difficulty
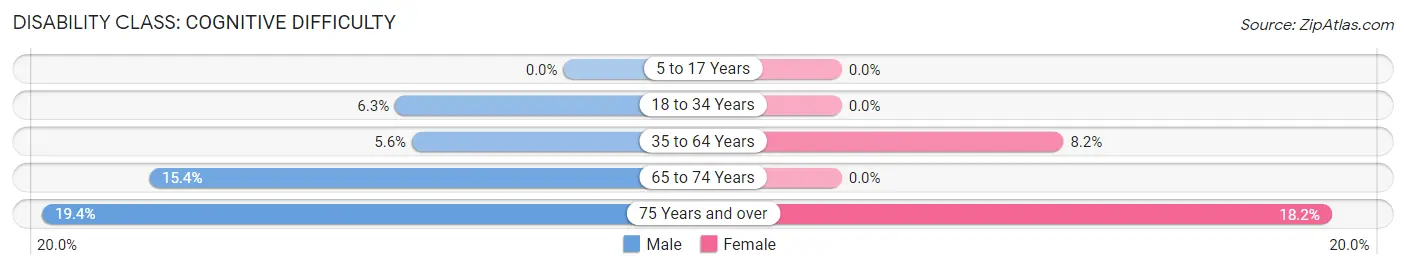
| Age Bracket | Male | Female |
| 5 to 17 Years | 0 (0.0%) | 0 (0.0%) |
| 18 to 34 Years | 4 (6.2%) | 0 (0.0%) |
| 35 to 64 Years | 9 (5.6%) | 13 (8.2%) |
| 65 to 74 Years | 8 (15.4%) | 0 (0.0%) |
| 75 Years and over | 6 (19.4%) | 6 (18.2%) |
Disability Class: Ambulatory Difficulty
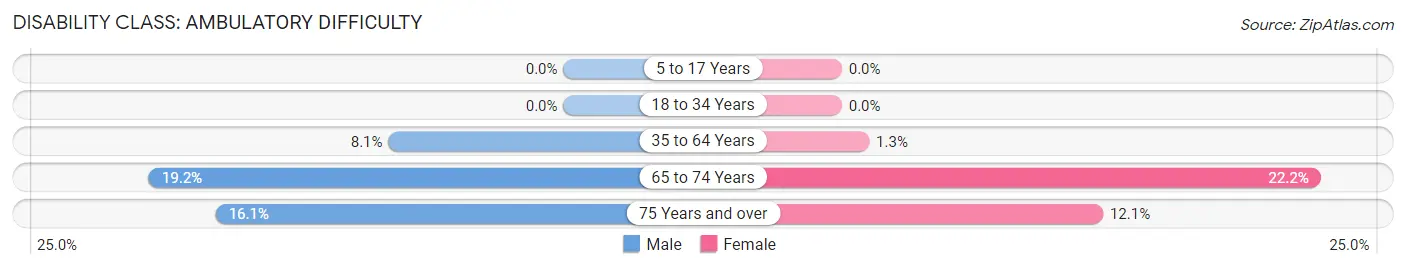
| Age Bracket | Male | Female |
| 5 to 17 Years | 0 (0.0%) | 0 (0.0%) |
| 18 to 34 Years | 0 (0.0%) | 0 (0.0%) |
| 35 to 64 Years | 13 (8.1%) | 2 (1.3%) |
| 65 to 74 Years | 10 (19.2%) | 8 (22.2%) |
| 75 Years and over | 5 (16.1%) | 4 (12.1%) |
Disability Class: Self-Care Difficulty
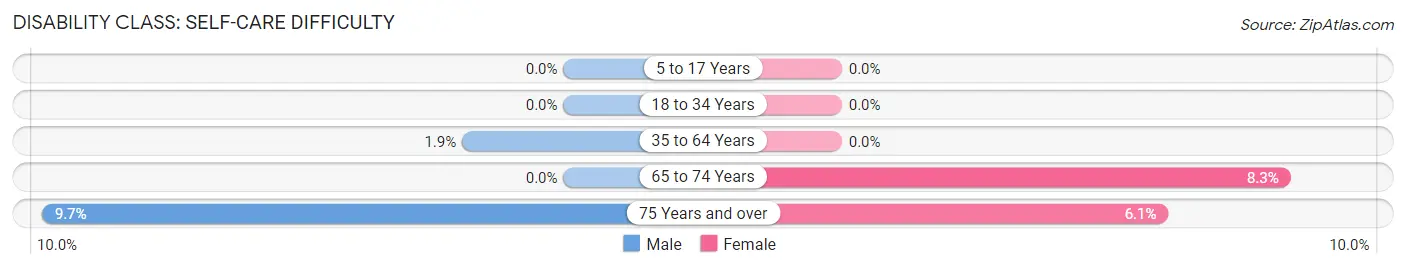
| Age Bracket | Male | Female |
| 5 to 17 Years | 0 (0.0%) | 0 (0.0%) |
| 18 to 34 Years | 0 (0.0%) | 0 (0.0%) |
| 35 to 64 Years | 3 (1.9%) | 0 (0.0%) |
| 65 to 74 Years | 0 (0.0%) | 3 (8.3%) |
| 75 Years and over | 3 (9.7%) | 2 (6.1%) |
Technology Access in Treasure County
Computing Device Access in Treasure County
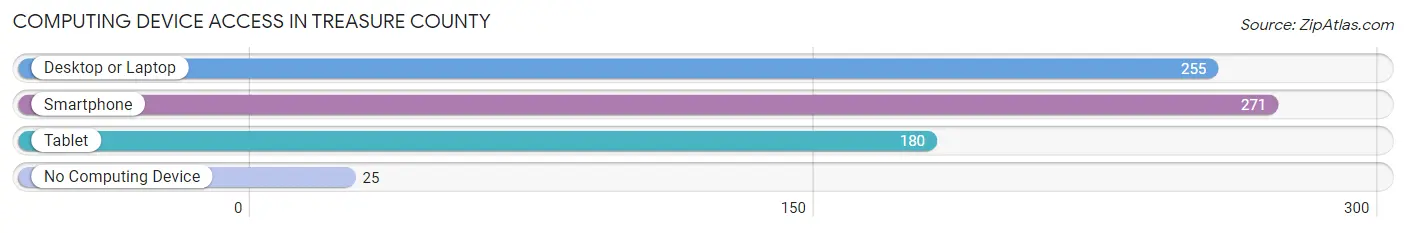
| Device Type | # Households | % Households |
| Desktop or Laptop | 255 | 76.6% |
| Smartphone | 271 | 81.4% |
| Tablet | 180 | 54.0% |
| No Computing Device | 25 | 7.5% |
| Total | 333 | 100.0% |
Internet Access in Treasure County
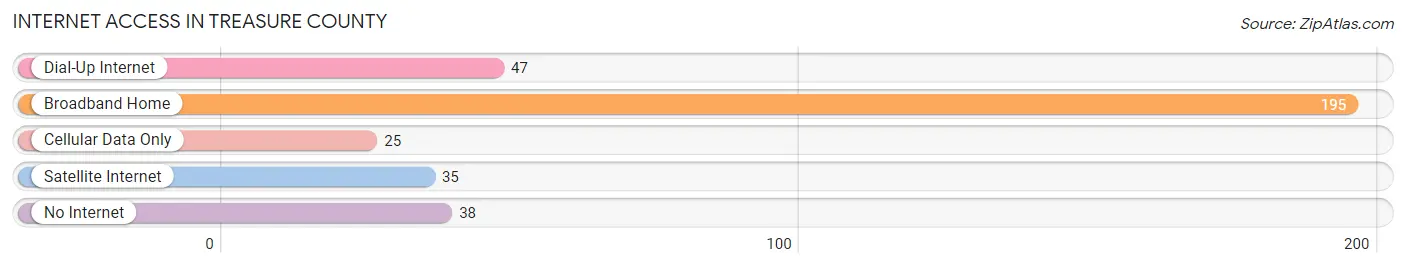
| Internet Type | # Households | % Households |
| Dial-Up Internet | 47 | 14.1% |
| Broadband Home | 195 | 58.6% |
| Cellular Data Only | 25 | 7.5% |
| Satellite Internet | 35 | 10.5% |
| No Internet | 38 | 11.4% |
| Total | 333 | 100.0% |
Treasure County Summary
Treasure County, Montana is located in the south-central part of the state, and is bordered by Rosebud County to the north, Big Horn County to the east, Custer County to the south, and Powder River County to the west. The county seat is Hysham, and the largest city is Forsyth. The county was established in 1919 and named for the Treasure State, Montana's nickname.
Geography
Treasure County covers an area of 1,845 square miles, making it the fourth largest county in Montana. The terrain is mostly rolling hills and plains, with the Little Big Horn River running through the county. The highest point in the county is located in the Little Big Horn Mountains, at an elevation of 4,945 feet. The county is home to several wildlife refuges, including the Big Horn National Wildlife Refuge, the Big Horn Lake National Wildlife Refuge, and the Big Horn River National Wildlife Refuge.
Climate
Treasure County has a semi-arid climate, with hot summers and cold winters. The average annual temperature is 48°F, and the average annual precipitation is 13.5 inches.
Demographics
As of the 2010 census, there were 2,890 people, 1,093 households, and 745 families living in Treasure County. The population density was 1.6 people per square mile. The racial makeup of the county was 95.3% White, 0.3% African American, 1.2% Native American, 0.2% Asian, 0.1% Pacific Islander, 0.7% from other races, and 2.3% from two or more races. Hispanic or Latino of any race were 2.3% of the population.
Economy
The economy of Treasure County is largely based on agriculture and ranching. The county is home to several large cattle ranches, as well as wheat, barley, and hay farms. The county is also home to several oil and gas fields, and there is some mining activity in the area. The county is served by the Forsyth Airport, which offers daily flights to Billings and other cities in Montana.
Treasure County is home to several tourist attractions, including the Little Bighorn Battlefield National Monument, the Big Horn National Wildlife Refuge, and the Big Horn Lake National Wildlife Refuge. The county is also home to several museums, including the Custer County Museum and the Little Bighorn Battlefield Museum.
Treasure County is a great place to live, work, and play. With its beautiful scenery, rich history, and diverse economy, Treasure County is a great place to call home.
Common Questions
What is the Total Population of Treasure County?
Total Population of Treasure County is 680.
What is the Total Male Population of Treasure County?
Total Male Population of Treasure County is 359.
What is the Total Female Population of Treasure County?
Total Female Population of Treasure County is 321.
What is the Ratio of Males per 100 Females in Treasure County?
There are 111.84 Males per 100 Females in Treasure County.
What is the Ratio of Females per 100 Males in Treasure County?
There are 89.42 Females per 100 Males in Treasure County.
What is the Median Population Age in Treasure County?
Median Population Age in Treasure County is 54.3 Years.
What is the Average Family Size in Treasure County
Average Family Size in Treasure County is 2.5 People.
What is the Average Household Size in Treasure County
Average Household Size in Treasure County is 2.0 People.
What is Per Capita Income in Treasure County?
Per Capita income in Treasure County is $37,349.
What is the Median Family Income in Treasure County?
Median Family Income in Treasure County is $79,792.
What is the Median Household income in Treasure County?
Median Household Income in Treasure County is $70,096.
What is Income or Wage Gap in Treasure County?
Income or Wage Gap in Treasure County is 19.2%.
Women in Treasure County earn 80.8 cents for every dollar earned by a man.
What is Inequality or Gini Index in Treasure County?
Inequality or Gini Index in Treasure County is 0.42.
How Large is the Labor Force in Treasure County?
There are 368 People in the Labor Forcein in Treasure County.
What is the Percentage of People in the Labor Force in Treasure County?
64.4% of People are in the Labor Force in Treasure County.
What is the Unemployment Rate in Treasure County?
Unemployment Rate in Treasure County is 1.1%.