Sweet Grass County, MT
Sweet Grass County Map
Sweet Grass County Overview
3,697
TOTAL POPULATION
1,906
MALE POPULATION
1,791
FEMALE POPULATION
106.42
MALES / 100 FEMALES
93.97
FEMALES / 100 MALES
43.6
MEDIAN AGE
3.1
AVG FAMILY SIZE
2.5
AVG HOUSEHOLD SIZE
$35,495
PER CAPITA INCOME
$83,854
AVG FAMILY INCOME
$64,872
AVG HOUSEHOLD INCOME
42.8%
WAGE / INCOME GAP [ % ]
57.2¢/ $1
WAGE / INCOME GAP [ $ ]
0.44
INEQUALITY / GINI INDEX
1,892
LABOR FORCE [ PEOPLE ]
62.1%
PERCENT IN LABOR FORCE
2.1%
UNEMPLOYMENT RATE
Sweet Grass County Area Codes
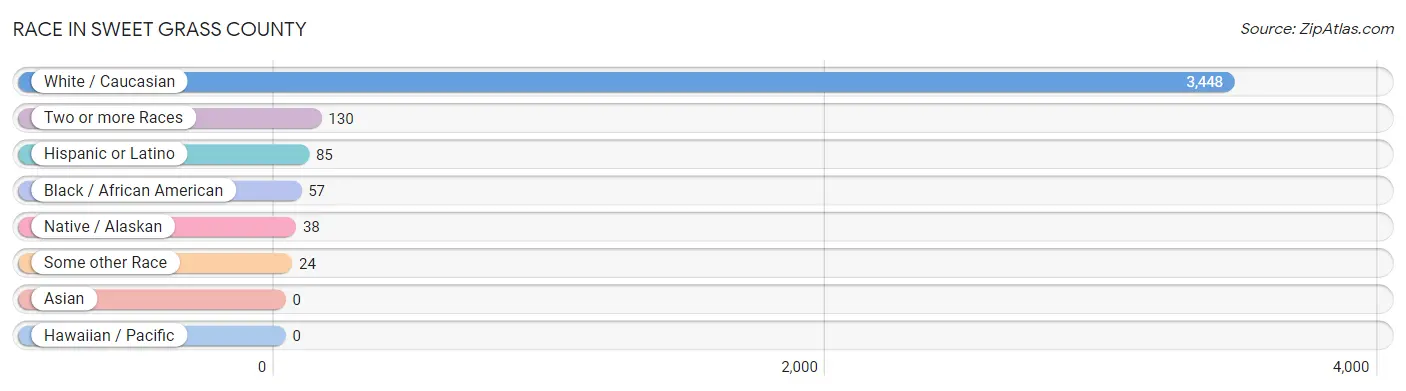
Race in Sweet Grass County
The most populous races in Sweet Grass County are White / Caucasian (3,448 | 93.3%), Two or more Races (130 | 3.5%), and Hispanic or Latino (85 | 2.3%).
| Race | # Population | % Population |
| Asian | 0 | 0.0% |
| Black / African American | 57 | 1.5% |
| Hawaiian / Pacific | 0 | 0.0% |
| Hispanic or Latino | 85 | 2.3% |
| Native / Alaskan | 38 | 1.0% |
| White / Caucasian | 3,448 | 93.3% |
| Two or more Races | 130 | 3.5% |
| Some other Race | 24 | 0.6% |
| Total | 3,697 | 100.0% |
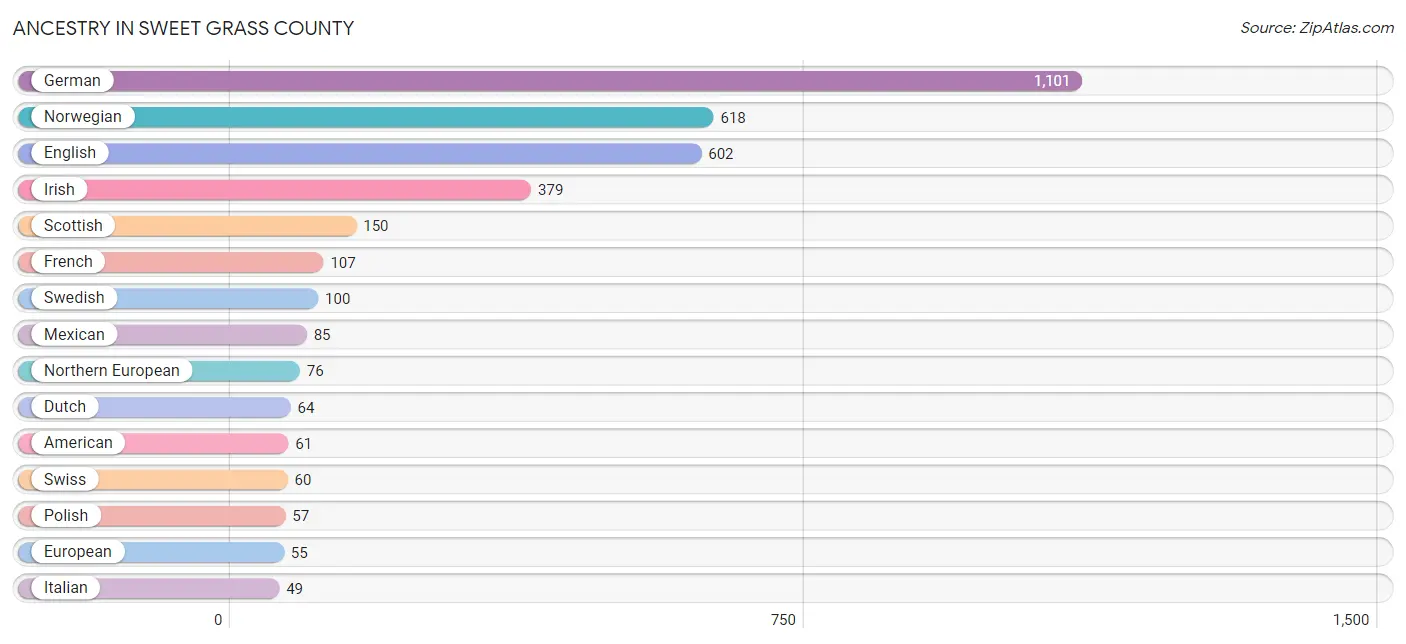
Ancestry in Sweet Grass County
The most populous ancestries reported in Sweet Grass County are German (1,101 | 29.8%), Norwegian (618 | 16.7%), English (602 | 16.3%), Irish (379 | 10.2%), and Scottish (150 | 4.1%), together accounting for 77.1% of all Sweet Grass County residents.
| Ancestry | # Population | % Population |
| American | 61 | 1.7% |
| Apache | 2 | 0.1% |
| Belgian | 43 | 1.2% |
| Blackfeet | 14 | 0.4% |
| British | 23 | 0.6% |
| Canadian | 3 | 0.1% |
| Cherokee | 11 | 0.3% |
| Chickasaw | 9 | 0.2% |
| Cree | 10 | 0.3% |
| Creek | 5 | 0.1% |
| Crow | 10 | 0.3% |
| Czech | 12 | 0.3% |
| Danish | 33 | 0.9% |
| Dutch | 64 | 1.7% |
| Eastern European | 10 | 0.3% |
| English | 602 | 16.3% |
| European | 55 | 1.5% |
| Finnish | 19 | 0.5% |
| French | 107 | 2.9% |
| French Canadian | 10 | 0.3% |
| German | 1,101 | 29.8% |
| Hungarian | 22 | 0.6% |
| Irish | 379 | 10.2% |
| Israeli | 11 | 0.3% |
| Italian | 49 | 1.3% |
| Menominee | 1 | 0.0% |
| Mexican | 85 | 2.3% |
| Northern European | 76 | 2.1% |
| Norwegian | 618 | 16.7% |
| Pennsylvania German | 5 | 0.1% |
| Polish | 57 | 1.5% |
| Portuguese | 8 | 0.2% |
| Potawatomi | 6 | 0.2% |
| Romanian | 1 | 0.0% |
| Russian | 4 | 0.1% |
| Scandinavian | 8 | 0.2% |
| Scotch-Irish | 18 | 0.5% |
| Scottish | 150 | 4.1% |
| Sioux | 5 | 0.1% |
| Slovak | 4 | 0.1% |
| Slovene | 2 | 0.1% |
| Swedish | 100 | 2.7% |
| Swiss | 60 | 1.6% |
| Welsh | 42 | 1.1% |
| Yugoslavian | 2 | 0.1% | View All 45 Rows |
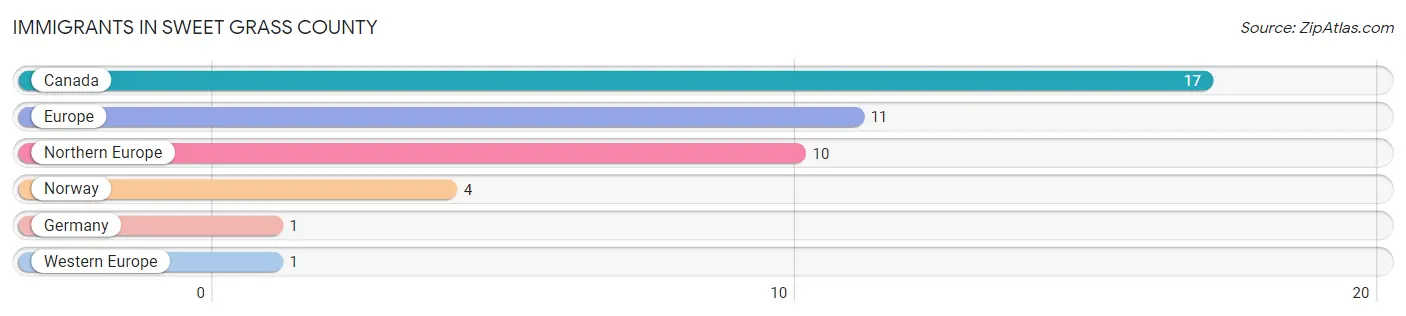
Immigrants in Sweet Grass County
The most numerous immigrant groups reported in Sweet Grass County came from Canada (17 | 0.5%), Europe (11 | 0.3%), Northern Europe (10 | 0.3%), Norway (4 | 0.1%), and Germany (1 | 0.0%), together accounting for 1.2% of all Sweet Grass County residents.
| Immigration Origin | # Population | % Population |
| Canada | 17 | 0.5% |
| Europe | 11 | 0.3% |
| Germany | 1 | 0.0% |
| Northern Europe | 10 | 0.3% |
| Norway | 4 | 0.1% |
| Western Europe | 1 | 0.0% | View All 6 Rows |
Sex and Age in Sweet Grass County
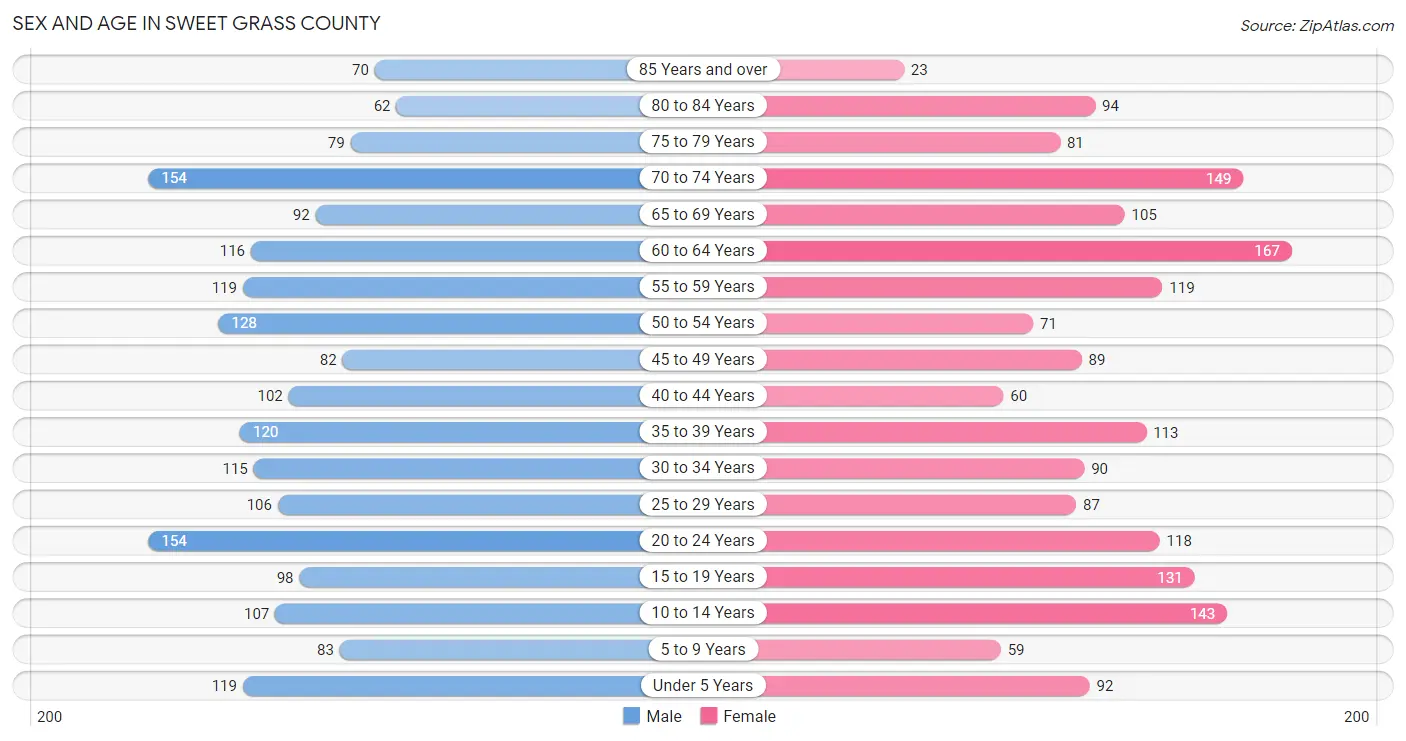
Sex and Age in Sweet Grass County
The most populous age groups in Sweet Grass County are 20 to 24 Years (154 | 8.1%) for men and 60 to 64 Years (167 | 9.3%) for women.
| Age Bracket | Male | Female |
| Under 5 Years | 119 (6.2%) | 92 (5.1%) |
| 5 to 9 Years | 83 (4.3%) | 59 (3.3%) |
| 10 to 14 Years | 107 (5.6%) | 143 (8.0%) |
| 15 to 19 Years | 98 (5.1%) | 131 (7.3%) |
| 20 to 24 Years | 154 (8.1%) | 118 (6.6%) |
| 25 to 29 Years | 106 (5.6%) | 87 (4.9%) |
| 30 to 34 Years | 115 (6.0%) | 90 (5.0%) |
| 35 to 39 Years | 120 (6.3%) | 113 (6.3%) |
| 40 to 44 Years | 102 (5.3%) | 60 (3.4%) |
| 45 to 49 Years | 82 (4.3%) | 89 (5.0%) |
| 50 to 54 Years | 128 (6.7%) | 71 (4.0%) |
| 55 to 59 Years | 119 (6.2%) | 119 (6.6%) |
| 60 to 64 Years | 116 (6.1%) | 167 (9.3%) |
| 65 to 69 Years | 92 (4.8%) | 105 (5.9%) |
| 70 to 74 Years | 154 (8.1%) | 149 (8.3%) |
| 75 to 79 Years | 79 (4.1%) | 81 (4.5%) |
| 80 to 84 Years | 62 (3.3%) | 94 (5.2%) |
| 85 Years and over | 70 (3.7%) | 23 (1.3%) |
| Total | 1,906 (100.0%) | 1,791 (100.0%) |
Families and Households in Sweet Grass County
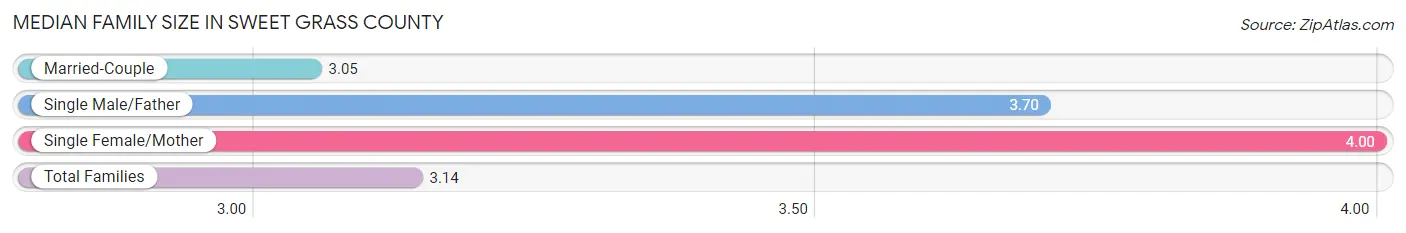
Median Family Size in Sweet Grass County
The median family size in Sweet Grass County is 3.14 persons per family, with single female/mother families (60 | 6.0%) accounting for the largest median family size of 4 persons per family. On the other hand, married-couple families (892 | 89.3%) represent the smallest median family size with 3.05 persons per family.
| Family Type | # Families | Family Size |
| Married-Couple | 892 (89.3%) | 3.05 |
| Single Male/Father | 47 (4.7%) | 3.70 |
| Single Female/Mother | 60 (6.0%) | 4.00 |
| Total Families | 999 (100.0%) | 3.14 |
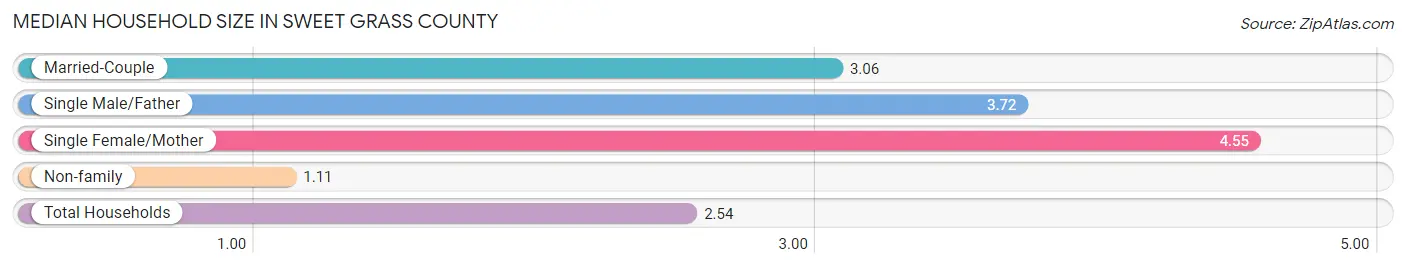
Median Household Size in Sweet Grass County
The median household size in Sweet Grass County is 2.54 persons per household, with single female/mother households (60 | 4.2%) accounting for the largest median household size of 4.55 persons per household. non-family households (447 | 30.9%) represent the smallest median household size with 1.11 persons per household.
| Household Type | # Households | Household Size |
| Married-Couple | 892 (61.7%) | 3.06 |
| Single Male/Father | 47 (3.3%) | 3.72 |
| Single Female/Mother | 60 (4.2%) | 4.55 |
| Non-family | 447 (30.9%) | 1.11 |
| Total Households | 1,446 (100.0%) | 2.54 |
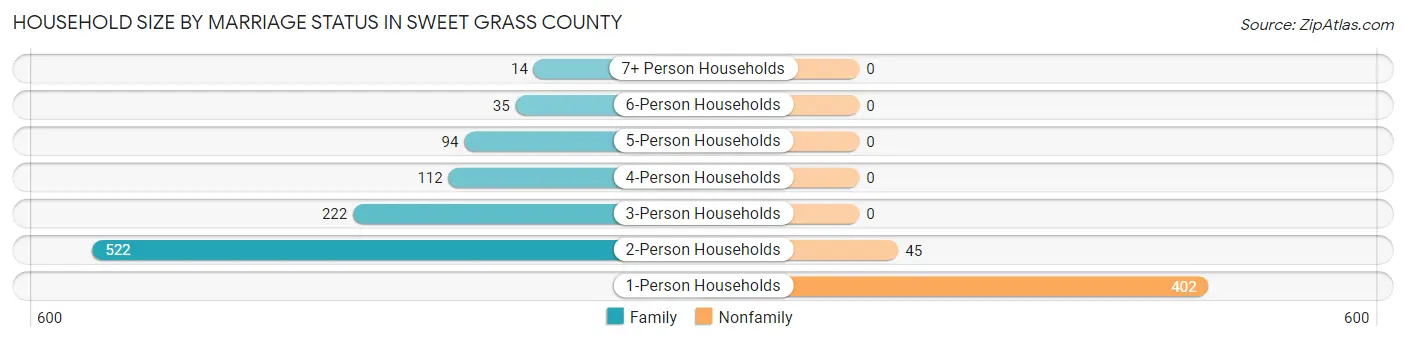
Household Size by Marriage Status in Sweet Grass County
Out of a total of 1,446 households in Sweet Grass County, 999 (69.1%) are family households, while 447 (30.9%) are nonfamily households. The most numerous type of family households are 2-person households, comprising 522, and the most common type of nonfamily households are 1-person households, comprising 402.
| Household Size | Family Households | Nonfamily Households |
| 1-Person Households | - | 402 (27.8%) |
| 2-Person Households | 522 (36.1%) | 45 (3.1%) |
| 3-Person Households | 222 (15.3%) | 0 (0.0%) |
| 4-Person Households | 112 (7.7%) | 0 (0.0%) |
| 5-Person Households | 94 (6.5%) | 0 (0.0%) |
| 6-Person Households | 35 (2.4%) | 0 (0.0%) |
| 7+ Person Households | 14 (1.0%) | 0 (0.0%) |
| Total | 999 (69.1%) | 447 (30.9%) |
Female Fertility in Sweet Grass County
Fertility by Age in Sweet Grass County
Average fertility rate in Sweet Grass County is 35.0 births per 1,000 women. Women in the age bracket of 20 to 34 years have the highest fertility rate with 64.0 births per 1,000 women. Women in the age bracket of 20 to 34 years acount for 76.0% of all women with births.
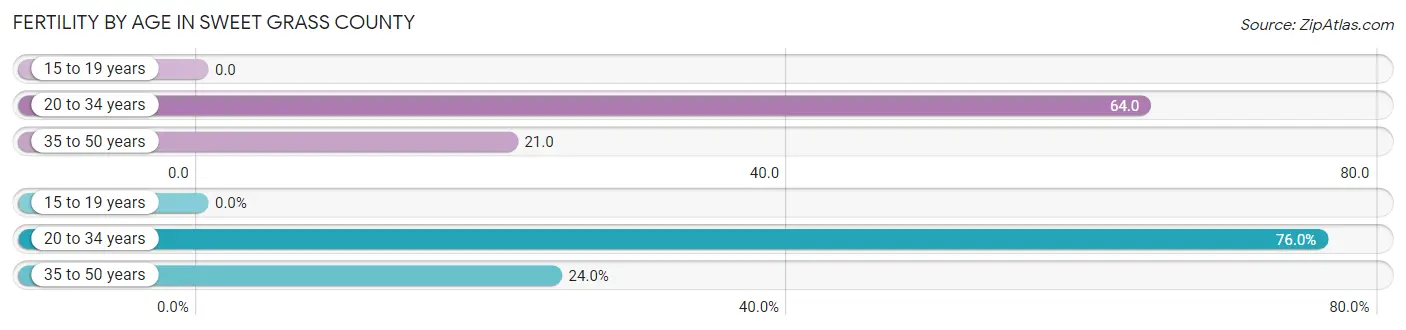
| Age Bracket | Women with Births | Births / 1,000 Women |
| 15 to 19 years | 0 (0.0%) | 0.0 |
| 20 to 34 years | 19 (76.0%) | 64.0 |
| 35 to 50 years | 6 (24.0%) | 21.0 |
| Total | 25 (100.0%) | 35.0 |
Fertility by Age by Marriage Status in Sweet Grass County
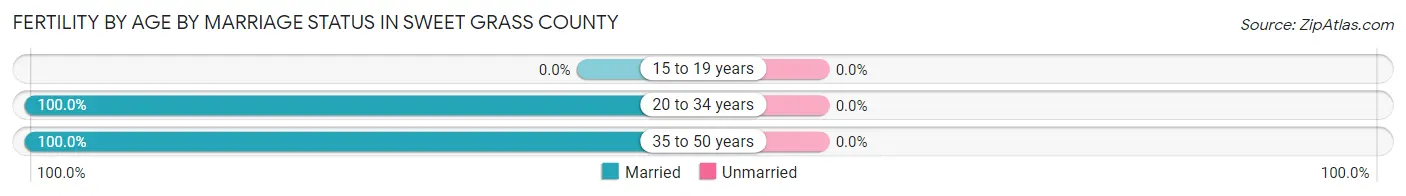
| Age Bracket | Married | Unmarried |
| 15 to 19 years | 0 (0.0%) | 0 (0.0%) |
| 20 to 34 years | 19 (100.0%) | 0 (0.0%) |
| 35 to 50 years | 6 (100.0%) | 0 (0.0%) |
| Total | 25 (100.0%) | 0 (0.0%) |
Fertility by Education in Sweet Grass County
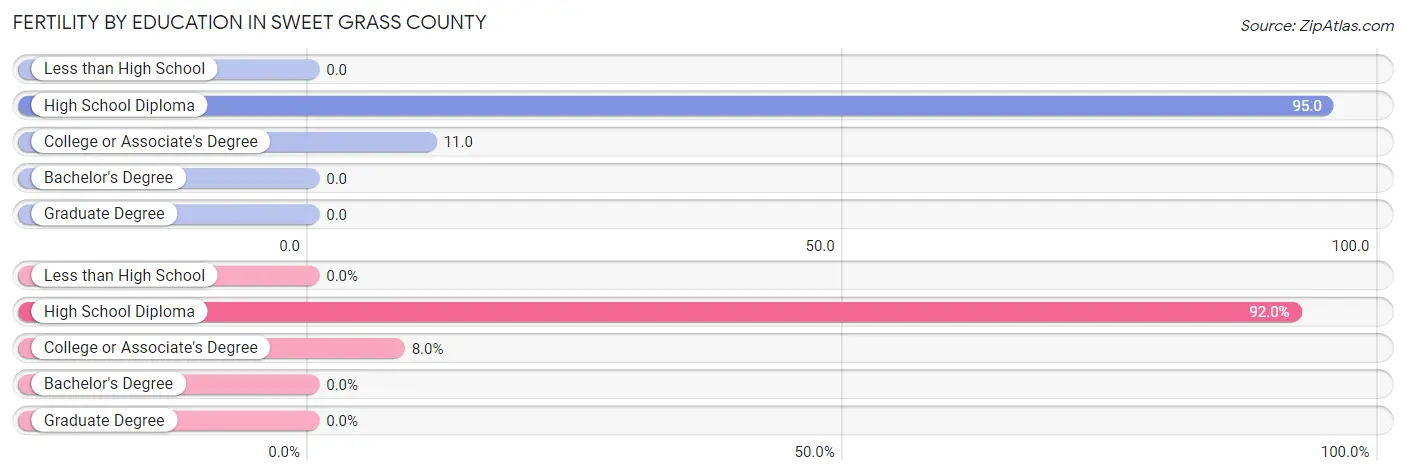
| Educational Attainment | Women with Births | Births / 1,000 Women |
| Less than High School | 0 (0.0%) | 0.0 |
| High School Diploma | 23 (92.0%) | 95.0 |
| College or Associate's Degree | 2 (8.0%) | 11.0 |
| Bachelor's Degree | 0 (0.0%) | 0.0 |
| Graduate Degree | 0 (0.0%) | 0.0 |
| Total | 25 (100.0%) | 35.0 |
Fertility by Education by Marriage Status in Sweet Grass County
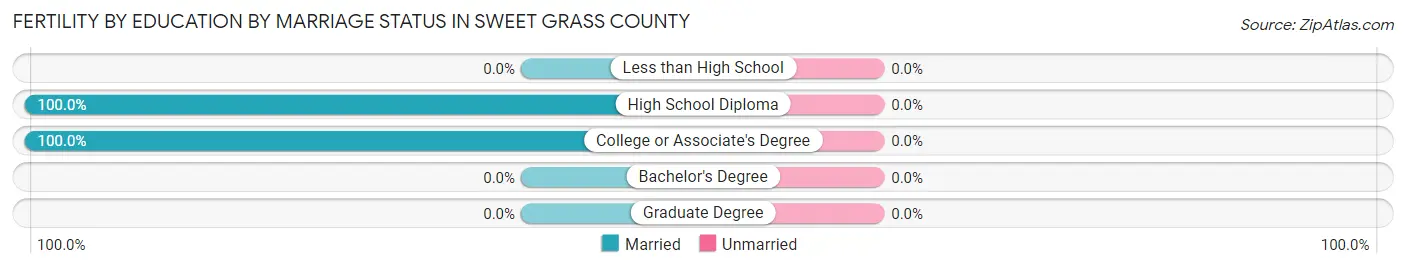
| Educational Attainment | Married | Unmarried |
| Less than High School | 0 (0.0%) | 0 (0.0%) |
| High School Diploma | 23 (100.0%) | 0 (0.0%) |
| College or Associate's Degree | 2 (100.0%) | 0 (0.0%) |
| Bachelor's Degree | 0 (0.0%) | 0 (0.0%) |
| Graduate Degree | 0 (0.0%) | 0 (0.0%) |
| Total | 25 (100.0%) | 0 (0.0%) |
Income in Sweet Grass County
Income Overview in Sweet Grass County
Per Capita Income in Sweet Grass County is $35,495, while median incomes of families and households are $83,854 and $64,872 respectively.
| Characteristic | Number | Measure |
| Per Capita Income | 3,697 | $35,495 |
| Median Family Income | 999 | $83,854 |
| Mean Family Income | 999 | $104,579 |
| Median Household Income | 1,446 | $64,872 |
| Mean Household Income | 1,446 | $86,457 |
| Income Deficit | 999 | $0 |
| Wage / Income Gap (%) | 3,697 | 42.84% |
| Wage / Income Gap ($) | 3,697 | 57.16¢ per $1 |
| Gini / Inequality Index | 3,697 | 0.44 |
Earnings by Sex in Sweet Grass County
Average Earnings in Sweet Grass County are $35,062, $42,500 for men and $24,293 for women, a difference of 42.8%.
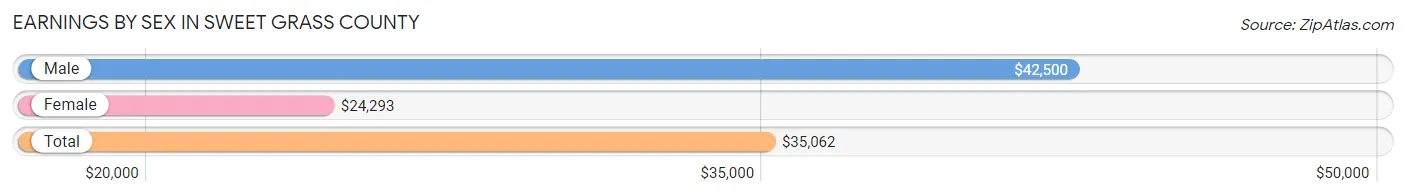
| Sex | Number | Average Earnings |
| Male | 1,072 (54.6%) | $42,500 |
| Female | 892 (45.4%) | $24,293 |
| Total | 1,964 (100.0%) | $35,062 |
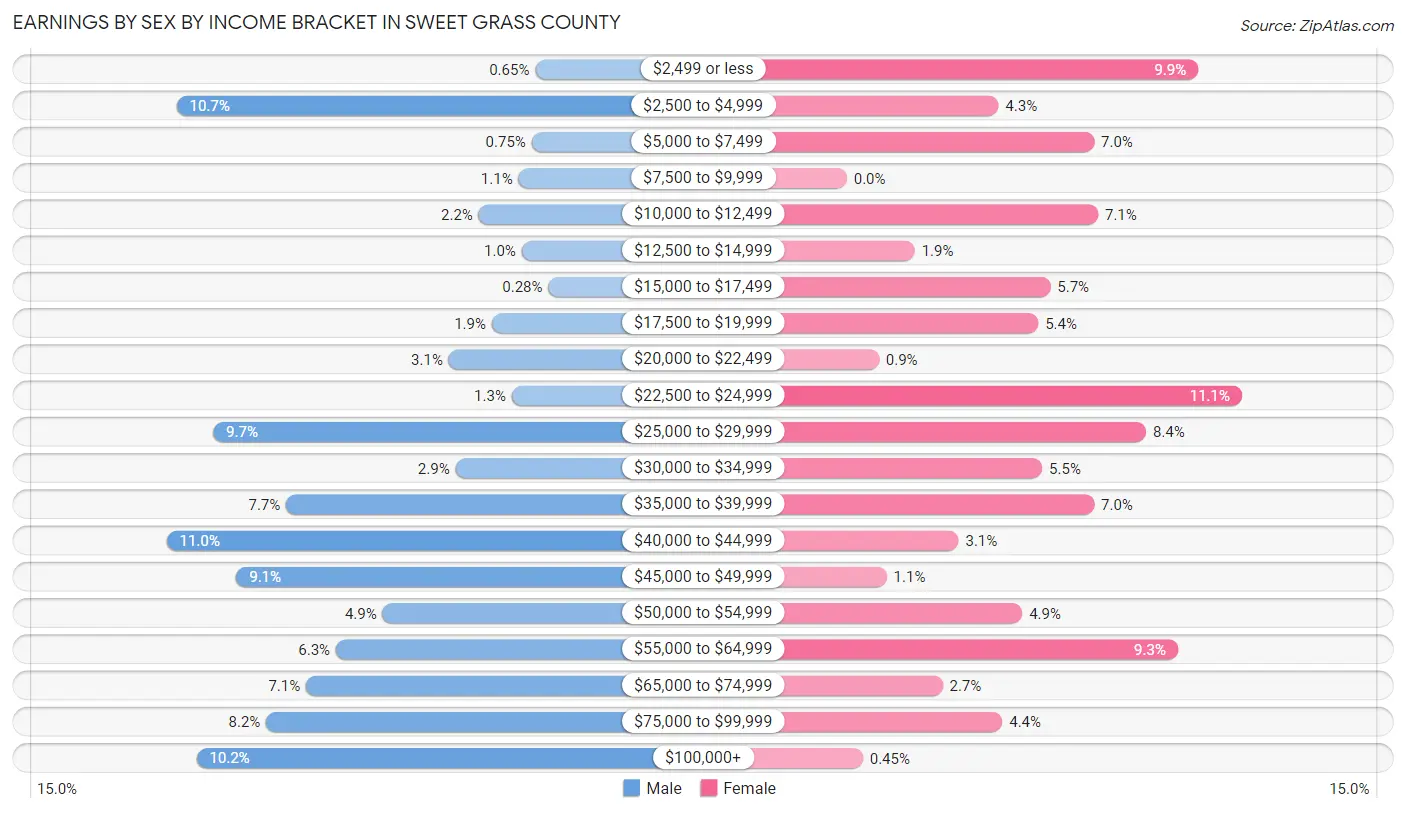
Earnings by Sex by Income Bracket in Sweet Grass County
The most common earnings brackets in Sweet Grass County are $40,000 to $44,999 for men (118 | 11.0%) and $22,500 to $24,999 for women (99 | 11.1%).
| Income | Male | Female |
| $2,499 or less | 7 (0.6%) | 88 (9.9%) |
| $2,500 to $4,999 | 115 (10.7%) | 38 (4.3%) |
| $5,000 to $7,499 | 8 (0.7%) | 62 (7.0%) |
| $7,500 to $9,999 | 12 (1.1%) | 0 (0.0%) |
| $10,000 to $12,499 | 24 (2.2%) | 63 (7.1%) |
| $12,500 to $14,999 | 11 (1.0%) | 17 (1.9%) |
| $15,000 to $17,499 | 3 (0.3%) | 51 (5.7%) |
| $17,500 to $19,999 | 20 (1.9%) | 48 (5.4%) |
| $20,000 to $22,499 | 33 (3.1%) | 8 (0.9%) |
| $22,500 to $24,999 | 14 (1.3%) | 99 (11.1%) |
| $25,000 to $29,999 | 104 (9.7%) | 75 (8.4%) |
| $30,000 to $34,999 | 31 (2.9%) | 49 (5.5%) |
| $35,000 to $39,999 | 82 (7.6%) | 62 (7.0%) |
| $40,000 to $44,999 | 118 (11.0%) | 28 (3.1%) |
| $45,000 to $49,999 | 97 (9.0%) | 10 (1.1%) |
| $50,000 to $54,999 | 53 (4.9%) | 44 (4.9%) |
| $55,000 to $64,999 | 67 (6.2%) | 83 (9.3%) |
| $65,000 to $74,999 | 76 (7.1%) | 24 (2.7%) |
| $75,000 to $99,999 | 88 (8.2%) | 39 (4.4%) |
| $100,000+ | 109 (10.2%) | 4 (0.4%) |
| Total | 1,072 (100.0%) | 892 (100.0%) |
Earnings by Sex by Educational Attainment in Sweet Grass County
Average earnings in Sweet Grass County are $46,938 for men and $28,305 for women, a difference of 39.7%. Men with an educational attainment of graduate degree enjoy the highest average annual earnings of $56,250, while those with college or associate's degree education earn the least with $42,130. Women with an educational attainment of graduate degree earn the most with the average annual earnings of $51,964, while those with college or associate's degree education have the smallest earnings of $26,250.
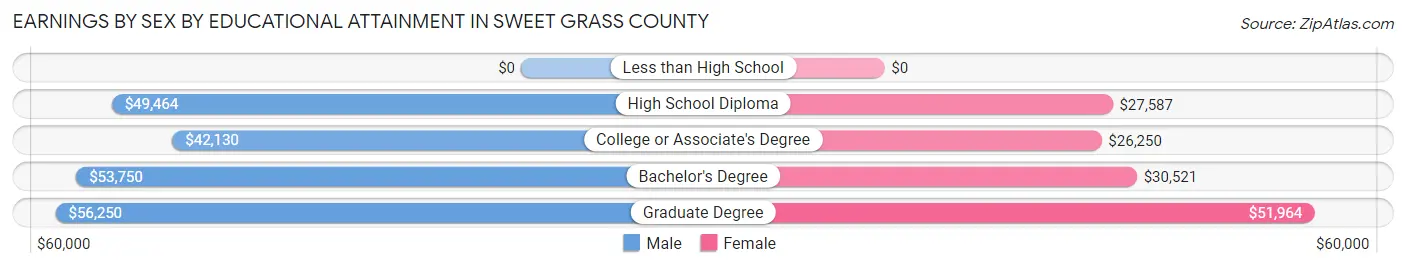
| Educational Attainment | Male Income | Female Income |
| Less than High School | - | - |
| High School Diploma | $49,464 | $27,587 |
| College or Associate's Degree | $42,130 | $26,250 |
| Bachelor's Degree | $53,750 | $30,521 |
| Graduate Degree | $56,250 | $51,964 |
| Total | $46,938 | $28,305 |
Family Income in Sweet Grass County
Family Income Brackets in Sweet Grass County
According to the Sweet Grass County family income data, there are 234 families falling into the $75,000 to $99,999 income range, which is the most common income bracket and makes up 23.4% of all families. Conversely, the $10,000 to $14,999 income bracket is the least frequent group with only 6 families (0.6%) belonging to this category.
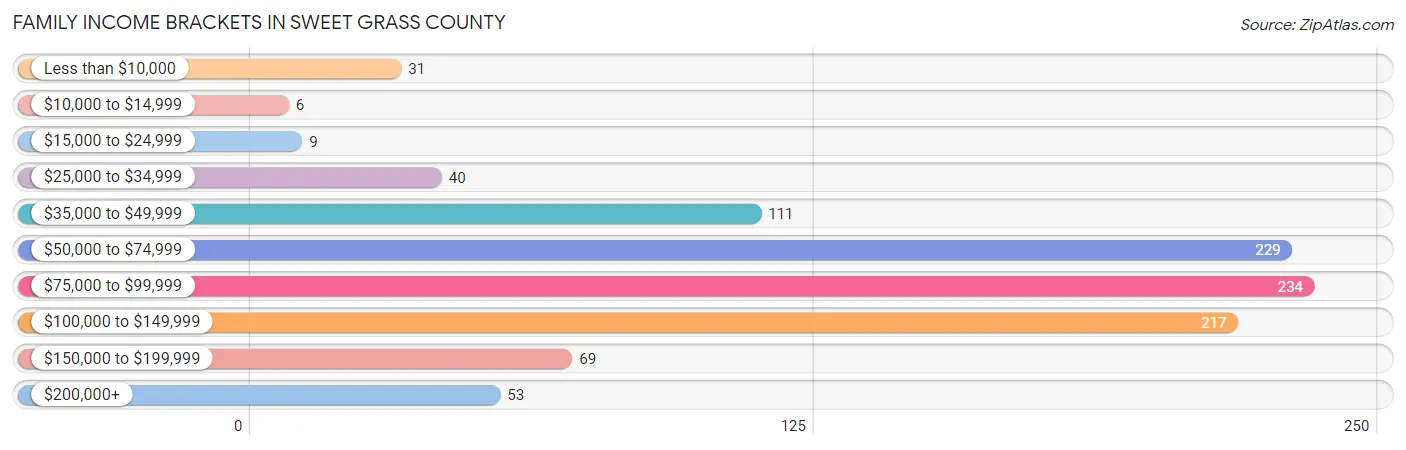
| Income Bracket | # Families | % Families |
| Less than $10,000 | 31 | 3.1% |
| $10,000 to $14,999 | 6 | 0.6% |
| $15,000 to $24,999 | 9 | 0.9% |
| $25,000 to $34,999 | 40 | 4.0% |
| $35,000 to $49,999 | 111 | 11.1% |
| $50,000 to $74,999 | 229 | 22.9% |
| $75,000 to $99,999 | 234 | 23.4% |
| $100,000 to $149,999 | 217 | 21.7% |
| $150,000 to $199,999 | 69 | 6.9% |
| $200,000+ | 53 | 5.3% |
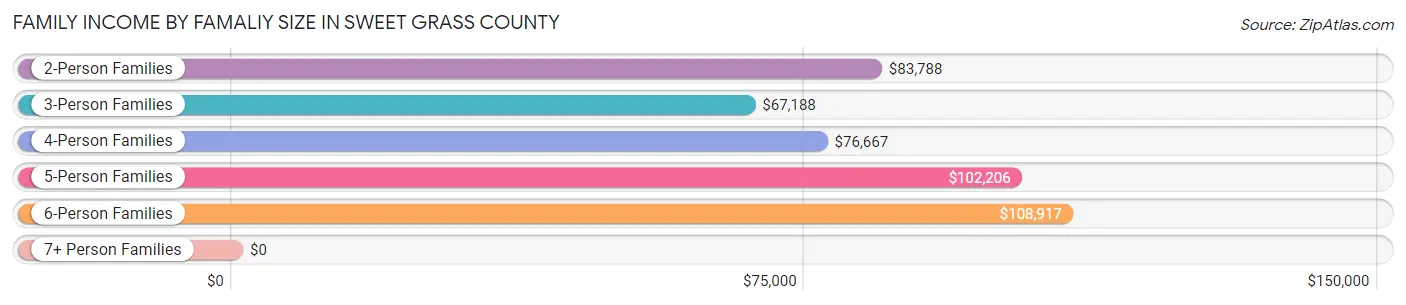
Family Income by Famaliy Size in Sweet Grass County
6-person families (35 | 3.5%) account for the highest median family income in Sweet Grass County with $108,917 per family, while 2-person families (524 | 52.4%) have the highest median income of $41,894 per family member.
| Income Bracket | # Families | Median Income |
| 2-Person Families | 524 (52.4%) | $83,788 |
| 3-Person Families | 234 (23.4%) | $67,188 |
| 4-Person Families | 114 (11.4%) | $76,667 |
| 5-Person Families | 78 (7.8%) | $102,206 |
| 6-Person Families | 35 (3.5%) | $108,917 |
| 7+ Person Families | 14 (1.4%) | $0 |
| Total | 999 (100.0%) | $83,854 |
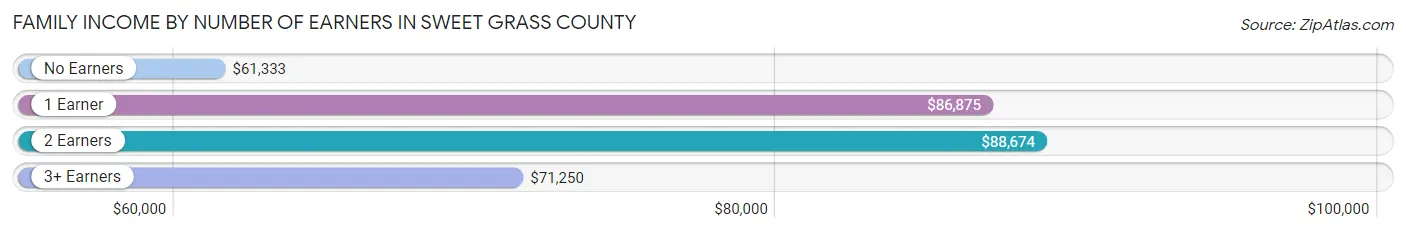
Family Income by Number of Earners in Sweet Grass County
The median family income in Sweet Grass County is $83,854, with families comprising 2 earners (479) having the highest median family income of $88,674, while families with no earners (240) have the lowest median family income of $61,333, accounting for 47.9% and 24.0% of families, respectively.
| Number of Earners | # Families | Median Income |
| No Earners | 240 (24.0%) | $61,333 |
| 1 Earner | 124 (12.4%) | $86,875 |
| 2 Earners | 479 (47.9%) | $88,674 |
| 3+ Earners | 156 (15.6%) | $71,250 |
| Total | 999 (100.0%) | $83,854 |
Household Income in Sweet Grass County
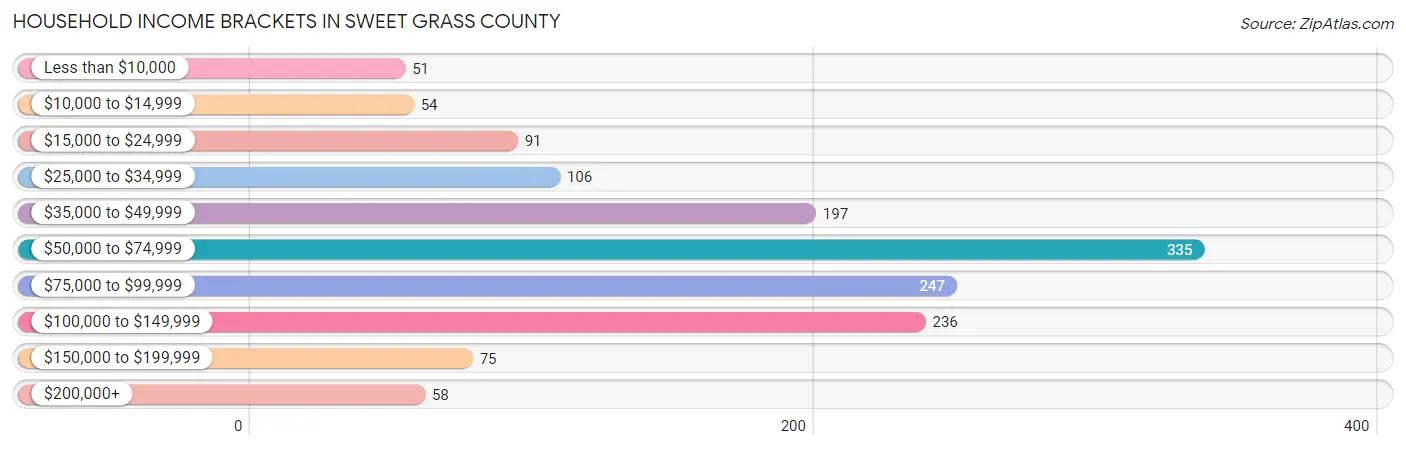
Household Income Brackets in Sweet Grass County
With 335 households falling in the category, the $50,000 to $74,999 income range is the most frequent in Sweet Grass County, accounting for 23.2% of all households. In contrast, only 51 households (3.5%) fall into the less than $10,000 income bracket, making it the least populous group.
| Income Bracket | # Households | % Households |
| Less than $10,000 | 51 | 3.5% |
| $10,000 to $14,999 | 54 | 3.7% |
| $15,000 to $24,999 | 91 | 6.3% |
| $25,000 to $34,999 | 106 | 7.3% |
| $35,000 to $49,999 | 197 | 13.6% |
| $50,000 to $74,999 | 335 | 23.2% |
| $75,000 to $99,999 | 247 | 17.1% |
| $100,000 to $149,999 | 236 | 16.3% |
| $150,000 to $199,999 | 75 | 5.2% |
| $200,000+ | 58 | 4.0% |
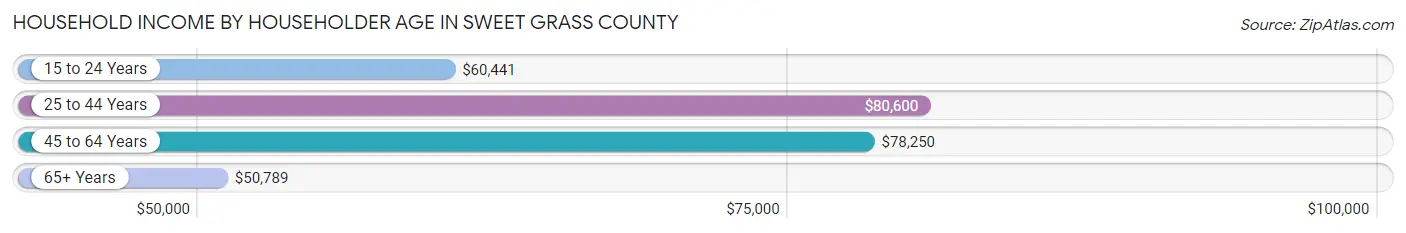
Household Income by Householder Age in Sweet Grass County
The median household income in Sweet Grass County is $64,872, with the highest median household income of $80,600 found in the 25 to 44 years age bracket for the primary householder. A total of 346 households (23.9%) fall into this category. Meanwhile, the 65+ years age bracket for the primary householder has the lowest median household income of $50,789, with 548 households (37.9%) in this group.
| Income Bracket | # Households | Median Income |
| 15 to 24 Years | 82 (5.7%) | $60,441 |
| 25 to 44 Years | 346 (23.9%) | $80,600 |
| 45 to 64 Years | 470 (32.5%) | $78,250 |
| 65+ Years | 548 (37.9%) | $50,789 |
| Total | 1,446 (100.0%) | $64,872 |
Poverty in Sweet Grass County
Income Below Poverty by Sex and Age in Sweet Grass County
With 6.3% poverty level for males and 5.7% for females among the residents of Sweet Grass County, 35 to 44 year old males and 75 year old and over females are the most vulnerable to poverty, with 53 males (23.9%) and 27 females (14.4%) in their respective age groups living below the poverty level.
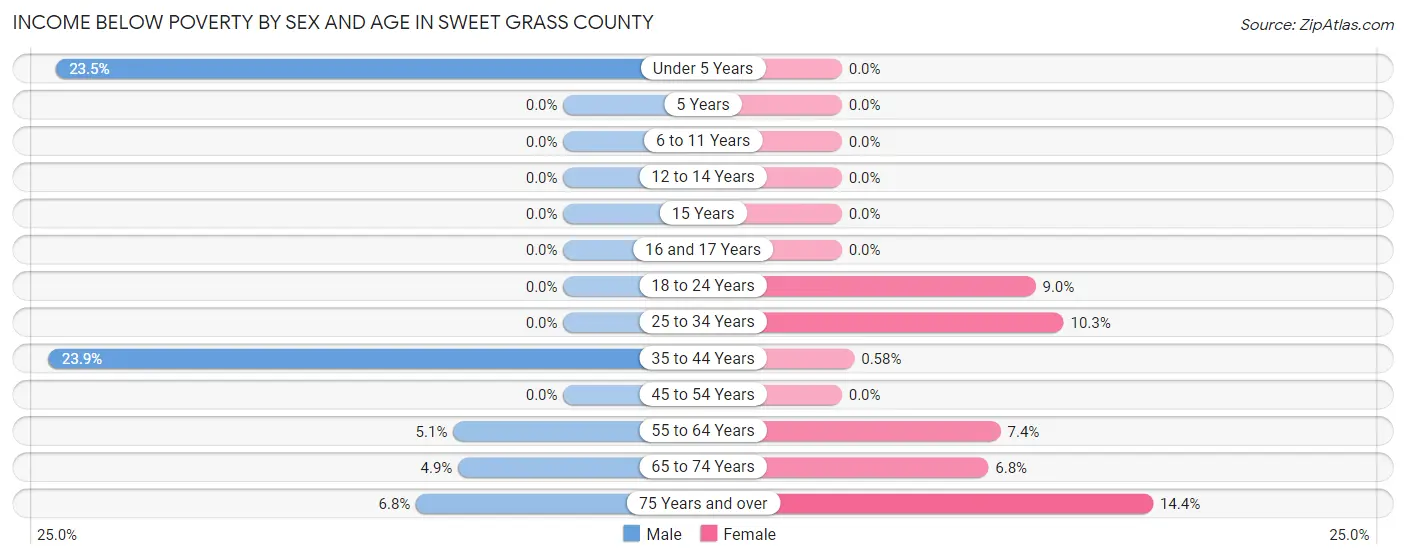
| Age Bracket | Male | Female |
| Under 5 Years | 28 (23.5%) | 0 (0.0%) |
| 5 Years | 0 (0.0%) | 0 (0.0%) |
| 6 to 11 Years | 0 (0.0%) | 0 (0.0%) |
| 12 to 14 Years | 0 (0.0%) | 0 (0.0%) |
| 15 Years | 0 (0.0%) | 0 (0.0%) |
| 16 and 17 Years | 0 (0.0%) | 0 (0.0%) |
| 18 to 24 Years | 0 (0.0%) | 16 (9.0%) |
| 25 to 34 Years | 0 (0.0%) | 18 (10.3%) |
| 35 to 44 Years | 53 (23.9%) | 1 (0.6%) |
| 45 to 54 Years | 0 (0.0%) | 0 (0.0%) |
| 55 to 64 Years | 12 (5.1%) | 21 (7.4%) |
| 65 to 74 Years | 12 (4.9%) | 17 (6.8%) |
| 75 Years and over | 14 (6.8%) | 27 (14.4%) |
| Total | 119 (6.3%) | 100 (5.7%) |
Income Above Poverty by Sex and Age in Sweet Grass County
According to the poverty statistics in Sweet Grass County, males aged 5 years and females aged under 5 years are the age groups that are most secure financially, with 100.0% of males and 100.0% of females in these age groups living above the poverty line.
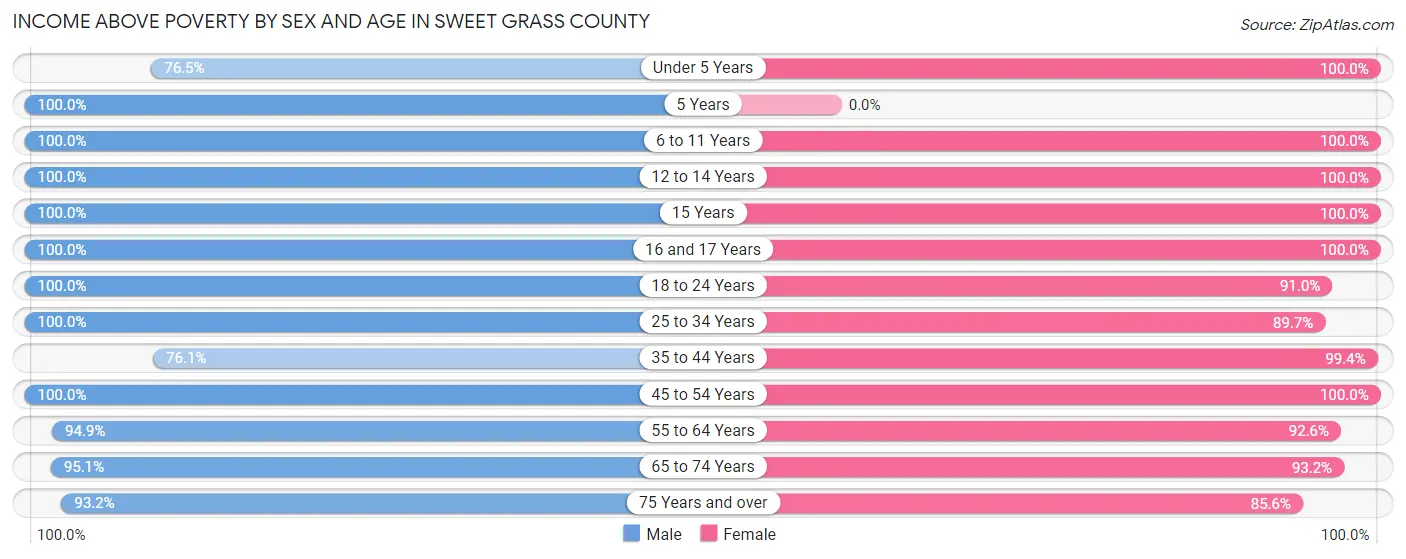
| Age Bracket | Male | Female |
| Under 5 Years | 91 (76.5%) | 87 (100.0%) |
| 5 Years | 2 (100.0%) | 0 (0.0%) |
| 6 to 11 Years | 98 (100.0%) | 142 (100.0%) |
| 12 to 14 Years | 90 (100.0%) | 60 (100.0%) |
| 15 Years | 6 (100.0%) | 41 (100.0%) |
| 16 and 17 Years | 65 (100.0%) | 30 (100.0%) |
| 18 to 24 Years | 181 (100.0%) | 162 (91.0%) |
| 25 to 34 Years | 221 (100.0%) | 157 (89.7%) |
| 35 to 44 Years | 169 (76.1%) | 172 (99.4%) |
| 45 to 54 Years | 210 (100.0%) | 160 (100.0%) |
| 55 to 64 Years | 223 (94.9%) | 264 (92.6%) |
| 65 to 74 Years | 234 (95.1%) | 233 (93.2%) |
| 75 Years and over | 191 (93.2%) | 160 (85.6%) |
| Total | 1,781 (93.7%) | 1,668 (94.3%) |
Income Below Poverty Among Married-Couple Families in Sweet Grass County
The poverty statistics for married-couple families in Sweet Grass County show that 1.1% or 10 of the total 892 families live below the poverty line. Families with no children have the highest poverty rate of 1.8%, comprising of 10 families. On the other hand, families with 1 or 2 children have the lowest poverty rate of 0.0%, which includes 0 families.
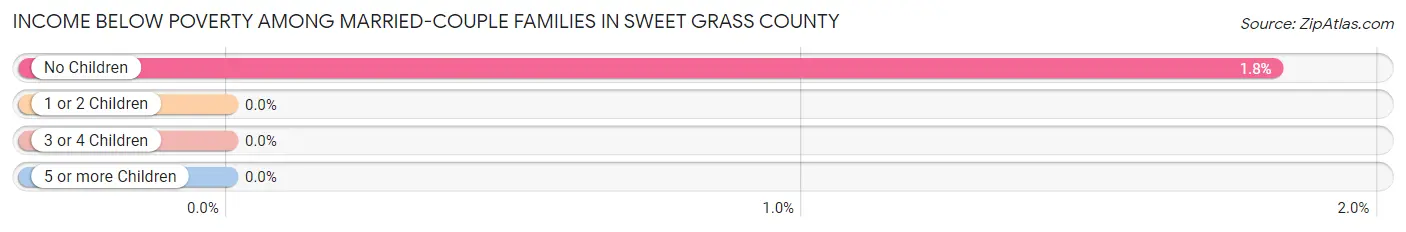
| Children | Above Poverty | Below Poverty |
| No Children | 538 (98.2%) | 10 (1.8%) |
| 1 or 2 Children | 273 (100.0%) | 0 (0.0%) |
| 3 or 4 Children | 57 (100.0%) | 0 (0.0%) |
| 5 or more Children | 14 (100.0%) | 0 (0.0%) |
| Total | 882 (98.9%) | 10 (1.1%) |
Income Below Poverty Among Single-Parent Households in Sweet Grass County
According to the poverty data in Sweet Grass County, 31.9% or 15 single-father households and 20.0% or 12 single-mother households are living below the poverty line. Among single-father households, those with no children have the highest poverty rate, with 15 households (57.7%) experiencing poverty. Likewise, among single-mother households, those with 1 or 2 children have the highest poverty rate, with 10 households (35.7%) falling below the poverty line.
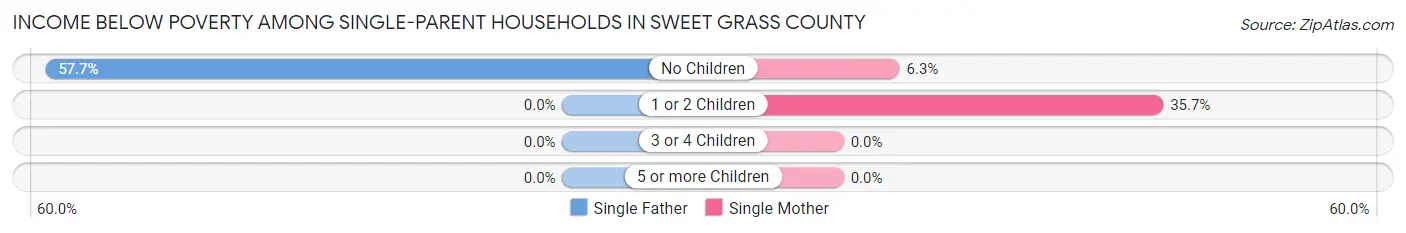
| Children | Single Father | Single Mother |
| No Children | 15 (57.7%) | 2 (6.2%) |
| 1 or 2 Children | 0 (0.0%) | 10 (35.7%) |
| 3 or 4 Children | 0 (0.0%) | 0 (0.0%) |
| 5 or more Children | 0 (0.0%) | 0 (0.0%) |
| Total | 15 (31.9%) | 12 (20.0%) |
Income Below Poverty Among Married-Couple vs Single-Parent Households in Sweet Grass County
The poverty data for Sweet Grass County shows that 10 of the married-couple family households (1.1%) and 27 of the single-parent households (25.2%) are living below the poverty level. Within the married-couple family households, those with no children have the highest poverty rate, with 10 households (1.8%) falling below the poverty line. Among the single-parent households, those with no children have the highest poverty rate, with 17 household (29.3%) living below poverty.
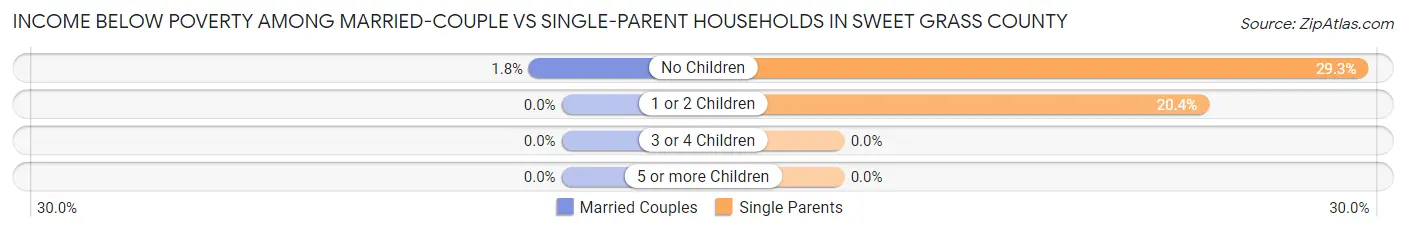
| Children | Married-Couple Families | Single-Parent Households |
| No Children | 10 (1.8%) | 17 (29.3%) |
| 1 or 2 Children | 0 (0.0%) | 10 (20.4%) |
| 3 or 4 Children | 0 (0.0%) | 0 (0.0%) |
| 5 or more Children | 0 (0.0%) | 0 (0.0%) |
| Total | 10 (1.1%) | 27 (25.2%) |
Employment Characteristics in Sweet Grass County
Employment by Class of Employer in Sweet Grass County
Among the 1,793 employed individuals in Sweet Grass County, private company employees (951 | 53.0%), self-employed (not incorporated) (243 | 13.6%), and self-employed (incorporated) (216 | 12.0%) make up the most common classes of employment.
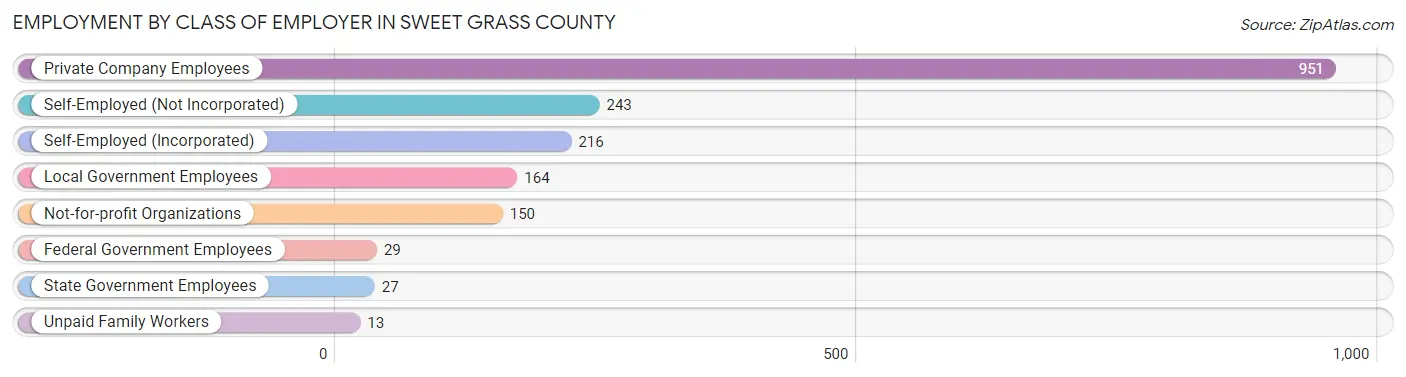
| Employer Class | # Employees | % Employees |
| Private Company Employees | 951 | 53.0% |
| Self-Employed (Incorporated) | 216 | 12.0% |
| Self-Employed (Not Incorporated) | 243 | 13.6% |
| Not-for-profit Organizations | 150 | 8.4% |
| Local Government Employees | 164 | 9.1% |
| State Government Employees | 27 | 1.5% |
| Federal Government Employees | 29 | 1.6% |
| Unpaid Family Workers | 13 | 0.7% |
| Total | 1,793 | 100.0% |
Employment Status by Age in Sweet Grass County
According to the labor force statistics for Sweet Grass County, out of the total population over 16 years of age (3,047), 62.1% or 1,892 individuals are in the labor force, with 2.1% or 40 of them unemployed. The age group with the highest labor force participation rate is 45 to 54 years, with 94.9% or 351 individuals in the labor force. Within the labor force, the 16 to 19 years age range has the highest percentage of unemployed individuals, with 17.1% or 21 of them being unemployed.
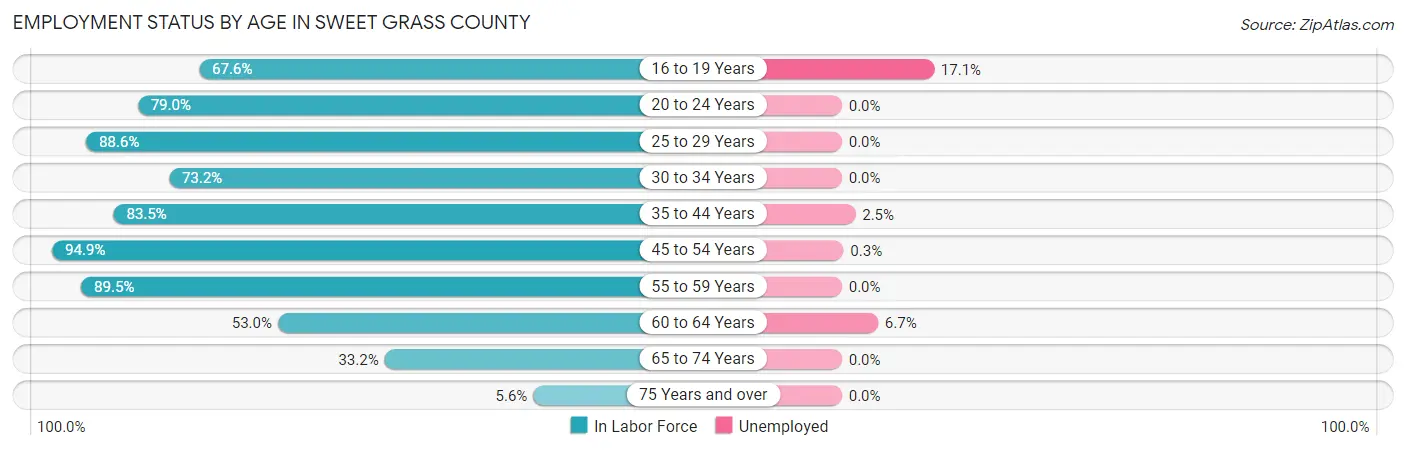
| Age Bracket | In Labor Force | Unemployed |
| 16 to 19 Years | 123 (67.6%) | 21 (17.1%) |
| 20 to 24 Years | 215 (79.0%) | 0 (0.0%) |
| 25 to 29 Years | 171 (88.6%) | 0 (0.0%) |
| 30 to 34 Years | 150 (73.2%) | 0 (0.0%) |
| 35 to 44 Years | 330 (83.5%) | 8 (2.5%) |
| 45 to 54 Years | 351 (94.9%) | 1 (0.3%) |
| 55 to 59 Years | 213 (89.5%) | 0 (0.0%) |
| 60 to 64 Years | 150 (53.0%) | 10 (6.7%) |
| 65 to 74 Years | 166 (33.2%) | 0 (0.0%) |
| 75 Years and over | 23 (5.6%) | 0 (0.0%) |
| Total | 1,892 (62.1%) | 40 (2.1%) |
Employment Status by Educational Attainment in Sweet Grass County
According to labor force statistics for Sweet Grass County, 81.1% of individuals (1,366) out of the total population between 25 and 64 years of age (1,684) are in the labor force, with 1.4% or 19 of them being unemployed. The group with the highest labor force participation rate are those with the educational attainment of high school diploma, with 84.8% or 523 individuals in the labor force. Within the labor force, individuals with college / associate degree education have the highest percentage of unemployment, with 1.9% or 10 of them being unemployed.
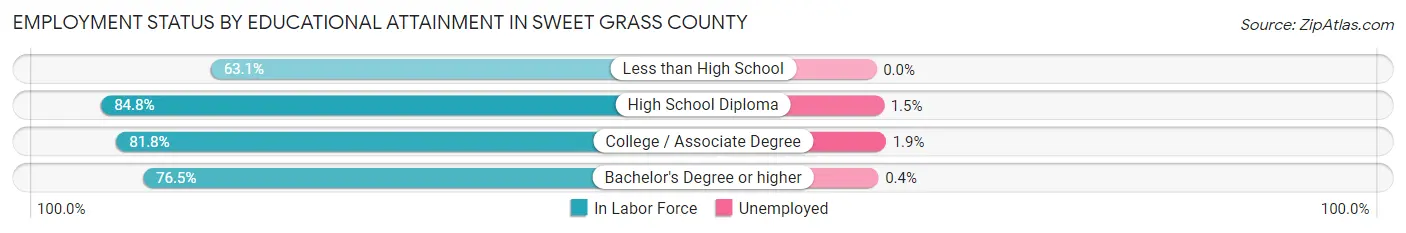
| Educational Attainment | In Labor Force | Unemployed |
| Less than High School | 41 (63.1%) | 0 (0.0%) |
| High School Diploma | 523 (84.8%) | 9 (1.5%) |
| College / Associate Degree | 527 (81.8%) | 12 (1.9%) |
| Bachelor's Degree or higher | 274 (76.5%) | 1 (0.4%) |
| Total | 1,366 (81.1%) | 24 (1.4%) |
Employment Occupations by Sex in Sweet Grass County
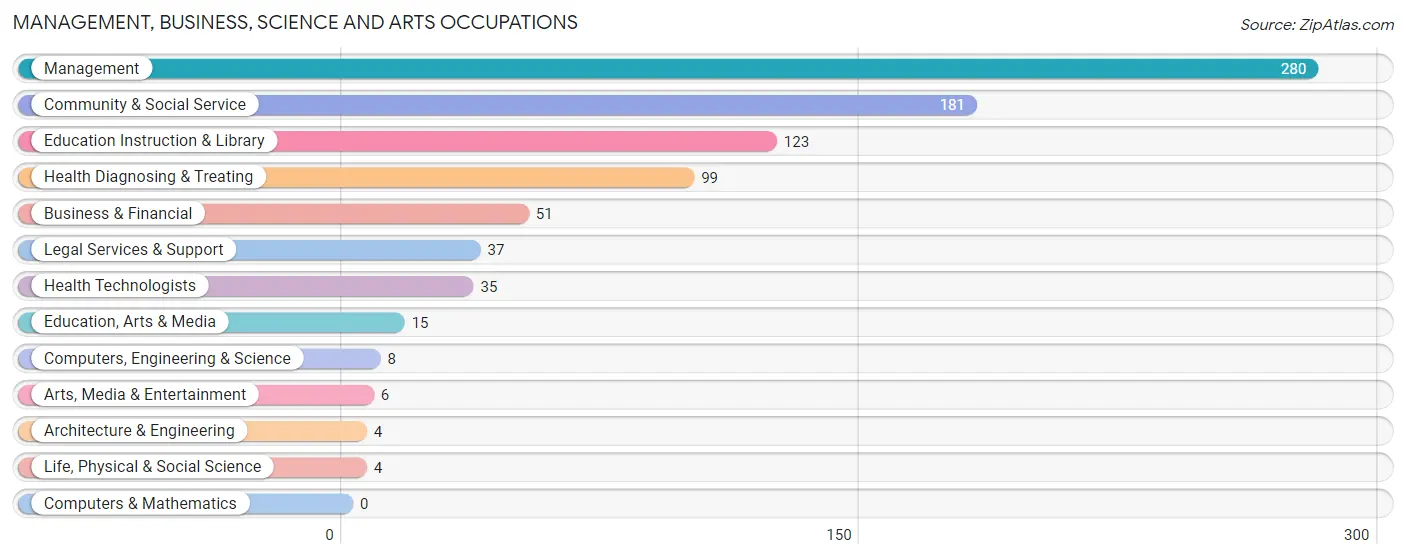
Management, Business, Science and Arts Occupations
The most common Management, Business, Science and Arts occupations in Sweet Grass County are Management (280 | 15.1%), Community & Social Service (181 | 9.8%), Education Instruction & Library (123 | 6.7%), Health Diagnosing & Treating (99 | 5.4%), and Business & Financial (51 | 2.8%).
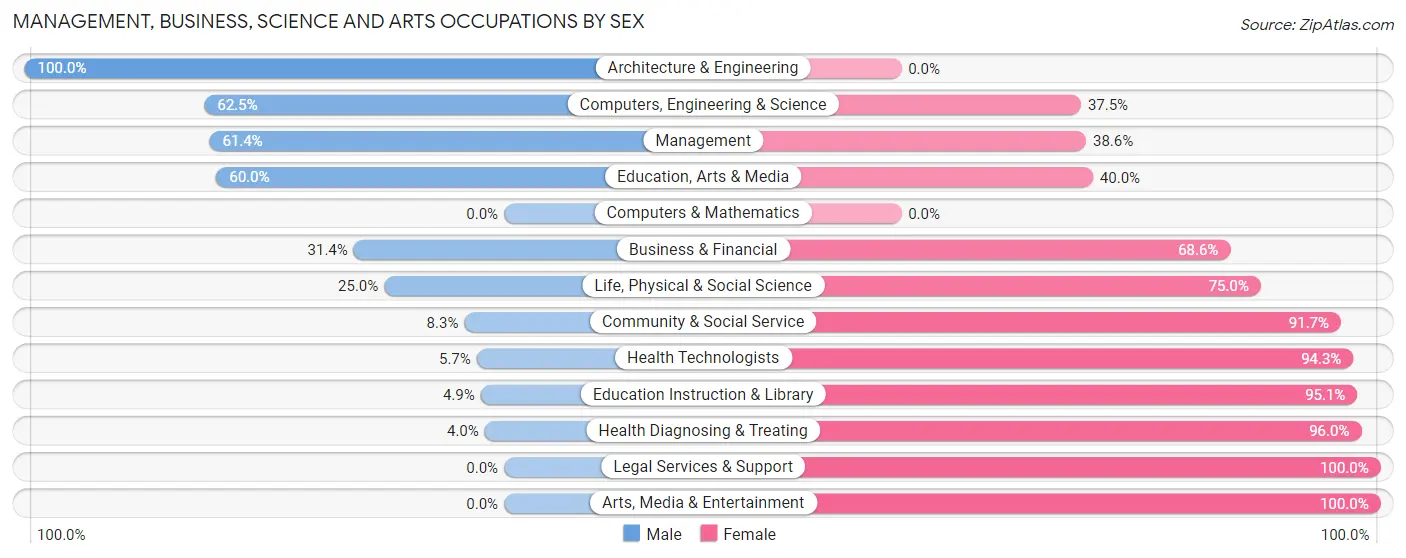
Management, Business, Science and Arts Occupations by Sex
Within the Management, Business, Science and Arts occupations in Sweet Grass County, the most male-oriented occupations are Architecture & Engineering (100.0%), Computers, Engineering & Science (62.5%), and Management (61.4%), while the most female-oriented occupations are Legal Services & Support (100.0%), Arts, Media & Entertainment (100.0%), and Health Diagnosing & Treating (96.0%).
| Occupation | Male | Female |
| Management | 172 (61.4%) | 108 (38.6%) |
| Business & Financial | 16 (31.4%) | 35 (68.6%) |
| Computers, Engineering & Science | 5 (62.5%) | 3 (37.5%) |
| Computers & Mathematics | 0 (0.0%) | 0 (0.0%) |
| Architecture & Engineering | 4 (100.0%) | 0 (0.0%) |
| Life, Physical & Social Science | 1 (25.0%) | 3 (75.0%) |
| Community & Social Service | 15 (8.3%) | 166 (91.7%) |
| Education, Arts & Media | 9 (60.0%) | 6 (40.0%) |
| Legal Services & Support | 0 (0.0%) | 37 (100.0%) |
| Education Instruction & Library | 6 (4.9%) | 117 (95.1%) |
| Arts, Media & Entertainment | 0 (0.0%) | 6 (100.0%) |
| Health Diagnosing & Treating | 4 (4.0%) | 95 (96.0%) |
| Health Technologists | 2 (5.7%) | 33 (94.3%) |
| Total (Category) | 212 (34.3%) | 407 (65.7%) |
| Total (Overall) | 1,015 (54.9%) | 833 (45.1%) |
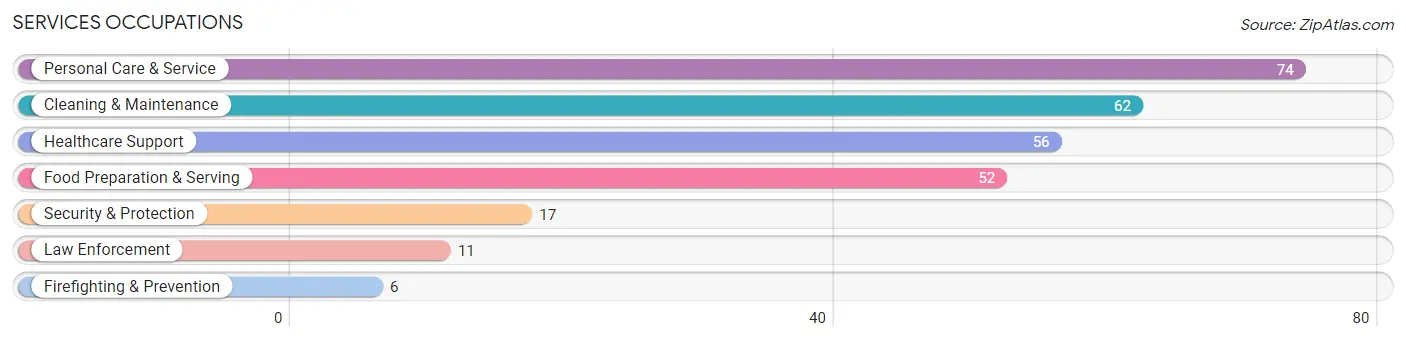
Services Occupations
The most common Services occupations in Sweet Grass County are Personal Care & Service (74 | 4.0%), Cleaning & Maintenance (62 | 3.4%), Healthcare Support (56 | 3.0%), Food Preparation & Serving (52 | 2.8%), and Security & Protection (17 | 0.9%).
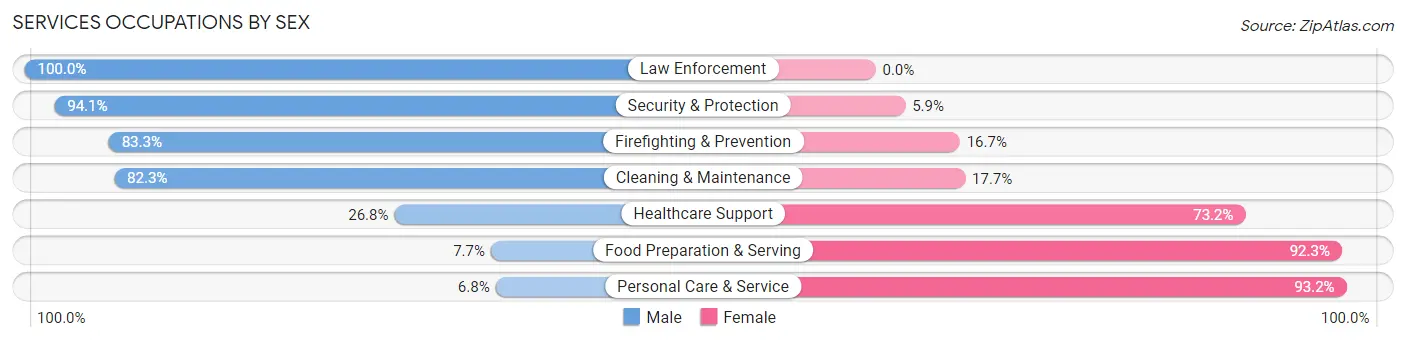
Services Occupations by Sex
Within the Services occupations in Sweet Grass County, the most male-oriented occupations are Law Enforcement (100.0%), Security & Protection (94.1%), and Firefighting & Prevention (83.3%), while the most female-oriented occupations are Personal Care & Service (93.2%), Food Preparation & Serving (92.3%), and Healthcare Support (73.2%).
| Occupation | Male | Female |
| Healthcare Support | 15 (26.8%) | 41 (73.2%) |
| Security & Protection | 16 (94.1%) | 1 (5.9%) |
| Firefighting & Prevention | 5 (83.3%) | 1 (16.7%) |
| Law Enforcement | 11 (100.0%) | 0 (0.0%) |
| Food Preparation & Serving | 4 (7.7%) | 48 (92.3%) |
| Cleaning & Maintenance | 51 (82.3%) | 11 (17.7%) |
| Personal Care & Service | 5 (6.8%) | 69 (93.2%) |
| Total (Category) | 91 (34.9%) | 170 (65.1%) |
| Total (Overall) | 1,015 (54.9%) | 833 (45.1%) |
Sales and Office Occupations
The most common Sales and Office occupations in Sweet Grass County are Sales & Related (135 | 7.3%), and Office & Administration (112 | 6.1%).
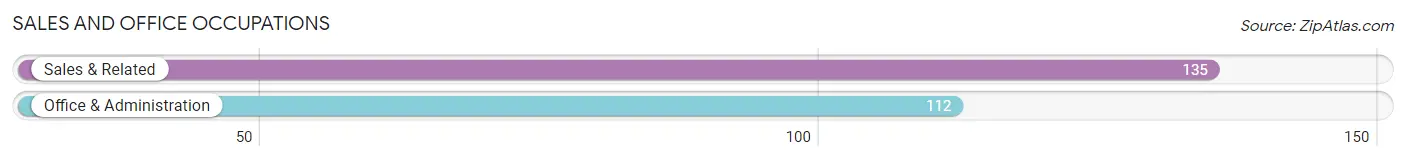
Sales and Office Occupations by Sex
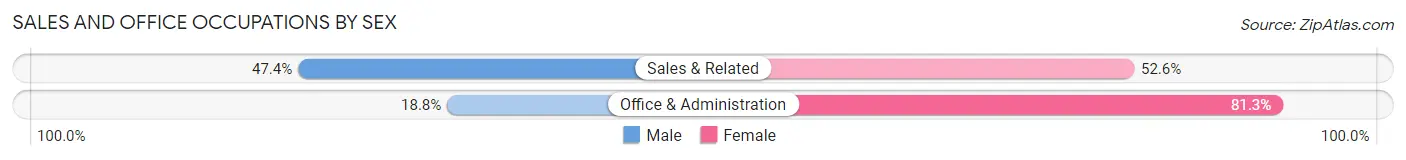
| Occupation | Male | Female |
| Sales & Related | 64 (47.4%) | 71 (52.6%) |
| Office & Administration | 21 (18.8%) | 91 (81.2%) |
| Total (Category) | 85 (34.4%) | 162 (65.6%) |
| Total (Overall) | 1,015 (54.9%) | 833 (45.1%) |
Natural Resources, Construction and Maintenance Occupations
The most common Natural Resources, Construction and Maintenance occupations in Sweet Grass County are Construction & Extraction (311 | 16.8%), Farming, Fishing & Forestry (103 | 5.6%), and Installation, Maintenance & Repair (69 | 3.7%).
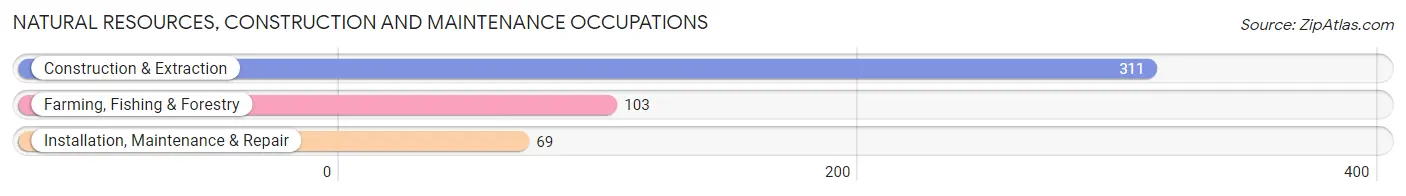
Natural Resources, Construction and Maintenance Occupations by Sex
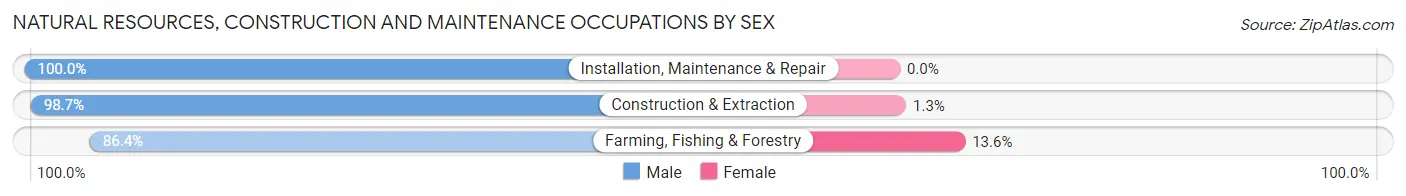
| Occupation | Male | Female |
| Farming, Fishing & Forestry | 89 (86.4%) | 14 (13.6%) |
| Construction & Extraction | 307 (98.7%) | 4 (1.3%) |
| Installation, Maintenance & Repair | 69 (100.0%) | 0 (0.0%) |
| Total (Category) | 465 (96.3%) | 18 (3.7%) |
| Total (Overall) | 1,015 (54.9%) | 833 (45.1%) |
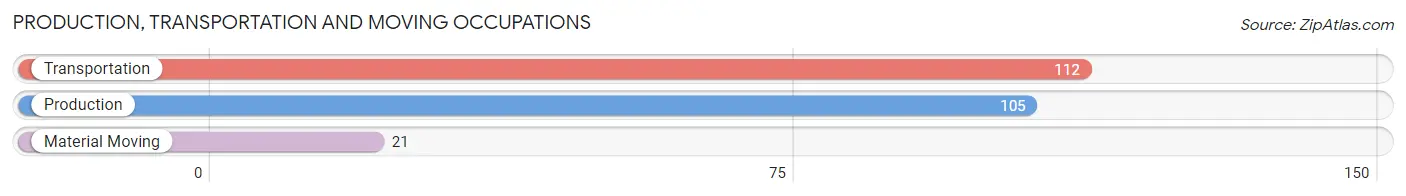
Production, Transportation and Moving Occupations
The most common Production, Transportation and Moving occupations in Sweet Grass County are Transportation (112 | 6.1%), Production (105 | 5.7%), and Material Moving (21 | 1.1%).
Production, Transportation and Moving Occupations by Sex
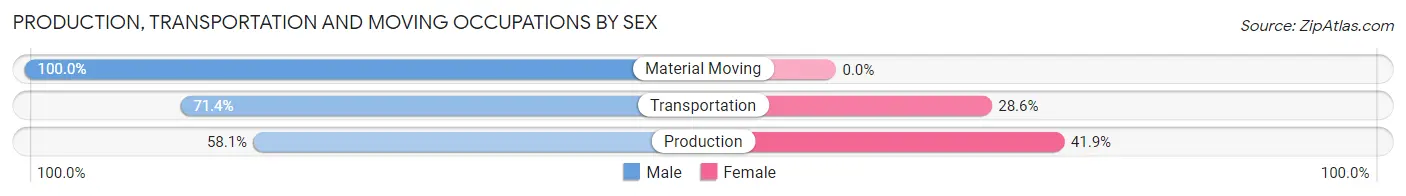
| Occupation | Male | Female |
| Production | 61 (58.1%) | 44 (41.9%) |
| Transportation | 80 (71.4%) | 32 (28.6%) |
| Material Moving | 21 (100.0%) | 0 (0.0%) |
| Total (Category) | 162 (68.1%) | 76 (31.9%) |
| Total (Overall) | 1,015 (54.9%) | 833 (45.1%) |
Employment Industries by Sex in Sweet Grass County
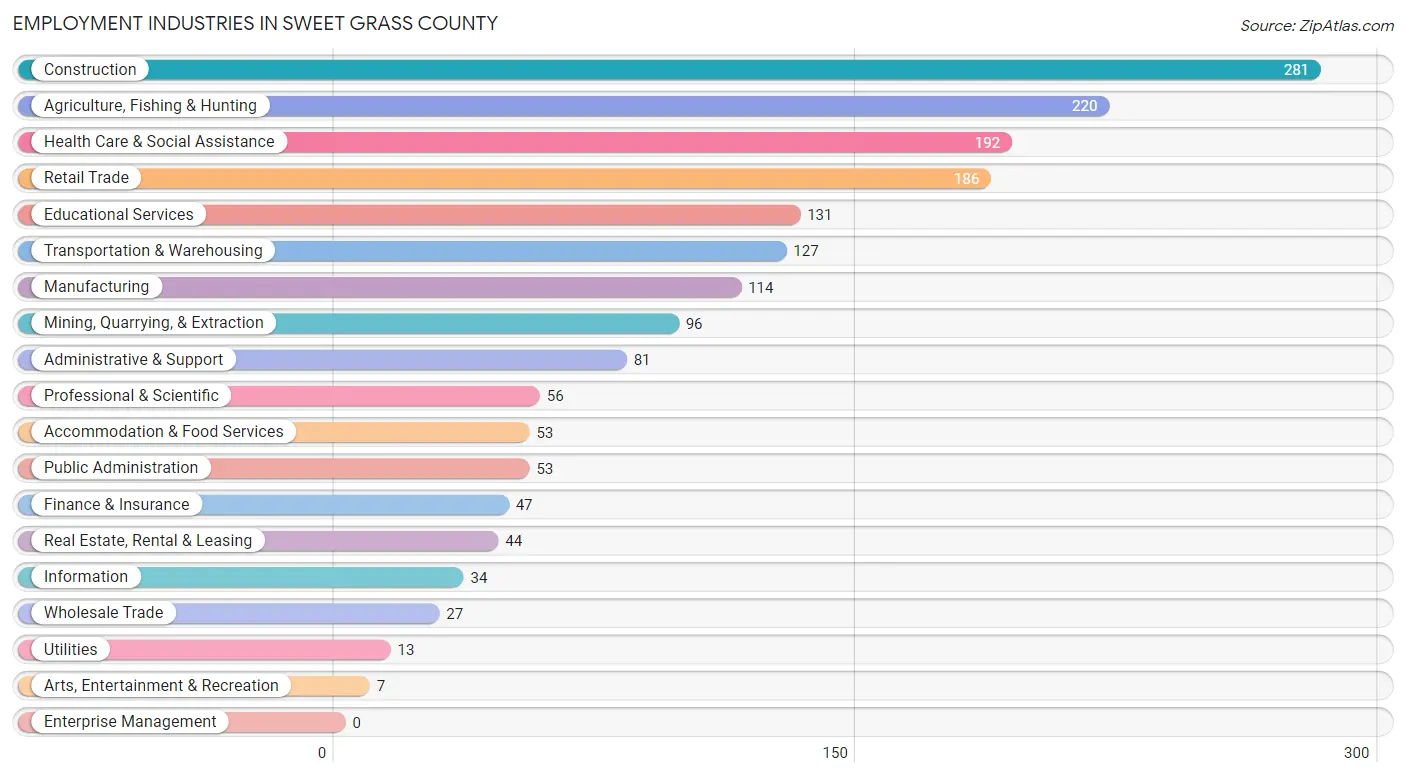
Employment Industries in Sweet Grass County
The major employment industries in Sweet Grass County include Construction (281 | 15.2%), Agriculture, Fishing & Hunting (220 | 11.9%), Health Care & Social Assistance (192 | 10.4%), Retail Trade (186 | 10.1%), and Educational Services (131 | 7.1%).
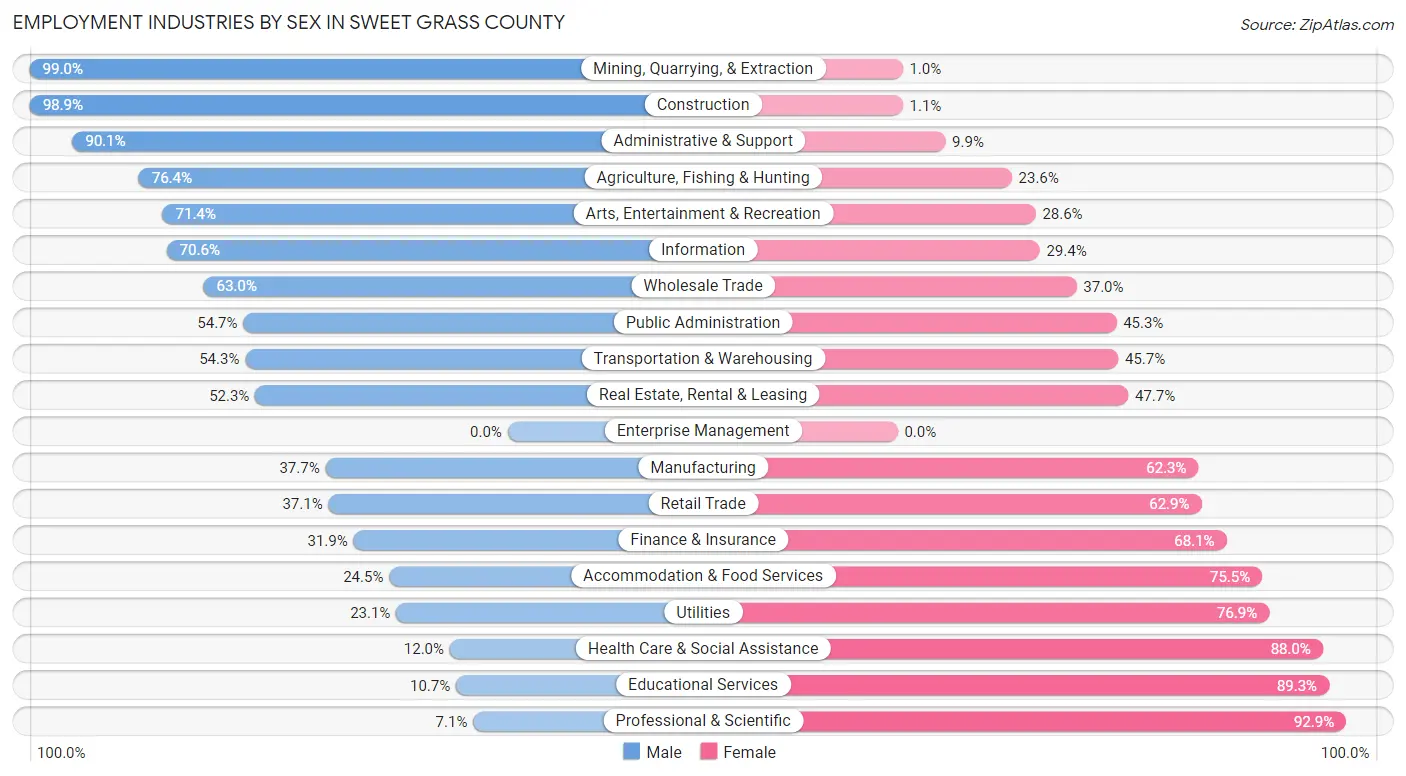
Employment Industries by Sex in Sweet Grass County
The Sweet Grass County industries that see more men than women are Mining, Quarrying, & Extraction (99.0%), Construction (98.9%), and Administrative & Support (90.1%), whereas the industries that tend to have a higher number of women are Professional & Scientific (92.9%), Educational Services (89.3%), and Health Care & Social Assistance (88.0%).
| Industry | Male | Female |
| Agriculture, Fishing & Hunting | 168 (76.4%) | 52 (23.6%) |
| Mining, Quarrying, & Extraction | 95 (99.0%) | 1 (1.0%) |
| Construction | 278 (98.9%) | 3 (1.1%) |
| Manufacturing | 43 (37.7%) | 71 (62.3%) |
| Wholesale Trade | 17 (63.0%) | 10 (37.0%) |
| Retail Trade | 69 (37.1%) | 117 (62.9%) |
| Transportation & Warehousing | 69 (54.3%) | 58 (45.7%) |
| Utilities | 3 (23.1%) | 10 (76.9%) |
| Information | 24 (70.6%) | 10 (29.4%) |
| Finance & Insurance | 15 (31.9%) | 32 (68.1%) |
| Real Estate, Rental & Leasing | 23 (52.3%) | 21 (47.7%) |
| Professional & Scientific | 4 (7.1%) | 52 (92.9%) |
| Enterprise Management | 0 (0.0%) | 0 (0.0%) |
| Administrative & Support | 73 (90.1%) | 8 (9.9%) |
| Educational Services | 14 (10.7%) | 117 (89.3%) |
| Health Care & Social Assistance | 23 (12.0%) | 169 (88.0%) |
| Arts, Entertainment & Recreation | 5 (71.4%) | 2 (28.6%) |
| Accommodation & Food Services | 13 (24.5%) | 40 (75.5%) |
| Public Administration | 29 (54.7%) | 24 (45.3%) |
| Total | 1,015 (54.9%) | 833 (45.1%) |
Education in Sweet Grass County
School Enrollment in Sweet Grass County
The most common levels of schooling among the 776 students in Sweet Grass County are high school (228 | 29.4%), middle school (167 | 21.5%), and college / undergraduate (130 | 16.8%).
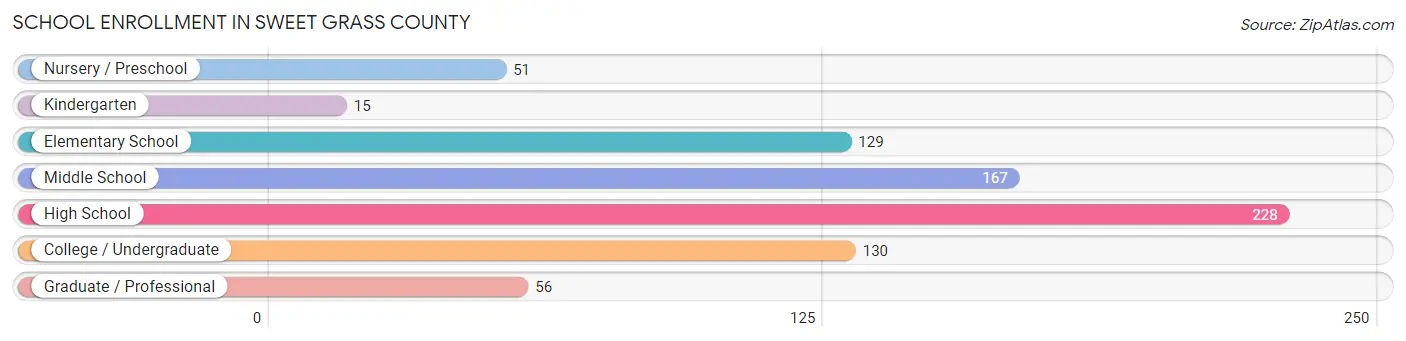
| School Level | # Students | % Students |
| Nursery / Preschool | 51 | 6.6% |
| Kindergarten | 15 | 1.9% |
| Elementary School | 129 | 16.6% |
| Middle School | 167 | 21.5% |
| High School | 228 | 29.4% |
| College / Undergraduate | 130 | 16.8% |
| Graduate / Professional | 56 | 7.2% |
| Total | 776 | 100.0% |
School Enrollment by Age by Funding Source in Sweet Grass County
Out of a total of 776 students who are enrolled in schools in Sweet Grass County, 164 (21.1%) attend a private institution, while the remaining 612 (78.9%) are enrolled in public schools. The age group of 25 to 34 year olds has the highest likelihood of being enrolled in private schools, with 36 (38.3% in the age bracket) enrolled. Conversely, the age group of 20 to 24 year olds has the lowest likelihood of being enrolled in a private school, with 30 (100.0% in the age bracket) attending a public institution.
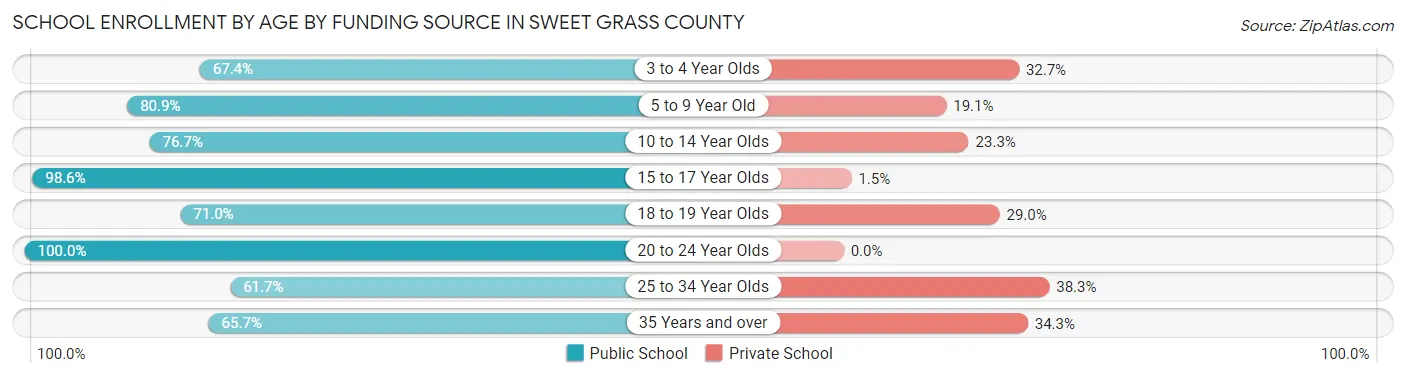
| Age Bracket | Public School | Private School |
| 3 to 4 Year Olds | 33 (67.3%) | 16 (32.7%) |
| 5 to 9 Year Old | 110 (80.9%) | 26 (19.1%) |
| 10 to 14 Year Olds | 178 (76.7%) | 54 (23.3%) |
| 15 to 17 Year Olds | 136 (98.6%) | 2 (1.5%) |
| 18 to 19 Year Olds | 44 (71.0%) | 18 (29.0%) |
| 20 to 24 Year Olds | 30 (100.0%) | 0 (0.0%) |
| 25 to 34 Year Olds | 58 (61.7%) | 36 (38.3%) |
| 35 Years and over | 23 (65.7%) | 12 (34.3%) |
| Total | 612 (78.9%) | 164 (21.1%) |
Educational Attainment by Field of Study in Sweet Grass County
Education (145 | 22.2%), bio, nature & agricultural (120 | 18.4%), business (103 | 15.8%), psychology (61 | 9.3%), and arts & humanities (49 | 7.5%) are the most common fields of study among 653 individuals in Sweet Grass County who have obtained a bachelor's degree or higher.
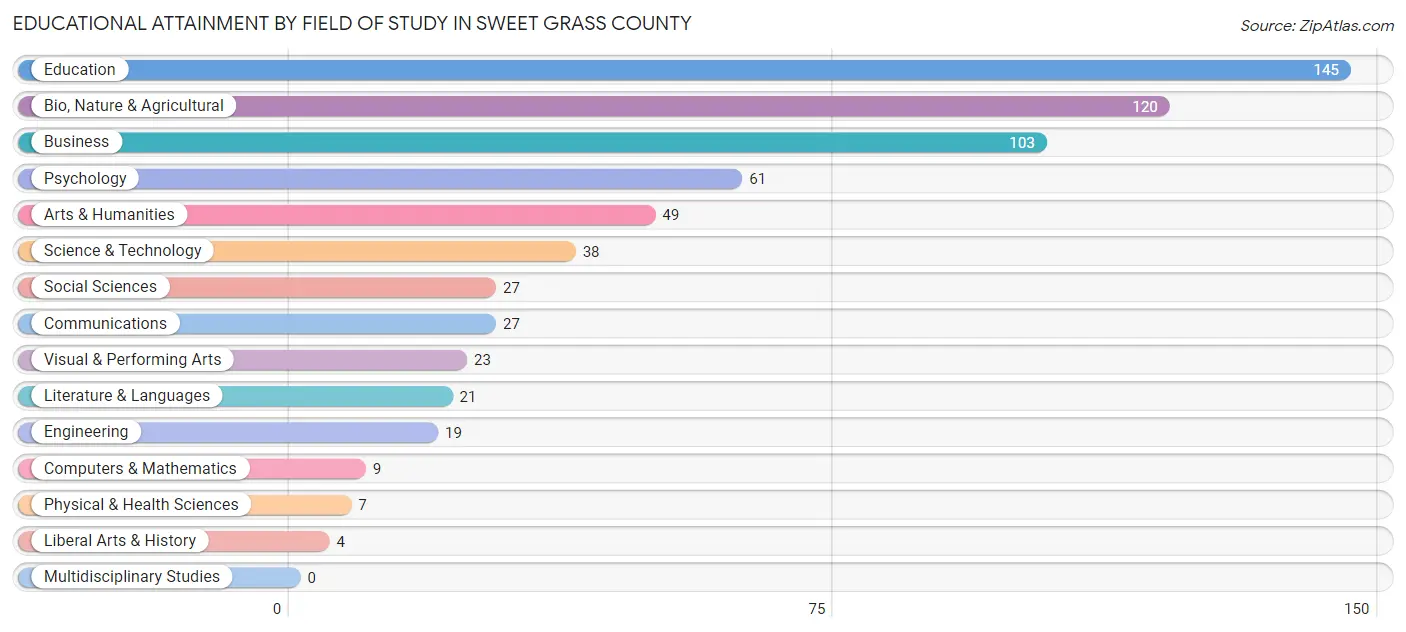
| Field of Study | # Graduates | % Graduates |
| Computers & Mathematics | 9 | 1.4% |
| Bio, Nature & Agricultural | 120 | 18.4% |
| Physical & Health Sciences | 7 | 1.1% |
| Psychology | 61 | 9.3% |
| Social Sciences | 27 | 4.1% |
| Engineering | 19 | 2.9% |
| Multidisciplinary Studies | 0 | 0.0% |
| Science & Technology | 38 | 5.8% |
| Business | 103 | 15.8% |
| Education | 145 | 22.2% |
| Literature & Languages | 21 | 3.2% |
| Liberal Arts & History | 4 | 0.6% |
| Visual & Performing Arts | 23 | 3.5% |
| Communications | 27 | 4.1% |
| Arts & Humanities | 49 | 7.5% |
| Total | 653 | 100.0% |
Transportation & Commute in Sweet Grass County
Vehicle Availability by Sex in Sweet Grass County
The most prevalent vehicle ownership categories in Sweet Grass County are males with 2 vehicles (291, accounting for 28.9%) and females with 2 vehicles (212, making up 37.1%).
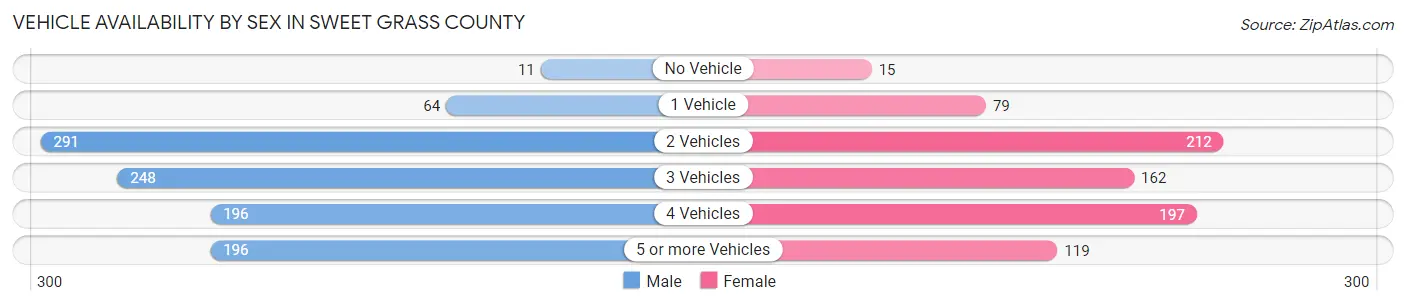
| Vehicles Available | Male | Female |
| No Vehicle | 11 (1.1%) | 15 (1.9%) |
| 1 Vehicle | 64 (6.4%) | 79 (10.1%) |
| 2 Vehicles | 291 (28.9%) | 212 (27.0%) |
| 3 Vehicles | 248 (24.6%) | 162 (20.7%) |
| 4 Vehicles | 196 (19.5%) | 197 (25.1%) |
| 5 or more Vehicles | 196 (19.5%) | 119 (15.2%) |
| Total | 1,006 (100.0%) | 784 (100.0%) |
Commute Time in Sweet Grass County
The most frequently occuring commute durations in Sweet Grass County are less than 5 minutes (314 commuters, 19.2%), 5 to 9 minutes (306 commuters, 18.7%), and 15 to 19 minutes (195 commuters, 11.9%).
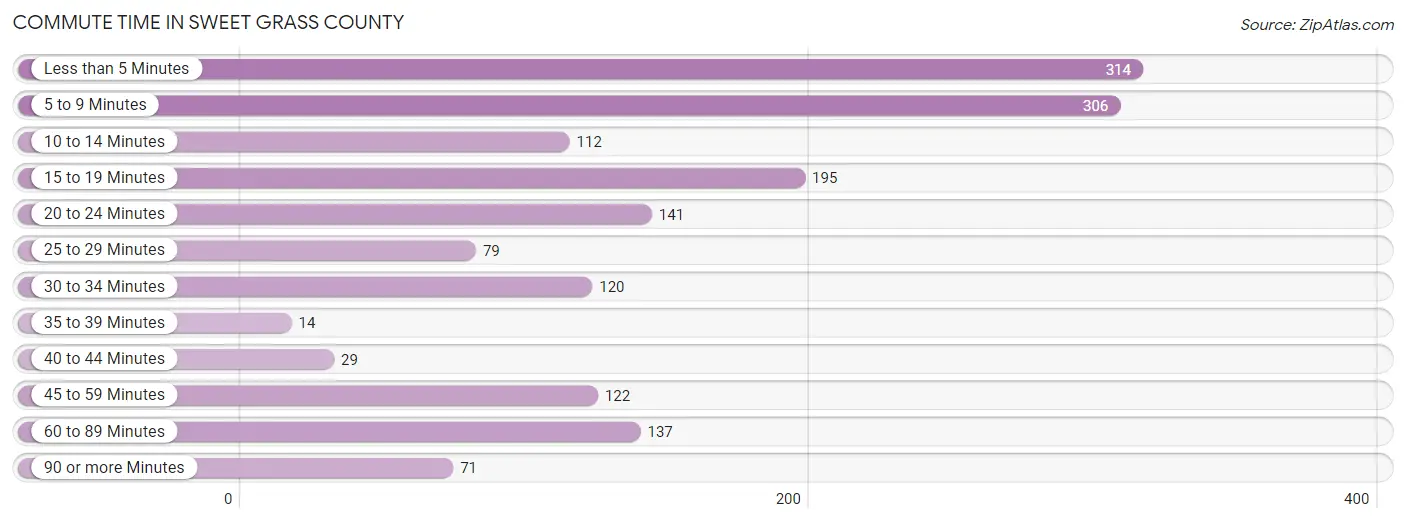
| Commute Time | # Commuters | % Commuters |
| Less than 5 Minutes | 314 | 19.2% |
| 5 to 9 Minutes | 306 | 18.7% |
| 10 to 14 Minutes | 112 | 6.8% |
| 15 to 19 Minutes | 195 | 11.9% |
| 20 to 24 Minutes | 141 | 8.6% |
| 25 to 29 Minutes | 79 | 4.8% |
| 30 to 34 Minutes | 120 | 7.3% |
| 35 to 39 Minutes | 14 | 0.9% |
| 40 to 44 Minutes | 29 | 1.8% |
| 45 to 59 Minutes | 122 | 7.4% |
| 60 to 89 Minutes | 137 | 8.4% |
| 90 or more Minutes | 71 | 4.3% |
Commute Time by Sex in Sweet Grass County
The most common commute times in Sweet Grass County are 5 to 9 minutes (182 commuters, 19.3%) for males and less than 5 minutes (195 commuters, 28.0%) for females.
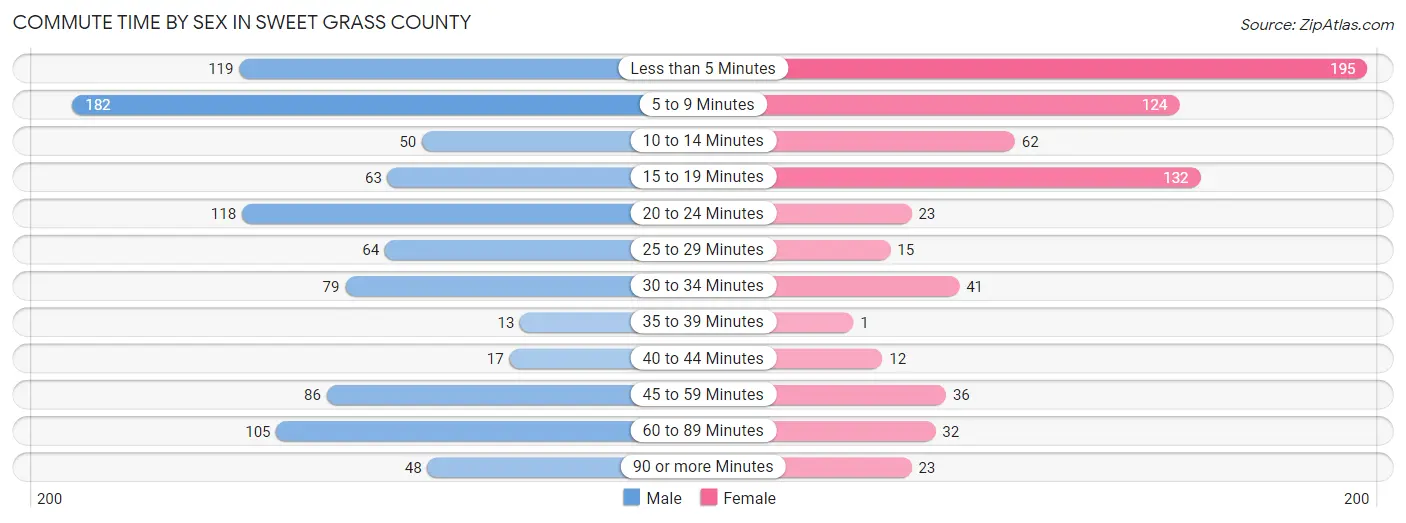
| Commute Time | Male | Female |
| Less than 5 Minutes | 119 (12.6%) | 195 (28.0%) |
| 5 to 9 Minutes | 182 (19.3%) | 124 (17.8%) |
| 10 to 14 Minutes | 50 (5.3%) | 62 (8.9%) |
| 15 to 19 Minutes | 63 (6.7%) | 132 (19.0%) |
| 20 to 24 Minutes | 118 (12.5%) | 23 (3.3%) |
| 25 to 29 Minutes | 64 (6.8%) | 15 (2.2%) |
| 30 to 34 Minutes | 79 (8.4%) | 41 (5.9%) |
| 35 to 39 Minutes | 13 (1.4%) | 1 (0.1%) |
| 40 to 44 Minutes | 17 (1.8%) | 12 (1.7%) |
| 45 to 59 Minutes | 86 (9.1%) | 36 (5.2%) |
| 60 to 89 Minutes | 105 (11.1%) | 32 (4.6%) |
| 90 or more Minutes | 48 (5.1%) | 23 (3.3%) |
Time of Departure to Work by Sex in Sweet Grass County
The most frequent times of departure to work in Sweet Grass County are 7:00 AM to 7:29 AM (171, 18.1%) for males and 7:30 AM to 7:59 AM (154, 22.1%) for females.
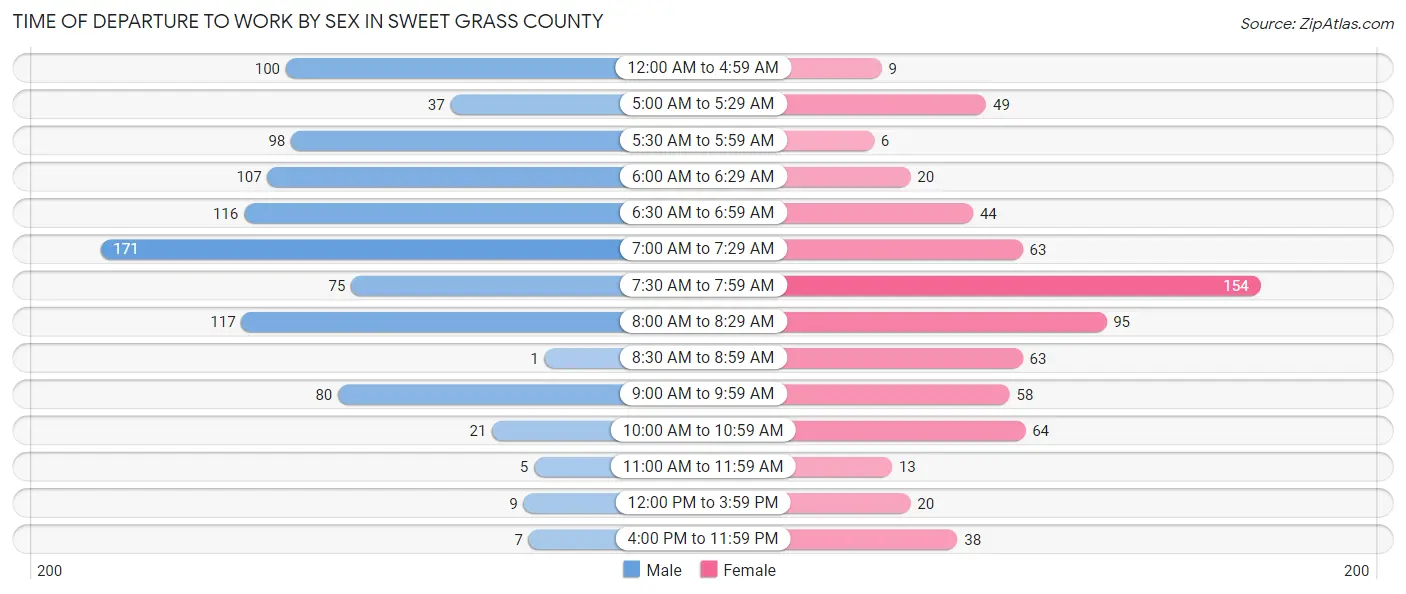
| Time of Departure | Male | Female |
| 12:00 AM to 4:59 AM | 100 (10.6%) | 9 (1.3%) |
| 5:00 AM to 5:29 AM | 37 (3.9%) | 49 (7.0%) |
| 5:30 AM to 5:59 AM | 98 (10.4%) | 6 (0.9%) |
| 6:00 AM to 6:29 AM | 107 (11.3%) | 20 (2.9%) |
| 6:30 AM to 6:59 AM | 116 (12.3%) | 44 (6.3%) |
| 7:00 AM to 7:29 AM | 171 (18.1%) | 63 (9.0%) |
| 7:30 AM to 7:59 AM | 75 (7.9%) | 154 (22.1%) |
| 8:00 AM to 8:29 AM | 117 (12.4%) | 95 (13.7%) |
| 8:30 AM to 8:59 AM | 1 (0.1%) | 63 (9.0%) |
| 9:00 AM to 9:59 AM | 80 (8.5%) | 58 (8.3%) |
| 10:00 AM to 10:59 AM | 21 (2.2%) | 64 (9.2%) |
| 11:00 AM to 11:59 AM | 5 (0.5%) | 13 (1.9%) |
| 12:00 PM to 3:59 PM | 9 (0.9%) | 20 (2.9%) |
| 4:00 PM to 11:59 PM | 7 (0.7%) | 38 (5.5%) |
| Total | 944 (100.0%) | 696 (100.0%) |
Housing Occupancy in Sweet Grass County
Occupancy by Ownership in Sweet Grass County
Of the total 1,446 dwellings in Sweet Grass County, owner-occupied units account for 1,103 (76.3%), while renter-occupied units make up 343 (23.7%).
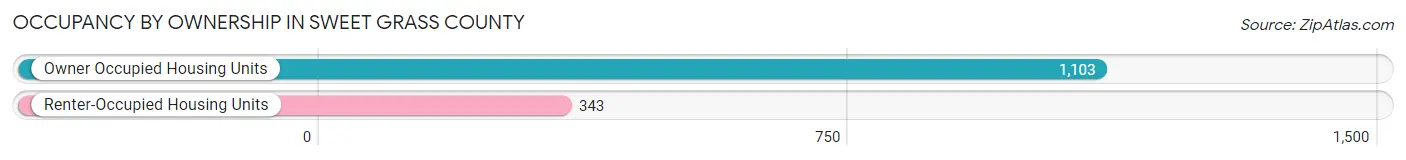
| Occupancy | # Housing Units | % Housing Units |
| Owner Occupied Housing Units | 1,103 | 76.3% |
| Renter-Occupied Housing Units | 343 | 23.7% |
| Total Occupied Housing Units | 1,446 | 100.0% |
Occupancy by Household Size in Sweet Grass County
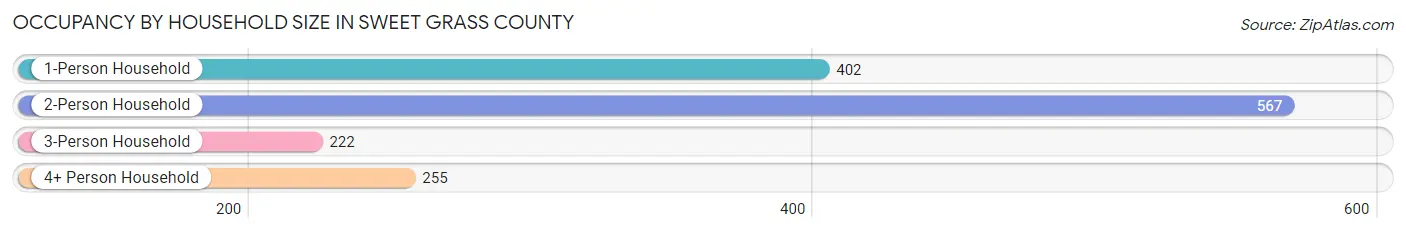
| Household Size | # Housing Units | % Housing Units |
| 1-Person Household | 402 | 27.8% |
| 2-Person Household | 567 | 39.2% |
| 3-Person Household | 222 | 15.3% |
| 4+ Person Household | 255 | 17.6% |
| Total Housing Units | 1,446 | 100.0% |
Occupancy by Ownership by Household Size in Sweet Grass County
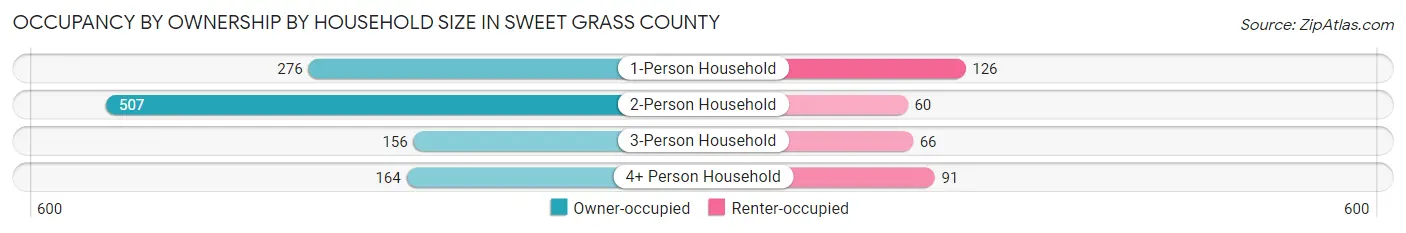
| Household Size | Owner-occupied | Renter-occupied |
| 1-Person Household | 276 (68.7%) | 126 (31.3%) |
| 2-Person Household | 507 (89.4%) | 60 (10.6%) |
| 3-Person Household | 156 (70.3%) | 66 (29.7%) |
| 4+ Person Household | 164 (64.3%) | 91 (35.7%) |
| Total Housing Units | 1,103 (76.3%) | 343 (23.7%) |
Occupancy by Educational Attainment in Sweet Grass County
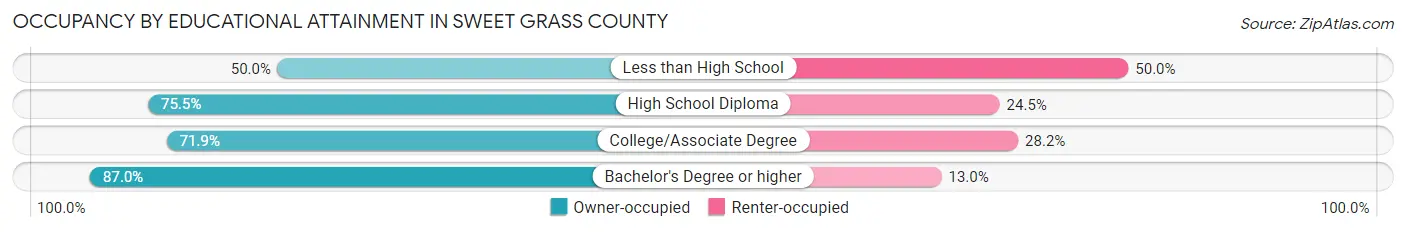
| Household Size | Owner-occupied | Renter-occupied |
| Less than High School | 25 (50.0%) | 25 (50.0%) |
| High School Diploma | 361 (75.5%) | 117 (24.5%) |
| College/Associate Degree | 388 (71.9%) | 152 (28.1%) |
| Bachelor's Degree or higher | 329 (87.0%) | 49 (13.0%) |
Occupancy by Age of Householder in Sweet Grass County
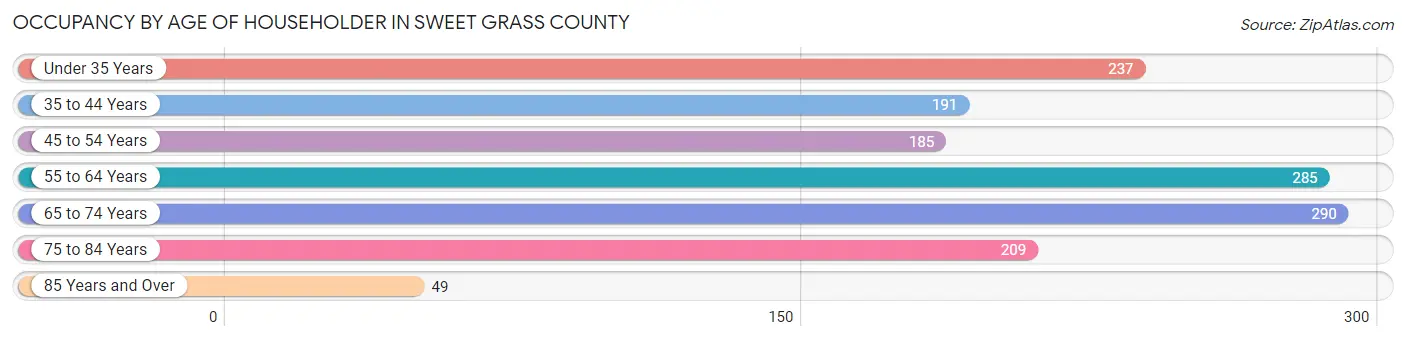
| Age Bracket | # Households | % Households |
| Under 35 Years | 237 | 16.4% |
| 35 to 44 Years | 191 | 13.2% |
| 45 to 54 Years | 185 | 12.8% |
| 55 to 64 Years | 285 | 19.7% |
| 65 to 74 Years | 290 | 20.1% |
| 75 to 84 Years | 209 | 14.4% |
| 85 Years and Over | 49 | 3.4% |
| Total | 1,446 | 100.0% |
Housing Finances in Sweet Grass County
Median Income by Occupancy in Sweet Grass County
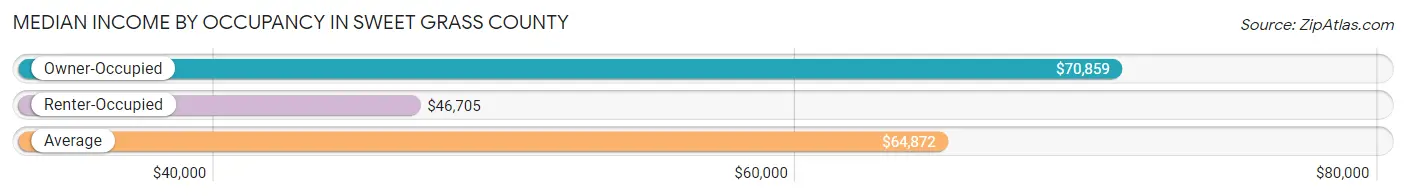
| Occupancy Type | # Households | Median Income |
| Owner-Occupied | 1,103 (76.3%) | $70,859 |
| Renter-Occupied | 343 (23.7%) | $46,705 |
| Average | 1,446 (100.0%) | $64,872 |
Occupancy by Householder Income Bracket in Sweet Grass County
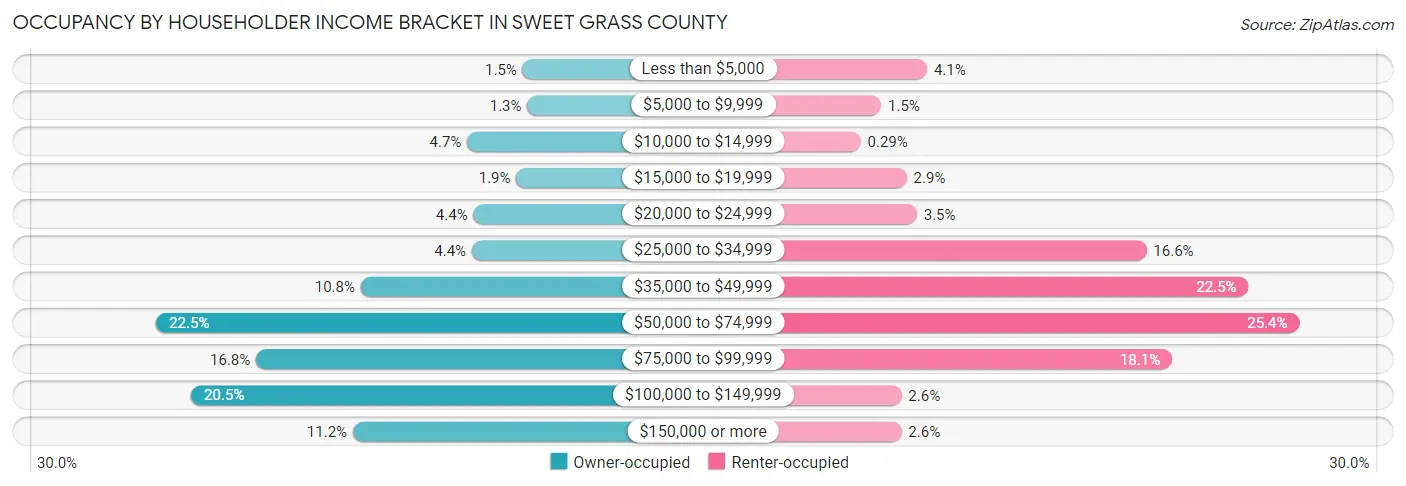
| Income Bracket | Owner-occupied | Renter-occupied |
| Less than $5,000 | 17 (1.5%) | 14 (4.1%) |
| $5,000 to $9,999 | 14 (1.3%) | 5 (1.5%) |
| $10,000 to $14,999 | 52 (4.7%) | 1 (0.3%) |
| $15,000 to $19,999 | 21 (1.9%) | 10 (2.9%) |
| $20,000 to $24,999 | 48 (4.3%) | 12 (3.5%) |
| $25,000 to $34,999 | 49 (4.4%) | 57 (16.6%) |
| $35,000 to $49,999 | 119 (10.8%) | 77 (22.5%) |
| $50,000 to $74,999 | 248 (22.5%) | 87 (25.4%) |
| $75,000 to $99,999 | 185 (16.8%) | 62 (18.1%) |
| $100,000 to $149,999 | 226 (20.5%) | 9 (2.6%) |
| $150,000 or more | 124 (11.2%) | 9 (2.6%) |
| Total | 1,103 (100.0%) | 343 (100.0%) |
Monthly Housing Cost Tiers in Sweet Grass County
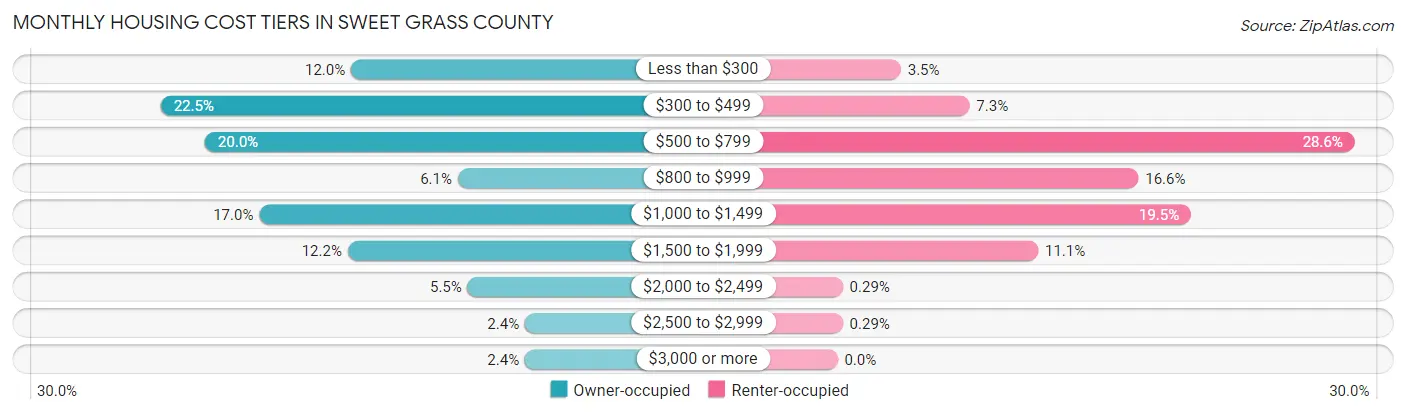
| Monthly Cost | Owner-occupied | Renter-occupied |
| Less than $300 | 132 (12.0%) | 12 (3.5%) |
| $300 to $499 | 248 (22.5%) | 25 (7.3%) |
| $500 to $799 | 221 (20.0%) | 98 (28.6%) |
| $800 to $999 | 67 (6.1%) | 57 (16.6%) |
| $1,000 to $1,499 | 188 (17.0%) | 67 (19.5%) |
| $1,500 to $1,999 | 134 (12.1%) | 38 (11.1%) |
| $2,000 to $2,499 | 61 (5.5%) | 1 (0.3%) |
| $2,500 to $2,999 | 26 (2.4%) | 1 (0.3%) |
| $3,000 or more | 26 (2.4%) | 0 (0.0%) |
| Total | 1,103 (100.0%) | 343 (100.0%) |
Physical Housing Characteristics in Sweet Grass County
Housing Structures in Sweet Grass County
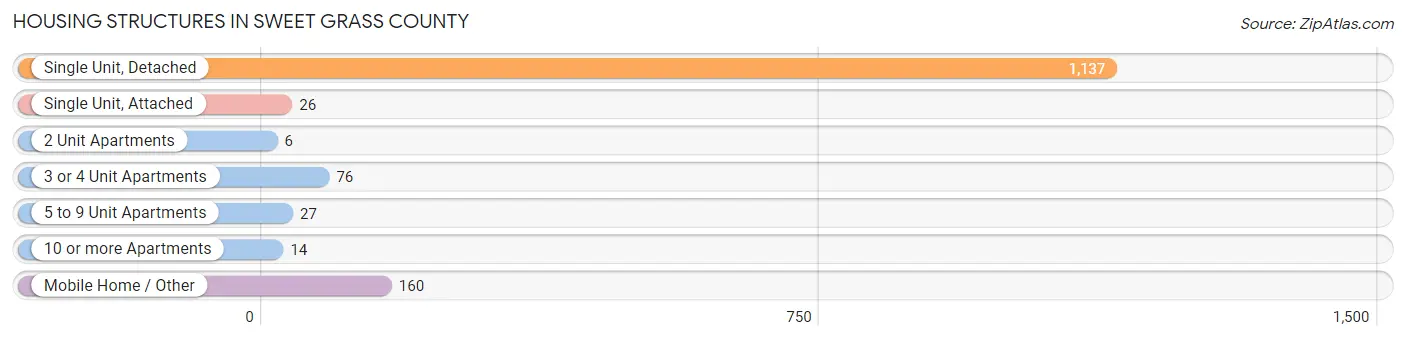
| Structure Type | # Housing Units | % Housing Units |
| Single Unit, Detached | 1,137 | 78.6% |
| Single Unit, Attached | 26 | 1.8% |
| 2 Unit Apartments | 6 | 0.4% |
| 3 or 4 Unit Apartments | 76 | 5.3% |
| 5 to 9 Unit Apartments | 27 | 1.9% |
| 10 or more Apartments | 14 | 1.0% |
| Mobile Home / Other | 160 | 11.1% |
| Total | 1,446 | 100.0% |
Housing Structures by Occupancy in Sweet Grass County
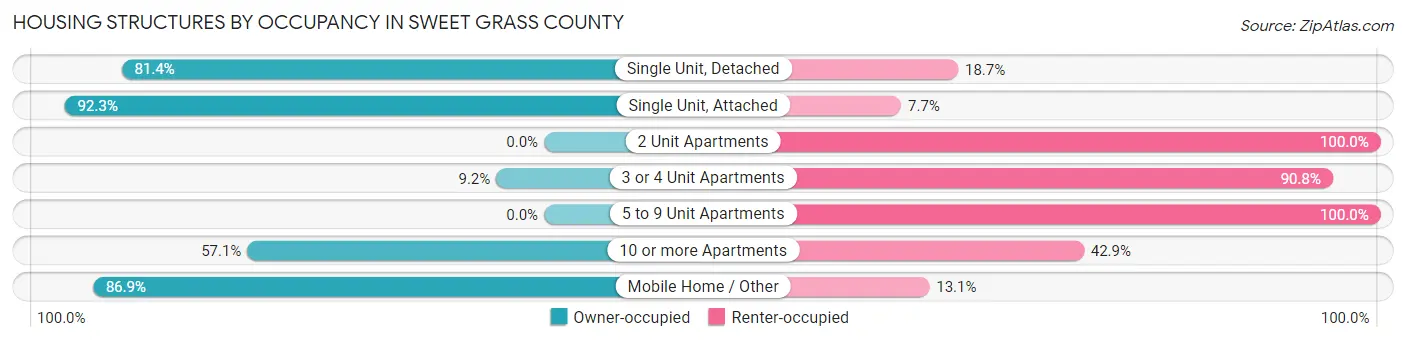
| Structure Type | Owner-occupied | Renter-occupied |
| Single Unit, Detached | 925 (81.4%) | 212 (18.6%) |
| Single Unit, Attached | 24 (92.3%) | 2 (7.7%) |
| 2 Unit Apartments | 0 (0.0%) | 6 (100.0%) |
| 3 or 4 Unit Apartments | 7 (9.2%) | 69 (90.8%) |
| 5 to 9 Unit Apartments | 0 (0.0%) | 27 (100.0%) |
| 10 or more Apartments | 8 (57.1%) | 6 (42.9%) |
| Mobile Home / Other | 139 (86.9%) | 21 (13.1%) |
| Total | 1,103 (76.3%) | 343 (23.7%) |
Housing Structures by Number of Rooms in Sweet Grass County
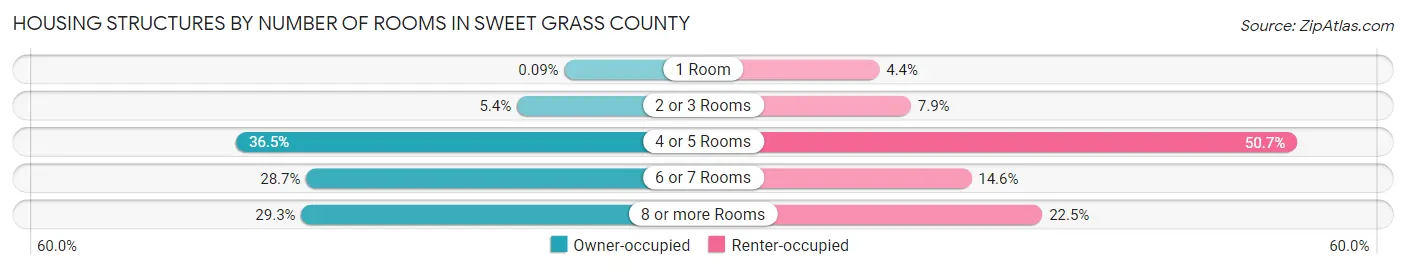
| Number of Rooms | Owner-occupied | Renter-occupied |
| 1 Room | 1 (0.1%) | 15 (4.4%) |
| 2 or 3 Rooms | 59 (5.3%) | 27 (7.9%) |
| 4 or 5 Rooms | 403 (36.5%) | 174 (50.7%) |
| 6 or 7 Rooms | 317 (28.7%) | 50 (14.6%) |
| 8 or more Rooms | 323 (29.3%) | 77 (22.5%) |
| Total | 1,103 (100.0%) | 343 (100.0%) |
Housing Structure by Heating Type in Sweet Grass County
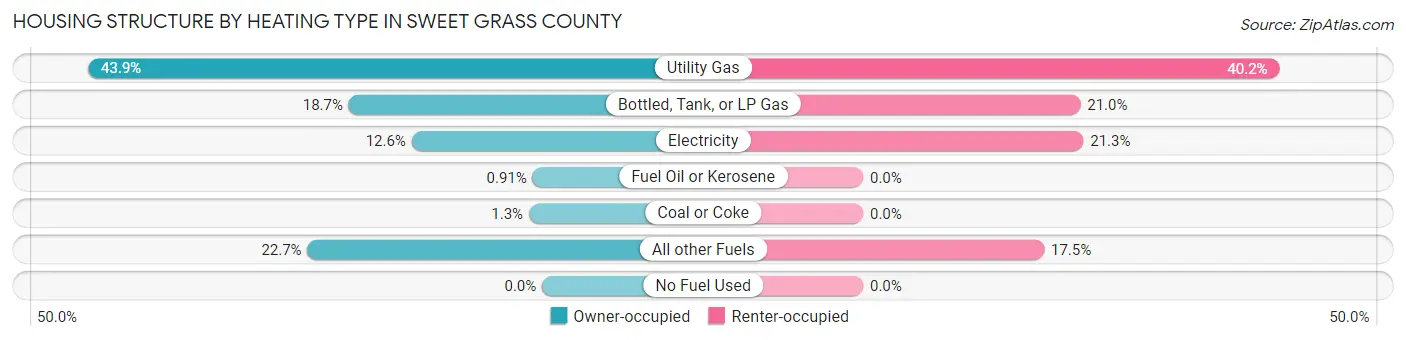
| Heating Type | Owner-occupied | Renter-occupied |
| Utility Gas | 484 (43.9%) | 138 (40.2%) |
| Bottled, Tank, or LP Gas | 206 (18.7%) | 72 (21.0%) |
| Electricity | 139 (12.6%) | 73 (21.3%) |
| Fuel Oil or Kerosene | 10 (0.9%) | 0 (0.0%) |
| Coal or Coke | 14 (1.3%) | 0 (0.0%) |
| All other Fuels | 250 (22.7%) | 60 (17.5%) |
| No Fuel Used | 0 (0.0%) | 0 (0.0%) |
| Total | 1,103 (100.0%) | 343 (100.0%) |
Household Vehicle Usage in Sweet Grass County
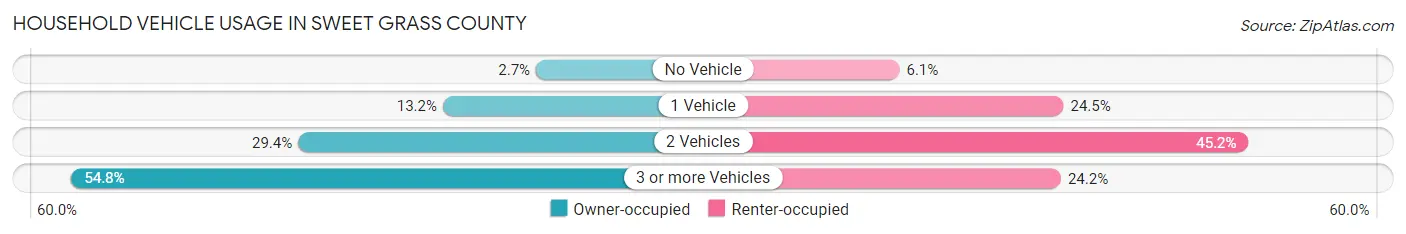
| Vehicles per Household | Owner-occupied | Renter-occupied |
| No Vehicle | 30 (2.7%) | 21 (6.1%) |
| 1 Vehicle | 145 (13.2%) | 84 (24.5%) |
| 2 Vehicles | 324 (29.4%) | 155 (45.2%) |
| 3 or more Vehicles | 604 (54.8%) | 83 (24.2%) |
| Total | 1,103 (100.0%) | 343 (100.0%) |
Real Estate & Mortgages in Sweet Grass County
Real Estate and Mortgage Overview in Sweet Grass County
| Characteristic | Without Mortgage | With Mortgage |
| Housing Units | 673 | 430 |
| Median Property Value | $247,400 | $296,000 |
| Median Household Income | $62,465 | $57 |
| Monthly Housing Costs | $475 | $26 |
| Real Estate Taxes | $1,423 | $7 |
Property Value by Mortgage Status in Sweet Grass County
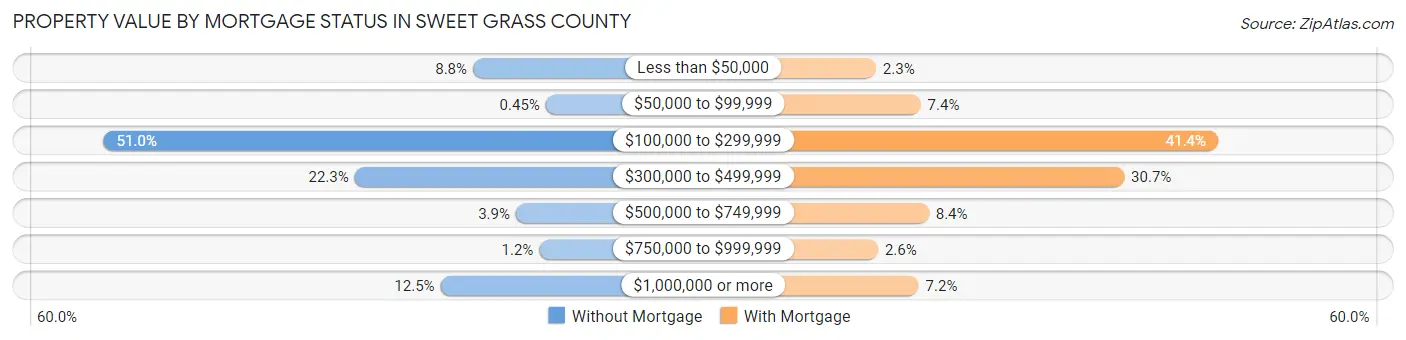
| Property Value | Without Mortgage | With Mortgage |
| Less than $50,000 | 59 (8.8%) | 10 (2.3%) |
| $50,000 to $99,999 | 3 (0.4%) | 32 (7.4%) |
| $100,000 to $299,999 | 343 (51.0%) | 178 (41.4%) |
| $300,000 to $499,999 | 150 (22.3%) | 132 (30.7%) |
| $500,000 to $749,999 | 26 (3.9%) | 36 (8.4%) |
| $750,000 to $999,999 | 8 (1.2%) | 11 (2.6%) |
| $1,000,000 or more | 84 (12.5%) | 31 (7.2%) |
| Total | 673 (100.0%) | 430 (100.0%) |
Household Income by Mortgage Status in Sweet Grass County
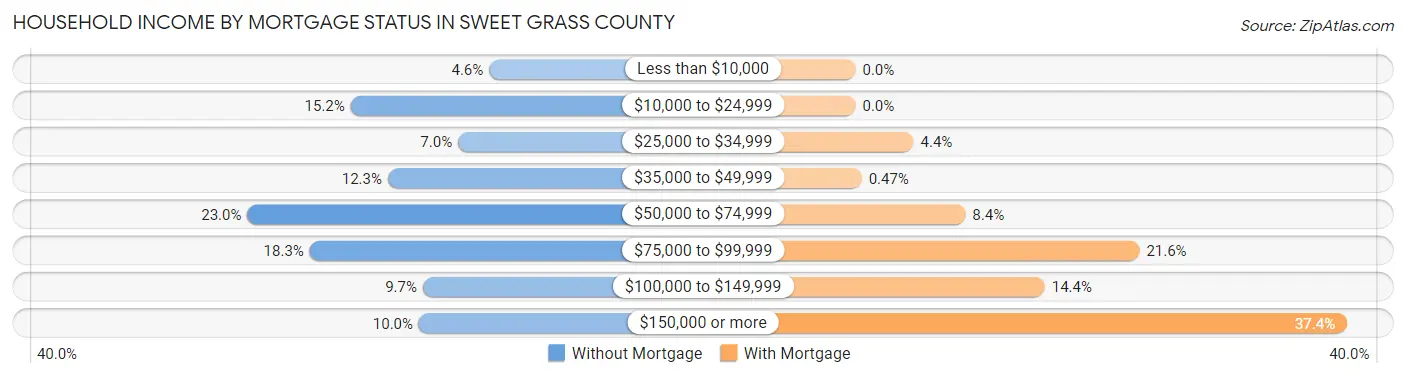
| Household Income | Without Mortgage | With Mortgage |
| Less than $10,000 | 31 (4.6%) | 0 (0.0%) |
| $10,000 to $24,999 | 102 (15.2%) | 0 (0.0%) |
| $25,000 to $34,999 | 47 (7.0%) | 19 (4.4%) |
| $35,000 to $49,999 | 83 (12.3%) | 2 (0.5%) |
| $50,000 to $74,999 | 155 (23.0%) | 36 (8.4%) |
| $75,000 to $99,999 | 123 (18.3%) | 93 (21.6%) |
| $100,000 to $149,999 | 65 (9.7%) | 62 (14.4%) |
| $150,000 or more | 67 (10.0%) | 161 (37.4%) |
| Total | 673 (100.0%) | 430 (100.0%) |
Property Value to Household Income Ratio in Sweet Grass County
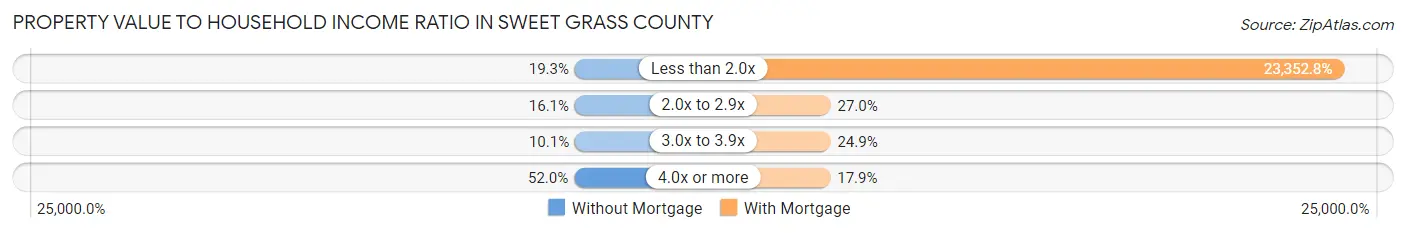
| Value-to-Income Ratio | Without Mortgage | With Mortgage |
| Less than 2.0x | 130 (19.3%) | 100,417 (23,352.8%) |
| 2.0x to 2.9x | 108 (16.1%) | 116 (27.0%) |
| 3.0x to 3.9x | 68 (10.1%) | 107 (24.9%) |
| 4.0x or more | 350 (52.0%) | 77 (17.9%) |
| Total | 673 (100.0%) | 430 (100.0%) |
Real Estate Taxes by Mortgage Status in Sweet Grass County
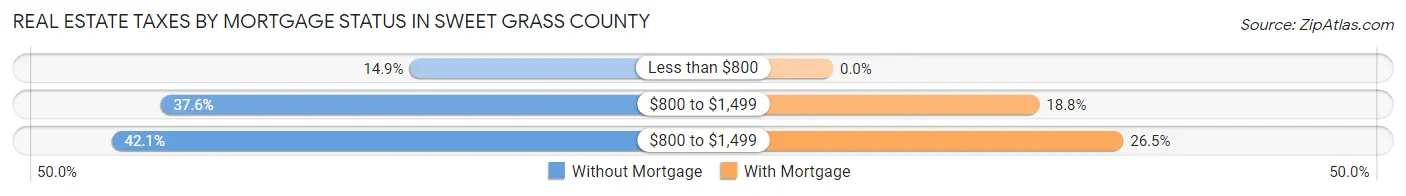
| Property Taxes | Without Mortgage | With Mortgage |
| Less than $800 | 100 (14.9%) | 0 (0.0%) |
| $800 to $1,499 | 253 (37.6%) | 81 (18.8%) |
| $800 to $1,499 | 283 (42.0%) | 114 (26.5%) |
| Total | 673 (100.0%) | 430 (100.0%) |
Health & Disability in Sweet Grass County
Health Insurance Coverage by Age in Sweet Grass County
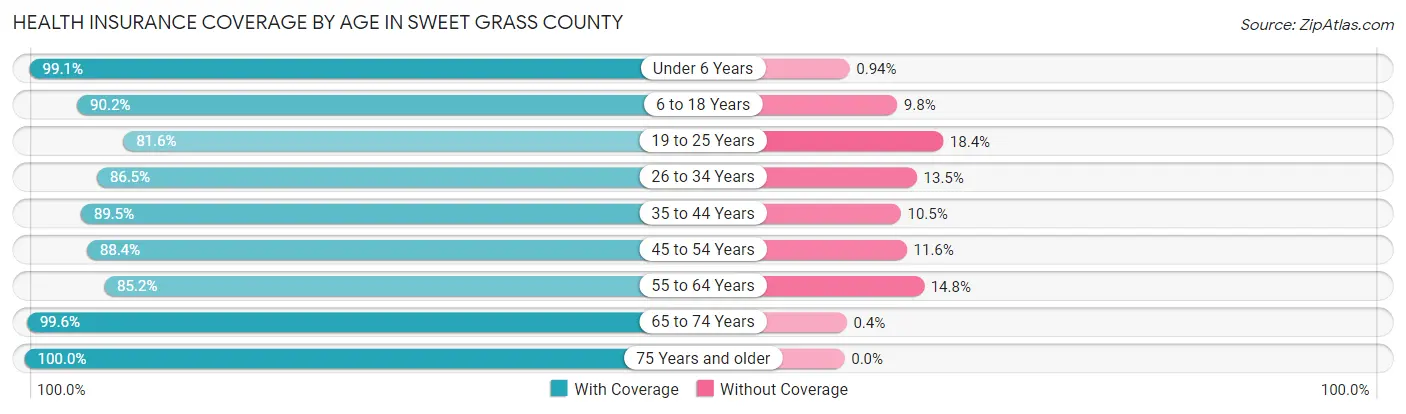
| Age Bracket | With Coverage | Without Coverage |
| Under 6 Years | 211 (99.1%) | 2 (0.9%) |
| 6 to 18 Years | 515 (90.2%) | 56 (9.8%) |
| 19 to 25 Years | 324 (81.6%) | 73 (18.4%) |
| 26 to 34 Years | 276 (86.5%) | 43 (13.5%) |
| 35 to 44 Years | 350 (89.5%) | 41 (10.5%) |
| 45 to 54 Years | 327 (88.4%) | 43 (11.6%) |
| 55 to 64 Years | 443 (85.2%) | 77 (14.8%) |
| 65 to 74 Years | 494 (99.6%) | 2 (0.4%) |
| 75 Years and older | 392 (100.0%) | 0 (0.0%) |
| Total | 3,332 (90.8%) | 337 (9.2%) |
Health Insurance Coverage by Citizenship Status in Sweet Grass County
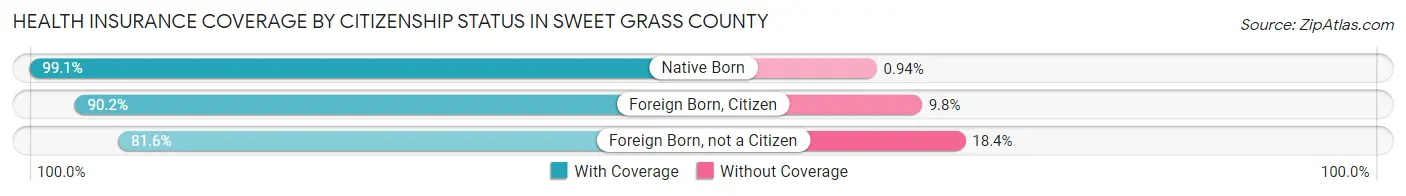
| Citizenship Status | With Coverage | Without Coverage |
| Native Born | 211 (99.1%) | 2 (0.9%) |
| Foreign Born, Citizen | 515 (90.2%) | 56 (9.8%) |
| Foreign Born, not a Citizen | 324 (81.6%) | 73 (18.4%) |
Health Insurance Coverage by Household Income in Sweet Grass County
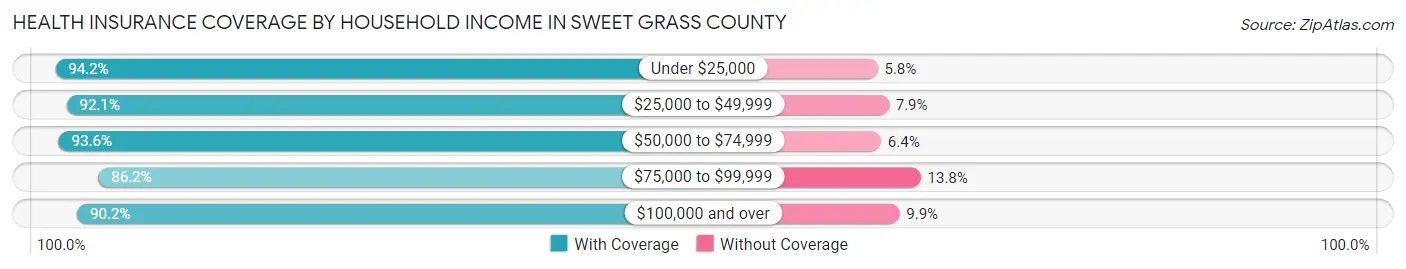
| Household Income | With Coverage | Without Coverage |
| Under $25,000 | 278 (94.2%) | 17 (5.8%) |
| $25,000 to $49,999 | 480 (92.1%) | 41 (7.9%) |
| $50,000 to $74,999 | 849 (93.6%) | 58 (6.4%) |
| $75,000 to $99,999 | 642 (86.2%) | 103 (13.8%) |
| $100,000 and over | 1,080 (90.1%) | 118 (9.9%) |
Public vs Private Health Insurance Coverage by Age in Sweet Grass County
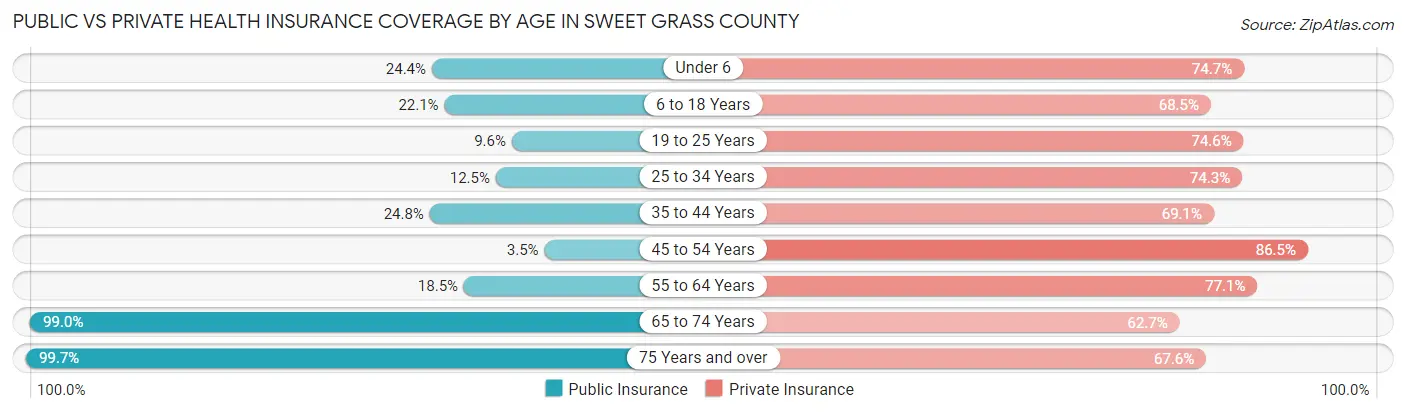
| Age Bracket | Public Insurance | Private Insurance |
| Under 6 | 52 (24.4%) | 159 (74.7%) |
| 6 to 18 Years | 126 (22.1%) | 391 (68.5%) |
| 19 to 25 Years | 38 (9.6%) | 296 (74.6%) |
| 25 to 34 Years | 40 (12.5%) | 237 (74.3%) |
| 35 to 44 Years | 97 (24.8%) | 270 (69.1%) |
| 45 to 54 Years | 13 (3.5%) | 320 (86.5%) |
| 55 to 64 Years | 96 (18.5%) | 401 (77.1%) |
| 65 to 74 Years | 491 (99.0%) | 311 (62.7%) |
| 75 Years and over | 391 (99.7%) | 265 (67.6%) |
| Total | 1,344 (36.6%) | 2,650 (72.2%) |
Disability Status by Sex by Age in Sweet Grass County
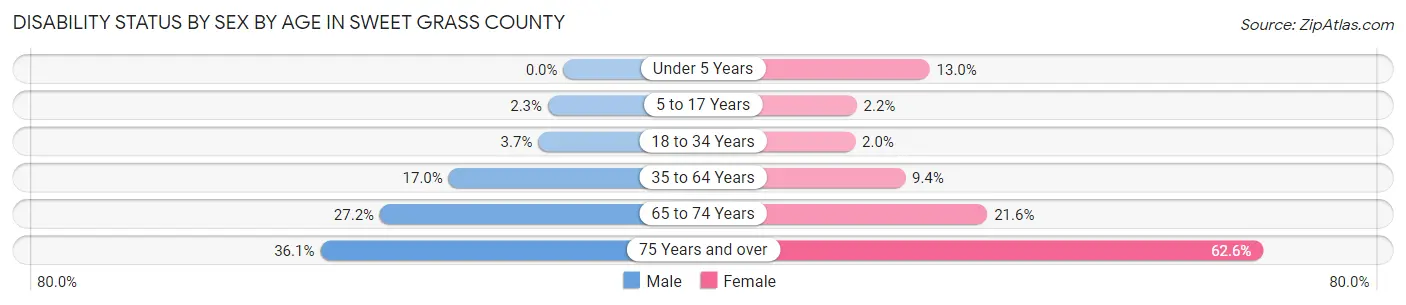
| Age Bracket | Male | Female |
| Under 5 Years | 0 (0.0%) | 12 (13.0%) |
| 5 to 17 Years | 6 (2.3%) | 6 (2.2%) |
| 18 to 34 Years | 15 (3.7%) | 7 (2.0%) |
| 35 to 64 Years | 113 (17.0%) | 58 (9.4%) |
| 65 to 74 Years | 67 (27.2%) | 54 (21.6%) |
| 75 Years and over | 74 (36.1%) | 117 (62.6%) |
Disability Class by Sex by Age in Sweet Grass County
Disability Class: Hearing Difficulty
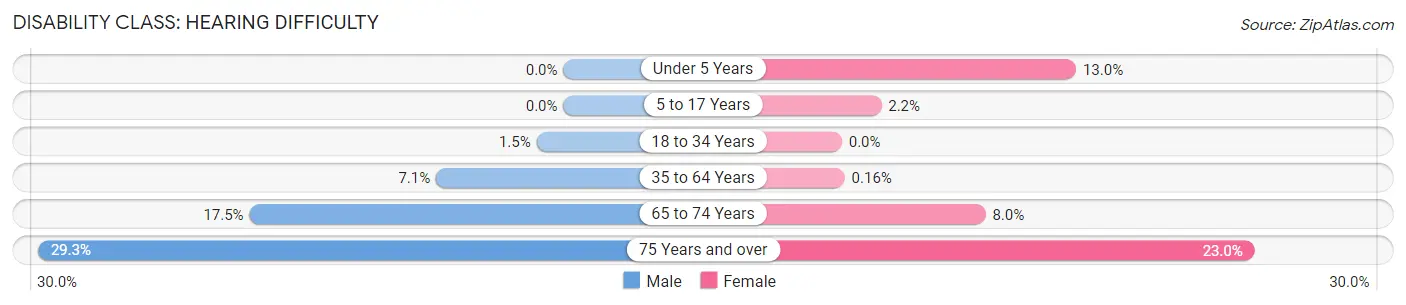
| Age Bracket | Male | Female |
| Under 5 Years | 0 (0.0%) | 12 (13.0%) |
| 5 to 17 Years | 0 (0.0%) | 6 (2.2%) |
| 18 to 34 Years | 6 (1.5%) | 0 (0.0%) |
| 35 to 64 Years | 47 (7.1%) | 1 (0.2%) |
| 65 to 74 Years | 43 (17.5%) | 20 (8.0%) |
| 75 Years and over | 60 (29.3%) | 43 (23.0%) |
Disability Class: Vision Difficulty
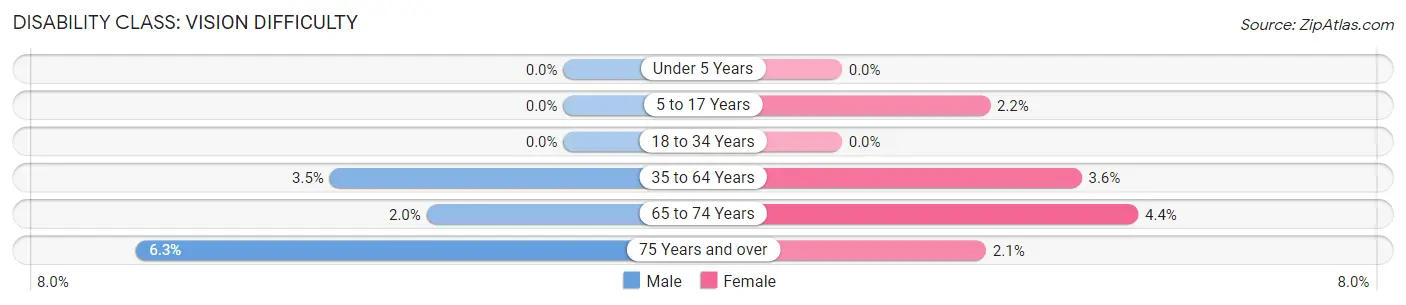
| Age Bracket | Male | Female |
| Under 5 Years | 0 (0.0%) | 0 (0.0%) |
| 5 to 17 Years | 0 (0.0%) | 6 (2.2%) |
| 18 to 34 Years | 0 (0.0%) | 0 (0.0%) |
| 35 to 64 Years | 23 (3.5%) | 22 (3.6%) |
| 65 to 74 Years | 5 (2.0%) | 11 (4.4%) |
| 75 Years and over | 13 (6.3%) | 4 (2.1%) |
Disability Class: Cognitive Difficulty
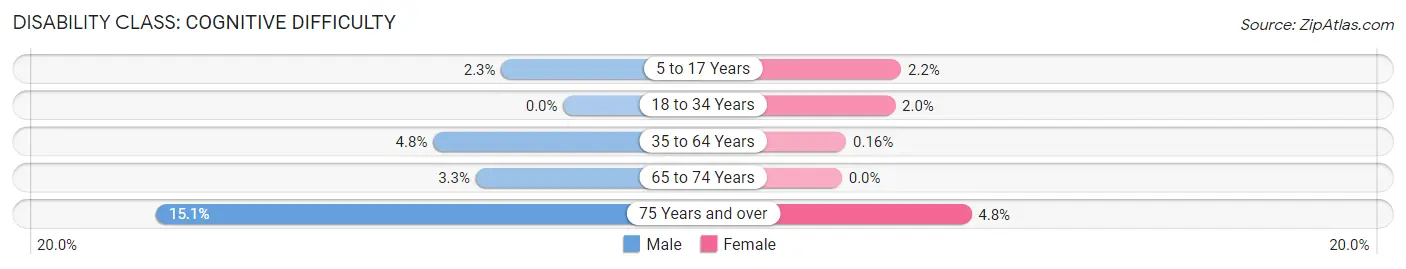
| Age Bracket | Male | Female |
| 5 to 17 Years | 6 (2.3%) | 6 (2.2%) |
| 18 to 34 Years | 0 (0.0%) | 7 (2.0%) |
| 35 to 64 Years | 32 (4.8%) | 1 (0.2%) |
| 65 to 74 Years | 8 (3.3%) | 0 (0.0%) |
| 75 Years and over | 31 (15.1%) | 9 (4.8%) |
Disability Class: Ambulatory Difficulty
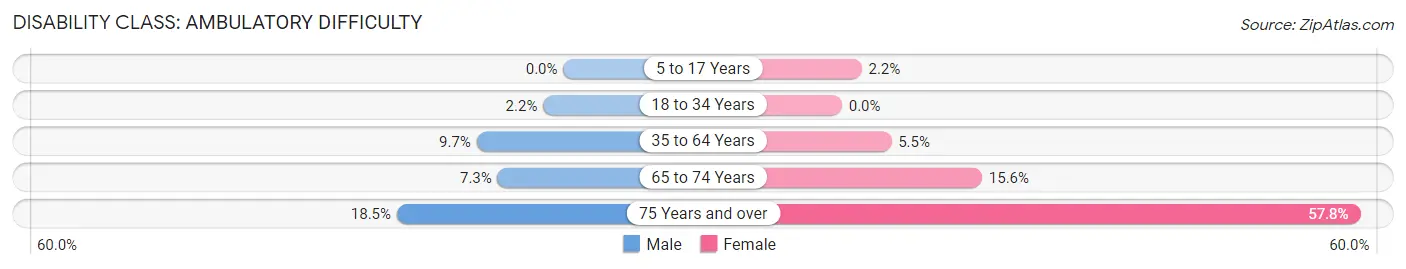
| Age Bracket | Male | Female |
| 5 to 17 Years | 0 (0.0%) | 6 (2.2%) |
| 18 to 34 Years | 9 (2.2%) | 0 (0.0%) |
| 35 to 64 Years | 64 (9.7%) | 34 (5.5%) |
| 65 to 74 Years | 18 (7.3%) | 39 (15.6%) |
| 75 Years and over | 38 (18.5%) | 108 (57.8%) |
Disability Class: Self-Care Difficulty
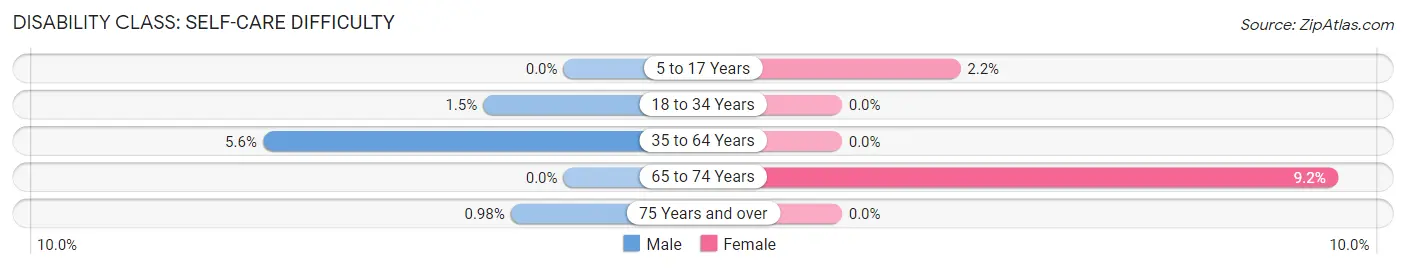
| Age Bracket | Male | Female |
| 5 to 17 Years | 0 (0.0%) | 6 (2.2%) |
| 18 to 34 Years | 6 (1.5%) | 0 (0.0%) |
| 35 to 64 Years | 37 (5.6%) | 0 (0.0%) |
| 65 to 74 Years | 0 (0.0%) | 23 (9.2%) |
| 75 Years and over | 2 (1.0%) | 0 (0.0%) |
Technology Access in Sweet Grass County
Computing Device Access in Sweet Grass County
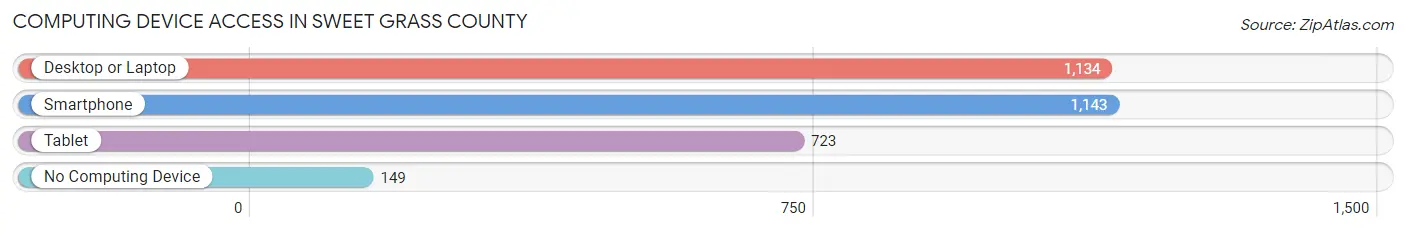
| Device Type | # Households | % Households |
| Desktop or Laptop | 1,134 | 78.4% |
| Smartphone | 1,143 | 79.0% |
| Tablet | 723 | 50.0% |
| No Computing Device | 149 | 10.3% |
| Total | 1,446 | 100.0% |
Internet Access in Sweet Grass County
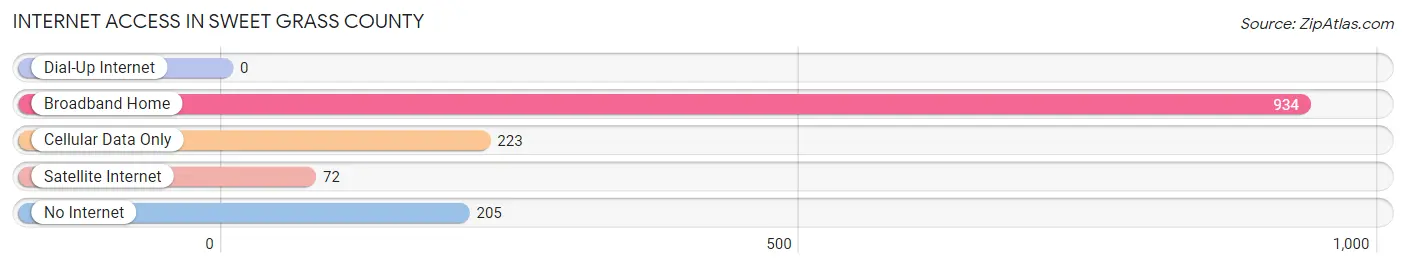
| Internet Type | # Households | % Households |
| Dial-Up Internet | 0 | 0.0% |
| Broadband Home | 934 | 64.6% |
| Cellular Data Only | 223 | 15.4% |
| Satellite Internet | 72 | 5.0% |
| No Internet | 205 | 14.2% |
| Total | 1,446 | 100.0% |
Sweet Grass County Summary
Grass County, Montana is located in the south-central part of the state, and is bordered by Yellowstone National Park to the north, Sweet Grass Hills to the east, and the Stillwater River to the south. The county seat is Big Timber, and the county has a population of approximately 3,000 people.
Geography
Sweet Grass County is located in the south-central part of Montana, and is bordered by Yellowstone National Park to the north, Sweet Grass Hills to the east, and the Stillwater River to the south. The county is located in the Rocky Mountain region of the state, and is characterized by rolling hills, grassy plains, and numerous rivers and streams. The county is home to several mountain ranges, including the Crazy Mountains, the Beartooth Mountains, and the Absaroka Range. The county is also home to several lakes, including the Big Timber Reservoir, the Big Horn Lake, and the Sweet Grass Reservoir.
Economy
The economy of Sweet Grass County is largely based on agriculture and ranching. The county is home to numerous cattle ranches, as well as several farms that produce hay, wheat, barley, and other crops. The county is also home to several timber companies, which harvest timber from the county's forests. In addition, the county is home to several small businesses, including restaurants, retail stores, and service providers.
Demographics
As of the 2010 census, Sweet Grass County had a population of 3,072 people. The racial makeup of the county was 95.3% White, 0.3% African American, 0.7% Native American, 0.2% Asian, 0.1% Pacific Islander, 1.2% from other races, and 2.3% from two or more races. Hispanic or Latino of any race were 3.2% of the population.
The median income for a household in the county was $37,917, and the median income for a family was $45,938. The per capita income for the county was $19,945. About 11.2% of families and 14.2% of the population were below the poverty line, including 17.2% of those under age 18 and 8.2% of those age 65 or over.
Conclusion
Sweet Grass County, Montana is a rural county located in the south-central part of the state. The county is home to numerous cattle ranches, farms, and timber companies, and is characterized by rolling hills, grassy plains, and numerous rivers and streams. The county has a population of approximately 3,000 people, and the economy is largely based on agriculture and ranching. The median income for a household in the county is $37,917, and the median income for a family is $45,938.
Common Questions
What is the Total Population of Sweet Grass County?
Total Population of Sweet Grass County is 3,697.
What is the Total Male Population of Sweet Grass County?
Total Male Population of Sweet Grass County is 1,906.
What is the Total Female Population of Sweet Grass County?
Total Female Population of Sweet Grass County is 1,791.
What is the Ratio of Males per 100 Females in Sweet Grass County?
There are 106.42 Males per 100 Females in Sweet Grass County.
What is the Ratio of Females per 100 Males in Sweet Grass County?
There are 93.97 Females per 100 Males in Sweet Grass County.
What is the Median Population Age in Sweet Grass County?
Median Population Age in Sweet Grass County is 43.6 Years.
What is the Average Family Size in Sweet Grass County
Average Family Size in Sweet Grass County is 3.1 People.
What is the Average Household Size in Sweet Grass County
Average Household Size in Sweet Grass County is 2.5 People.
What is Per Capita Income in Sweet Grass County?
Per Capita income in Sweet Grass County is $35,495.
What is the Median Family Income in Sweet Grass County?
Median Family Income in Sweet Grass County is $83,854.
What is the Median Household income in Sweet Grass County?
Median Household Income in Sweet Grass County is $64,872.
What is Income or Wage Gap in Sweet Grass County?
Income or Wage Gap in Sweet Grass County is 42.8%.
Women in Sweet Grass County earn 57.2 cents for every dollar earned by a man.
What is Inequality or Gini Index in Sweet Grass County?
Inequality or Gini Index in Sweet Grass County is 0.44.
How Large is the Labor Force in Sweet Grass County?
There are 1,892 People in the Labor Forcein in Sweet Grass County.
What is the Percentage of People in the Labor Force in Sweet Grass County?
62.1% of People are in the Labor Force in Sweet Grass County.
What is the Unemployment Rate in Sweet Grass County?
Unemployment Rate in Sweet Grass County is 2.1%.