Sheridan County, MT
Sheridan County Overview
3,700
TOTAL POPULATION
1,945
MALE POPULATION
1,755
FEMALE POPULATION
110.83
MALES / 100 FEMALES
90.23
FEMALES / 100 MALES
43.8
MEDIAN AGE
3.2
AVG FAMILY SIZE
2.5
AVG HOUSEHOLD SIZE
$42,653
PER CAPITA INCOME
$88,510
AVG FAMILY INCOME
$67,457
AVG HOUSEHOLD INCOME
25.5%
WAGE / INCOME GAP [ % ]
74.5¢/ $1
WAGE / INCOME GAP [ $ ]
0.52
INEQUALITY / GINI INDEX
1,820
LABOR FORCE [ PEOPLE ]
61.1%
PERCENT IN LABOR FORCE
1.5%
UNEMPLOYMENT RATE
Sheridan County Area Codes
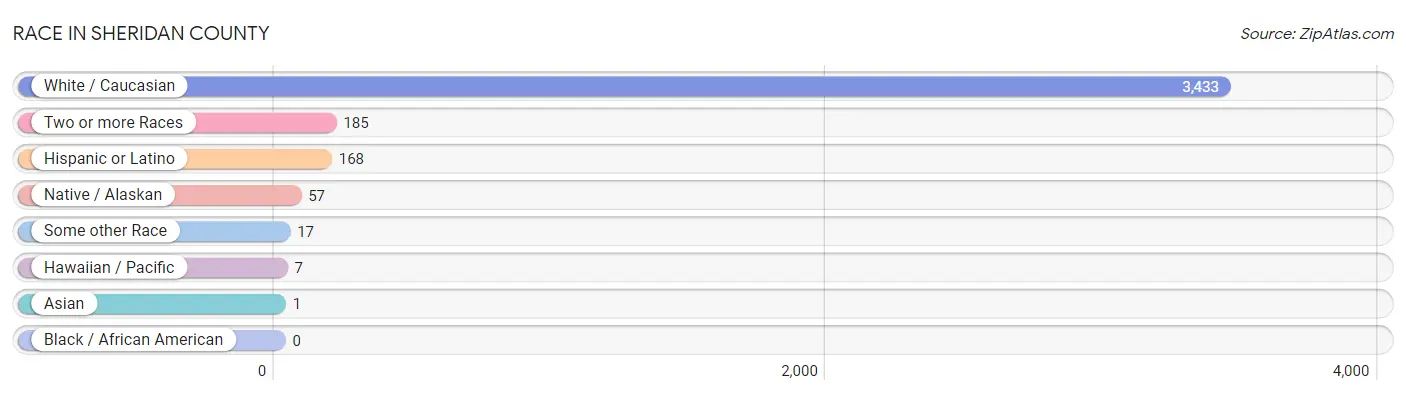
Race in Sheridan County
The most populous races in Sheridan County are White / Caucasian (3,433 | 92.8%), Two or more Races (185 | 5.0%), and Hispanic or Latino (168 | 4.5%).
| Race | # Population | % Population |
| Asian | 1 | 0.0% |
| Black / African American | 0 | 0.0% |
| Hawaiian / Pacific | 7 | 0.2% |
| Hispanic or Latino | 168 | 4.5% |
| Native / Alaskan | 57 | 1.5% |
| White / Caucasian | 3,433 | 92.8% |
| Two or more Races | 185 | 5.0% |
| Some other Race | 17 | 0.5% |
| Total | 3,700 | 100.0% |
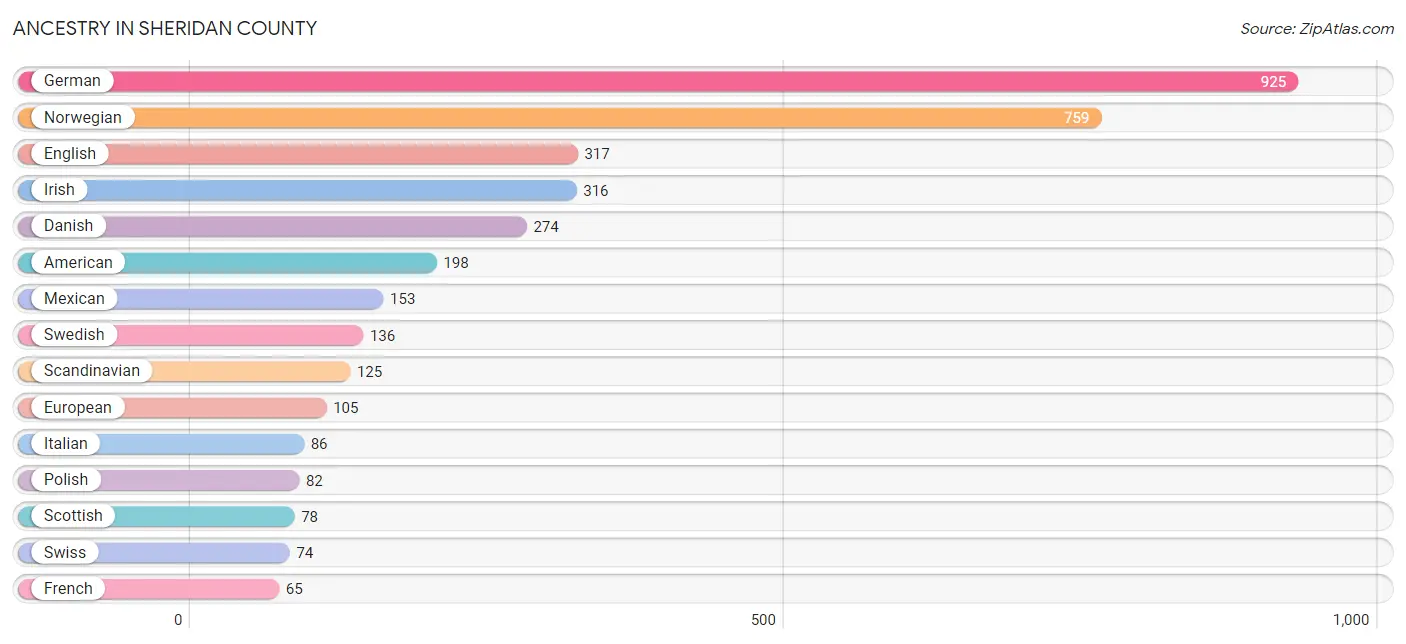
Ancestry in Sheridan County
The most populous ancestries reported in Sheridan County are German (925 | 25.0%), Norwegian (759 | 20.5%), English (317 | 8.6%), Irish (316 | 8.5%), and Danish (274 | 7.4%), together accounting for 70.0% of all Sheridan County residents.
| Ancestry | # Population | % Population |
| American | 198 | 5.3% |
| Apache | 2 | 0.1% |
| Arab | 50 | 1.3% |
| Armenian | 2 | 0.1% |
| Austrian | 8 | 0.2% |
| Belgian | 12 | 0.3% |
| Blackfeet | 7 | 0.2% |
| British | 33 | 0.9% |
| Canadian | 1 | 0.0% |
| Cherokee | 8 | 0.2% |
| Chippewa | 13 | 0.4% |
| Choctaw | 17 | 0.5% |
| Cree | 3 | 0.1% |
| Crow | 1 | 0.0% |
| Czech | 5 | 0.1% |
| Danish | 274 | 7.4% |
| Dutch | 42 | 1.1% |
| Eastern European | 5 | 0.1% |
| English | 317 | 8.6% |
| European | 105 | 2.8% |
| Fijian | 7 | 0.2% |
| Finnish | 10 | 0.3% |
| French | 65 | 1.8% |
| French Canadian | 17 | 0.5% |
| German | 925 | 25.0% |
| Hungarian | 9 | 0.2% |
| Icelander | 10 | 0.3% |
| Indian (Asian) | 5 | 0.1% |
| Irish | 316 | 8.5% |
| Italian | 86 | 2.3% |
| Jamaican | 2 | 0.1% |
| Korean | 3 | 0.1% |
| Lebanese | 50 | 1.3% |
| Lithuanian | 2 | 0.1% |
| Mexican | 153 | 4.1% |
| Native Hawaiian | 5 | 0.1% |
| Northern European | 18 | 0.5% |
| Norwegian | 759 | 20.5% |
| Ottawa | 7 | 0.2% |
| Pennsylvania German | 1 | 0.0% |
| Polish | 82 | 2.2% |
| Portuguese | 2 | 0.1% |
| Romanian | 8 | 0.2% |
| Russian | 4 | 0.1% |
| Scandinavian | 125 | 3.4% |
| Scotch-Irish | 28 | 0.8% |
| Scottish | 78 | 2.1% |
| Seminole | 10 | 0.3% |
| Sioux | 9 | 0.2% |
| Spaniard | 13 | 0.4% |
| Spanish | 2 | 0.1% |
| Swedish | 136 | 3.7% |
| Swiss | 74 | 2.0% |
| Ukrainian | 13 | 0.4% |
| Welsh | 12 | 0.3% |
| Yup'ik | 19 | 0.5% | View All 56 Rows |
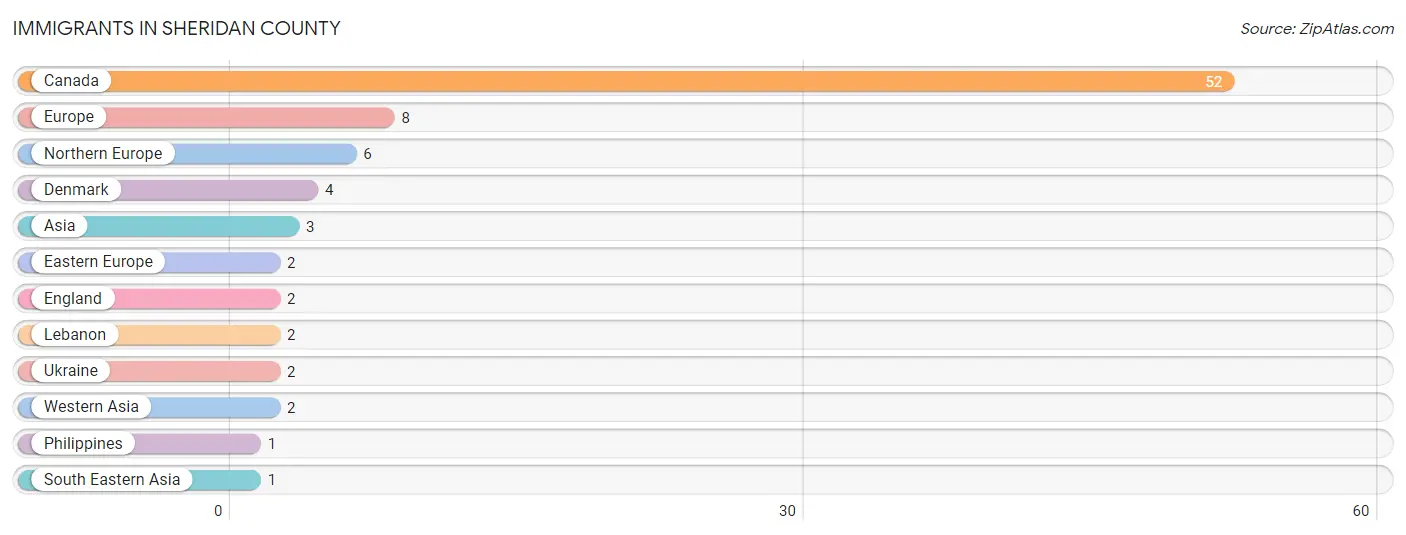
Immigrants in Sheridan County
The most numerous immigrant groups reported in Sheridan County came from Canada (52 | 1.4%), Europe (8 | 0.2%), Northern Europe (6 | 0.2%), Denmark (4 | 0.1%), and Asia (3 | 0.1%), together accounting for 2.0% of all Sheridan County residents.
| Immigration Origin | # Population | % Population |
| Asia | 3 | 0.1% |
| Canada | 52 | 1.4% |
| Denmark | 4 | 0.1% |
| Eastern Europe | 2 | 0.1% |
| England | 2 | 0.1% |
| Europe | 8 | 0.2% |
| Lebanon | 2 | 0.1% |
| Northern Europe | 6 | 0.2% |
| Philippines | 1 | 0.0% |
| South Eastern Asia | 1 | 0.0% |
| Ukraine | 2 | 0.1% |
| Western Asia | 2 | 0.1% | View All 12 Rows |
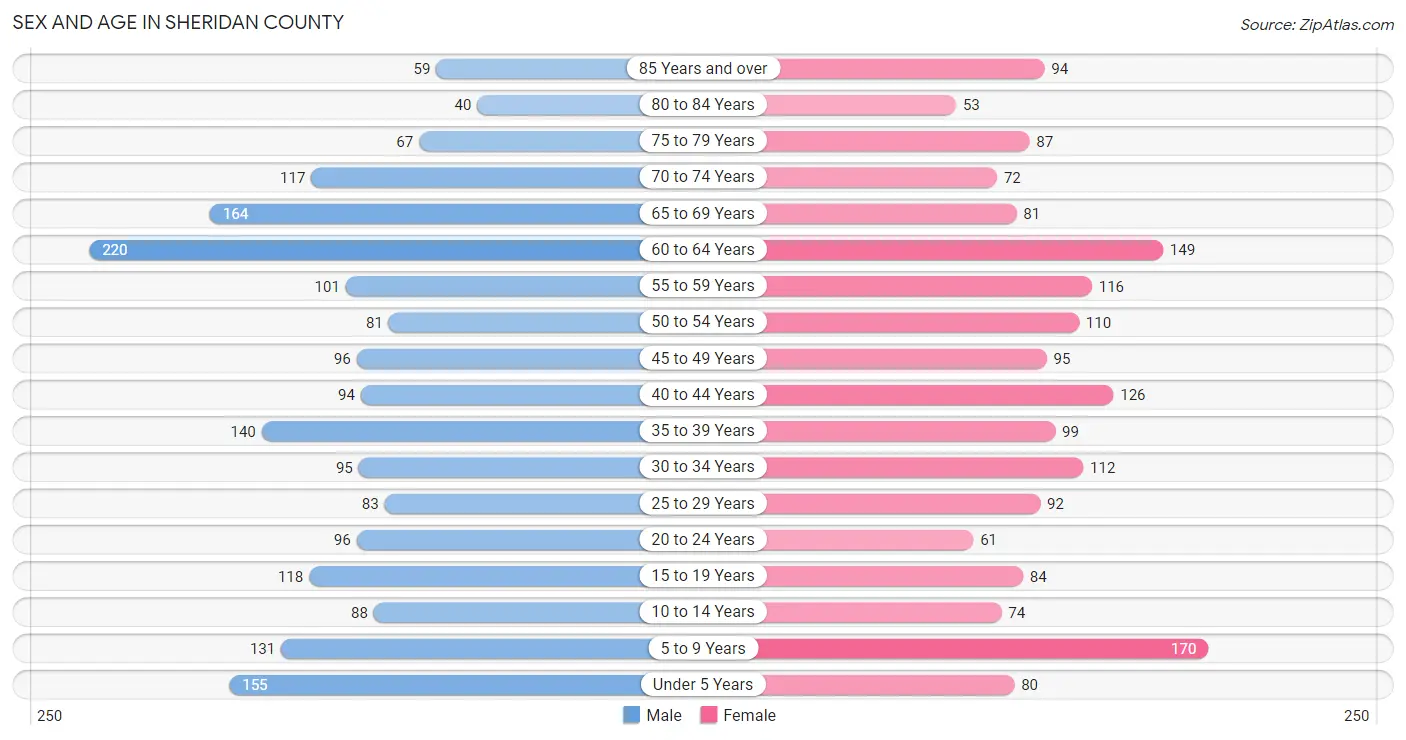
Sex and Age in Sheridan County
Sex and Age in Sheridan County
The most populous age groups in Sheridan County are 60 to 64 Years (220 | 11.3%) for men and 5 to 9 Years (170 | 9.7%) for women.
| Age Bracket | Male | Female |
| Under 5 Years | 155 (8.0%) | 80 (4.6%) |
| 5 to 9 Years | 131 (6.7%) | 170 (9.7%) |
| 10 to 14 Years | 88 (4.5%) | 74 (4.2%) |
| 15 to 19 Years | 118 (6.1%) | 84 (4.8%) |
| 20 to 24 Years | 96 (4.9%) | 61 (3.5%) |
| 25 to 29 Years | 83 (4.3%) | 92 (5.2%) |
| 30 to 34 Years | 95 (4.9%) | 112 (6.4%) |
| 35 to 39 Years | 140 (7.2%) | 99 (5.6%) |
| 40 to 44 Years | 94 (4.8%) | 126 (7.2%) |
| 45 to 49 Years | 96 (4.9%) | 95 (5.4%) |
| 50 to 54 Years | 81 (4.2%) | 110 (6.3%) |
| 55 to 59 Years | 101 (5.2%) | 116 (6.6%) |
| 60 to 64 Years | 220 (11.3%) | 149 (8.5%) |
| 65 to 69 Years | 164 (8.4%) | 81 (4.6%) |
| 70 to 74 Years | 117 (6.0%) | 72 (4.1%) |
| 75 to 79 Years | 67 (3.4%) | 87 (5.0%) |
| 80 to 84 Years | 40 (2.1%) | 53 (3.0%) |
| 85 Years and over | 59 (3.0%) | 94 (5.4%) |
| Total | 1,945 (100.0%) | 1,755 (100.0%) |
Families and Households in Sheridan County
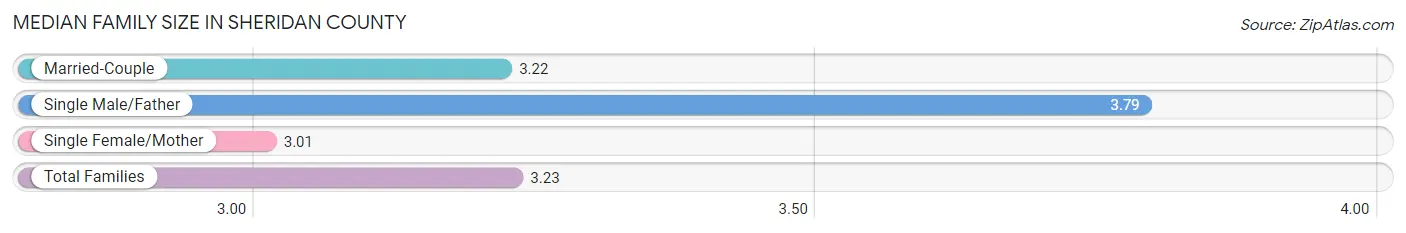
Median Family Size in Sheridan County
The median family size in Sheridan County is 3.23 persons per family, with single male/father families (43 | 4.9%) accounting for the largest median family size of 3.79 persons per family. On the other hand, single female/mother families (70 | 8.0%) represent the smallest median family size with 3.01 persons per family.
| Family Type | # Families | Family Size |
| Married-Couple | 766 (87.1%) | 3.22 |
| Single Male/Father | 43 (4.9%) | 3.79 |
| Single Female/Mother | 70 (8.0%) | 3.01 |
| Total Families | 879 (100.0%) | 3.23 |
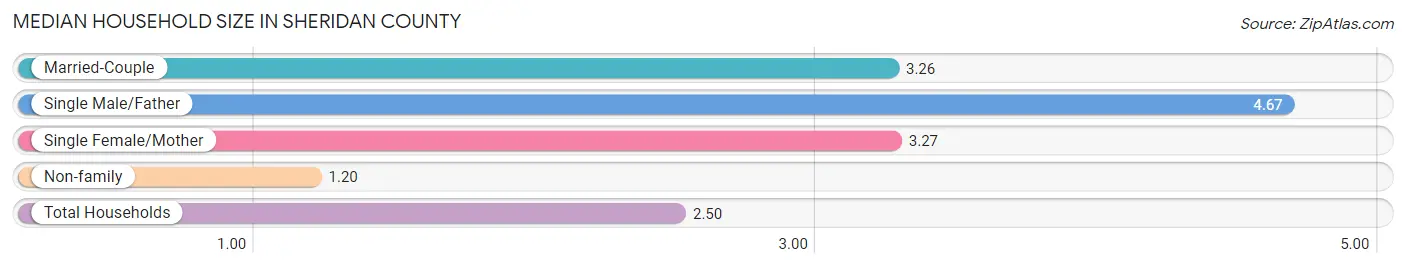
Median Household Size in Sheridan County
The median household size in Sheridan County is 2.50 persons per household, with single male/father households (43 | 3.0%) accounting for the largest median household size of 4.67 persons per household. non-family households (560 | 38.9%) represent the smallest median household size with 1.20 persons per household.
| Household Type | # Households | Household Size |
| Married-Couple | 766 (53.2%) | 3.26 |
| Single Male/Father | 43 (3.0%) | 4.67 |
| Single Female/Mother | 70 (4.9%) | 3.27 |
| Non-family | 560 (38.9%) | 1.20 |
| Total Households | 1,439 (100.0%) | 2.50 |
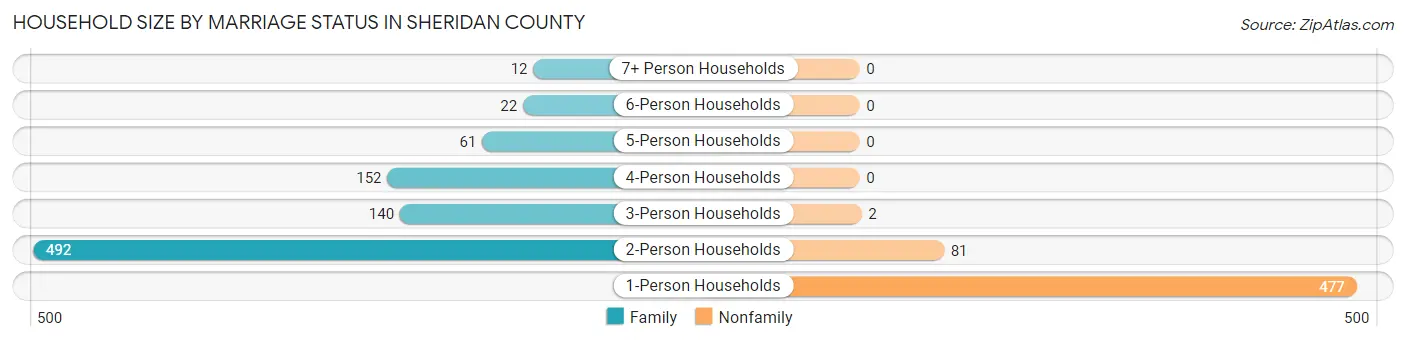
Household Size by Marriage Status in Sheridan County
Out of a total of 1,439 households in Sheridan County, 879 (61.1%) are family households, while 560 (38.9%) are nonfamily households. The most numerous type of family households are 2-person households, comprising 492, and the most common type of nonfamily households are 1-person households, comprising 477.
| Household Size | Family Households | Nonfamily Households |
| 1-Person Households | - | 477 (33.2%) |
| 2-Person Households | 492 (34.2%) | 81 (5.6%) |
| 3-Person Households | 140 (9.7%) | 2 (0.1%) |
| 4-Person Households | 152 (10.6%) | 0 (0.0%) |
| 5-Person Households | 61 (4.2%) | 0 (0.0%) |
| 6-Person Households | 22 (1.5%) | 0 (0.0%) |
| 7+ Person Households | 12 (0.8%) | 0 (0.0%) |
| Total | 879 (61.1%) | 560 (38.9%) |
Female Fertility in Sheridan County
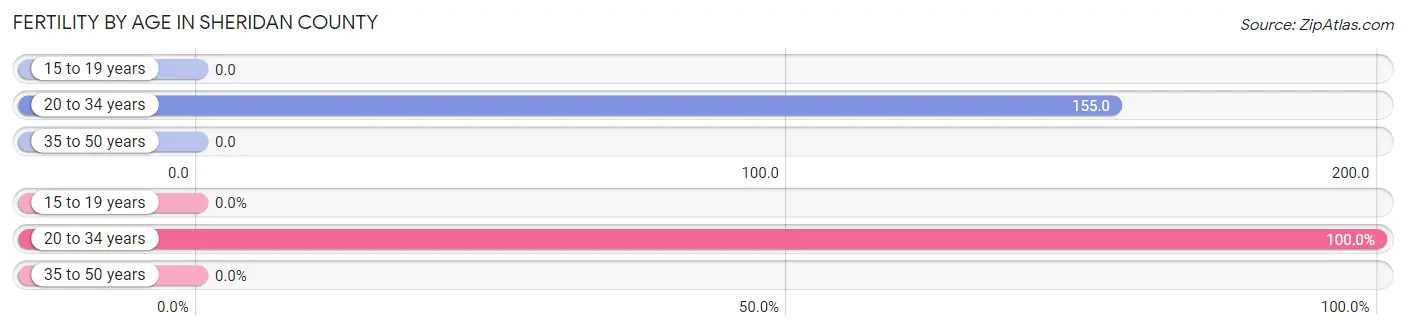
Fertility by Age in Sheridan County
Average fertility rate in Sheridan County is 59.0 births per 1,000 women. Women in the age bracket of 20 to 34 years have the highest fertility rate with 155.0 births per 1,000 women. Women in the age bracket of 20 to 34 years acount for 100.0% of all women with births.
| Age Bracket | Women with Births | Births / 1,000 Women |
| 15 to 19 years | 0 (0.0%) | 0.0 |
| 20 to 34 years | 41 (100.0%) | 155.0 |
| 35 to 50 years | 0 (0.0%) | 0.0 |
| Total | 41 (100.0%) | 59.0 |
Fertility by Age by Marriage Status in Sheridan County
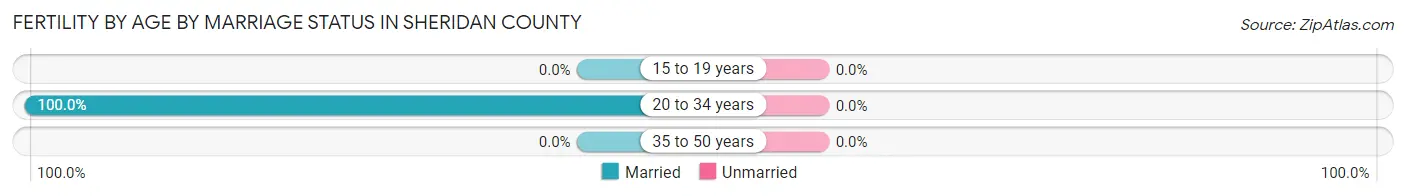
| Age Bracket | Married | Unmarried |
| 15 to 19 years | 0 (0.0%) | 0 (0.0%) |
| 20 to 34 years | 41 (100.0%) | 0 (0.0%) |
| 35 to 50 years | 0 (0.0%) | 0 (0.0%) |
| Total | 41 (100.0%) | 0 (0.0%) |
Fertility by Education in Sheridan County
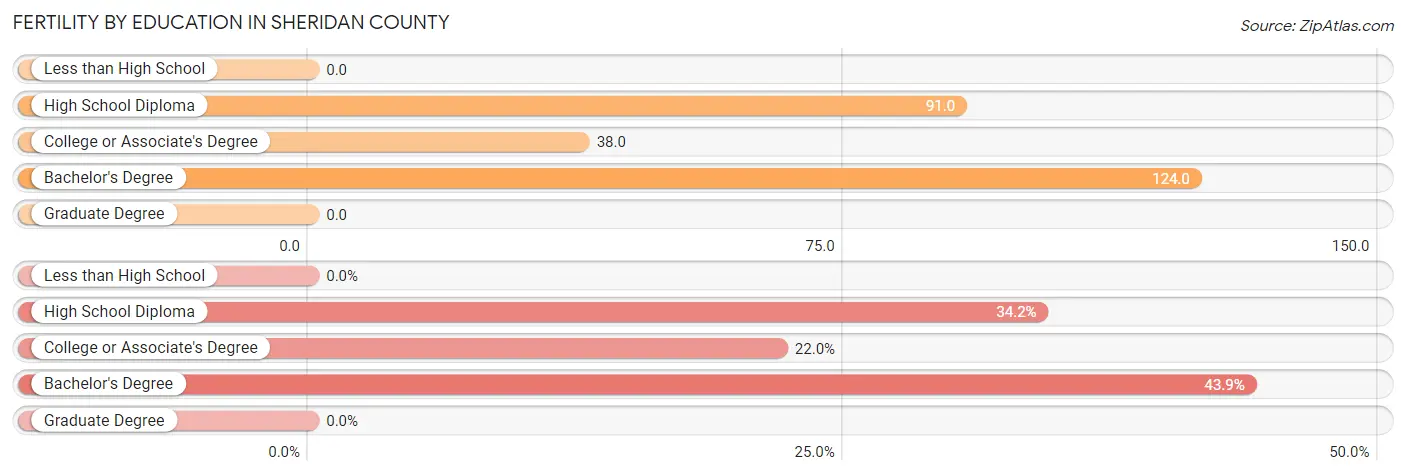
| Educational Attainment | Women with Births | Births / 1,000 Women |
| Less than High School | 0 (0.0%) | 0.0 |
| High School Diploma | 14 (34.2%) | 91.0 |
| College or Associate's Degree | 9 (22.0%) | 38.0 |
| Bachelor's Degree | 18 (43.9%) | 124.0 |
| Graduate Degree | 0 (0.0%) | 0.0 |
| Total | 41 (100.0%) | 59.0 |
Fertility by Education by Marriage Status in Sheridan County
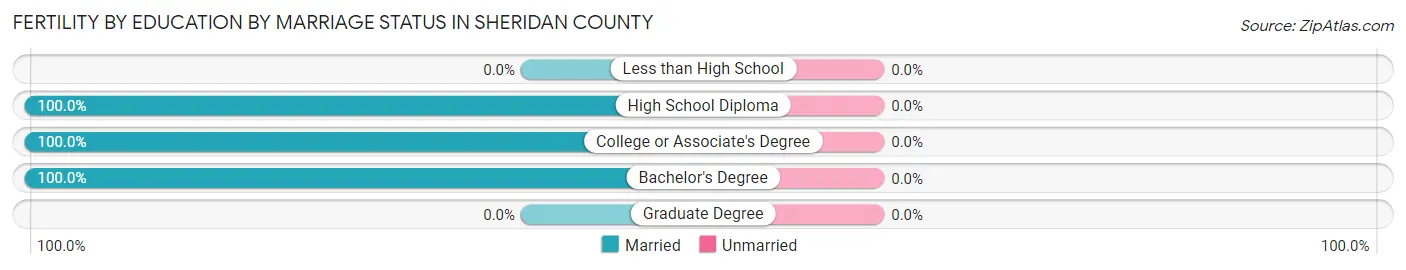
| Educational Attainment | Married | Unmarried |
| Less than High School | 0 (0.0%) | 0 (0.0%) |
| High School Diploma | 14 (100.0%) | 0 (0.0%) |
| College or Associate's Degree | 9 (100.0%) | 0 (0.0%) |
| Bachelor's Degree | 18 (100.0%) | 0 (0.0%) |
| Graduate Degree | 0 (0.0%) | 0 (0.0%) |
| Total | 41 (100.0%) | 0 (0.0%) |
Income in Sheridan County
Income Overview in Sheridan County
Per Capita Income in Sheridan County is $42,653, while median incomes of families and households are $88,510 and $67,457 respectively.
| Characteristic | Number | Measure |
| Per Capita Income | 3,700 | $42,653 |
| Median Family Income | 879 | $88,510 |
| Mean Family Income | 879 | $119,513 |
| Median Household Income | 1,439 | $67,457 |
| Mean Household Income | 1,439 | $103,394 |
| Income Deficit | 879 | $0 |
| Wage / Income Gap (%) | 3,700 | 25.53% |
| Wage / Income Gap ($) | 3,700 | 74.47¢ per $1 |
| Gini / Inequality Index | 3,700 | 0.52 |
Earnings by Sex in Sheridan County
Average Earnings in Sheridan County are $33,177, $40,565 for men and $30,208 for women, a difference of 25.5%.
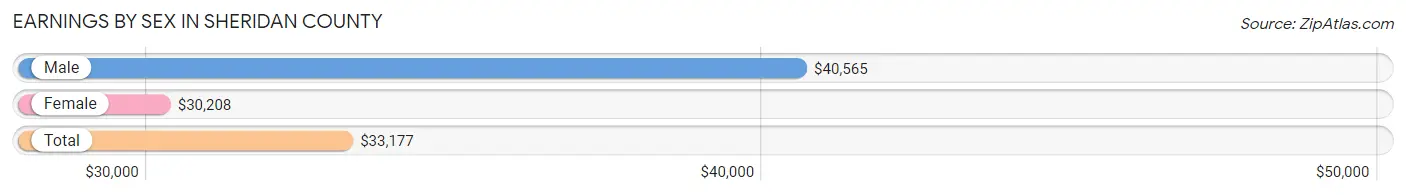
| Sex | Number | Average Earnings |
| Male | 1,107 (53.6%) | $40,565 |
| Female | 958 (46.4%) | $30,208 |
| Total | 2,065 (100.0%) | $33,177 |
Earnings by Sex by Income Bracket in Sheridan County
The most common earnings brackets in Sheridan County are $100,000+ for men (222 | 20.1%) and $2,499 or less for women (117 | 12.2%).
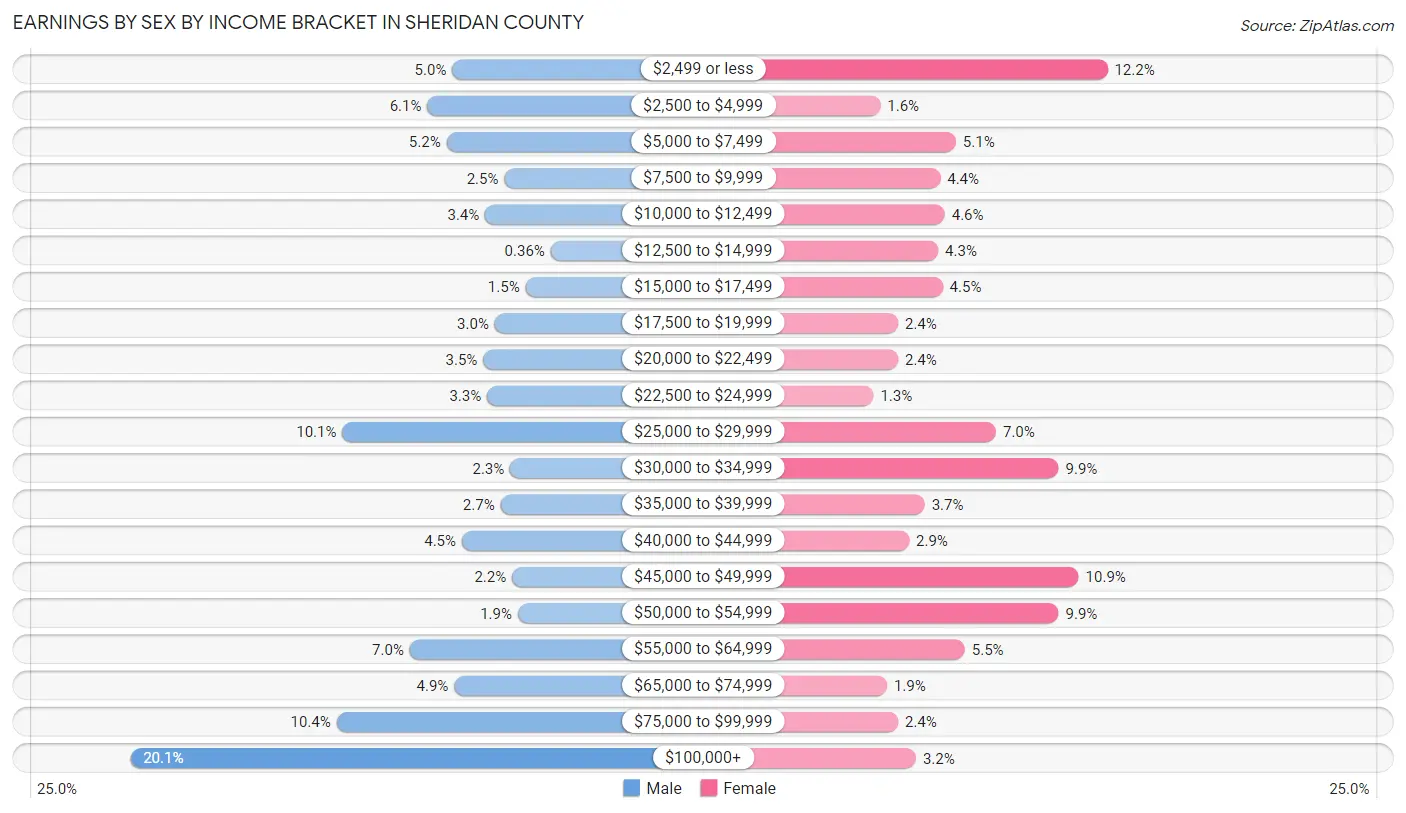
| Income | Male | Female |
| $2,499 or less | 55 (5.0%) | 117 (12.2%) |
| $2,500 to $4,999 | 68 (6.1%) | 15 (1.6%) |
| $5,000 to $7,499 | 58 (5.2%) | 49 (5.1%) |
| $7,500 to $9,999 | 28 (2.5%) | 42 (4.4%) |
| $10,000 to $12,499 | 38 (3.4%) | 44 (4.6%) |
| $12,500 to $14,999 | 4 (0.4%) | 41 (4.3%) |
| $15,000 to $17,499 | 17 (1.5%) | 43 (4.5%) |
| $17,500 to $19,999 | 33 (3.0%) | 23 (2.4%) |
| $20,000 to $22,499 | 39 (3.5%) | 23 (2.4%) |
| $22,500 to $24,999 | 37 (3.3%) | 12 (1.3%) |
| $25,000 to $29,999 | 112 (10.1%) | 67 (7.0%) |
| $30,000 to $34,999 | 25 (2.3%) | 95 (9.9%) |
| $35,000 to $39,999 | 30 (2.7%) | 35 (3.6%) |
| $40,000 to $44,999 | 50 (4.5%) | 28 (2.9%) |
| $45,000 to $49,999 | 24 (2.2%) | 104 (10.9%) |
| $50,000 to $54,999 | 21 (1.9%) | 95 (9.9%) |
| $55,000 to $64,999 | 77 (7.0%) | 53 (5.5%) |
| $65,000 to $74,999 | 54 (4.9%) | 18 (1.9%) |
| $75,000 to $99,999 | 115 (10.4%) | 23 (2.4%) |
| $100,000+ | 222 (20.1%) | 31 (3.2%) |
| Total | 1,107 (100.0%) | 958 (100.0%) |
Earnings by Sex by Educational Attainment in Sheridan County
Average earnings in Sheridan County are $52,143 for men and $32,939 for women, a difference of 36.8%. Men with an educational attainment of graduate degree enjoy the highest average annual earnings of $77,321, while those with high school diploma education earn the least with $36,417. Women with an educational attainment of bachelor's degree earn the most with the average annual earnings of $48,100, while those with high school diploma education have the smallest earnings of $21,538.
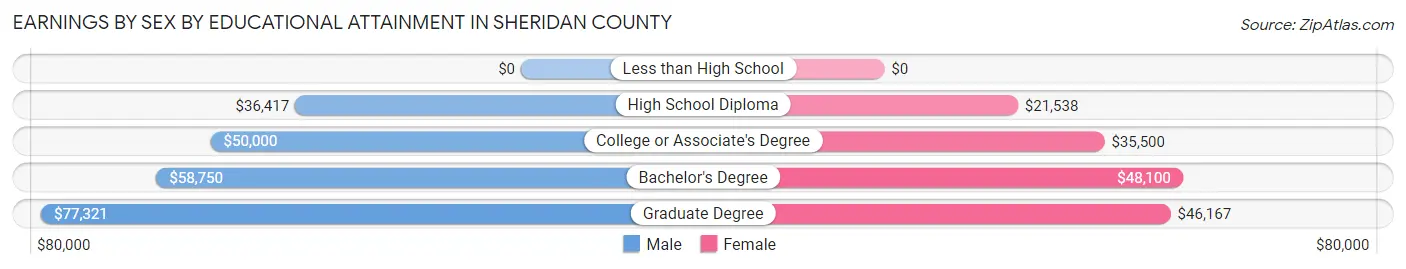
| Educational Attainment | Male Income | Female Income |
| Less than High School | - | - |
| High School Diploma | $36,417 | $21,538 |
| College or Associate's Degree | $50,000 | $35,500 |
| Bachelor's Degree | $58,750 | $48,100 |
| Graduate Degree | $77,321 | $46,167 |
| Total | $52,143 | $32,939 |
Family Income in Sheridan County
Family Income Brackets in Sheridan County
According to the Sheridan County family income data, there are 183 families falling into the $100,000 to $149,999 income range, which is the most common income bracket and makes up 20.8% of all families. Conversely, the less than $10,000 income bracket is the least frequent group with only 16 families (1.8%) belonging to this category.
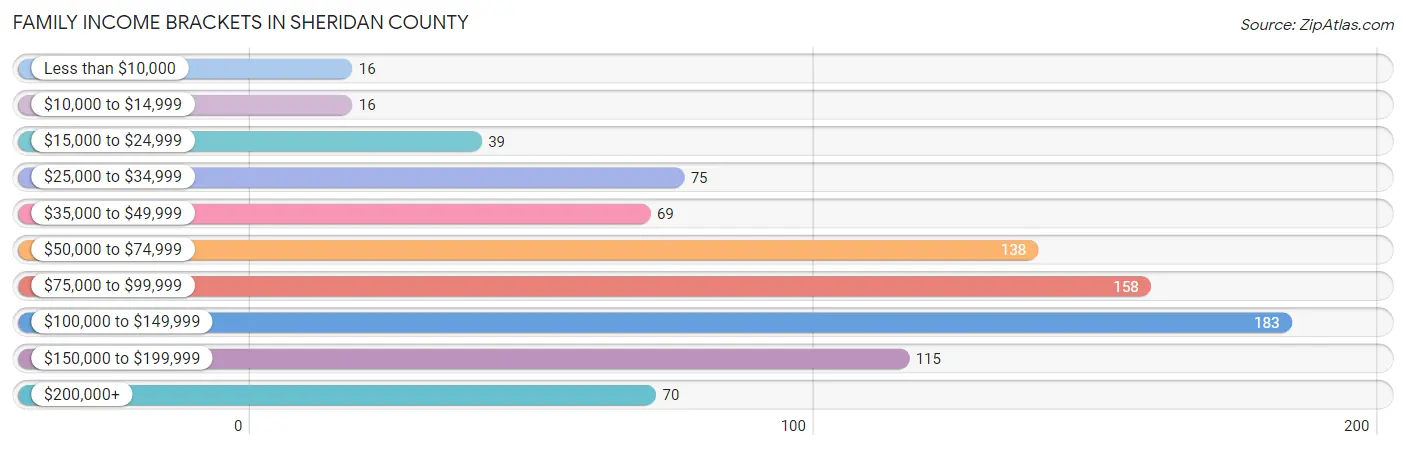
| Income Bracket | # Families | % Families |
| Less than $10,000 | 16 | 1.8% |
| $10,000 to $14,999 | 16 | 1.8% |
| $15,000 to $24,999 | 39 | 4.4% |
| $25,000 to $34,999 | 75 | 8.5% |
| $35,000 to $49,999 | 69 | 7.8% |
| $50,000 to $74,999 | 138 | 15.7% |
| $75,000 to $99,999 | 158 | 18.0% |
| $100,000 to $149,999 | 183 | 20.8% |
| $150,000 to $199,999 | 115 | 13.1% |
| $200,000+ | 70 | 8.0% |
Family Income by Famaliy Size in Sheridan County
5-person families (63 | 7.2%) account for the highest median family income in Sheridan County with $152,563 per family, while 2-person families (496 | 56.4%) have the highest median income of $36,136 per family member.
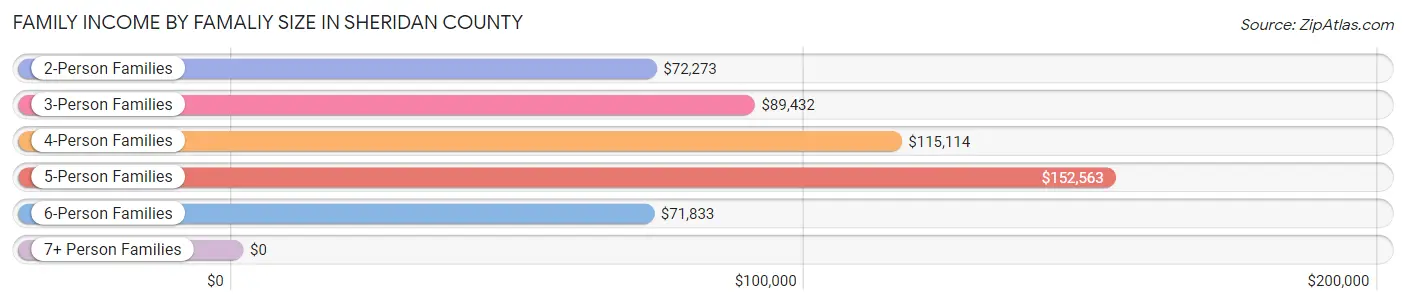
| Income Bracket | # Families | Median Income |
| 2-Person Families | 496 (56.4%) | $72,273 |
| 3-Person Families | 181 (20.6%) | $89,432 |
| 4-Person Families | 107 (12.2%) | $115,114 |
| 5-Person Families | 63 (7.2%) | $152,563 |
| 6-Person Families | 22 (2.5%) | $71,833 |
| 7+ Person Families | 10 (1.1%) | $0 |
| Total | 879 (100.0%) | $88,510 |
Family Income by Number of Earners in Sheridan County
The median family income in Sheridan County is $88,510, with families comprising 3+ earners (115) having the highest median family income of $128,750, while families with no earners (121) have the lowest median family income of $33,355, accounting for 13.1% and 13.8% of families, respectively.
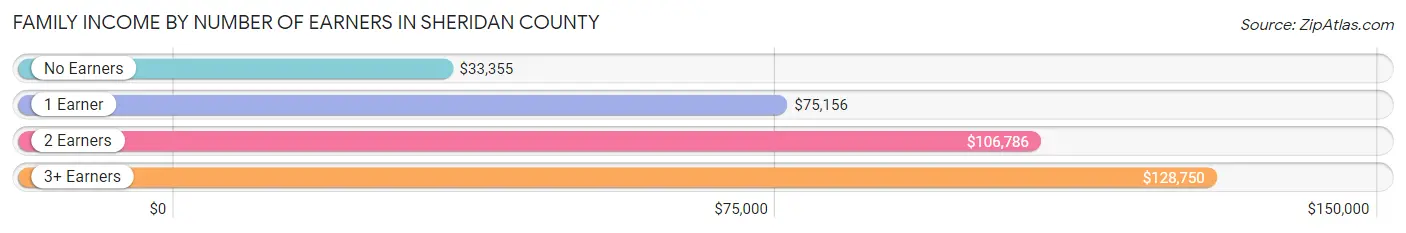
| Number of Earners | # Families | Median Income |
| No Earners | 121 (13.8%) | $33,355 |
| 1 Earner | 273 (31.1%) | $75,156 |
| 2 Earners | 370 (42.1%) | $106,786 |
| 3+ Earners | 115 (13.1%) | $128,750 |
| Total | 879 (100.0%) | $88,510 |
Household Income in Sheridan County
Household Income Brackets in Sheridan County
With 239 households falling in the category, the $100,000 to $149,999 income range is the most frequent in Sheridan County, accounting for 16.6% of all households. In contrast, only 50 households (3.5%) fall into the $10,000 to $14,999 income bracket, making it the least populous group.
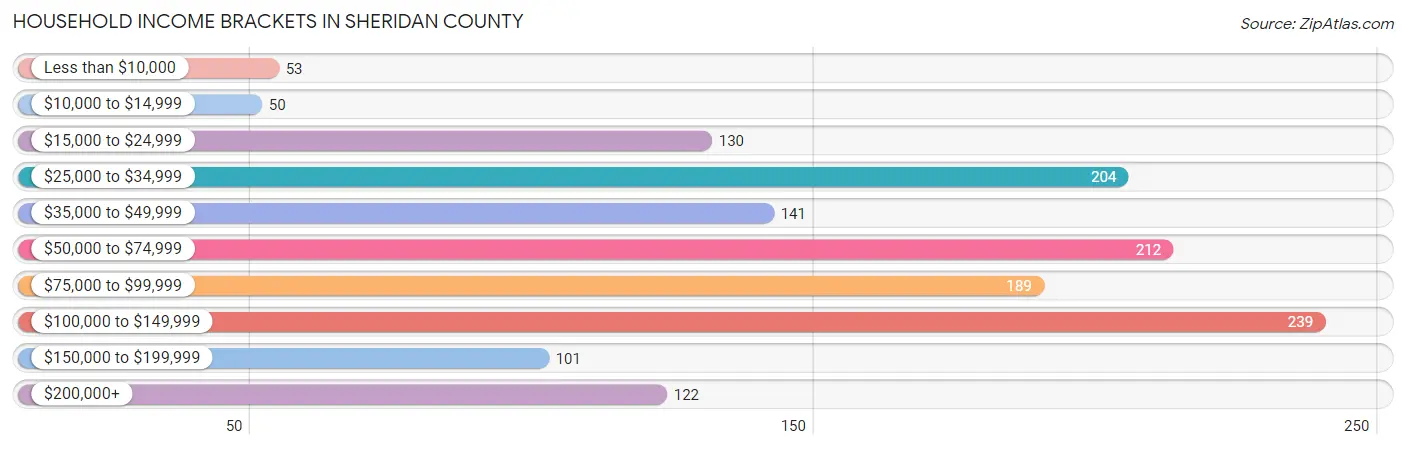
| Income Bracket | # Households | % Households |
| Less than $10,000 | 53 | 3.7% |
| $10,000 to $14,999 | 50 | 3.5% |
| $15,000 to $24,999 | 130 | 9.0% |
| $25,000 to $34,999 | 204 | 14.2% |
| $35,000 to $49,999 | 141 | 9.8% |
| $50,000 to $74,999 | 212 | 14.7% |
| $75,000 to $99,999 | 189 | 13.1% |
| $100,000 to $149,999 | 239 | 16.6% |
| $150,000 to $199,999 | 101 | 7.0% |
| $200,000+ | 122 | 8.5% |
Household Income by Householder Age in Sheridan County
The median household income in Sheridan County is $67,457, with the highest median household income of $86,250 found in the 45 to 64 years age bracket for the primary householder. A total of 483 households (33.6%) fall into this category. Meanwhile, the 65+ years age bracket for the primary householder has the lowest median household income of $40,833, with 500 households (34.7%) in this group.
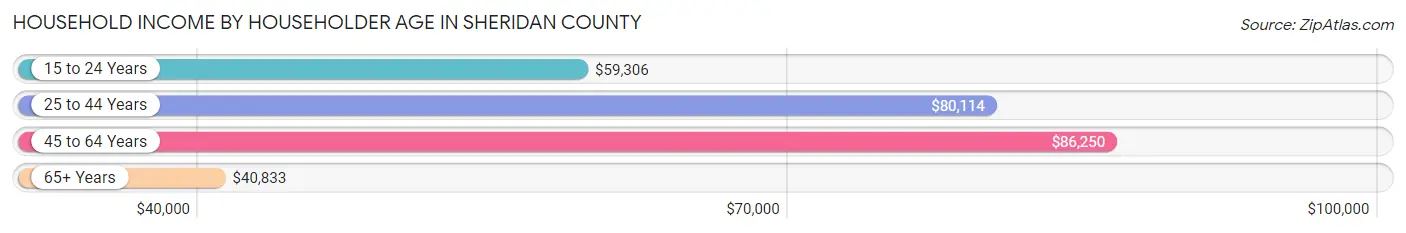
| Income Bracket | # Households | Median Income |
| 15 to 24 Years | 33 (2.3%) | $59,306 |
| 25 to 44 Years | 423 (29.4%) | $80,114 |
| 45 to 64 Years | 483 (33.6%) | $86,250 |
| 65+ Years | 500 (34.7%) | $40,833 |
| Total | 1,439 (100.0%) | $67,457 |
Poverty in Sheridan County
Income Below Poverty by Sex and Age in Sheridan County
With 8.7% poverty level for males and 11.1% for females among the residents of Sheridan County, 15 year old males and 55 to 64 year old females are the most vulnerable to poverty, with 5 males (55.6%) and 51 females (19.3%) in their respective age groups living below the poverty level.
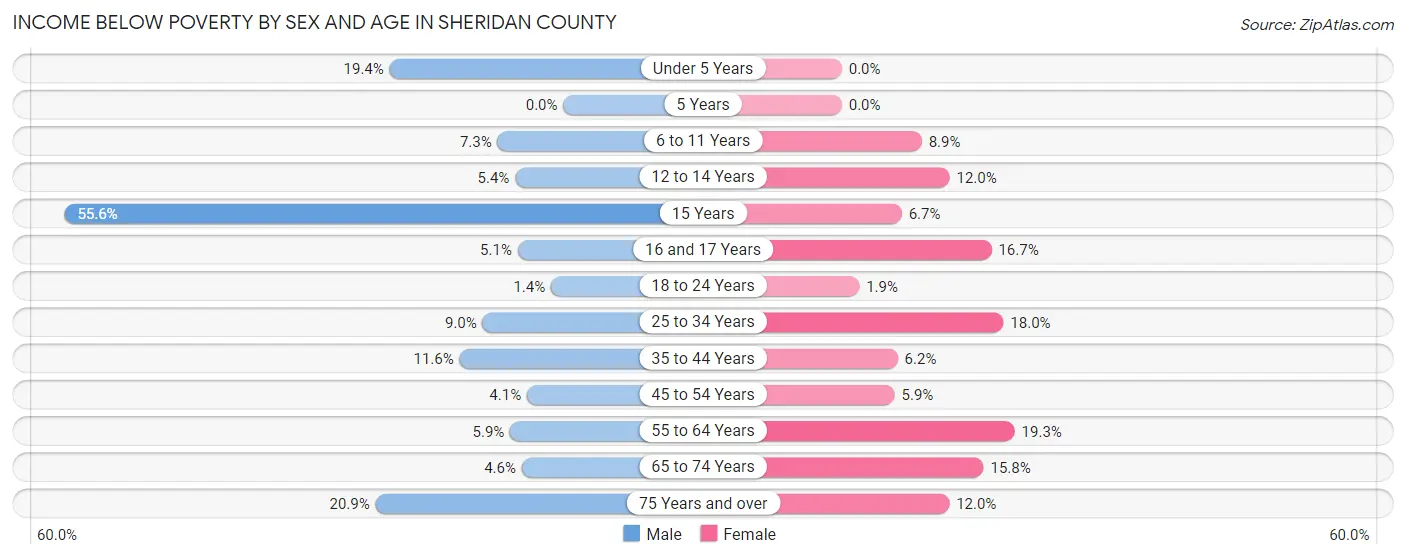
| Age Bracket | Male | Female |
| Under 5 Years | 30 (19.4%) | 0 (0.0%) |
| 5 Years | 0 (0.0%) | 0 (0.0%) |
| 6 to 11 Years | 11 (7.3%) | 17 (8.9%) |
| 12 to 14 Years | 3 (5.4%) | 3 (12.0%) |
| 15 Years | 5 (55.6%) | 1 (6.7%) |
| 16 and 17 Years | 3 (5.1%) | 4 (16.7%) |
| 18 to 24 Years | 2 (1.4%) | 2 (1.9%) |
| 25 to 34 Years | 16 (9.0%) | 36 (18.0%) |
| 35 to 44 Years | 26 (11.6%) | 14 (6.2%) |
| 45 to 54 Years | 7 (4.1%) | 12 (5.9%) |
| 55 to 64 Years | 19 (5.9%) | 51 (19.3%) |
| 65 to 74 Years | 13 (4.6%) | 24 (15.8%) |
| 75 Years and over | 32 (20.9%) | 25 (12.0%) |
| Total | 167 (8.7%) | 189 (11.1%) |
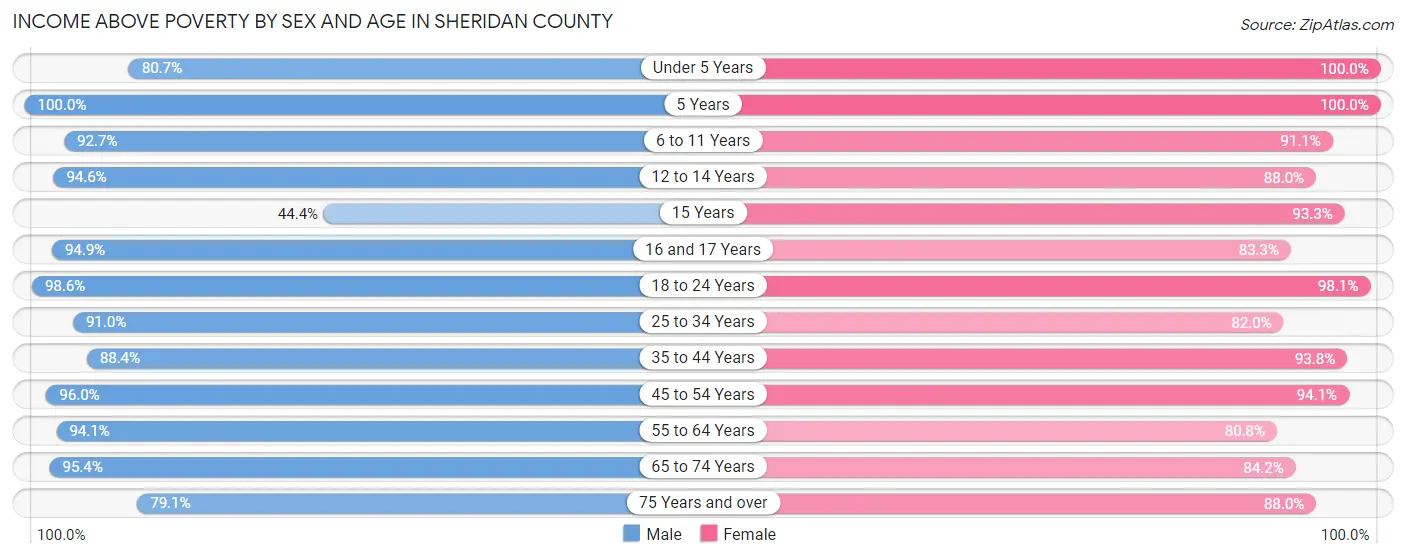
Income Above Poverty by Sex and Age in Sheridan County
According to the poverty statistics in Sheridan County, males aged 5 years and females aged under 5 years are the age groups that are most secure financially, with 100.0% of males and 100.0% of females in these age groups living above the poverty line.
| Age Bracket | Male | Female |
| Under 5 Years | 125 (80.6%) | 72 (100.0%) |
| 5 Years | 6 (100.0%) | 22 (100.0%) |
| 6 to 11 Years | 139 (92.7%) | 174 (91.1%) |
| 12 to 14 Years | 53 (94.6%) | 22 (88.0%) |
| 15 Years | 4 (44.4%) | 14 (93.3%) |
| 16 and 17 Years | 56 (94.9%) | 20 (83.3%) |
| 18 to 24 Years | 144 (98.6%) | 101 (98.1%) |
| 25 to 34 Years | 162 (91.0%) | 164 (82.0%) |
| 35 to 44 Years | 199 (88.4%) | 211 (93.8%) |
| 45 to 54 Years | 166 (96.0%) | 192 (94.1%) |
| 55 to 64 Years | 302 (94.1%) | 214 (80.7%) |
| 65 to 74 Years | 268 (95.4%) | 128 (84.2%) |
| 75 Years and over | 121 (79.1%) | 184 (88.0%) |
| Total | 1,745 (91.3%) | 1,518 (88.9%) |
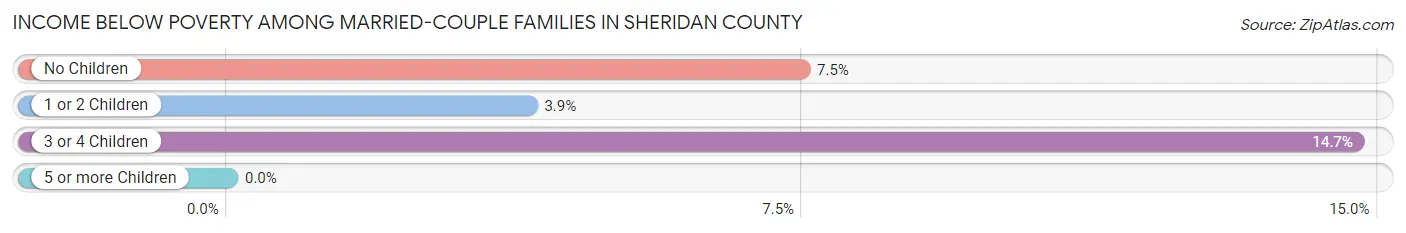
Income Below Poverty Among Married-Couple Families in Sheridan County
The poverty statistics for married-couple families in Sheridan County show that 7.2% or 55 of the total 766 families live below the poverty line. Families with 3 or 4 children have the highest poverty rate of 14.7%, comprising of 10 families. On the other hand, families with 5 or more children have the lowest poverty rate of 0.0%, which includes 0 families.
| Children | Above Poverty | Below Poverty |
| No Children | 471 (92.5%) | 38 (7.5%) |
| 1 or 2 Children | 172 (96.1%) | 7 (3.9%) |
| 3 or 4 Children | 58 (85.3%) | 10 (14.7%) |
| 5 or more Children | 10 (100.0%) | 0 (0.0%) |
| Total | 711 (92.8%) | 55 (7.2%) |
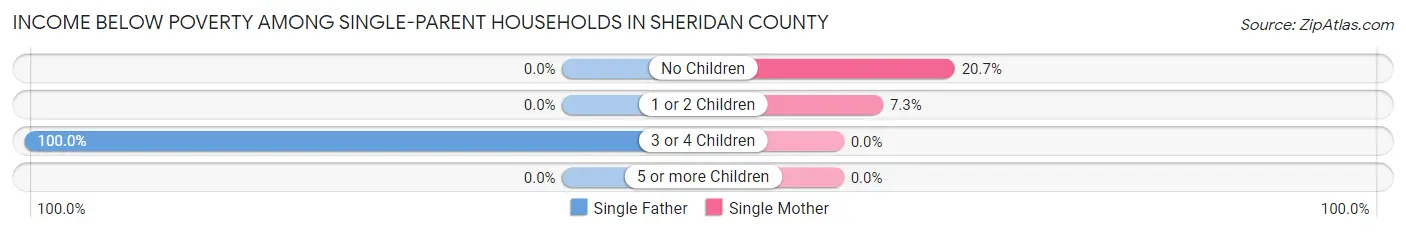
Income Below Poverty Among Single-Parent Households in Sheridan County
According to the poverty data in Sheridan County, 2.3% or 1 single-father households and 12.9% or 9 single-mother households are living below the poverty line. Among single-father households, those with 3 or 4 children have the highest poverty rate, with 1 households (100.0%) experiencing poverty. Likewise, among single-mother households, those with no children have the highest poverty rate, with 6 households (20.7%) falling below the poverty line.
| Children | Single Father | Single Mother |
| No Children | 0 (0.0%) | 6 (20.7%) |
| 1 or 2 Children | 0 (0.0%) | 3 (7.3%) |
| 3 or 4 Children | 1 (100.0%) | 0 (0.0%) |
| 5 or more Children | 0 (0.0%) | 0 (0.0%) |
| Total | 1 (2.3%) | 9 (12.9%) |
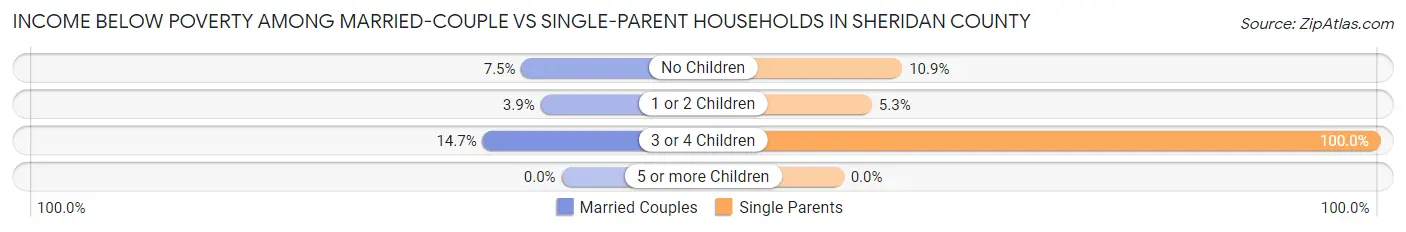
Income Below Poverty Among Married-Couple vs Single-Parent Households in Sheridan County
The poverty data for Sheridan County shows that 55 of the married-couple family households (7.2%) and 10 of the single-parent households (8.8%) are living below the poverty level. Within the married-couple family households, those with 3 or 4 children have the highest poverty rate, with 10 households (14.7%) falling below the poverty line. Among the single-parent households, those with 3 or 4 children have the highest poverty rate, with 1 household (100.0%) living below poverty.
| Children | Married-Couple Families | Single-Parent Households |
| No Children | 38 (7.5%) | 6 (10.9%) |
| 1 or 2 Children | 7 (3.9%) | 3 (5.3%) |
| 3 or 4 Children | 10 (14.7%) | 1 (100.0%) |
| 5 or more Children | 0 (0.0%) | 0 (0.0%) |
| Total | 55 (7.2%) | 10 (8.8%) |
Employment Characteristics in Sheridan County
Employment by Class of Employer in Sheridan County
Among the 1,728 employed individuals in Sheridan County, private company employees (854 | 49.4%), self-employed (not incorporated) (263 | 15.2%), and not-for-profit organizations (184 | 10.6%) make up the most common classes of employment.
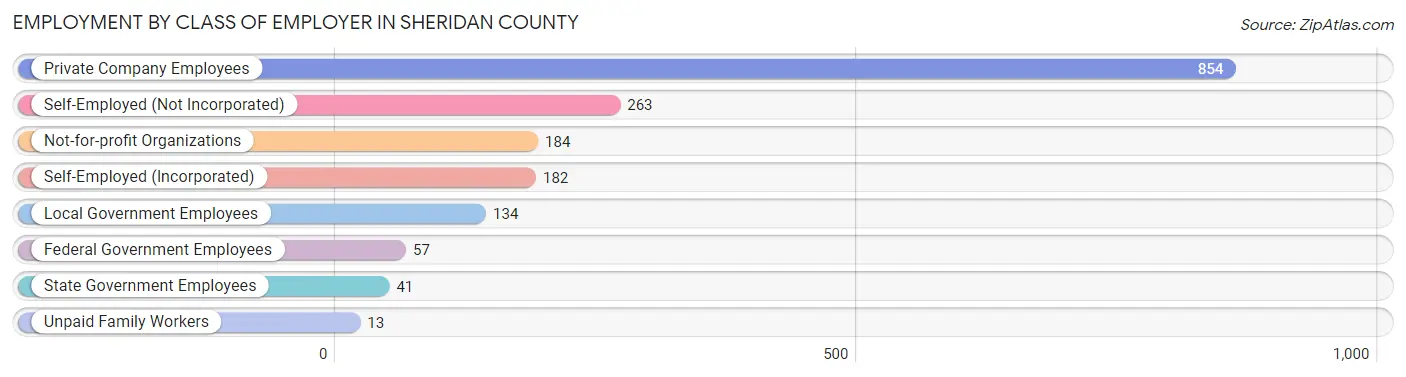
| Employer Class | # Employees | % Employees |
| Private Company Employees | 854 | 49.4% |
| Self-Employed (Incorporated) | 182 | 10.5% |
| Self-Employed (Not Incorporated) | 263 | 15.2% |
| Not-for-profit Organizations | 184 | 10.6% |
| Local Government Employees | 134 | 7.7% |
| State Government Employees | 41 | 2.4% |
| Federal Government Employees | 57 | 3.3% |
| Unpaid Family Workers | 13 | 0.7% |
| Total | 1,728 | 100.0% |
Employment Status by Age in Sheridan County
According to the labor force statistics for Sheridan County, out of the total population over 16 years of age (2,978), 61.1% or 1,820 individuals are in the labor force, with 1.5% or 27 of them unemployed. The age group with the highest labor force participation rate is 55 to 59 years, with 90.3% or 196 individuals in the labor force. Within the labor force, the 16 to 19 years age range has the highest percentage of unemployed individuals, with 26.0% or 20 of them being unemployed.
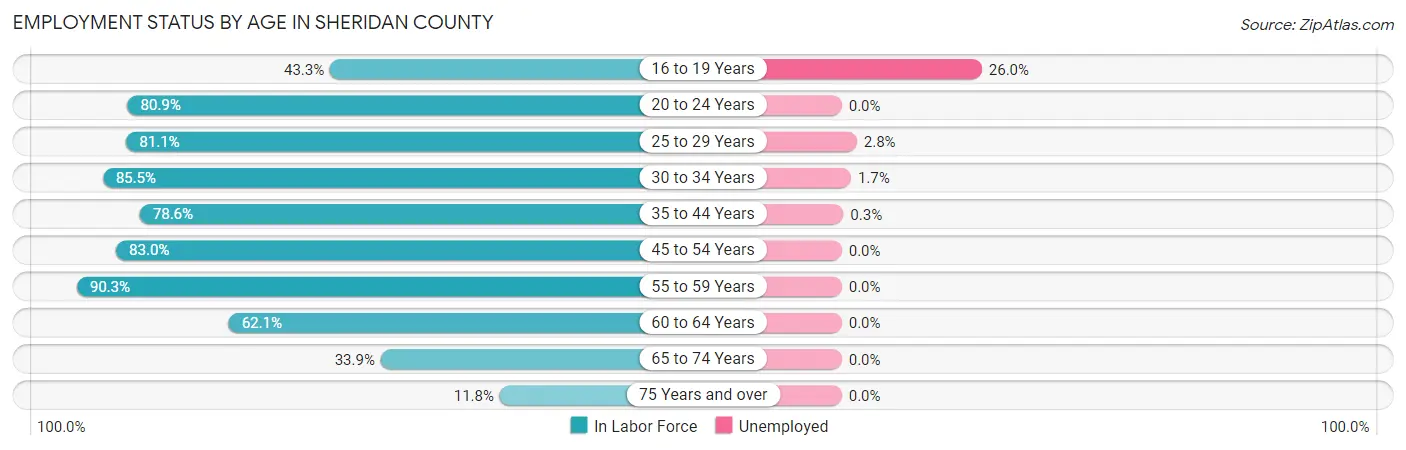
| Age Bracket | In Labor Force | Unemployed |
| 16 to 19 Years | 77 (43.3%) | 20 (26.0%) |
| 20 to 24 Years | 127 (80.9%) | 0 (0.0%) |
| 25 to 29 Years | 142 (81.1%) | 4 (2.8%) |
| 30 to 34 Years | 177 (85.5%) | 3 (1.7%) |
| 35 to 44 Years | 361 (78.6%) | 1 (0.3%) |
| 45 to 54 Years | 317 (83.0%) | 0 (0.0%) |
| 55 to 59 Years | 196 (90.3%) | 0 (0.0%) |
| 60 to 64 Years | 229 (62.1%) | 0 (0.0%) |
| 65 to 74 Years | 147 (33.9%) | 0 (0.0%) |
| 75 Years and over | 47 (11.8%) | 0 (0.0%) |
| Total | 1,820 (61.1%) | 27 (1.5%) |
Employment Status by Educational Attainment in Sheridan County
According to labor force statistics for Sheridan County, 78.6% of individuals (1,422) out of the total population between 25 and 64 years of age (1,809) are in the labor force, with 0.6% or 9 of them being unemployed. The group with the highest labor force participation rate are those with the educational attainment of college / associate degree, with 81.6% or 522 individuals in the labor force. Within the labor force, individuals with less than high school education have the highest percentage of unemployment, with 2.8% or 3 of them being unemployed.
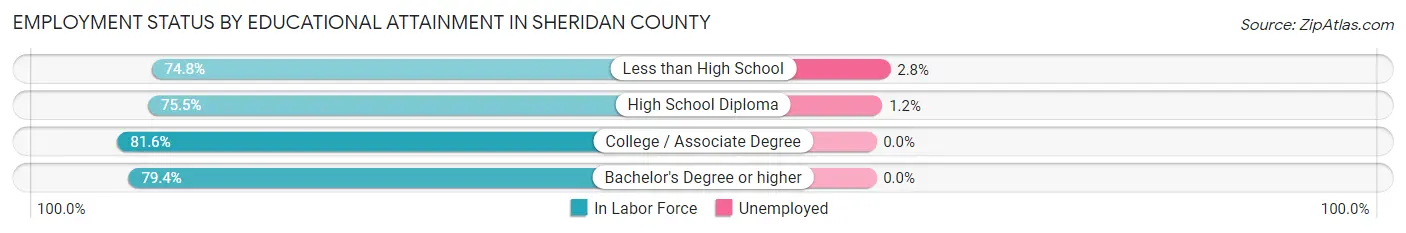
| Educational Attainment | In Labor Force | Unemployed |
| Less than High School | 107 (74.8%) | 4 (2.8%) |
| High School Diploma | 423 (75.5%) | 7 (1.2%) |
| College / Associate Degree | 522 (81.6%) | 0 (0.0%) |
| Bachelor's Degree or higher | 370 (79.4%) | 0 (0.0%) |
| Total | 1,422 (78.6%) | 11 (0.6%) |
Employment Occupations by Sex in Sheridan County
Management, Business, Science and Arts Occupations
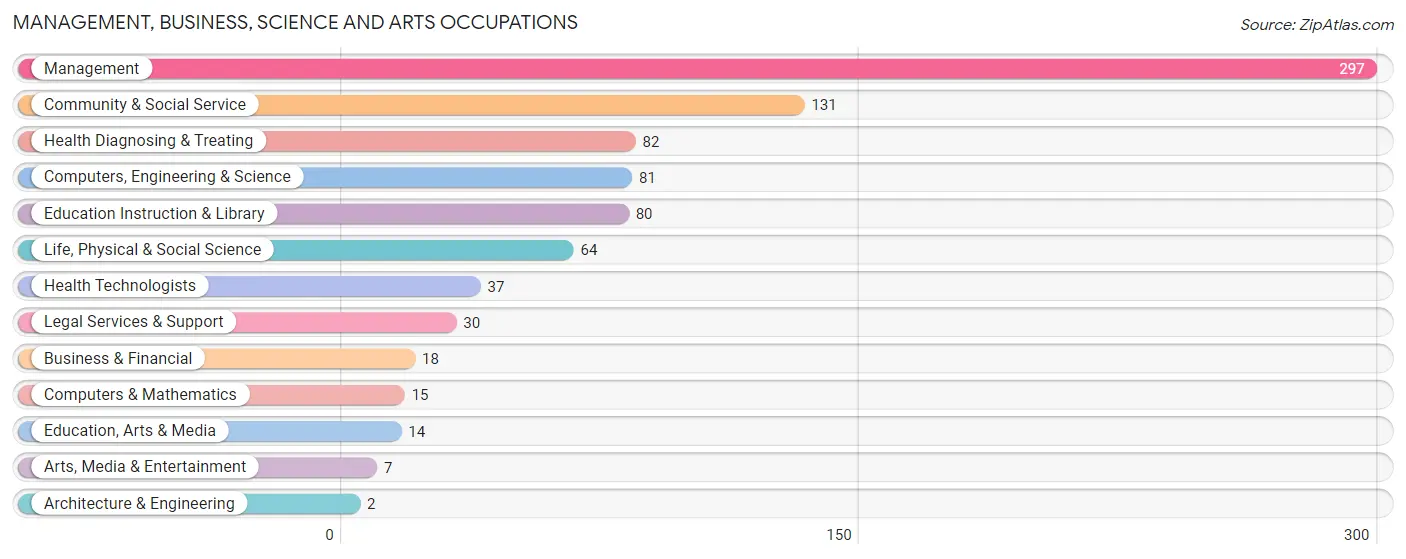
The most common Management, Business, Science and Arts occupations in Sheridan County are Management (297 | 16.6%), Community & Social Service (131 | 7.3%), Health Diagnosing & Treating (82 | 4.6%), Computers, Engineering & Science (81 | 4.5%), and Education Instruction & Library (80 | 4.5%).
Management, Business, Science and Arts Occupations by Sex
Within the Management, Business, Science and Arts occupations in Sheridan County, the most male-oriented occupations are Architecture & Engineering (100.0%), Life, Physical & Social Science (100.0%), and Legal Services & Support (90.0%), while the most female-oriented occupations are Arts, Media & Entertainment (100.0%), Health Technologists (100.0%), and Computers & Mathematics (86.7%).
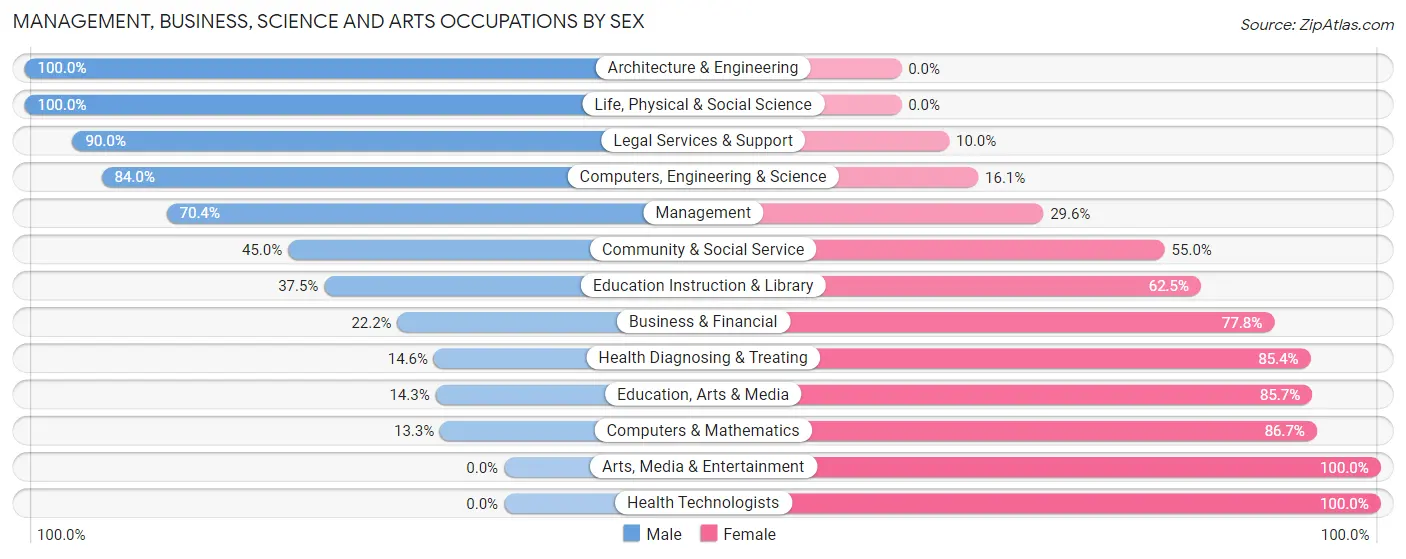
| Occupation | Male | Female |
| Management | 209 (70.4%) | 88 (29.6%) |
| Business & Financial | 4 (22.2%) | 14 (77.8%) |
| Computers, Engineering & Science | 68 (84.0%) | 13 (16.1%) |
| Computers & Mathematics | 2 (13.3%) | 13 (86.7%) |
| Architecture & Engineering | 2 (100.0%) | 0 (0.0%) |
| Life, Physical & Social Science | 64 (100.0%) | 0 (0.0%) |
| Community & Social Service | 59 (45.0%) | 72 (55.0%) |
| Education, Arts & Media | 2 (14.3%) | 12 (85.7%) |
| Legal Services & Support | 27 (90.0%) | 3 (10.0%) |
| Education Instruction & Library | 30 (37.5%) | 50 (62.5%) |
| Arts, Media & Entertainment | 0 (0.0%) | 7 (100.0%) |
| Health Diagnosing & Treating | 12 (14.6%) | 70 (85.4%) |
| Health Technologists | 0 (0.0%) | 37 (100.0%) |
| Total (Category) | 352 (57.8%) | 257 (42.2%) |
| Total (Overall) | 917 (51.3%) | 869 (48.7%) |
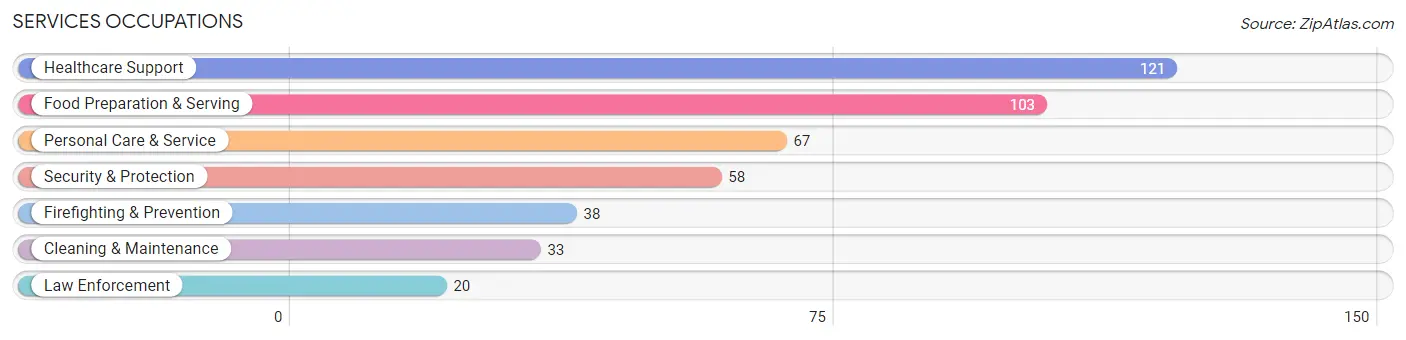
Services Occupations
The most common Services occupations in Sheridan County are Healthcare Support (121 | 6.8%), Food Preparation & Serving (103 | 5.8%), Personal Care & Service (67 | 3.7%), Security & Protection (58 | 3.3%), and Firefighting & Prevention (38 | 2.1%).
Services Occupations by Sex
Within the Services occupations in Sheridan County, the most male-oriented occupations are Food Preparation & Serving (61.2%), Law Enforcement (55.0%), and Security & Protection (43.1%), while the most female-oriented occupations are Personal Care & Service (100.0%), Healthcare Support (99.2%), and Cleaning & Maintenance (69.7%).
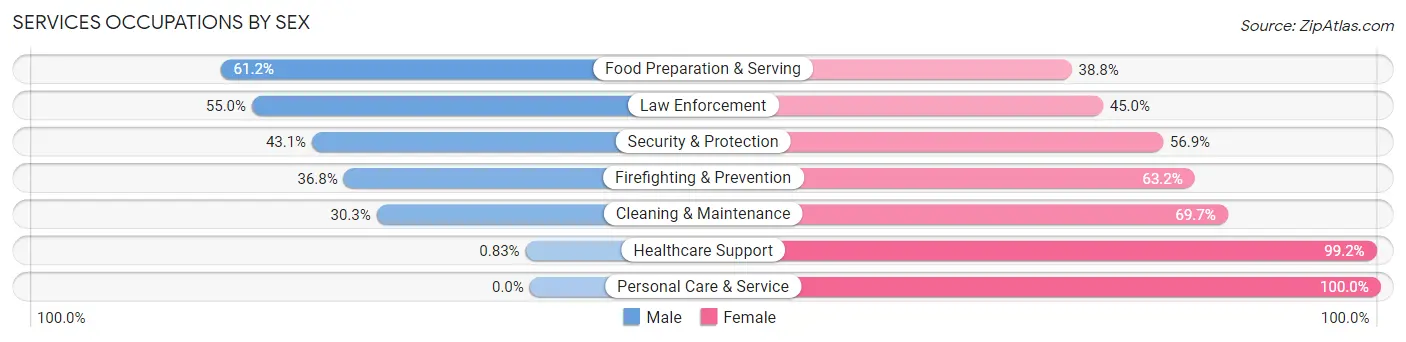
| Occupation | Male | Female |
| Healthcare Support | 1 (0.8%) | 120 (99.2%) |
| Security & Protection | 25 (43.1%) | 33 (56.9%) |
| Firefighting & Prevention | 14 (36.8%) | 24 (63.2%) |
| Law Enforcement | 11 (55.0%) | 9 (45.0%) |
| Food Preparation & Serving | 63 (61.2%) | 40 (38.8%) |
| Cleaning & Maintenance | 10 (30.3%) | 23 (69.7%) |
| Personal Care & Service | 0 (0.0%) | 67 (100.0%) |
| Total (Category) | 99 (25.9%) | 283 (74.1%) |
| Total (Overall) | 917 (51.3%) | 869 (48.7%) |
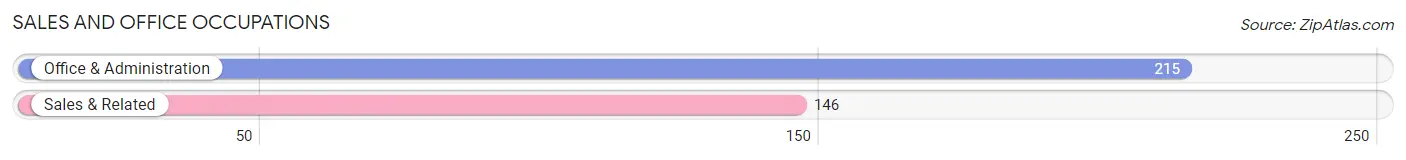
Sales and Office Occupations
The most common Sales and Office occupations in Sheridan County are Office & Administration (215 | 12.0%), and Sales & Related (146 | 8.2%).
Sales and Office Occupations by Sex
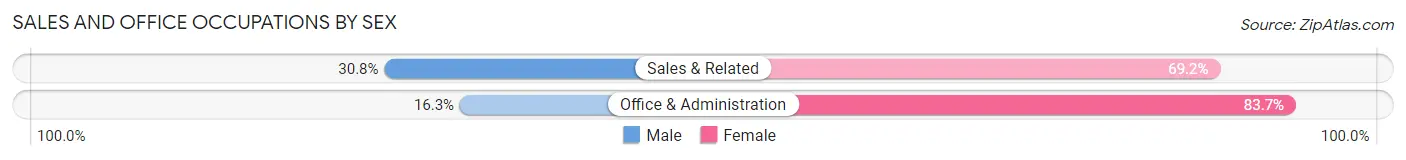
| Occupation | Male | Female |
| Sales & Related | 45 (30.8%) | 101 (69.2%) |
| Office & Administration | 35 (16.3%) | 180 (83.7%) |
| Total (Category) | 80 (22.2%) | 281 (77.8%) |
| Total (Overall) | 917 (51.3%) | 869 (48.7%) |
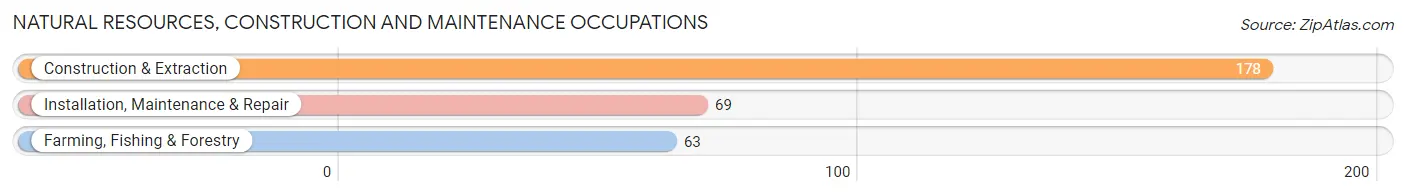
Natural Resources, Construction and Maintenance Occupations
The most common Natural Resources, Construction and Maintenance occupations in Sheridan County are Construction & Extraction (178 | 10.0%), Installation, Maintenance & Repair (69 | 3.9%), and Farming, Fishing & Forestry (63 | 3.5%).
Natural Resources, Construction and Maintenance Occupations by Sex
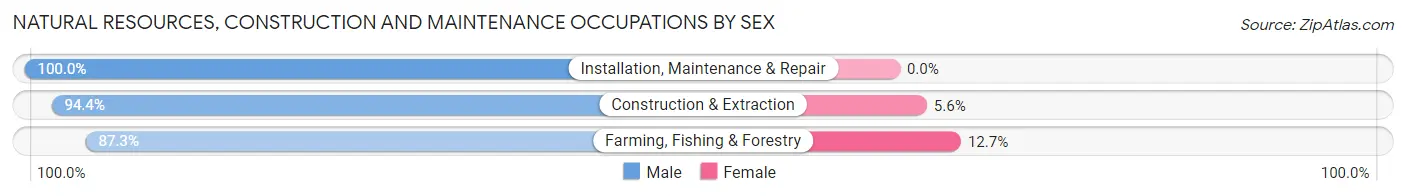
| Occupation | Male | Female |
| Farming, Fishing & Forestry | 55 (87.3%) | 8 (12.7%) |
| Construction & Extraction | 168 (94.4%) | 10 (5.6%) |
| Installation, Maintenance & Repair | 69 (100.0%) | 0 (0.0%) |
| Total (Category) | 292 (94.2%) | 18 (5.8%) |
| Total (Overall) | 917 (51.3%) | 869 (48.7%) |
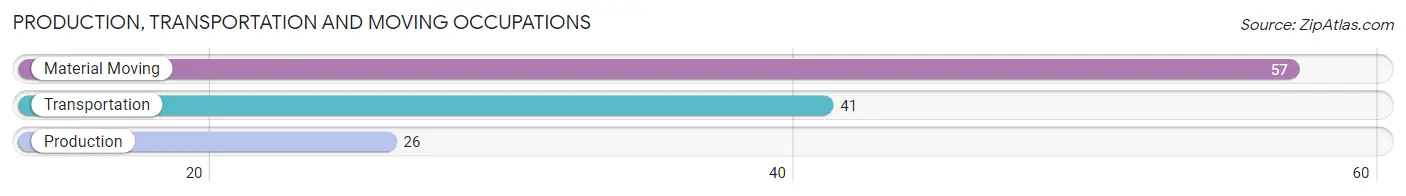
Production, Transportation and Moving Occupations
The most common Production, Transportation and Moving occupations in Sheridan County are Material Moving (57 | 3.2%), Transportation (41 | 2.3%), and Production (26 | 1.5%).
Production, Transportation and Moving Occupations by Sex
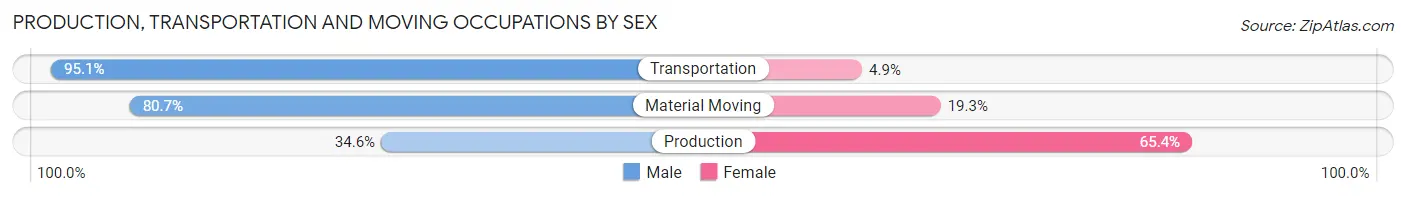
| Occupation | Male | Female |
| Production | 9 (34.6%) | 17 (65.4%) |
| Transportation | 39 (95.1%) | 2 (4.9%) |
| Material Moving | 46 (80.7%) | 11 (19.3%) |
| Total (Category) | 94 (75.8%) | 30 (24.2%) |
| Total (Overall) | 917 (51.3%) | 869 (48.7%) |
Employment Industries by Sex in Sheridan County
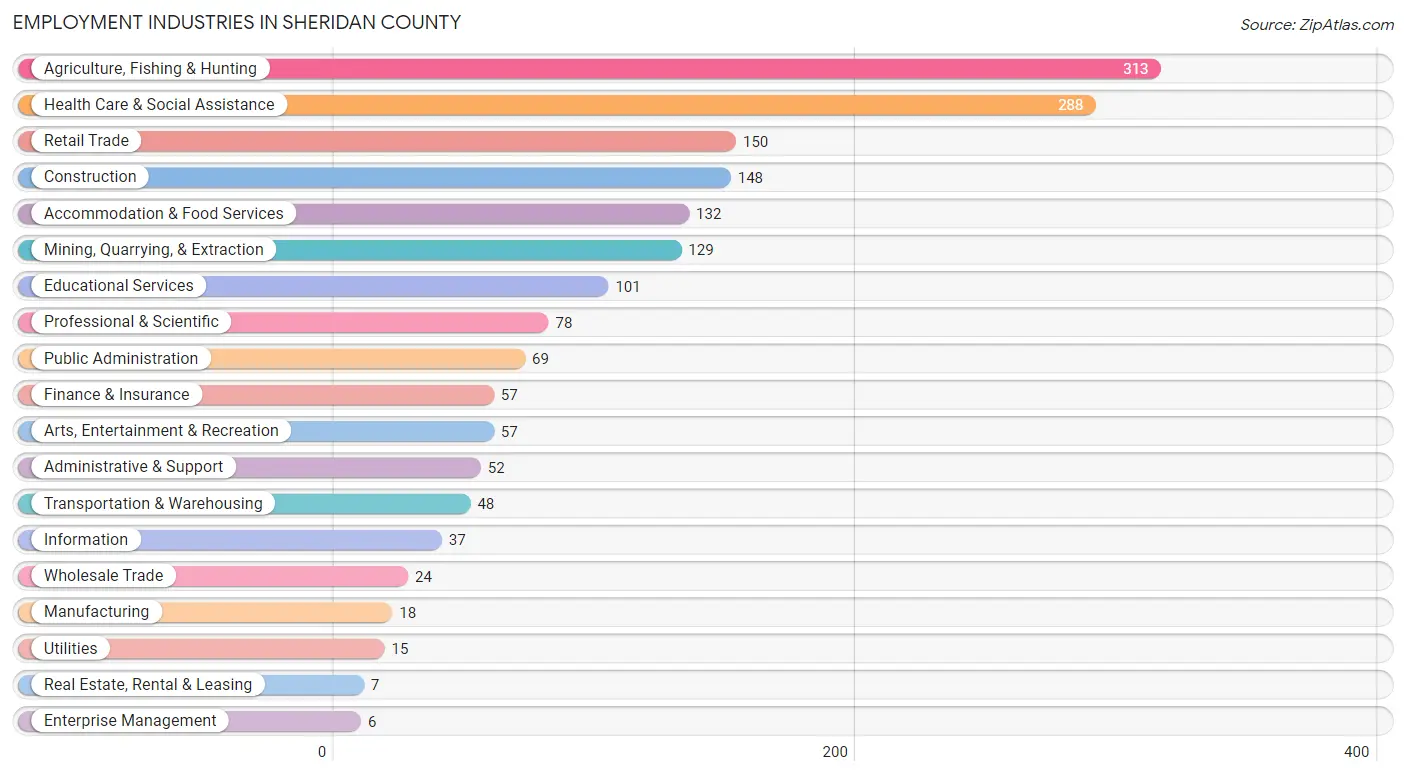
Employment Industries in Sheridan County
The major employment industries in Sheridan County include Agriculture, Fishing & Hunting (313 | 17.5%), Health Care & Social Assistance (288 | 16.1%), Retail Trade (150 | 8.4%), Construction (148 | 8.3%), and Accommodation & Food Services (132 | 7.4%).
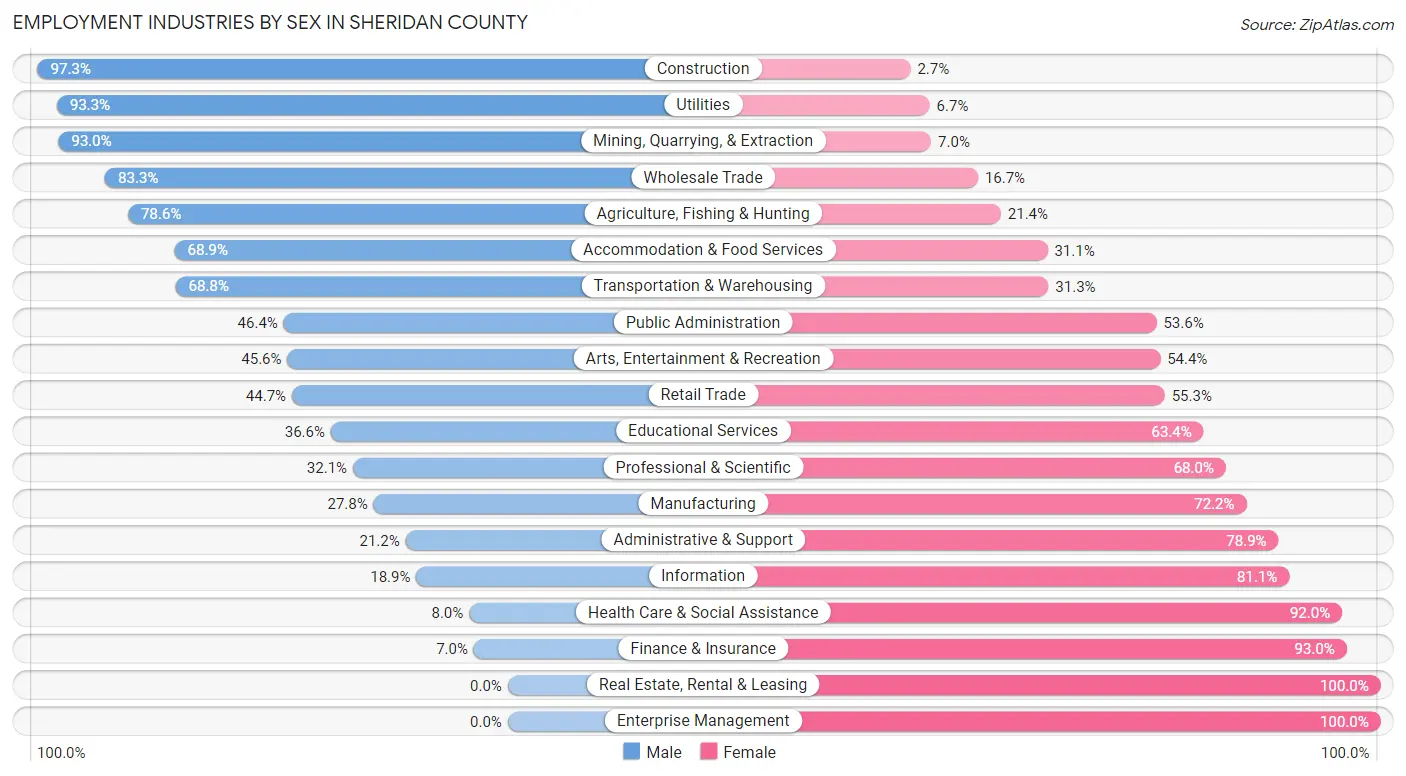
Employment Industries by Sex in Sheridan County
The Sheridan County industries that see more men than women are Construction (97.3%), Utilities (93.3%), and Mining, Quarrying, & Extraction (93.0%), whereas the industries that tend to have a higher number of women are Real Estate, Rental & Leasing (100.0%), Enterprise Management (100.0%), and Finance & Insurance (93.0%).
| Industry | Male | Female |
| Agriculture, Fishing & Hunting | 246 (78.6%) | 67 (21.4%) |
| Mining, Quarrying, & Extraction | 120 (93.0%) | 9 (7.0%) |
| Construction | 144 (97.3%) | 4 (2.7%) |
| Manufacturing | 5 (27.8%) | 13 (72.2%) |
| Wholesale Trade | 20 (83.3%) | 4 (16.7%) |
| Retail Trade | 67 (44.7%) | 83 (55.3%) |
| Transportation & Warehousing | 33 (68.8%) | 15 (31.2%) |
| Utilities | 14 (93.3%) | 1 (6.7%) |
| Information | 7 (18.9%) | 30 (81.1%) |
| Finance & Insurance | 4 (7.0%) | 53 (93.0%) |
| Real Estate, Rental & Leasing | 0 (0.0%) | 7 (100.0%) |
| Professional & Scientific | 25 (32.1%) | 53 (67.9%) |
| Enterprise Management | 0 (0.0%) | 6 (100.0%) |
| Administrative & Support | 11 (21.1%) | 41 (78.8%) |
| Educational Services | 37 (36.6%) | 64 (63.4%) |
| Health Care & Social Assistance | 23 (8.0%) | 265 (92.0%) |
| Arts, Entertainment & Recreation | 26 (45.6%) | 31 (54.4%) |
| Accommodation & Food Services | 91 (68.9%) | 41 (31.1%) |
| Public Administration | 32 (46.4%) | 37 (53.6%) |
| Total | 917 (51.3%) | 869 (48.7%) |
Education in Sheridan County
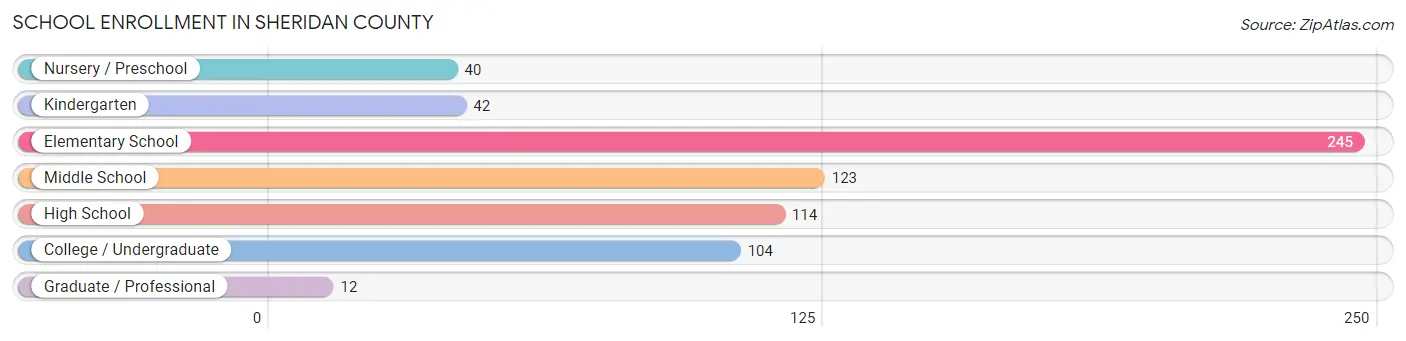
School Enrollment in Sheridan County
The most common levels of schooling among the 680 students in Sheridan County are elementary school (245 | 36.0%), middle school (123 | 18.1%), and high school (114 | 16.8%).
| School Level | # Students | % Students |
| Nursery / Preschool | 40 | 5.9% |
| Kindergarten | 42 | 6.2% |
| Elementary School | 245 | 36.0% |
| Middle School | 123 | 18.1% |
| High School | 114 | 16.8% |
| College / Undergraduate | 104 | 15.3% |
| Graduate / Professional | 12 | 1.8% |
| Total | 680 | 100.0% |
School Enrollment by Age by Funding Source in Sheridan County
Out of a total of 680 students who are enrolled in schools in Sheridan County, 151 (22.2%) attend a private institution, while the remaining 529 (77.8%) are enrolled in public schools. The age group of 35 years and over has the highest likelihood of being enrolled in private schools, with 17 (58.6% in the age bracket) enrolled. Conversely, the age group of 15 to 17 year olds has the lowest likelihood of being enrolled in a private school, with 92 (100.0% in the age bracket) attending a public institution.
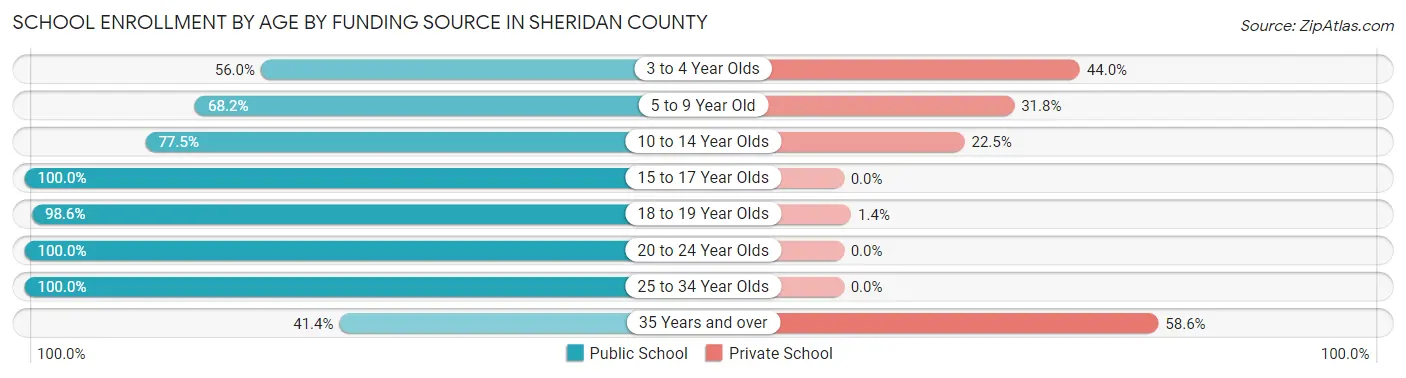
| Age Bracket | Public School | Private School |
| 3 to 4 Year Olds | 14 (56.0%) | 11 (44.0%) |
| 5 to 9 Year Old | 189 (68.2%) | 88 (31.8%) |
| 10 to 14 Year Olds | 117 (77.5%) | 34 (22.5%) |
| 15 to 17 Year Olds | 92 (100.0%) | 0 (0.0%) |
| 18 to 19 Year Olds | 71 (98.6%) | 1 (1.4%) |
| 20 to 24 Year Olds | 18 (100.0%) | 0 (0.0%) |
| 25 to 34 Year Olds | 16 (100.0%) | 0 (0.0%) |
| 35 Years and over | 12 (41.4%) | 17 (58.6%) |
| Total | 529 (77.8%) | 151 (22.2%) |
Educational Attainment by Field of Study in Sheridan County
Education (189 | 24.8%), bio, nature & agricultural (147 | 19.3%), business (139 | 18.3%), engineering (68 | 8.9%), and arts & humanities (51 | 6.7%) are the most common fields of study among 761 individuals in Sheridan County who have obtained a bachelor's degree or higher.
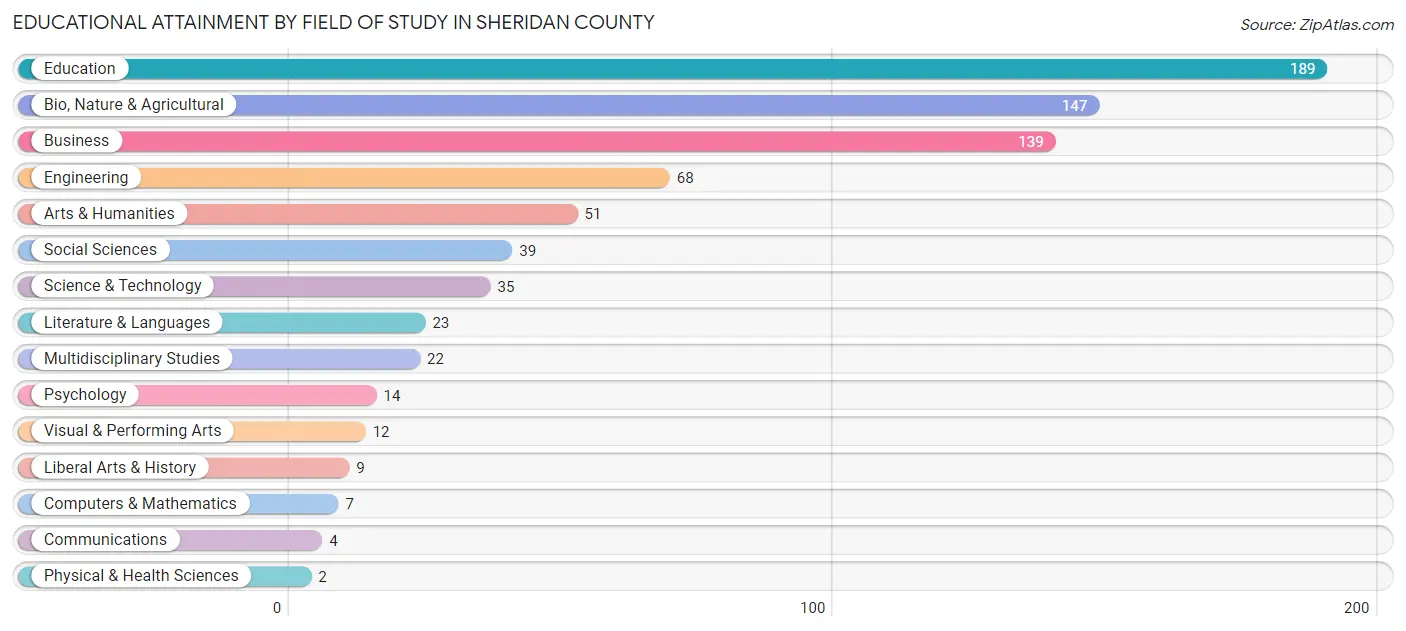
| Field of Study | # Graduates | % Graduates |
| Computers & Mathematics | 7 | 0.9% |
| Bio, Nature & Agricultural | 147 | 19.3% |
| Physical & Health Sciences | 2 | 0.3% |
| Psychology | 14 | 1.8% |
| Social Sciences | 39 | 5.1% |
| Engineering | 68 | 8.9% |
| Multidisciplinary Studies | 22 | 2.9% |
| Science & Technology | 35 | 4.6% |
| Business | 139 | 18.3% |
| Education | 189 | 24.8% |
| Literature & Languages | 23 | 3.0% |
| Liberal Arts & History | 9 | 1.2% |
| Visual & Performing Arts | 12 | 1.6% |
| Communications | 4 | 0.5% |
| Arts & Humanities | 51 | 6.7% |
| Total | 761 | 100.0% |
Transportation & Commute in Sheridan County
Vehicle Availability by Sex in Sheridan County
The most prevalent vehicle ownership categories in Sheridan County are males with 2 vehicles (271, accounting for 30.7%) and females with 2 vehicles (258, making up 33.2%).
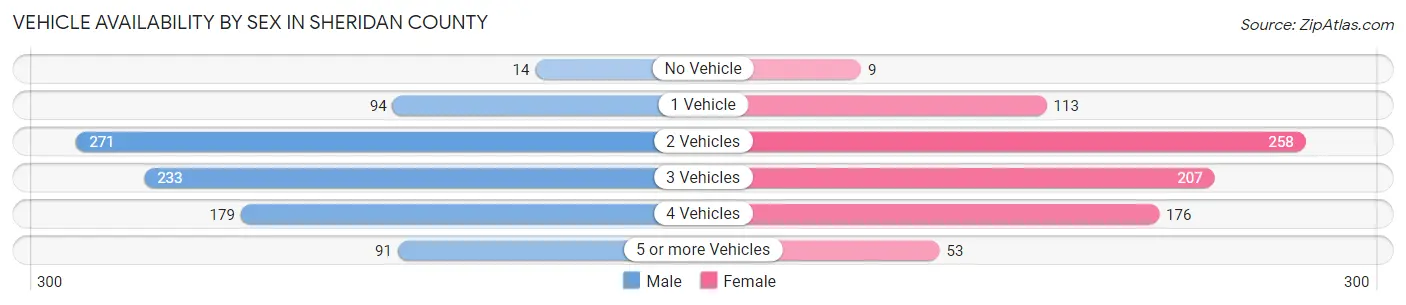
| Vehicles Available | Male | Female |
| No Vehicle | 14 (1.6%) | 9 (1.1%) |
| 1 Vehicle | 94 (10.7%) | 113 (13.9%) |
| 2 Vehicles | 271 (30.7%) | 258 (31.6%) |
| 3 Vehicles | 233 (26.4%) | 207 (25.4%) |
| 4 Vehicles | 179 (20.3%) | 176 (21.6%) |
| 5 or more Vehicles | 91 (10.3%) | 53 (6.5%) |
| Total | 882 (100.0%) | 816 (100.0%) |
Commute Time in Sheridan County
The most frequently occuring commute durations in Sheridan County are 5 to 9 minutes (410 commuters, 24.9%), 10 to 14 minutes (345 commuters, 21.0%), and less than 5 minutes (306 commuters, 18.6%).
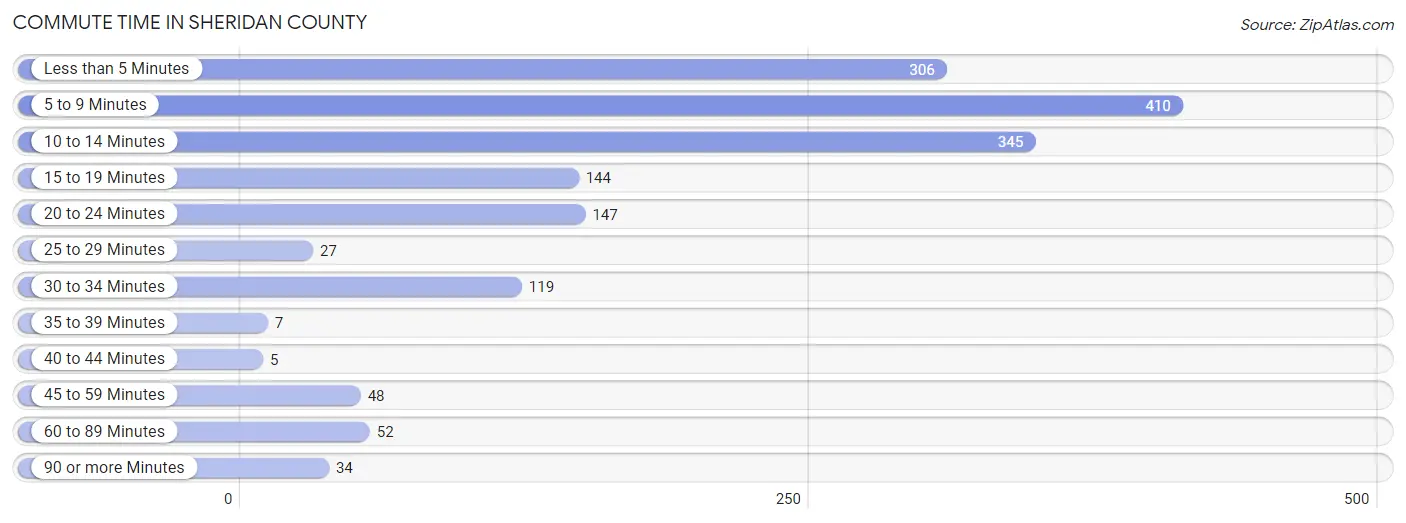
| Commute Time | # Commuters | % Commuters |
| Less than 5 Minutes | 306 | 18.6% |
| 5 to 9 Minutes | 410 | 24.9% |
| 10 to 14 Minutes | 345 | 21.0% |
| 15 to 19 Minutes | 144 | 8.8% |
| 20 to 24 Minutes | 147 | 8.9% |
| 25 to 29 Minutes | 27 | 1.6% |
| 30 to 34 Minutes | 119 | 7.2% |
| 35 to 39 Minutes | 7 | 0.4% |
| 40 to 44 Minutes | 5 | 0.3% |
| 45 to 59 Minutes | 48 | 2.9% |
| 60 to 89 Minutes | 52 | 3.2% |
| 90 or more Minutes | 34 | 2.1% |
Commute Time by Sex in Sheridan County
The most common commute times in Sheridan County are 10 to 14 minutes (201 commuters, 23.5%) for males and 5 to 9 minutes (219 commuters, 27.7%) for females.
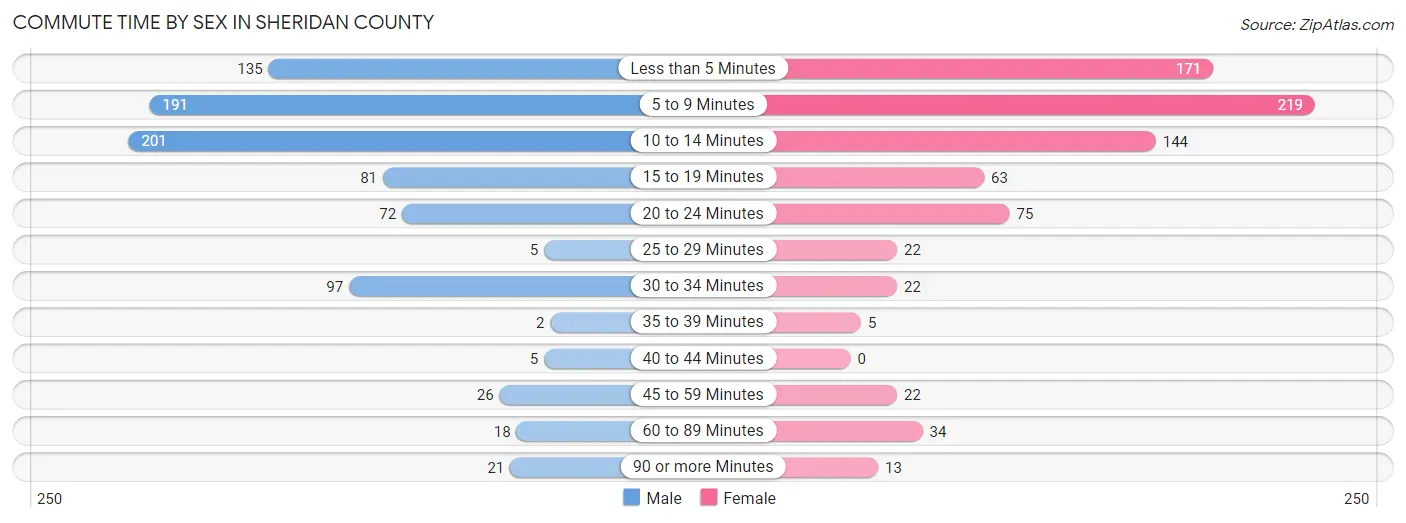
| Commute Time | Male | Female |
| Less than 5 Minutes | 135 (15.8%) | 171 (21.6%) |
| 5 to 9 Minutes | 191 (22.4%) | 219 (27.7%) |
| 10 to 14 Minutes | 201 (23.5%) | 144 (18.2%) |
| 15 to 19 Minutes | 81 (9.5%) | 63 (8.0%) |
| 20 to 24 Minutes | 72 (8.4%) | 75 (9.5%) |
| 25 to 29 Minutes | 5 (0.6%) | 22 (2.8%) |
| 30 to 34 Minutes | 97 (11.4%) | 22 (2.8%) |
| 35 to 39 Minutes | 2 (0.2%) | 5 (0.6%) |
| 40 to 44 Minutes | 5 (0.6%) | 0 (0.0%) |
| 45 to 59 Minutes | 26 (3.0%) | 22 (2.8%) |
| 60 to 89 Minutes | 18 (2.1%) | 34 (4.3%) |
| 90 or more Minutes | 21 (2.5%) | 13 (1.7%) |
Time of Departure to Work by Sex in Sheridan County
The most frequent times of departure to work in Sheridan County are 7:30 AM to 7:59 AM (175, 20.5%) for males and 7:30 AM to 7:59 AM (200, 25.3%) for females.
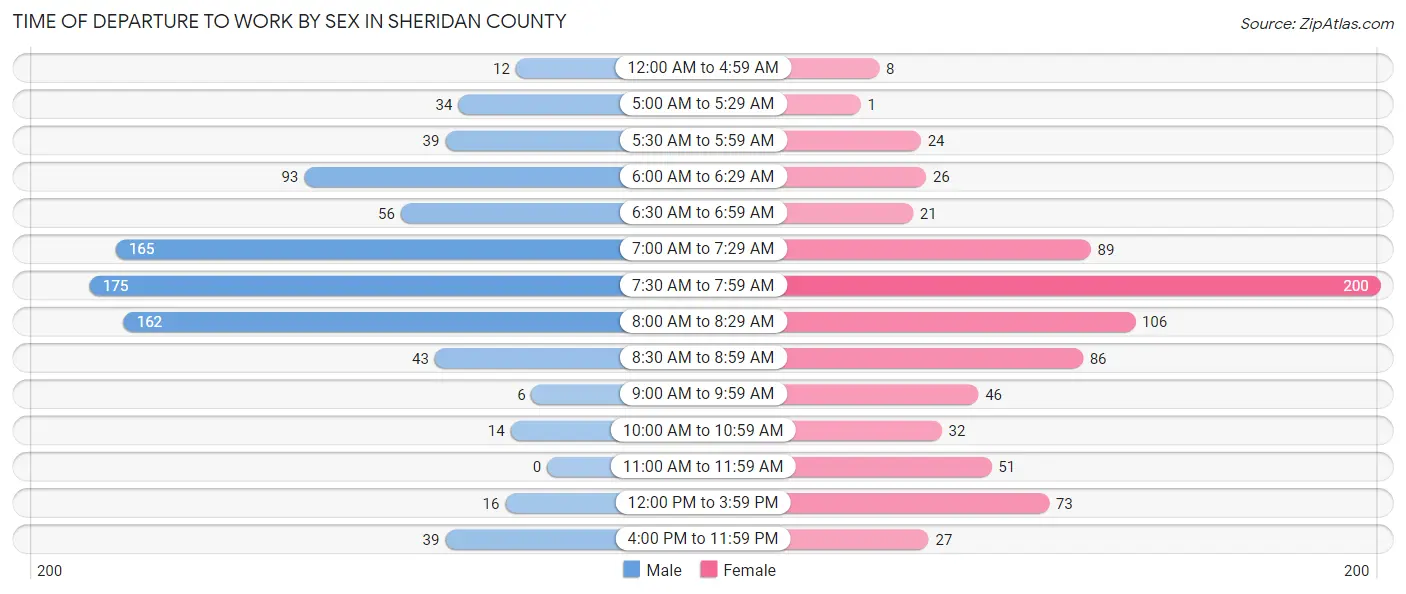
| Time of Departure | Male | Female |
| 12:00 AM to 4:59 AM | 12 (1.4%) | 8 (1.0%) |
| 5:00 AM to 5:29 AM | 34 (4.0%) | 1 (0.1%) |
| 5:30 AM to 5:59 AM | 39 (4.6%) | 24 (3.0%) |
| 6:00 AM to 6:29 AM | 93 (10.9%) | 26 (3.3%) |
| 6:30 AM to 6:59 AM | 56 (6.6%) | 21 (2.7%) |
| 7:00 AM to 7:29 AM | 165 (19.3%) | 89 (11.3%) |
| 7:30 AM to 7:59 AM | 175 (20.5%) | 200 (25.3%) |
| 8:00 AM to 8:29 AM | 162 (19.0%) | 106 (13.4%) |
| 8:30 AM to 8:59 AM | 43 (5.0%) | 86 (10.9%) |
| 9:00 AM to 9:59 AM | 6 (0.7%) | 46 (5.8%) |
| 10:00 AM to 10:59 AM | 14 (1.6%) | 32 (4.1%) |
| 11:00 AM to 11:59 AM | 0 (0.0%) | 51 (6.5%) |
| 12:00 PM to 3:59 PM | 16 (1.9%) | 73 (9.2%) |
| 4:00 PM to 11:59 PM | 39 (4.6%) | 27 (3.4%) |
| Total | 854 (100.0%) | 790 (100.0%) |
Housing Occupancy in Sheridan County
Occupancy by Ownership in Sheridan County
Of the total 1,439 dwellings in Sheridan County, owner-occupied units account for 1,112 (77.3%), while renter-occupied units make up 327 (22.7%).
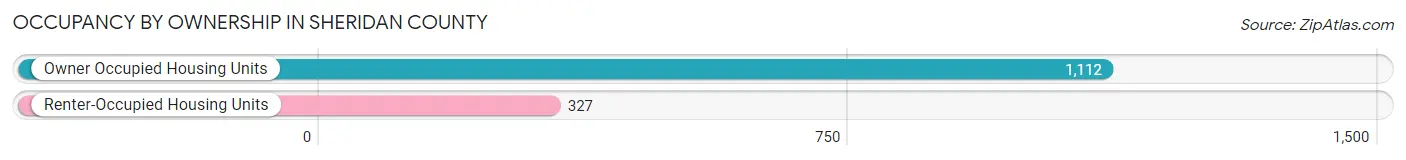
| Occupancy | # Housing Units | % Housing Units |
| Owner Occupied Housing Units | 1,112 | 77.3% |
| Renter-Occupied Housing Units | 327 | 22.7% |
| Total Occupied Housing Units | 1,439 | 100.0% |
Occupancy by Household Size in Sheridan County
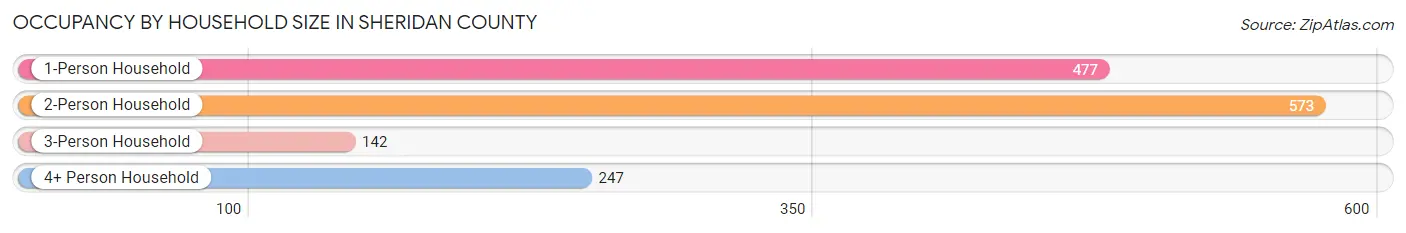
| Household Size | # Housing Units | % Housing Units |
| 1-Person Household | 477 | 33.2% |
| 2-Person Household | 573 | 39.8% |
| 3-Person Household | 142 | 9.9% |
| 4+ Person Household | 247 | 17.2% |
| Total Housing Units | 1,439 | 100.0% |
Occupancy by Ownership by Household Size in Sheridan County
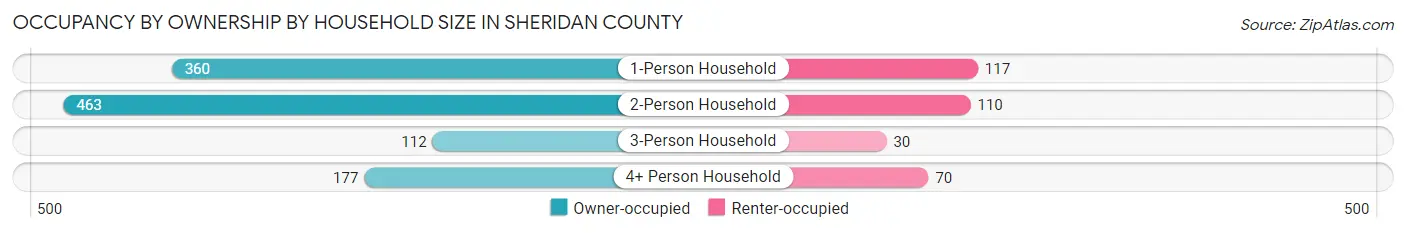
| Household Size | Owner-occupied | Renter-occupied |
| 1-Person Household | 360 (75.5%) | 117 (24.5%) |
| 2-Person Household | 463 (80.8%) | 110 (19.2%) |
| 3-Person Household | 112 (78.9%) | 30 (21.1%) |
| 4+ Person Household | 177 (71.7%) | 70 (28.3%) |
| Total Housing Units | 1,112 (77.3%) | 327 (22.7%) |
Occupancy by Educational Attainment in Sheridan County
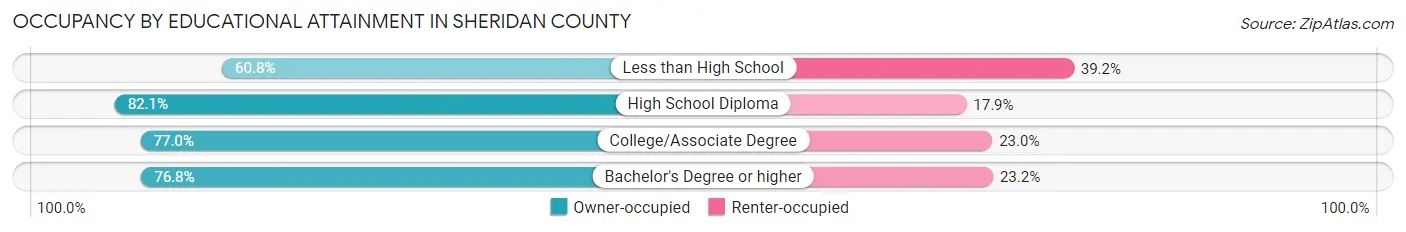
| Household Size | Owner-occupied | Renter-occupied |
| Less than High School | 59 (60.8%) | 38 (39.2%) |
| High School Diploma | 326 (82.1%) | 71 (17.9%) |
| College/Associate Degree | 445 (77.0%) | 133 (23.0%) |
| Bachelor's Degree or higher | 282 (76.8%) | 85 (23.2%) |
Occupancy by Age of Householder in Sheridan County
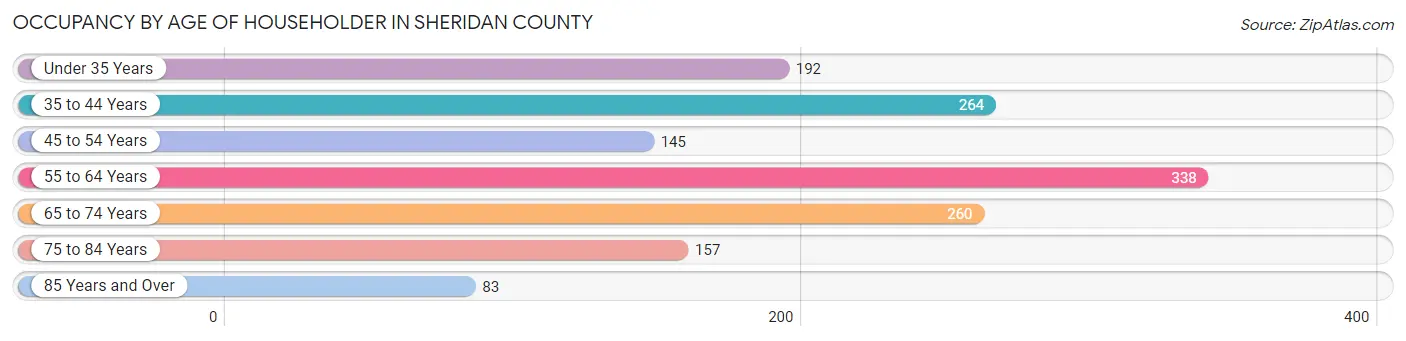
| Age Bracket | # Households | % Households |
| Under 35 Years | 192 | 13.3% |
| 35 to 44 Years | 264 | 18.3% |
| 45 to 54 Years | 145 | 10.1% |
| 55 to 64 Years | 338 | 23.5% |
| 65 to 74 Years | 260 | 18.1% |
| 75 to 84 Years | 157 | 10.9% |
| 85 Years and Over | 83 | 5.8% |
| Total | 1,439 | 100.0% |
Housing Finances in Sheridan County
Median Income by Occupancy in Sheridan County
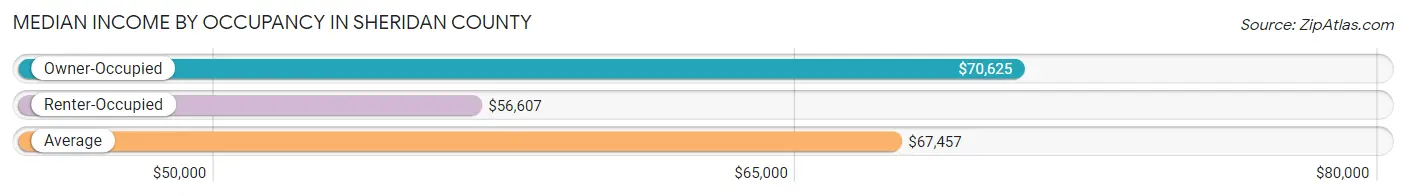
| Occupancy Type | # Households | Median Income |
| Owner-Occupied | 1,112 (77.3%) | $70,625 |
| Renter-Occupied | 327 (22.7%) | $56,607 |
| Average | 1,439 (100.0%) | $67,457 |
Occupancy by Householder Income Bracket in Sheridan County
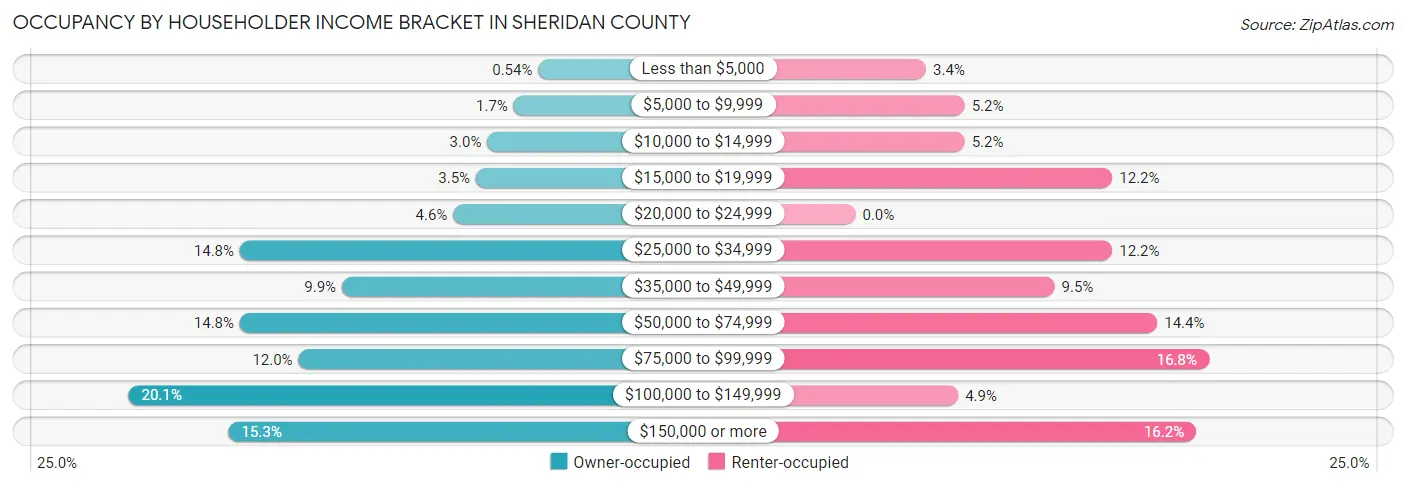
| Income Bracket | Owner-occupied | Renter-occupied |
| Less than $5,000 | 6 (0.5%) | 11 (3.4%) |
| $5,000 to $9,999 | 19 (1.7%) | 17 (5.2%) |
| $10,000 to $14,999 | 33 (3.0%) | 17 (5.2%) |
| $15,000 to $19,999 | 39 (3.5%) | 40 (12.2%) |
| $20,000 to $24,999 | 51 (4.6%) | 0 (0.0%) |
| $25,000 to $34,999 | 164 (14.7%) | 40 (12.2%) |
| $35,000 to $49,999 | 110 (9.9%) | 31 (9.5%) |
| $50,000 to $74,999 | 164 (14.7%) | 47 (14.4%) |
| $75,000 to $99,999 | 133 (12.0%) | 55 (16.8%) |
| $100,000 to $149,999 | 223 (20.1%) | 16 (4.9%) |
| $150,000 or more | 170 (15.3%) | 53 (16.2%) |
| Total | 1,112 (100.0%) | 327 (100.0%) |
Monthly Housing Cost Tiers in Sheridan County
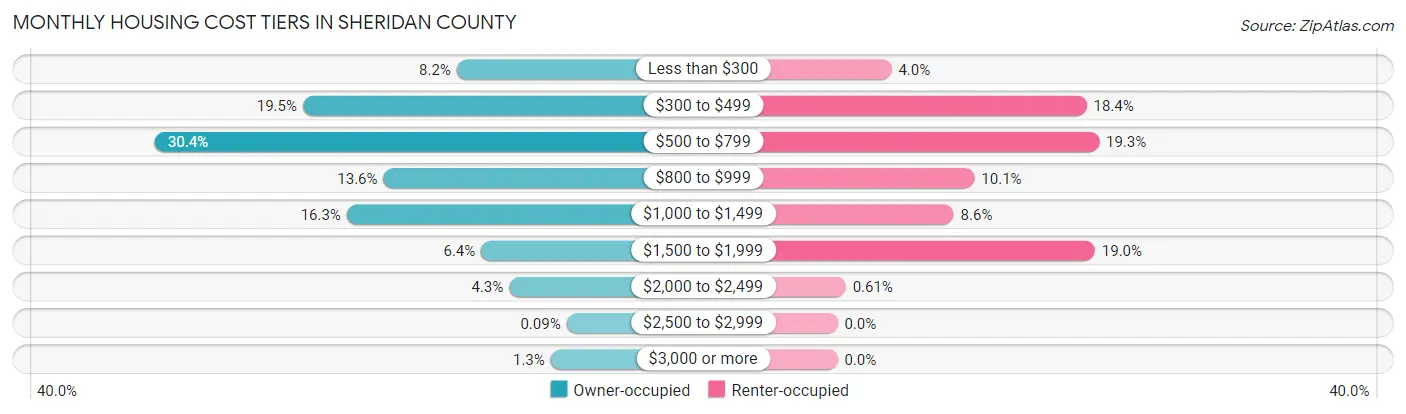
| Monthly Cost | Owner-occupied | Renter-occupied |
| Less than $300 | 91 (8.2%) | 13 (4.0%) |
| $300 to $499 | 217 (19.5%) | 60 (18.3%) |
| $500 to $799 | 338 (30.4%) | 63 (19.3%) |
| $800 to $999 | 151 (13.6%) | 33 (10.1%) |
| $1,000 to $1,499 | 181 (16.3%) | 28 (8.6%) |
| $1,500 to $1,999 | 71 (6.4%) | 62 (19.0%) |
| $2,000 to $2,499 | 48 (4.3%) | 2 (0.6%) |
| $2,500 to $2,999 | 1 (0.1%) | 0 (0.0%) |
| $3,000 or more | 14 (1.3%) | 0 (0.0%) |
| Total | 1,112 (100.0%) | 327 (100.0%) |
Physical Housing Characteristics in Sheridan County
Housing Structures in Sheridan County
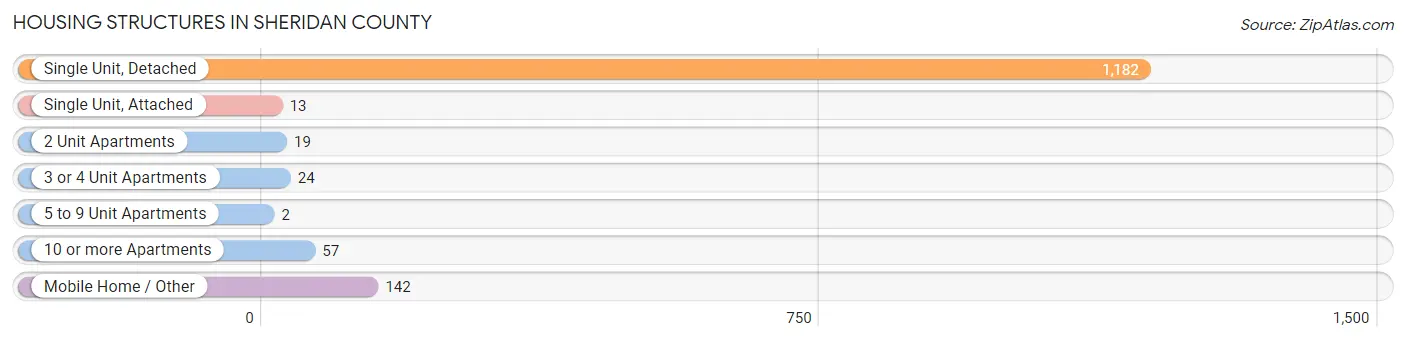
| Structure Type | # Housing Units | % Housing Units |
| Single Unit, Detached | 1,182 | 82.1% |
| Single Unit, Attached | 13 | 0.9% |
| 2 Unit Apartments | 19 | 1.3% |
| 3 or 4 Unit Apartments | 24 | 1.7% |
| 5 to 9 Unit Apartments | 2 | 0.1% |
| 10 or more Apartments | 57 | 4.0% |
| Mobile Home / Other | 142 | 9.9% |
| Total | 1,439 | 100.0% |
Housing Structures by Occupancy in Sheridan County
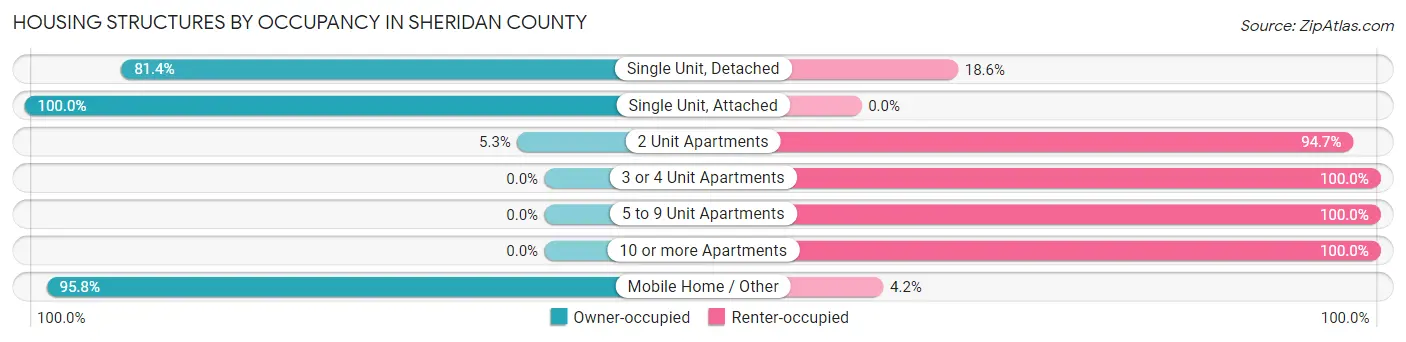
| Structure Type | Owner-occupied | Renter-occupied |
| Single Unit, Detached | 962 (81.4%) | 220 (18.6%) |
| Single Unit, Attached | 13 (100.0%) | 0 (0.0%) |
| 2 Unit Apartments | 1 (5.3%) | 18 (94.7%) |
| 3 or 4 Unit Apartments | 0 (0.0%) | 24 (100.0%) |
| 5 to 9 Unit Apartments | 0 (0.0%) | 2 (100.0%) |
| 10 or more Apartments | 0 (0.0%) | 57 (100.0%) |
| Mobile Home / Other | 136 (95.8%) | 6 (4.2%) |
| Total | 1,112 (77.3%) | 327 (22.7%) |
Housing Structures by Number of Rooms in Sheridan County
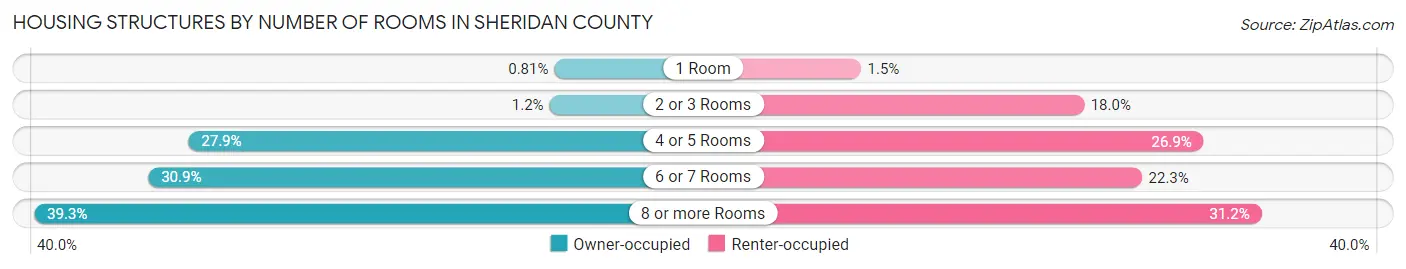
| Number of Rooms | Owner-occupied | Renter-occupied |
| 1 Room | 9 (0.8%) | 5 (1.5%) |
| 2 or 3 Rooms | 13 (1.2%) | 59 (18.0%) |
| 4 or 5 Rooms | 310 (27.9%) | 88 (26.9%) |
| 6 or 7 Rooms | 343 (30.8%) | 73 (22.3%) |
| 8 or more Rooms | 437 (39.3%) | 102 (31.2%) |
| Total | 1,112 (100.0%) | 327 (100.0%) |
Housing Structure by Heating Type in Sheridan County
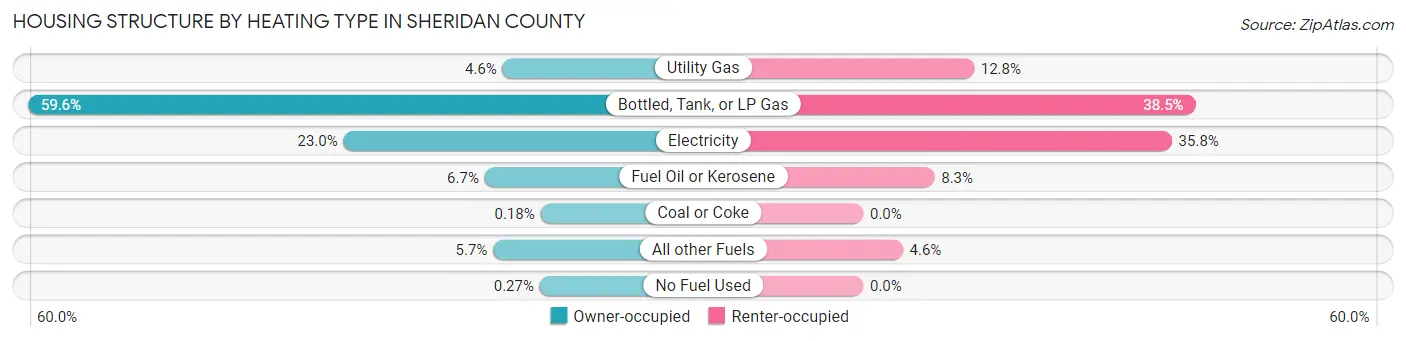
| Heating Type | Owner-occupied | Renter-occupied |
| Utility Gas | 51 (4.6%) | 42 (12.8%) |
| Bottled, Tank, or LP Gas | 663 (59.6%) | 126 (38.5%) |
| Electricity | 256 (23.0%) | 117 (35.8%) |
| Fuel Oil or Kerosene | 74 (6.7%) | 27 (8.3%) |
| Coal or Coke | 2 (0.2%) | 0 (0.0%) |
| All other Fuels | 63 (5.7%) | 15 (4.6%) |
| No Fuel Used | 3 (0.3%) | 0 (0.0%) |
| Total | 1,112 (100.0%) | 327 (100.0%) |
Household Vehicle Usage in Sheridan County
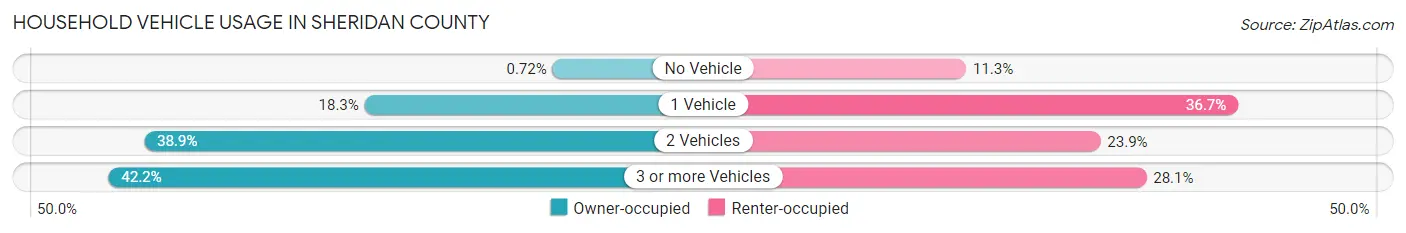
| Vehicles per Household | Owner-occupied | Renter-occupied |
| No Vehicle | 8 (0.7%) | 37 (11.3%) |
| 1 Vehicle | 203 (18.3%) | 120 (36.7%) |
| 2 Vehicles | 432 (38.9%) | 78 (23.8%) |
| 3 or more Vehicles | 469 (42.2%) | 92 (28.1%) |
| Total | 1,112 (100.0%) | 327 (100.0%) |
Real Estate & Mortgages in Sheridan County
Real Estate and Mortgage Overview in Sheridan County
| Characteristic | Without Mortgage | With Mortgage |
| Housing Units | 731 | 381 |
| Median Property Value | $104,100 | $162,300 |
| Median Household Income | $55,893 | $60 |
| Monthly Housing Costs | $536 | $7 |
| Real Estate Taxes | $1,453 | $4 |
Property Value by Mortgage Status in Sheridan County
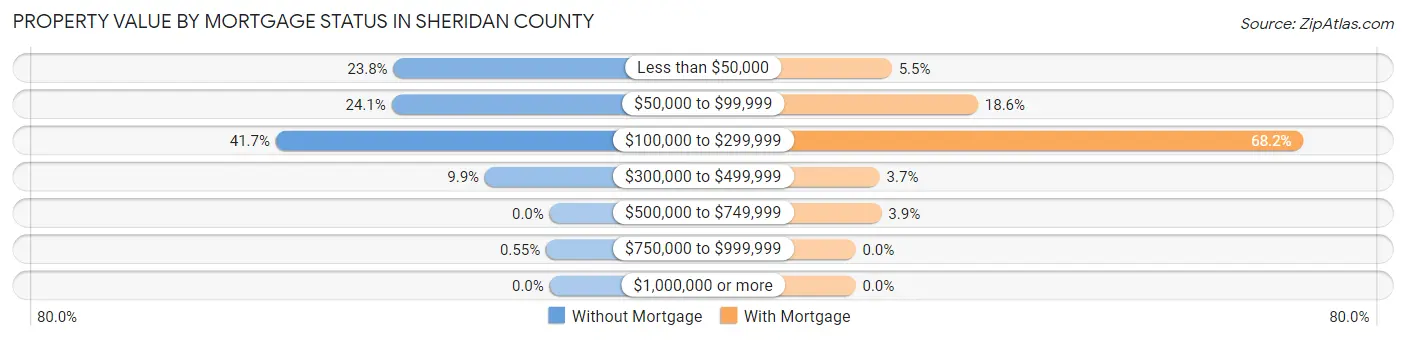
| Property Value | Without Mortgage | With Mortgage |
| Less than $50,000 | 174 (23.8%) | 21 (5.5%) |
| $50,000 to $99,999 | 176 (24.1%) | 71 (18.6%) |
| $100,000 to $299,999 | 305 (41.7%) | 260 (68.2%) |
| $300,000 to $499,999 | 72 (9.9%) | 14 (3.7%) |
| $500,000 to $749,999 | 0 (0.0%) | 15 (3.9%) |
| $750,000 to $999,999 | 4 (0.5%) | 0 (0.0%) |
| $1,000,000 or more | 0 (0.0%) | 0 (0.0%) |
| Total | 731 (100.0%) | 381 (100.0%) |
Household Income by Mortgage Status in Sheridan County
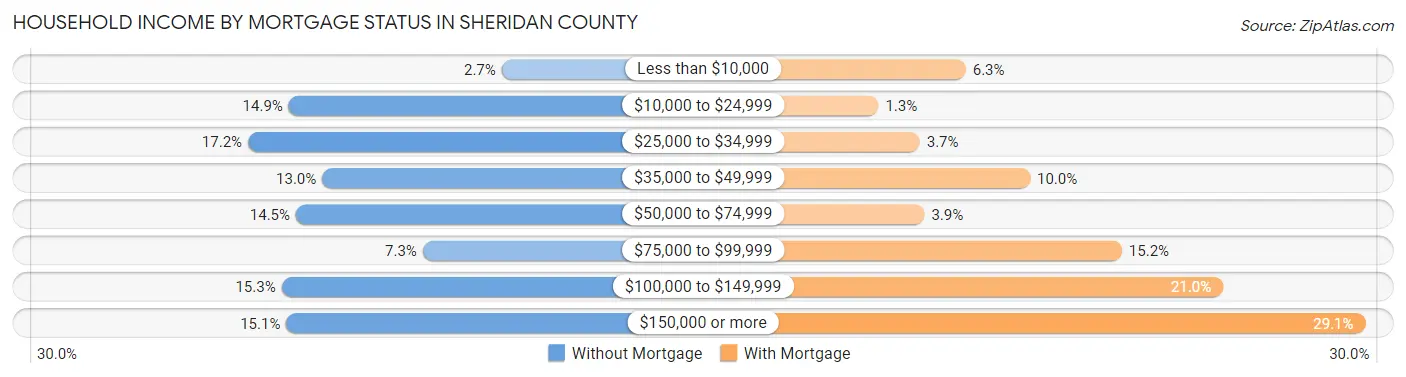
| Household Income | Without Mortgage | With Mortgage |
| Less than $10,000 | 20 (2.7%) | 24 (6.3%) |
| $10,000 to $24,999 | 109 (14.9%) | 5 (1.3%) |
| $25,000 to $34,999 | 126 (17.2%) | 14 (3.7%) |
| $35,000 to $49,999 | 95 (13.0%) | 38 (10.0%) |
| $50,000 to $74,999 | 106 (14.5%) | 15 (3.9%) |
| $75,000 to $99,999 | 53 (7.2%) | 58 (15.2%) |
| $100,000 to $149,999 | 112 (15.3%) | 80 (21.0%) |
| $150,000 or more | 110 (15.0%) | 111 (29.1%) |
| Total | 731 (100.0%) | 381 (100.0%) |
Property Value to Household Income Ratio in Sheridan County
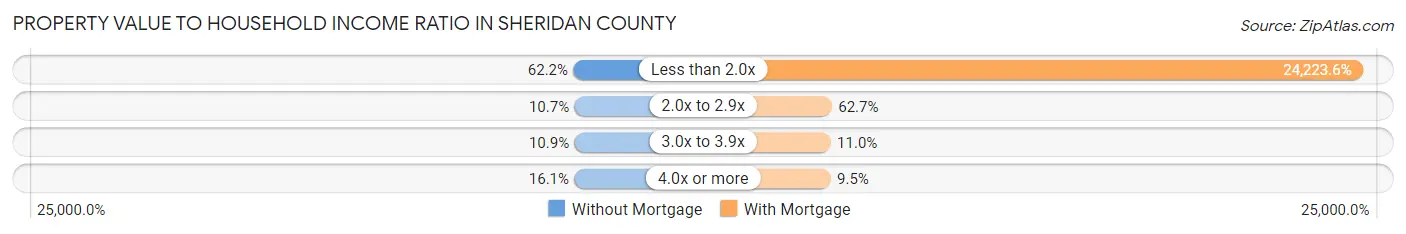
| Value-to-Income Ratio | Without Mortgage | With Mortgage |
| Less than 2.0x | 455 (62.2%) | 92,292 (24,223.6%) |
| 2.0x to 2.9x | 78 (10.7%) | 239 (62.7%) |
| 3.0x to 3.9x | 80 (10.9%) | 42 (11.0%) |
| 4.0x or more | 118 (16.1%) | 36 (9.5%) |
| Total | 731 (100.0%) | 381 (100.0%) |
Real Estate Taxes by Mortgage Status in Sheridan County
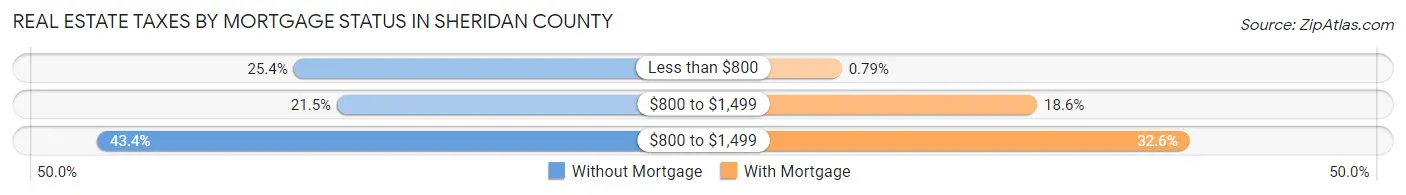
| Property Taxes | Without Mortgage | With Mortgage |
| Less than $800 | 186 (25.4%) | 3 (0.8%) |
| $800 to $1,499 | 157 (21.5%) | 71 (18.6%) |
| $800 to $1,499 | 317 (43.4%) | 124 (32.6%) |
| Total | 731 (100.0%) | 381 (100.0%) |
Health & Disability in Sheridan County
Health Insurance Coverage by Age in Sheridan County
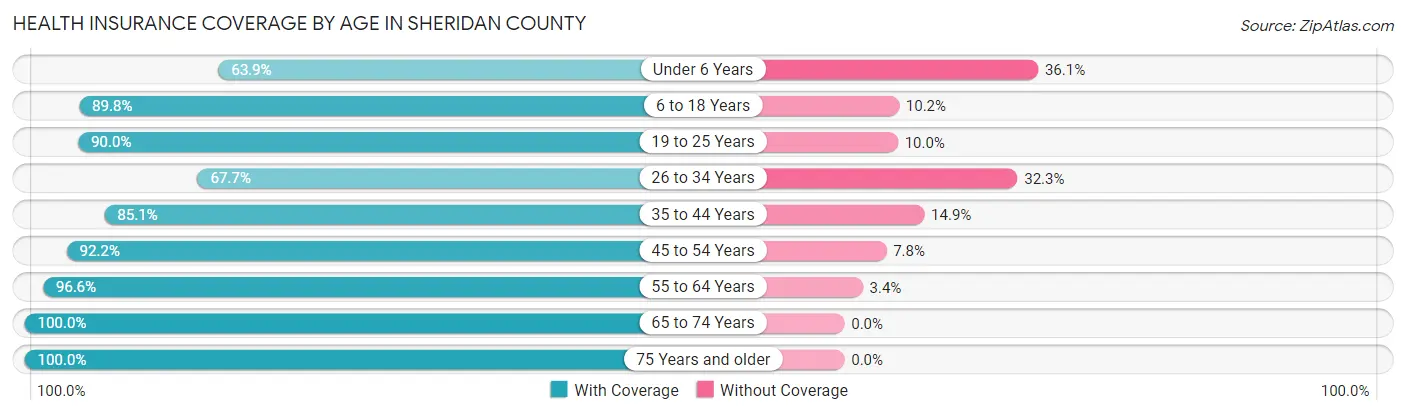
| Age Bracket | With Coverage | Without Coverage |
| Under 6 Years | 168 (63.9%) | 95 (36.1%) |
| 6 to 18 Years | 530 (89.8%) | 60 (10.2%) |
| 19 to 25 Years | 217 (90.0%) | 24 (10.0%) |
| 26 to 34 Years | 231 (67.7%) | 110 (32.3%) |
| 35 to 44 Years | 383 (85.1%) | 67 (14.9%) |
| 45 to 54 Years | 342 (92.2%) | 29 (7.8%) |
| 55 to 64 Years | 566 (96.6%) | 20 (3.4%) |
| 65 to 74 Years | 433 (100.0%) | 0 (0.0%) |
| 75 Years and older | 362 (100.0%) | 0 (0.0%) |
| Total | 3,232 (88.9%) | 405 (11.1%) |
Health Insurance Coverage by Citizenship Status in Sheridan County
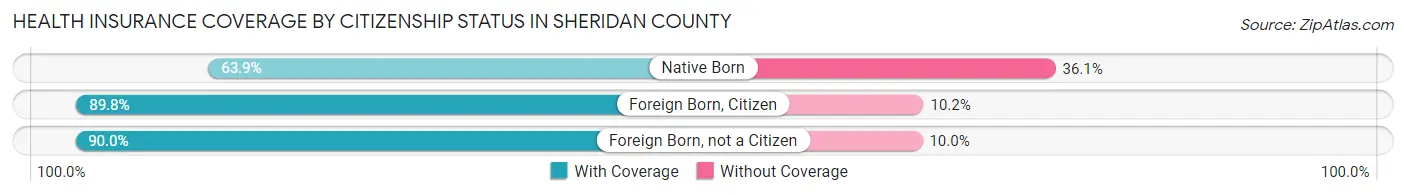
| Citizenship Status | With Coverage | Without Coverage |
| Native Born | 168 (63.9%) | 95 (36.1%) |
| Foreign Born, Citizen | 530 (89.8%) | 60 (10.2%) |
| Foreign Born, not a Citizen | 217 (90.0%) | 24 (10.0%) |
Health Insurance Coverage by Household Income in Sheridan County
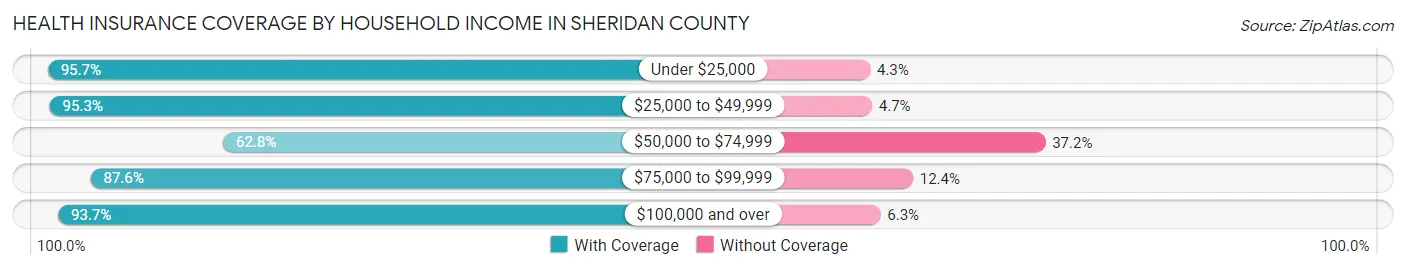
| Household Income | With Coverage | Without Coverage |
| Under $25,000 | 353 (95.7%) | 16 (4.3%) |
| $25,000 to $49,999 | 608 (95.3%) | 30 (4.7%) |
| $50,000 to $74,999 | 343 (62.8%) | 203 (37.2%) |
| $75,000 to $99,999 | 404 (87.6%) | 57 (12.4%) |
| $100,000 and over | 1,476 (93.7%) | 99 (6.3%) |
Public vs Private Health Insurance Coverage by Age in Sheridan County
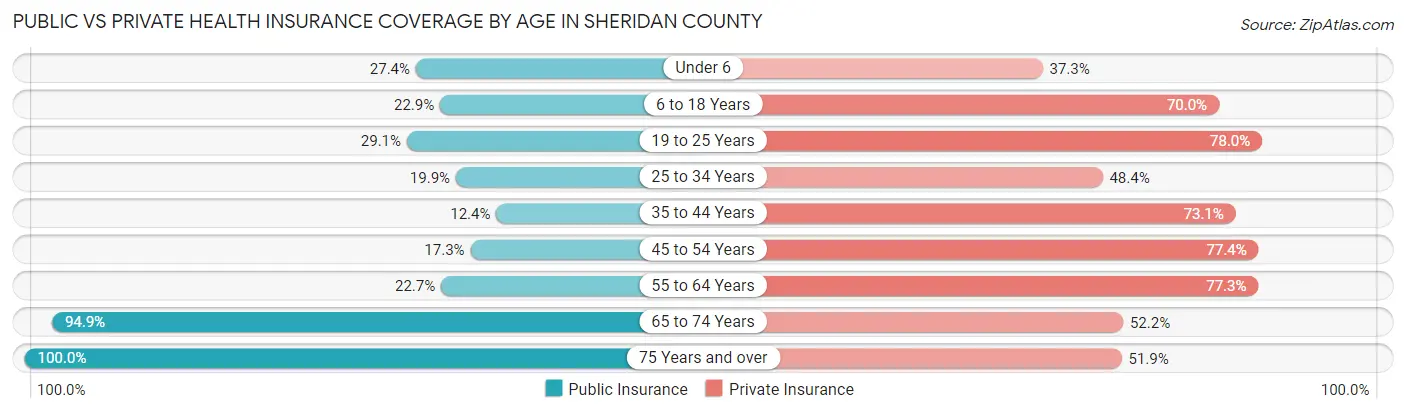
| Age Bracket | Public Insurance | Private Insurance |
| Under 6 | 72 (27.4%) | 98 (37.3%) |
| 6 to 18 Years | 135 (22.9%) | 413 (70.0%) |
| 19 to 25 Years | 70 (29.0%) | 188 (78.0%) |
| 25 to 34 Years | 68 (19.9%) | 165 (48.4%) |
| 35 to 44 Years | 56 (12.4%) | 329 (73.1%) |
| 45 to 54 Years | 64 (17.2%) | 287 (77.4%) |
| 55 to 64 Years | 133 (22.7%) | 453 (77.3%) |
| 65 to 74 Years | 411 (94.9%) | 226 (52.2%) |
| 75 Years and over | 362 (100.0%) | 188 (51.9%) |
| Total | 1,371 (37.7%) | 2,347 (64.5%) |
Disability Status by Sex by Age in Sheridan County
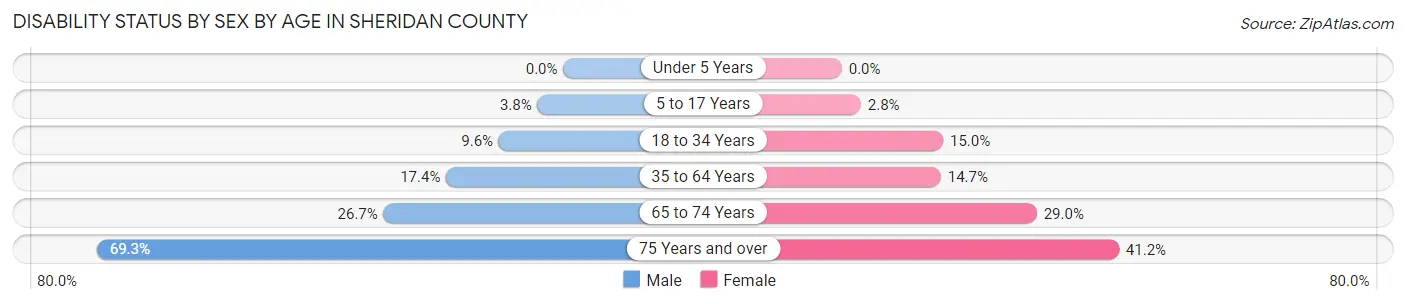
| Age Bracket | Male | Female |
| Under 5 Years | 0 (0.0%) | 0 (0.0%) |
| 5 to 17 Years | 11 (3.8%) | 8 (2.8%) |
| 18 to 34 Years | 31 (9.6%) | 46 (15.0%) |
| 35 to 64 Years | 124 (17.4%) | 102 (14.7%) |
| 65 to 74 Years | 75 (26.7%) | 44 (28.9%) |
| 75 Years and over | 106 (69.3%) | 86 (41.1%) |
Disability Class by Sex by Age in Sheridan County
Disability Class: Hearing Difficulty
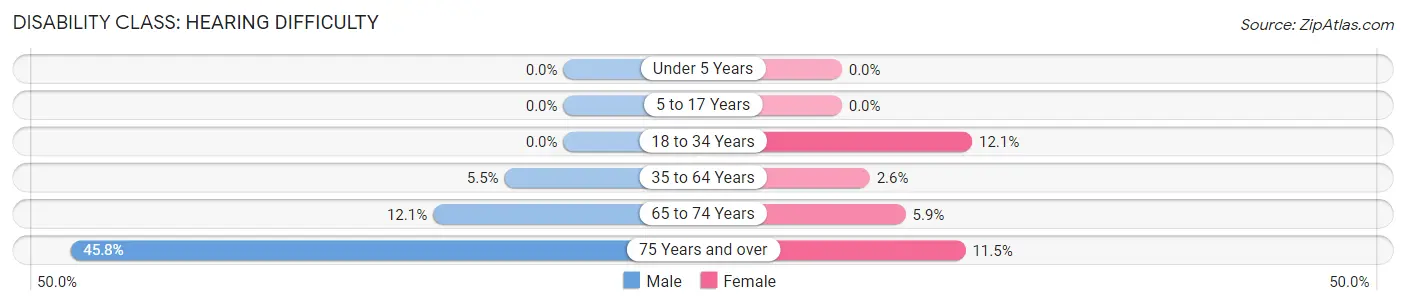
| Age Bracket | Male | Female |
| Under 5 Years | 0 (0.0%) | 0 (0.0%) |
| 5 to 17 Years | 0 (0.0%) | 0 (0.0%) |
| 18 to 34 Years | 0 (0.0%) | 37 (12.1%) |
| 35 to 64 Years | 39 (5.5%) | 18 (2.6%) |
| 65 to 74 Years | 34 (12.1%) | 9 (5.9%) |
| 75 Years and over | 70 (45.8%) | 24 (11.5%) |
Disability Class: Vision Difficulty
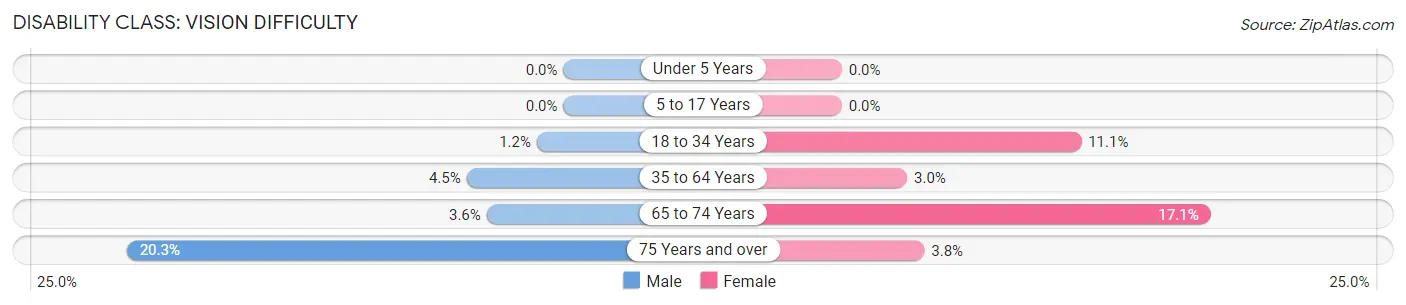
| Age Bracket | Male | Female |
| Under 5 Years | 0 (0.0%) | 0 (0.0%) |
| 5 to 17 Years | 0 (0.0%) | 0 (0.0%) |
| 18 to 34 Years | 4 (1.2%) | 34 (11.1%) |
| 35 to 64 Years | 32 (4.5%) | 21 (3.0%) |
| 65 to 74 Years | 10 (3.6%) | 26 (17.1%) |
| 75 Years and over | 31 (20.3%) | 8 (3.8%) |
Disability Class: Cognitive Difficulty
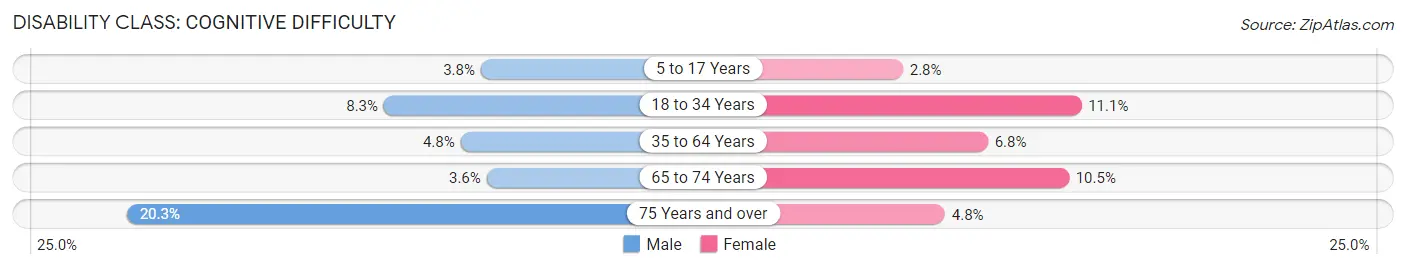
| Age Bracket | Male | Female |
| 5 to 17 Years | 11 (3.8%) | 8 (2.8%) |
| 18 to 34 Years | 27 (8.3%) | 34 (11.1%) |
| 35 to 64 Years | 34 (4.8%) | 47 (6.8%) |
| 65 to 74 Years | 10 (3.6%) | 16 (10.5%) |
| 75 Years and over | 31 (20.3%) | 10 (4.8%) |
Disability Class: Ambulatory Difficulty
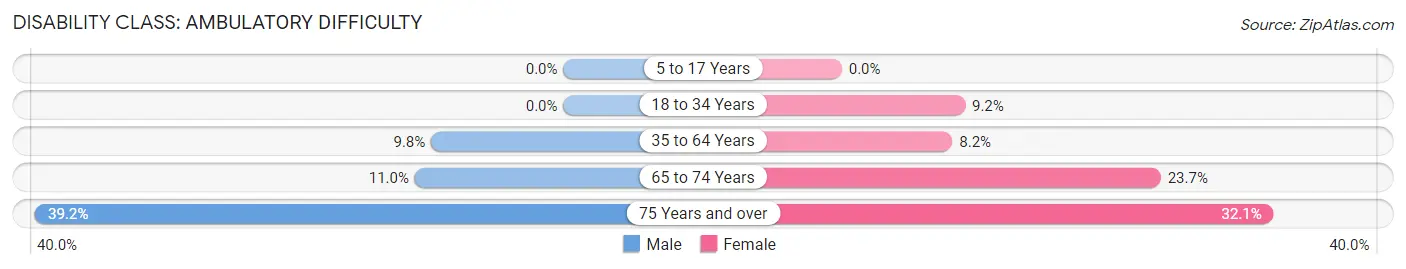
| Age Bracket | Male | Female |
| 5 to 17 Years | 0 (0.0%) | 0 (0.0%) |
| 18 to 34 Years | 0 (0.0%) | 28 (9.1%) |
| 35 to 64 Years | 70 (9.8%) | 57 (8.2%) |
| 65 to 74 Years | 31 (11.0%) | 36 (23.7%) |
| 75 Years and over | 60 (39.2%) | 67 (32.1%) |
Disability Class: Self-Care Difficulty
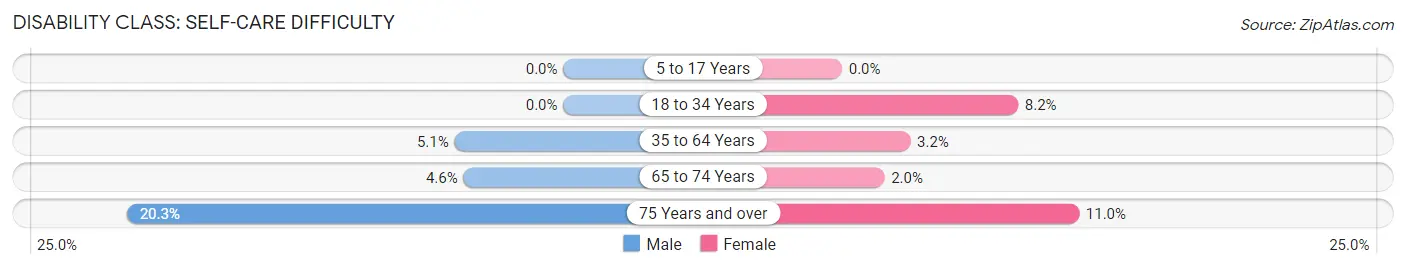
| Age Bracket | Male | Female |
| 5 to 17 Years | 0 (0.0%) | 0 (0.0%) |
| 18 to 34 Years | 0 (0.0%) | 25 (8.2%) |
| 35 to 64 Years | 36 (5.1%) | 22 (3.2%) |
| 65 to 74 Years | 13 (4.6%) | 3 (2.0%) |
| 75 Years and over | 31 (20.3%) | 23 (11.0%) |
Technology Access in Sheridan County
Computing Device Access in Sheridan County
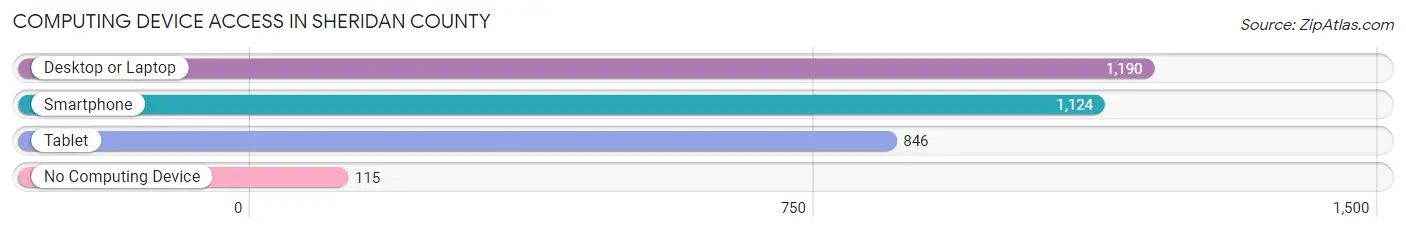
| Device Type | # Households | % Households |
| Desktop or Laptop | 1,190 | 82.7% |
| Smartphone | 1,124 | 78.1% |
| Tablet | 846 | 58.8% |
| No Computing Device | 115 | 8.0% |
| Total | 1,439 | 100.0% |
Internet Access in Sheridan County
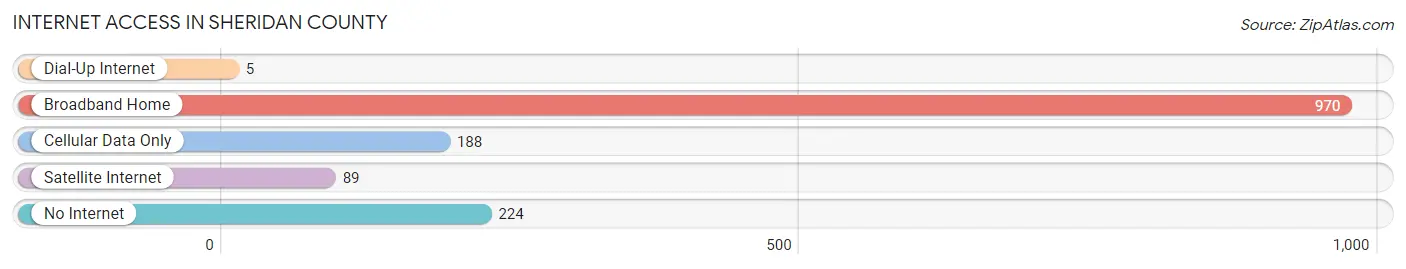
| Internet Type | # Households | % Households |
| Dial-Up Internet | 5 | 0.4% |
| Broadband Home | 970 | 67.4% |
| Cellular Data Only | 188 | 13.1% |
| Satellite Internet | 89 | 6.2% |
| No Internet | 224 | 15.6% |
| Total | 1,439 | 100.0% |
Sheridan County Summary
Sheridan County, Montana is located in the north-central part of the state, and is bordered by Roosevelt County to the north, Valley County to the east, Daniels County to the south, and McCone County to the west. The county seat is Plentywood, and the largest city is Medicine Lake. The county was established in 1914 and named after General Philip Sheridan, a Civil War hero.
Geography
Sheridan County covers an area of 1,845 square miles, making it the fourth largest county in Montana. The terrain is mostly flat, with rolling hills in the east and south. The county is located in the Missouri River Valley, and is part of the Great Plains region. The county is home to several rivers, including the Milk, Musselshell, and Yellowstone. The county also contains several lakes, including Medicine Lake, Lake Elwell, and Lake Sherburne.
The climate of Sheridan County is semi-arid, with hot summers and cold winters. The average annual temperature is 45°F, and the average annual precipitation is 13.5 inches.
Economy
The economy of Sheridan County is largely based on agriculture and ranching. The county is home to several large cattle ranches, and the county is also a major producer of wheat, barley, and hay. Other industries in the county include oil and gas production, manufacturing, and tourism.
Demographics
As of the 2010 census, the population of Sheridan County was 3,541, making it the fourth least populous county in Montana. The population density was 1.9 people per square mile. The racial makeup of the county was 95.3% White, 0.3% Native American, 0.2% Asian, 0.1% Black or African American, 0.1% Pacific Islander, and 3.9% from two or more races. The median age was 44.2 years, and the median household income was $41,944.
Conclusion
Sheridan County, Montana is a rural county located in the north-central part of the state. The county is home to several rivers and lakes, and the economy is largely based on agriculture and ranching. The population of the county is small, but diverse, and the median household income is slightly below the state average.
Common Questions
What is the Total Population of Sheridan County?
Total Population of Sheridan County is 3,700.
What is the Total Male Population of Sheridan County?
Total Male Population of Sheridan County is 1,945.
What is the Total Female Population of Sheridan County?
Total Female Population of Sheridan County is 1,755.
What is the Ratio of Males per 100 Females in Sheridan County?
There are 110.83 Males per 100 Females in Sheridan County.
What is the Ratio of Females per 100 Males in Sheridan County?
There are 90.23 Females per 100 Males in Sheridan County.
What is the Median Population Age in Sheridan County?
Median Population Age in Sheridan County is 43.8 Years.
What is the Average Family Size in Sheridan County
Average Family Size in Sheridan County is 3.2 People.
What is the Average Household Size in Sheridan County
Average Household Size in Sheridan County is 2.5 People.
What is Per Capita Income in Sheridan County?
Per Capita income in Sheridan County is $42,653.
What is the Median Family Income in Sheridan County?
Median Family Income in Sheridan County is $88,510.
What is the Median Household income in Sheridan County?
Median Household Income in Sheridan County is $67,457.
What is Income or Wage Gap in Sheridan County?
Income or Wage Gap in Sheridan County is 25.5%.
Women in Sheridan County earn 74.5 cents for every dollar earned by a man.
What is Inequality or Gini Index in Sheridan County?
Inequality or Gini Index in Sheridan County is 0.52.
How Large is the Labor Force in Sheridan County?
There are 1,820 People in the Labor Forcein in Sheridan County.
What is the Percentage of People in the Labor Force in Sheridan County?
61.1% of People are in the Labor Force in Sheridan County.
What is the Unemployment Rate in Sheridan County?
Unemployment Rate in Sheridan County is 1.5%.