Ravalli County, MT
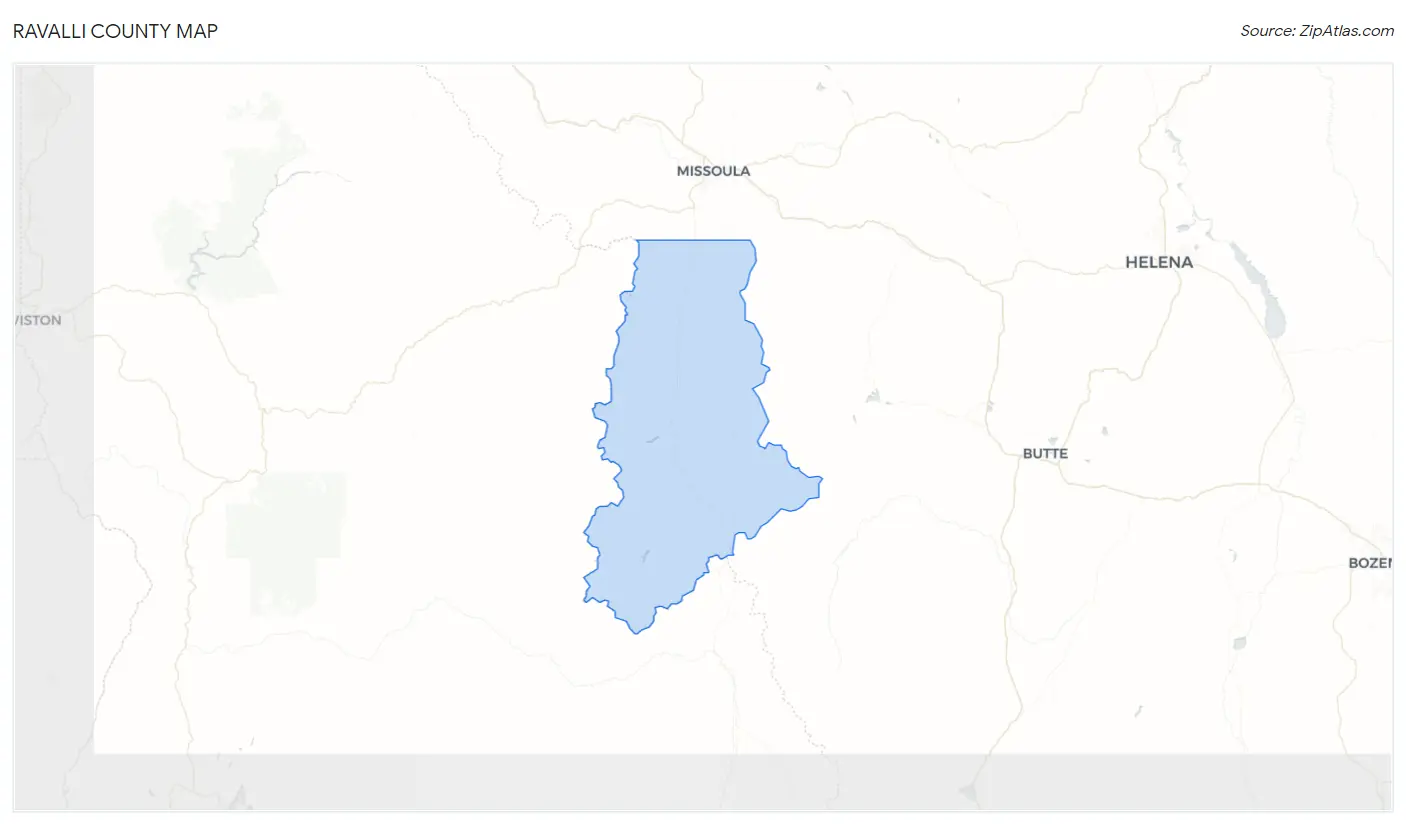
Ravalli County Map
Ravalli County Overview
44,876
TOTAL POPULATION
22,535
MALE POPULATION
22,341
FEMALE POPULATION
100.87
MALES / 100 FEMALES
99.14
FEMALES / 100 MALES
49.0
MEDIAN AGE
2.9
AVG FAMILY SIZE
2.4
AVG HOUSEHOLD SIZE
$38,555
PER CAPITA INCOME
$80,623
AVG FAMILY INCOME
$67,424
AVG HOUSEHOLD INCOME
38.3%
WAGE / INCOME GAP [ % ]
61.7¢/ $1
WAGE / INCOME GAP [ $ ]
$11,681
FAMILY INCOME DEFICIT
0.45
INEQUALITY / GINI INDEX
21,149
LABOR FORCE [ PEOPLE ]
56.4%
PERCENT IN LABOR FORCE
4.4%
UNEMPLOYMENT RATE
Ravalli County Area Codes
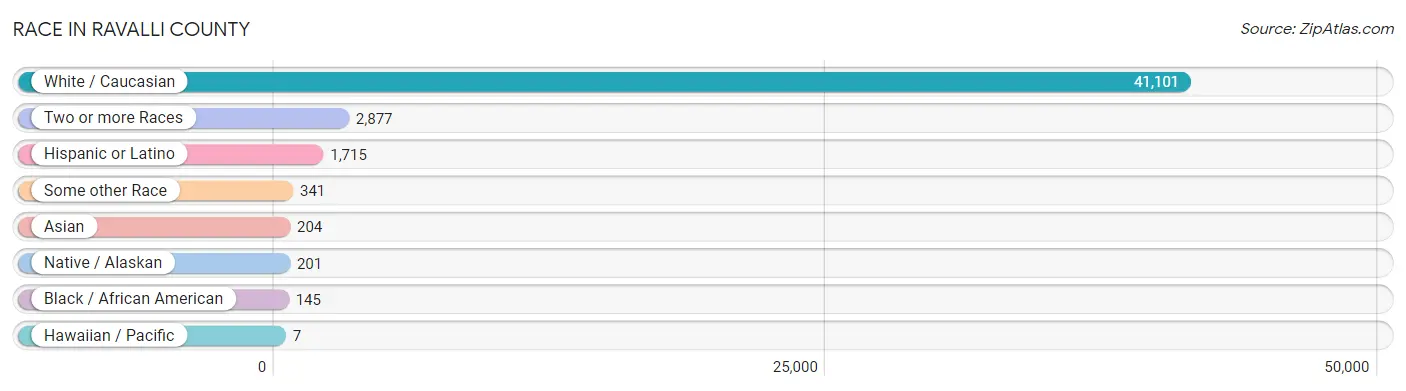
Race in Ravalli County
The most populous races in Ravalli County are White / Caucasian (41,101 | 91.6%), Two or more Races (2,877 | 6.4%), and Hispanic or Latino (1,715 | 3.8%).
| Race | # Population | % Population |
| Asian | 204 | 0.4% |
| Black / African American | 145 | 0.3% |
| Hawaiian / Pacific | 7 | 0.0% |
| Hispanic or Latino | 1,715 | 3.8% |
| Native / Alaskan | 201 | 0.4% |
| White / Caucasian | 41,101 | 91.6% |
| Two or more Races | 2,877 | 6.4% |
| Some other Race | 341 | 0.8% |
| Total | 44,876 | 100.0% |
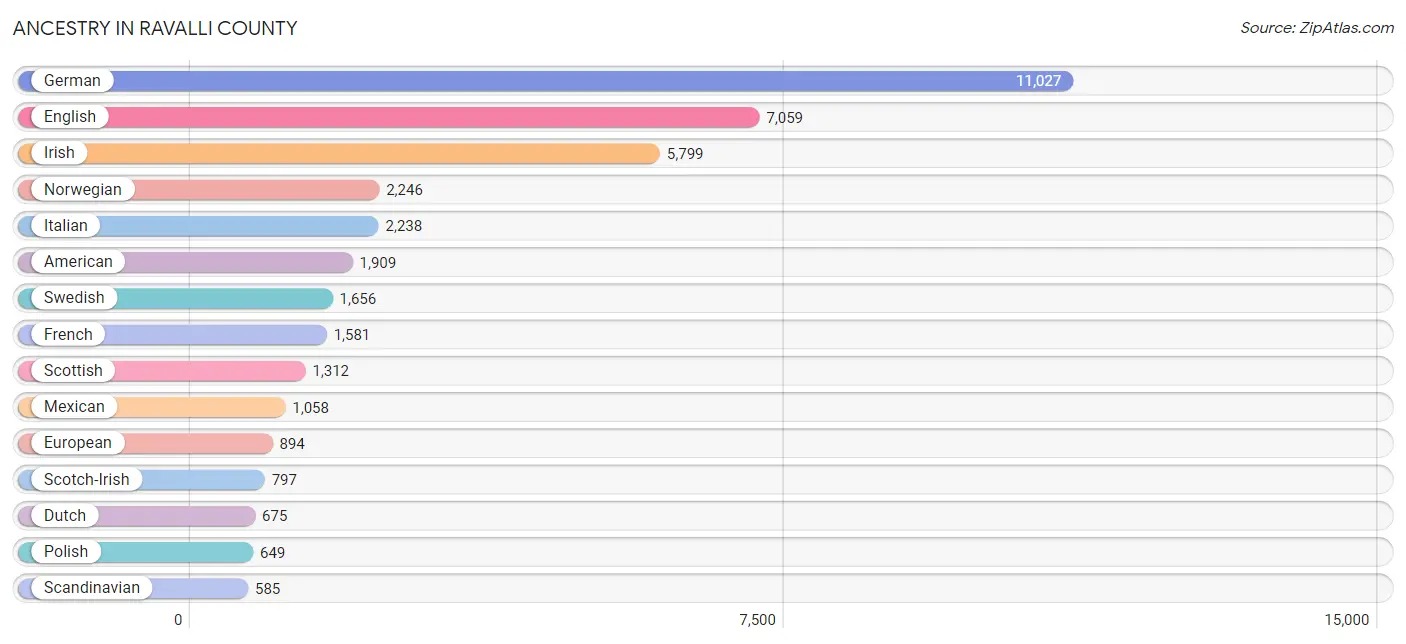
Ancestry in Ravalli County
The most populous ancestries reported in Ravalli County are German (11,027 | 24.6%), English (7,059 | 15.7%), Irish (5,799 | 12.9%), Norwegian (2,246 | 5.0%), and Italian (2,238 | 5.0%), together accounting for 63.2% of all Ravalli County residents.
| Ancestry | # Population | % Population |
| African | 32 | 0.1% |
| Alsatian | 6 | 0.0% |
| American | 1,909 | 4.3% |
| Apache | 49 | 0.1% |
| Arab | 43 | 0.1% |
| Arapaho | 8 | 0.0% |
| Argentinean | 21 | 0.1% |
| Armenian | 13 | 0.0% |
| Austrian | 98 | 0.2% |
| Bangladeshi | 48 | 0.1% |
| Basque | 115 | 0.3% |
| Bhutanese | 78 | 0.2% |
| Blackfeet | 74 | 0.2% |
| Brazilian | 6 | 0.0% |
| British | 390 | 0.9% |
| Bulgarian | 53 | 0.1% |
| Burmese | 53 | 0.1% |
| Canadian | 32 | 0.1% |
| Celtic | 114 | 0.3% |
| Cherokee | 196 | 0.4% |
| Chilean | 20 | 0.0% |
| Chippewa | 149 | 0.3% |
| Choctaw | 131 | 0.3% |
| Cree | 1 | 0.0% |
| Czech | 360 | 0.8% |
| Czechoslovakian | 34 | 0.1% |
| Danish | 543 | 1.2% |
| Dutch | 675 | 1.5% |
| Eastern European | 44 | 0.1% |
| Ecuadorian | 59 | 0.1% |
| English | 7,059 | 15.7% |
| European | 894 | 2.0% |
| Finnish | 273 | 0.6% |
| French | 1,581 | 3.5% |
| French Canadian | 327 | 0.7% |
| German | 11,027 | 24.6% |
| German Russian | 5 | 0.0% |
| Greek | 219 | 0.5% |
| Hopi | 4 | 0.0% |
| Hungarian | 157 | 0.4% |
| Indian (Asian) | 24 | 0.1% |
| Inupiat | 1 | 0.0% |
| Iranian | 22 | 0.1% |
| Irish | 5,799 | 12.9% |
| Iroquois | 41 | 0.1% |
| Italian | 2,238 | 5.0% |
| Korean | 184 | 0.4% |
| Lebanese | 11 | 0.0% |
| Lithuanian | 54 | 0.1% |
| Malaysian | 54 | 0.1% |
| Mexican | 1,058 | 2.4% |
| Native Hawaiian | 13 | 0.0% |
| Navajo | 76 | 0.2% |
| Northern European | 372 | 0.8% |
| Norwegian | 2,246 | 5.0% |
| Pennsylvania German | 8 | 0.0% |
| Polish | 649 | 1.5% |
| Portuguese | 114 | 0.3% |
| Potawatomi | 16 | 0.0% |
| Pueblo | 54 | 0.1% |
| Puerto Rican | 66 | 0.2% |
| Romanian | 14 | 0.0% |
| Russian | 221 | 0.5% |
| Samoan | 18 | 0.0% |
| Scandinavian | 585 | 1.3% |
| Scotch-Irish | 797 | 1.8% |
| Scottish | 1,312 | 2.9% |
| Sioux | 37 | 0.1% |
| Slavic | 22 | 0.1% |
| Slovak | 121 | 0.3% |
| Slovene | 17 | 0.0% |
| South African | 22 | 0.1% |
| South American | 100 | 0.2% |
| Spaniard | 147 | 0.3% |
| Spanish | 250 | 0.6% |
| Spanish American | 18 | 0.0% |
| Sri Lankan | 54 | 0.1% |
| Subsaharan African | 54 | 0.1% |
| Swedish | 1,656 | 3.7% |
| Swiss | 330 | 0.7% |
| Turkish | 18 | 0.0% |
| Ukrainian | 265 | 0.6% |
| Welsh | 544 | 1.2% |
| Yugoslavian | 27 | 0.1% | View All 84 Rows |
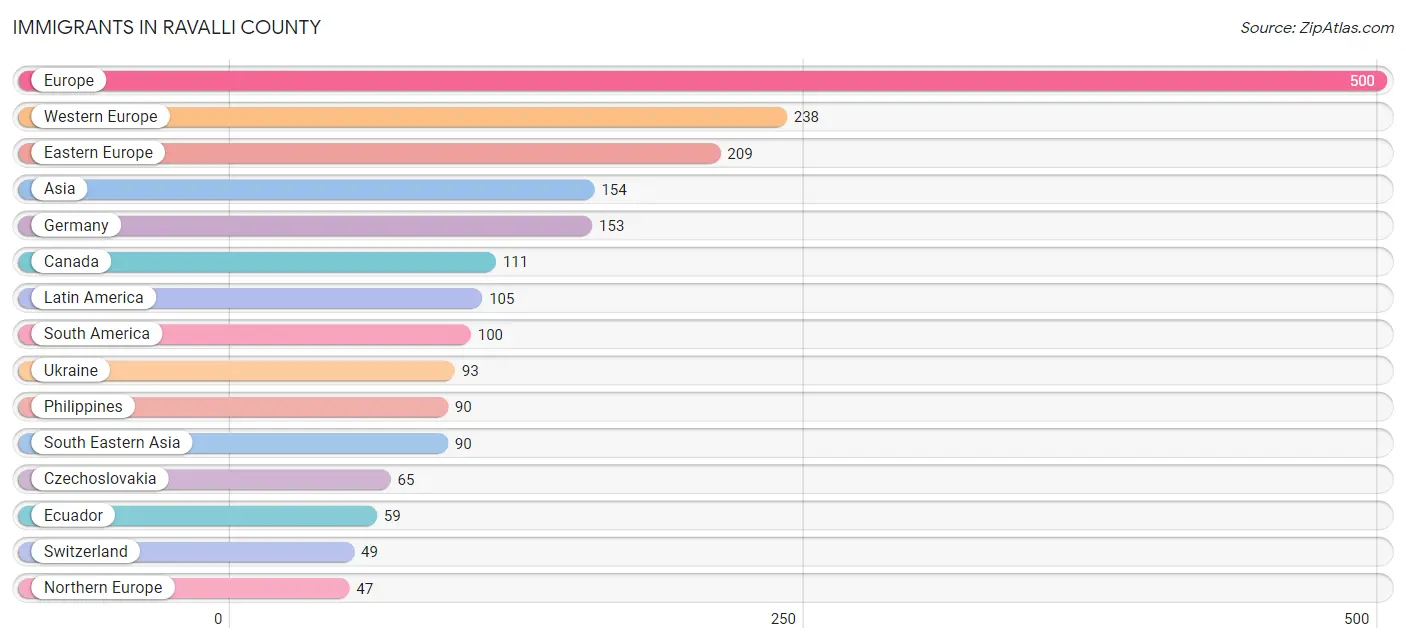
Immigrants in Ravalli County
The most numerous immigrant groups reported in Ravalli County came from Europe (500 | 1.1%), Western Europe (238 | 0.5%), Eastern Europe (209 | 0.5%), Asia (154 | 0.3%), and Germany (153 | 0.3%), together accounting for 2.8% of all Ravalli County residents.
| Immigration Origin | # Population | % Population |
| Africa | 30 | 0.1% |
| Argentina | 21 | 0.1% |
| Asia | 154 | 0.3% |
| Bulgaria | 30 | 0.1% |
| Canada | 111 | 0.3% |
| Central America | 5 | 0.0% |
| Chile | 20 | 0.0% |
| China | 17 | 0.0% |
| Czechoslovakia | 65 | 0.1% |
| Denmark | 17 | 0.0% |
| Eastern Asia | 27 | 0.1% |
| Eastern Europe | 209 | 0.5% |
| Ecuador | 59 | 0.1% |
| England | 12 | 0.0% |
| Europe | 500 | 1.1% |
| France | 13 | 0.0% |
| Germany | 153 | 0.3% |
| Hungary | 16 | 0.0% |
| Italy | 6 | 0.0% |
| Japan | 5 | 0.0% |
| Korea | 5 | 0.0% |
| Latin America | 105 | 0.2% |
| Mexico | 5 | 0.0% |
| Netherlands | 23 | 0.1% |
| Nigeria | 8 | 0.0% |
| Northern Europe | 47 | 0.1% |
| Pakistan | 19 | 0.0% |
| Philippines | 90 | 0.2% |
| Romania | 5 | 0.0% |
| South Africa | 22 | 0.1% |
| South America | 100 | 0.2% |
| South Central Asia | 19 | 0.0% |
| South Eastern Asia | 90 | 0.2% |
| Southern Europe | 6 | 0.0% |
| Switzerland | 49 | 0.1% |
| Taiwan | 17 | 0.0% |
| Turkey | 18 | 0.0% |
| Ukraine | 93 | 0.2% |
| Western Africa | 8 | 0.0% |
| Western Asia | 18 | 0.0% |
| Western Europe | 238 | 0.5% | View All 41 Rows |
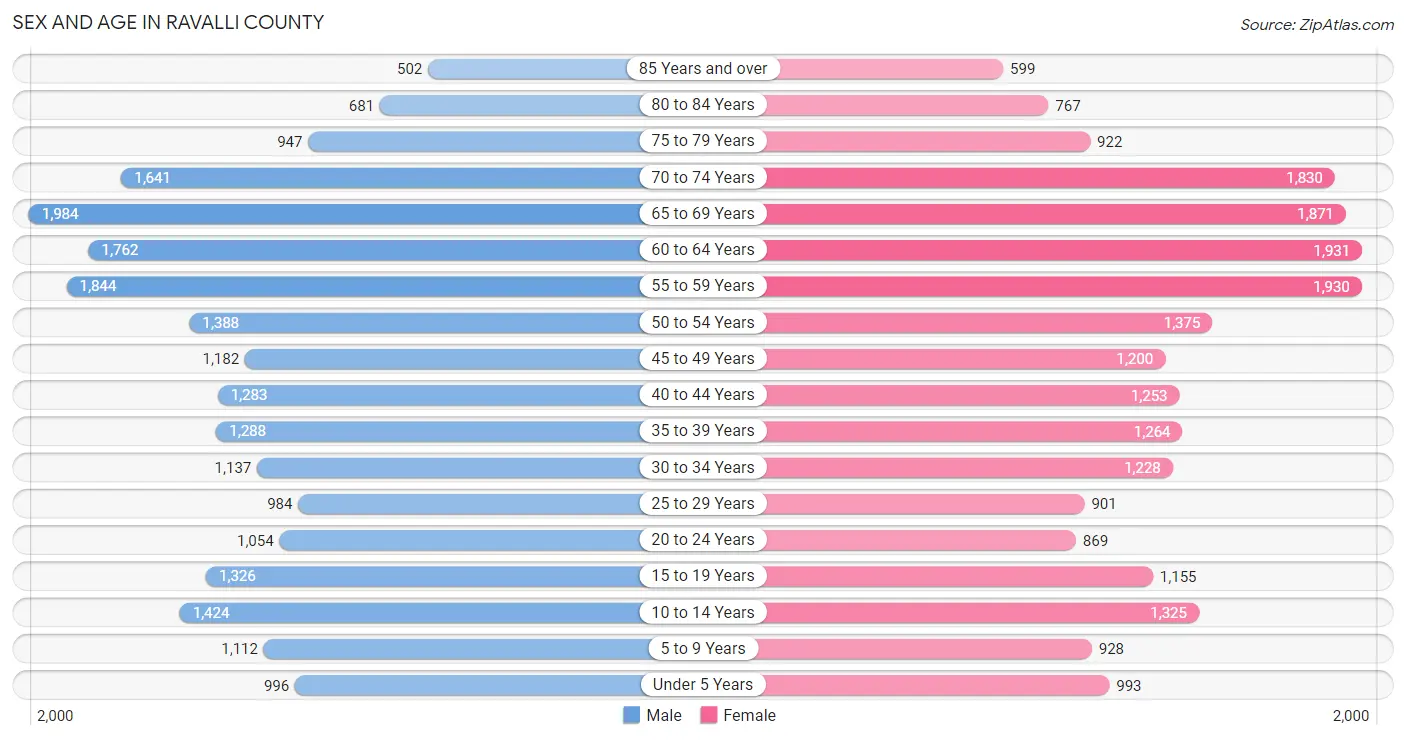
Sex and Age in Ravalli County
Sex and Age in Ravalli County
The most populous age groups in Ravalli County are 65 to 69 Years (1,984 | 8.8%) for men and 60 to 64 Years (1,931 | 8.6%) for women.
| Age Bracket | Male | Female |
| Under 5 Years | 996 (4.4%) | 993 (4.4%) |
| 5 to 9 Years | 1,112 (4.9%) | 928 (4.2%) |
| 10 to 14 Years | 1,424 (6.3%) | 1,325 (5.9%) |
| 15 to 19 Years | 1,326 (5.9%) | 1,155 (5.2%) |
| 20 to 24 Years | 1,054 (4.7%) | 869 (3.9%) |
| 25 to 29 Years | 984 (4.4%) | 901 (4.0%) |
| 30 to 34 Years | 1,137 (5.1%) | 1,228 (5.5%) |
| 35 to 39 Years | 1,288 (5.7%) | 1,264 (5.7%) |
| 40 to 44 Years | 1,283 (5.7%) | 1,253 (5.6%) |
| 45 to 49 Years | 1,182 (5.2%) | 1,200 (5.4%) |
| 50 to 54 Years | 1,388 (6.2%) | 1,375 (6.1%) |
| 55 to 59 Years | 1,844 (8.2%) | 1,930 (8.6%) |
| 60 to 64 Years | 1,762 (7.8%) | 1,931 (8.6%) |
| 65 to 69 Years | 1,984 (8.8%) | 1,871 (8.4%) |
| 70 to 74 Years | 1,641 (7.3%) | 1,830 (8.2%) |
| 75 to 79 Years | 947 (4.2%) | 922 (4.1%) |
| 80 to 84 Years | 681 (3.0%) | 767 (3.4%) |
| 85 Years and over | 502 (2.2%) | 599 (2.7%) |
| Total | 22,535 (100.0%) | 22,341 (100.0%) |
Families and Households in Ravalli County
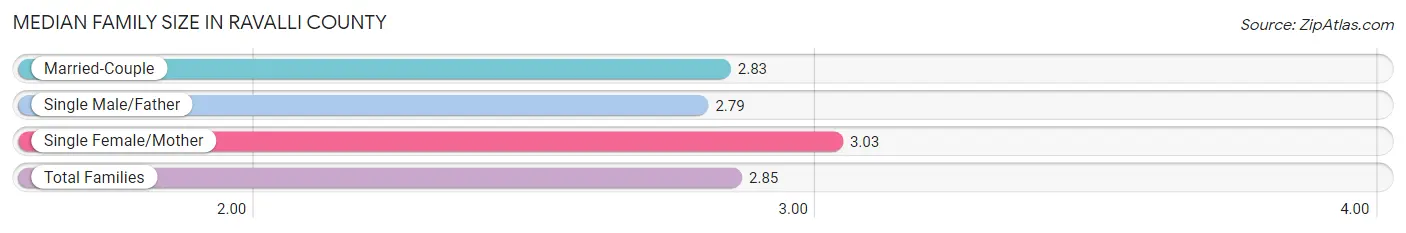
Median Family Size in Ravalli County
The median family size in Ravalli County is 2.85 persons per family, with single female/mother families (1,388 | 10.8%) accounting for the largest median family size of 3.03 persons per family. On the other hand, single male/father families (776 | 6.1%) represent the smallest median family size with 2.79 persons per family.
| Family Type | # Families | Family Size |
| Married-Couple | 10,648 (83.1%) | 2.83 |
| Single Male/Father | 776 (6.1%) | 2.79 |
| Single Female/Mother | 1,388 (10.8%) | 3.03 |
| Total Families | 12,812 (100.0%) | 2.85 |
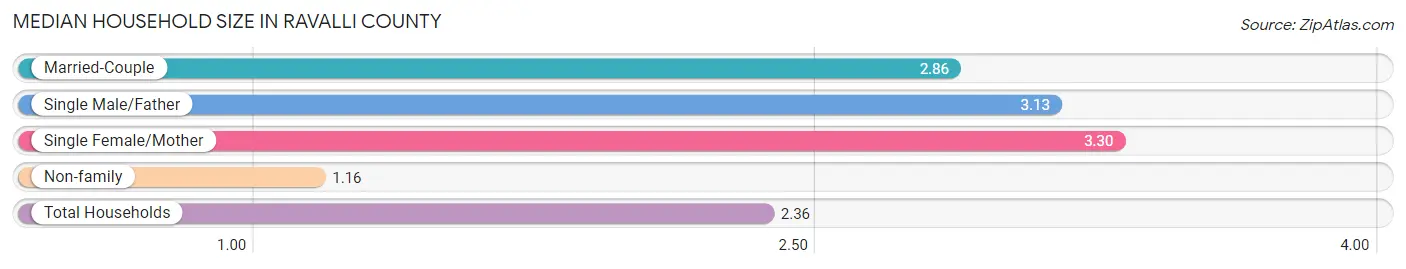
Median Household Size in Ravalli County
The median household size in Ravalli County is 2.36 persons per household, with single female/mother households (1,388 | 7.4%) accounting for the largest median household size of 3.3 persons per household. non-family households (6,035 | 32.0%) represent the smallest median household size with 1.16 persons per household.
| Household Type | # Households | Household Size |
| Married-Couple | 10,648 (56.5%) | 2.86 |
| Single Male/Father | 776 (4.1%) | 3.13 |
| Single Female/Mother | 1,388 (7.4%) | 3.30 |
| Non-family | 6,035 (32.0%) | 1.16 |
| Total Households | 18,847 (100.0%) | 2.36 |
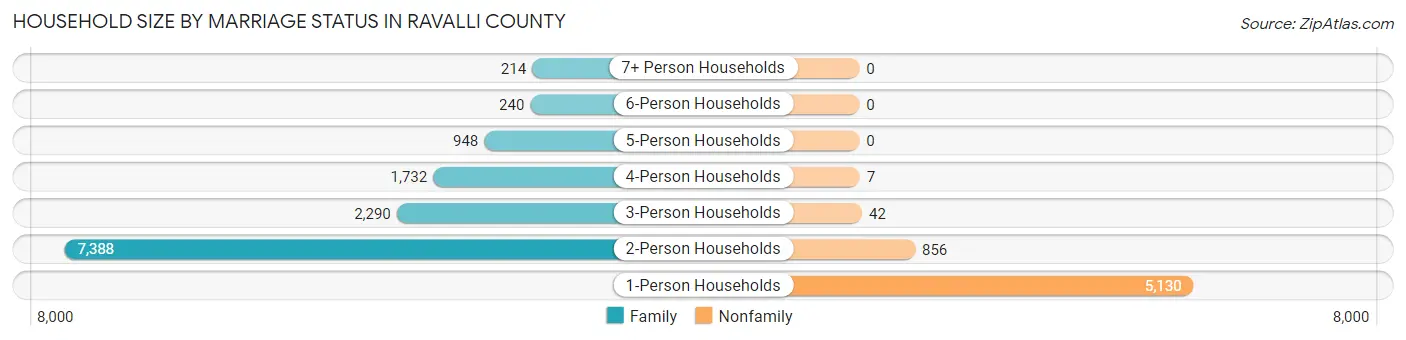
Household Size by Marriage Status in Ravalli County
Out of a total of 18,847 households in Ravalli County, 12,812 (68.0%) are family households, while 6,035 (32.0%) are nonfamily households. The most numerous type of family households are 2-person households, comprising 7,388, and the most common type of nonfamily households are 1-person households, comprising 5,130.
| Household Size | Family Households | Nonfamily Households |
| 1-Person Households | - | 5,130 (27.2%) |
| 2-Person Households | 7,388 (39.2%) | 856 (4.5%) |
| 3-Person Households | 2,290 (12.1%) | 42 (0.2%) |
| 4-Person Households | 1,732 (9.2%) | 7 (0.0%) |
| 5-Person Households | 948 (5.0%) | 0 (0.0%) |
| 6-Person Households | 240 (1.3%) | 0 (0.0%) |
| 7+ Person Households | 214 (1.1%) | 0 (0.0%) |
| Total | 12,812 (68.0%) | 6,035 (32.0%) |
Female Fertility in Ravalli County
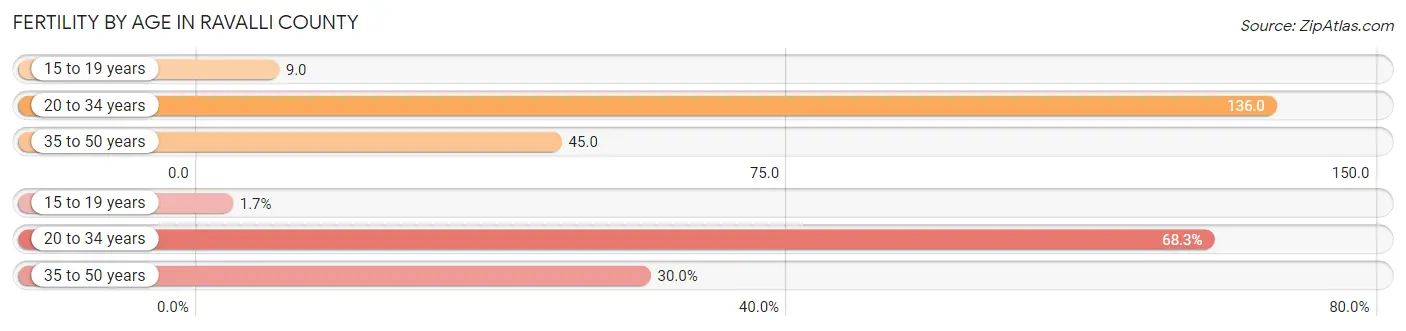
Fertility by Age in Ravalli County
Average fertility rate in Ravalli County is 74.0 births per 1,000 women. Women in the age bracket of 20 to 34 years have the highest fertility rate with 136.0 births per 1,000 women. Women in the age bracket of 20 to 34 years acount for 68.3% of all women with births.
| Age Bracket | Women with Births | Births / 1,000 Women |
| 15 to 19 years | 10 (1.7%) | 9.0 |
| 20 to 34 years | 407 (68.3%) | 136.0 |
| 35 to 50 years | 179 (30.0%) | 45.0 |
| Total | 596 (100.0%) | 74.0 |
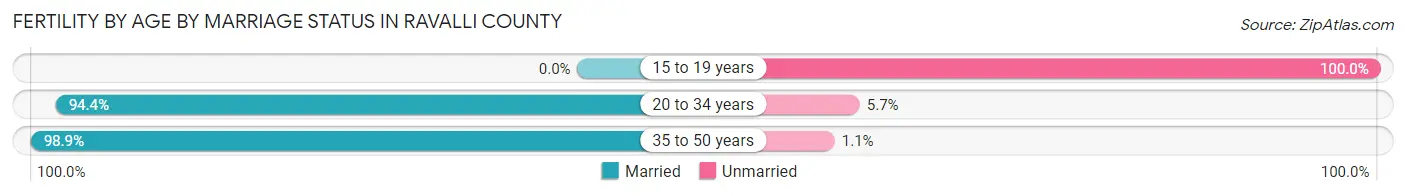
Fertility by Age by Marriage Status in Ravalli County
94.1% of women with births (596) in Ravalli County are married. The highest percentage of unmarried women with births falls into 15 to 19 years age bracket with 100.0% of them unmarried at the time of birth, while the lowest percentage of unmarried women with births belong to 35 to 50 years age bracket with 1.1% of them unmarried.
| Age Bracket | Married | Unmarried |
| 15 to 19 years | 0 (0.0%) | 10 (100.0%) |
| 20 to 34 years | 384 (94.4%) | 23 (5.7%) |
| 35 to 50 years | 177 (98.9%) | 2 (1.1%) |
| Total | 561 (94.1%) | 35 (5.9%) |
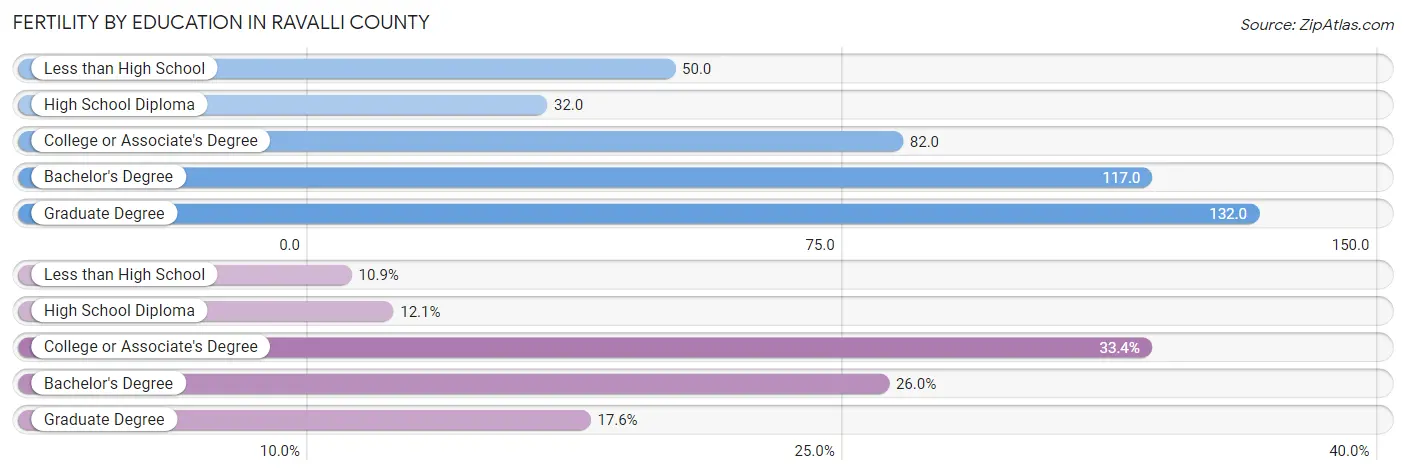
Fertility by Education in Ravalli County
Average fertility rate in Ravalli County is 74.0 births per 1,000 women. Women with the education attainment of graduate degree have the highest fertility rate of 132.0 births per 1,000 women, while women with the education attainment of high school diploma have the lowest fertility at 32.0 births per 1,000 women. Women with the education attainment of college or associate's degree represent 33.4% of all women with births.
| Educational Attainment | Women with Births | Births / 1,000 Women |
| Less than High School | 65 (10.9%) | 50.0 |
| High School Diploma | 72 (12.1%) | 32.0 |
| College or Associate's Degree | 199 (33.4%) | 82.0 |
| Bachelor's Degree | 155 (26.0%) | 117.0 |
| Graduate Degree | 105 (17.6%) | 132.0 |
| Total | 596 (100.0%) | 74.0 |
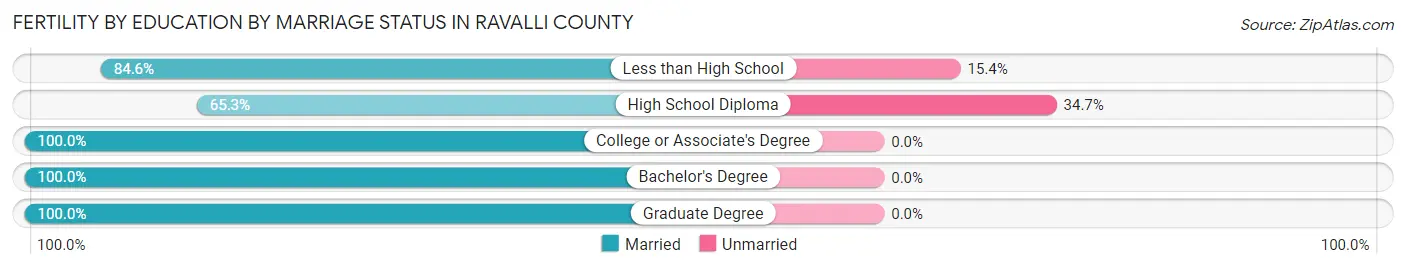
Fertility by Education by Marriage Status in Ravalli County
5.9% of women with births in Ravalli County are unmarried. Women with the educational attainment of college or associate's degree are most likely to be married with 100.0% of them married at childbirth, while women with the educational attainment of high school diploma are least likely to be married with 34.7% of them unmarried at childbirth.
| Educational Attainment | Married | Unmarried |
| Less than High School | 55 (84.6%) | 10 (15.4%) |
| High School Diploma | 47 (65.3%) | 25 (34.7%) |
| College or Associate's Degree | 199 (100.0%) | 0 (0.0%) |
| Bachelor's Degree | 155 (100.0%) | 0 (0.0%) |
| Graduate Degree | 105 (100.0%) | 0 (0.0%) |
| Total | 561 (94.1%) | 35 (5.9%) |
Income in Ravalli County
Income Overview in Ravalli County
Per Capita Income in Ravalli County is $38,555, while median incomes of families and households are $80,623 and $67,424 respectively.
| Characteristic | Number | Measure |
| Per Capita Income | 44,876 | $38,555 |
| Median Family Income | 12,812 | $80,623 |
| Mean Family Income | 12,812 | $106,503 |
| Median Household Income | 18,847 | $67,424 |
| Mean Household Income | 18,847 | $89,504 |
| Income Deficit | 12,812 | $11,681 |
| Wage / Income Gap (%) | 44,876 | 38.31% |
| Wage / Income Gap ($) | 44,876 | 61.69¢ per $1 |
| Gini / Inequality Index | 44,876 | 0.45 |
Earnings by Sex in Ravalli County
Average Earnings in Ravalli County are $34,260, $42,055 for men and $25,944 for women, a difference of 38.3%.
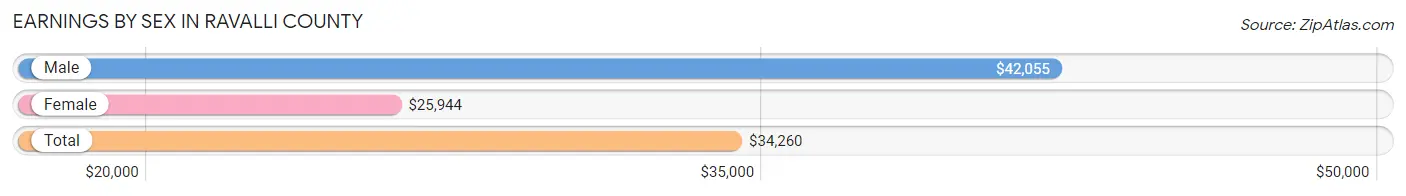
| Sex | Number | Average Earnings |
| Male | 12,064 (53.3%) | $42,055 |
| Female | 10,557 (46.7%) | $25,944 |
| Total | 22,621 (100.0%) | $34,260 |
Earnings by Sex by Income Bracket in Ravalli County
The most common earnings brackets in Ravalli County are $100,000+ for men (1,834 | 15.2%) and $30,000 to $34,999 for women (877 | 8.3%).
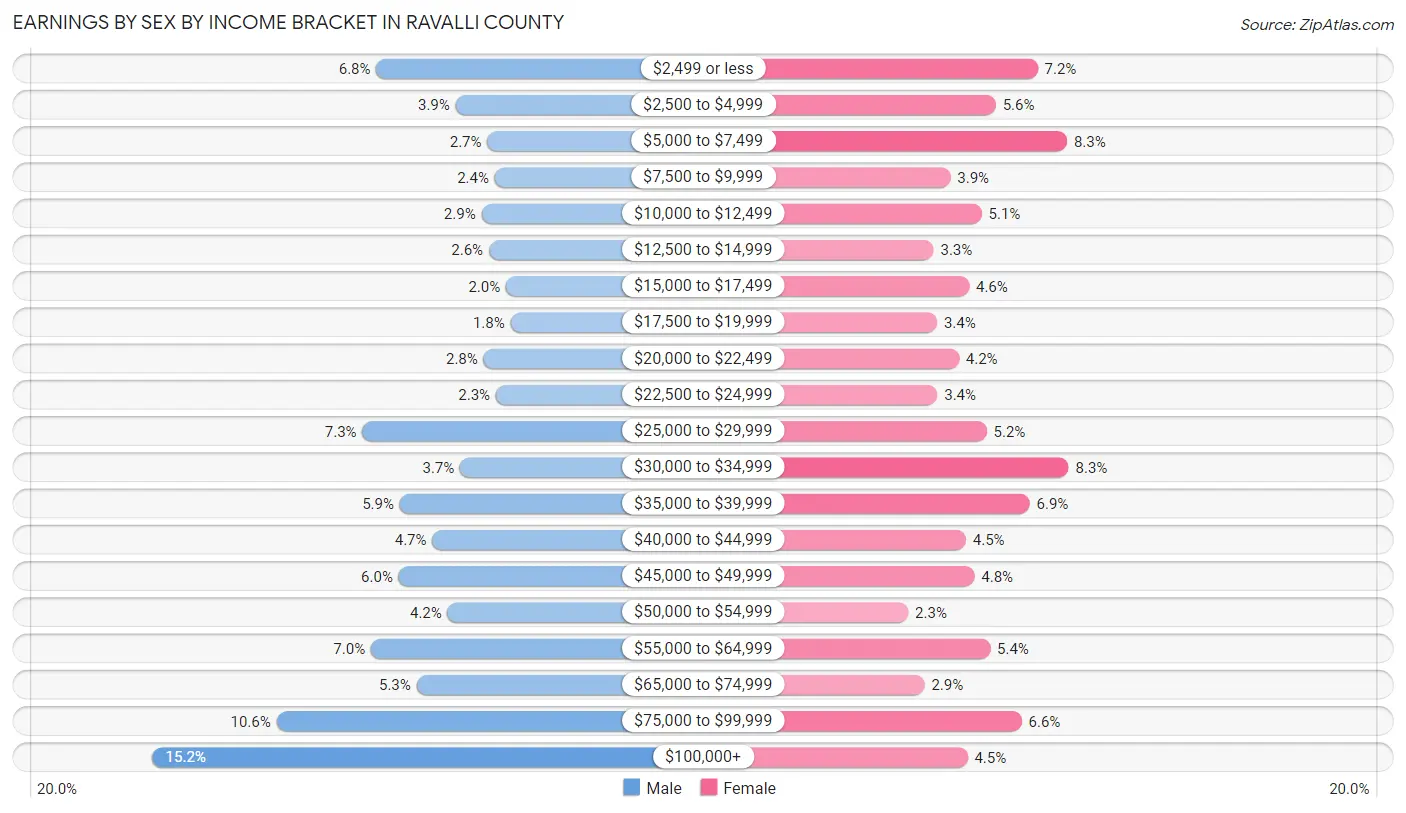
| Income | Male | Female |
| $2,499 or less | 823 (6.8%) | 755 (7.1%) |
| $2,500 to $4,999 | 465 (3.8%) | 589 (5.6%) |
| $5,000 to $7,499 | 321 (2.7%) | 871 (8.3%) |
| $7,500 to $9,999 | 287 (2.4%) | 410 (3.9%) |
| $10,000 to $12,499 | 347 (2.9%) | 533 (5.1%) |
| $12,500 to $14,999 | 314 (2.6%) | 343 (3.3%) |
| $15,000 to $17,499 | 237 (2.0%) | 484 (4.6%) |
| $17,500 to $19,999 | 216 (1.8%) | 357 (3.4%) |
| $20,000 to $22,499 | 338 (2.8%) | 443 (4.2%) |
| $22,500 to $24,999 | 282 (2.3%) | 358 (3.4%) |
| $25,000 to $29,999 | 885 (7.3%) | 553 (5.2%) |
| $30,000 to $34,999 | 444 (3.7%) | 877 (8.3%) |
| $35,000 to $39,999 | 717 (5.9%) | 723 (6.9%) |
| $40,000 to $44,999 | 569 (4.7%) | 471 (4.5%) |
| $45,000 to $49,999 | 722 (6.0%) | 505 (4.8%) |
| $50,000 to $54,999 | 501 (4.2%) | 243 (2.3%) |
| $55,000 to $64,999 | 847 (7.0%) | 567 (5.4%) |
| $65,000 to $74,999 | 641 (5.3%) | 307 (2.9%) |
| $75,000 to $99,999 | 1,274 (10.6%) | 691 (6.6%) |
| $100,000+ | 1,834 (15.2%) | 477 (4.5%) |
| Total | 12,064 (100.0%) | 10,557 (100.0%) |
Earnings by Sex by Educational Attainment in Ravalli County
Average earnings in Ravalli County are $46,939 for men and $30,779 for women, a difference of 34.4%. Men with an educational attainment of graduate degree enjoy the highest average annual earnings of $71,827, while those with less than high school education earn the least with $36,328. Women with an educational attainment of graduate degree earn the most with the average annual earnings of $50,160, while those with high school diploma education have the smallest earnings of $25,032.
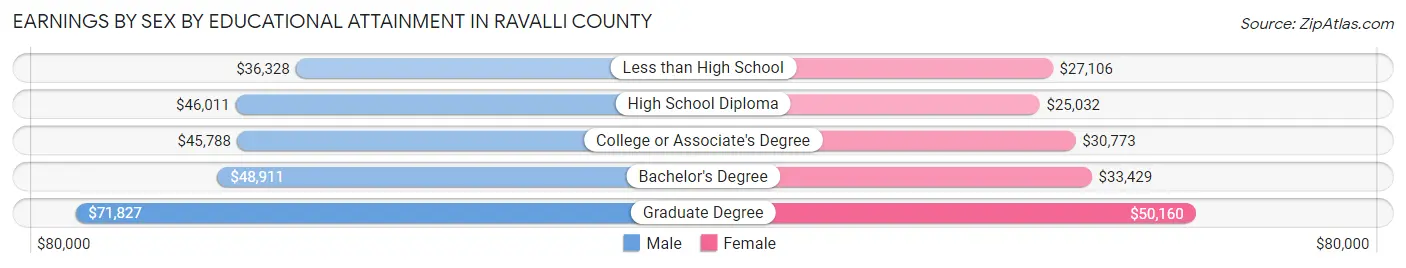
| Educational Attainment | Male Income | Female Income |
| Less than High School | $36,328 | $27,106 |
| High School Diploma | $46,011 | $25,032 |
| College or Associate's Degree | $45,788 | $30,773 |
| Bachelor's Degree | $48,911 | $33,429 |
| Graduate Degree | $71,827 | $50,160 |
| Total | $46,939 | $30,779 |
Family Income in Ravalli County
Family Income Brackets in Ravalli County
According to the Ravalli County family income data, there are 2,793 families falling into the $50,000 to $74,999 income range, which is the most common income bracket and makes up 21.8% of all families. Conversely, the $10,000 to $14,999 income bracket is the least frequent group with only 90 families (0.7%) belonging to this category.
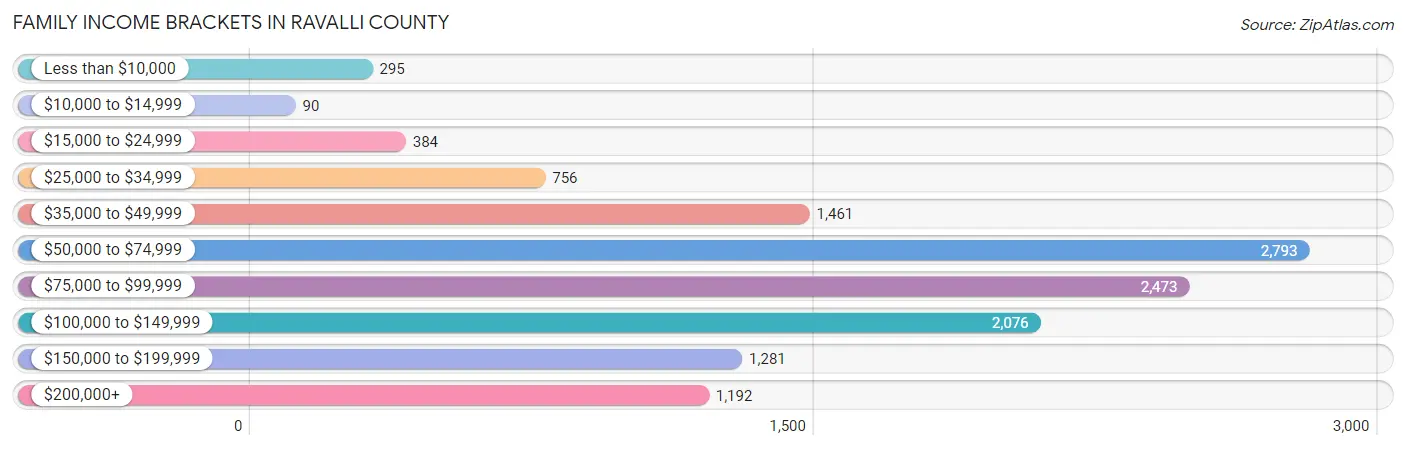
| Income Bracket | # Families | % Families |
| Less than $10,000 | 295 | 2.3% |
| $10,000 to $14,999 | 90 | 0.7% |
| $15,000 to $24,999 | 384 | 3.0% |
| $25,000 to $34,999 | 756 | 5.9% |
| $35,000 to $49,999 | 1,461 | 11.4% |
| $50,000 to $74,999 | 2,793 | 21.8% |
| $75,000 to $99,999 | 2,473 | 19.3% |
| $100,000 to $149,999 | 2,076 | 16.2% |
| $150,000 to $199,999 | 1,281 | 10.0% |
| $200,000+ | 1,192 | 9.3% |
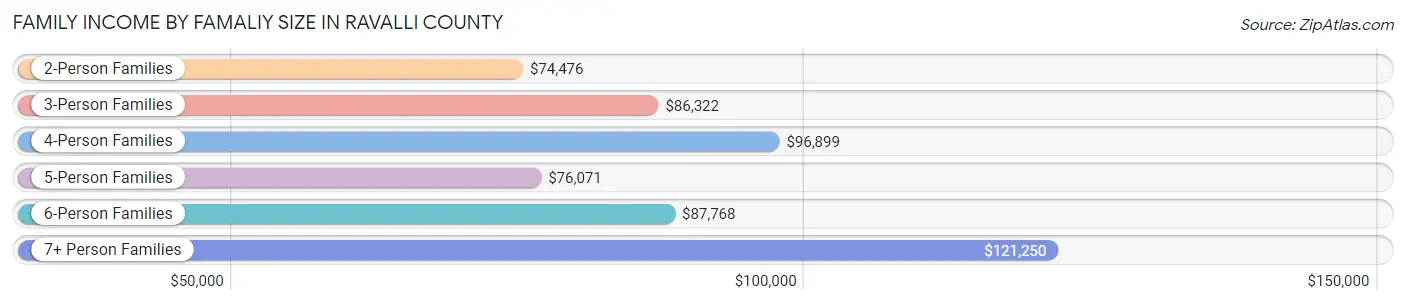
Family Income by Famaliy Size in Ravalli County
7+ person families (178 | 1.4%) account for the highest median family income in Ravalli County with $121,250 per family, while 2-person families (7,652 | 59.7%) have the highest median income of $37,238 per family member.
| Income Bracket | # Families | Median Income |
| 2-Person Families | 7,652 (59.7%) | $74,476 |
| 3-Person Families | 2,261 (17.6%) | $86,322 |
| 4-Person Families | 1,658 (12.9%) | $96,899 |
| 5-Person Families | 850 (6.6%) | $76,071 |
| 6-Person Families | 213 (1.7%) | $87,768 |
| 7+ Person Families | 178 (1.4%) | $121,250 |
| Total | 12,812 (100.0%) | $80,623 |
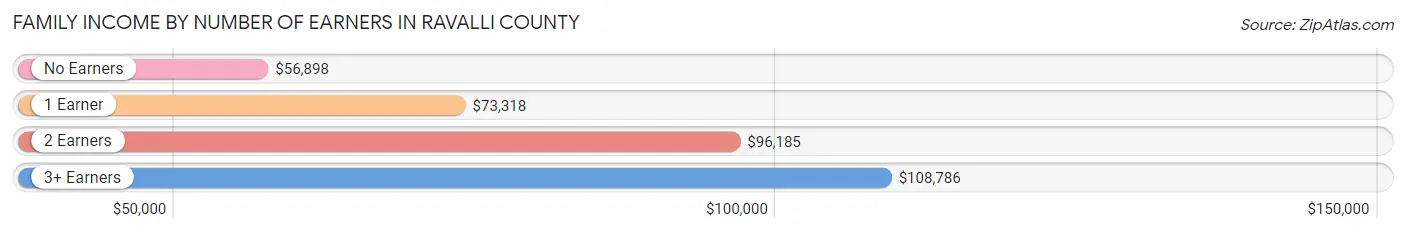
Family Income by Number of Earners in Ravalli County
The median family income in Ravalli County is $80,623, with families comprising 3+ earners (1,078) having the highest median family income of $108,786, while families with no earners (3,073) have the lowest median family income of $56,898, accounting for 8.4% and 24.0% of families, respectively.
| Number of Earners | # Families | Median Income |
| No Earners | 3,073 (24.0%) | $56,898 |
| 1 Earner | 3,834 (29.9%) | $73,318 |
| 2 Earners | 4,827 (37.7%) | $96,185 |
| 3+ Earners | 1,078 (8.4%) | $108,786 |
| Total | 12,812 (100.0%) | $80,623 |
Household Income in Ravalli County
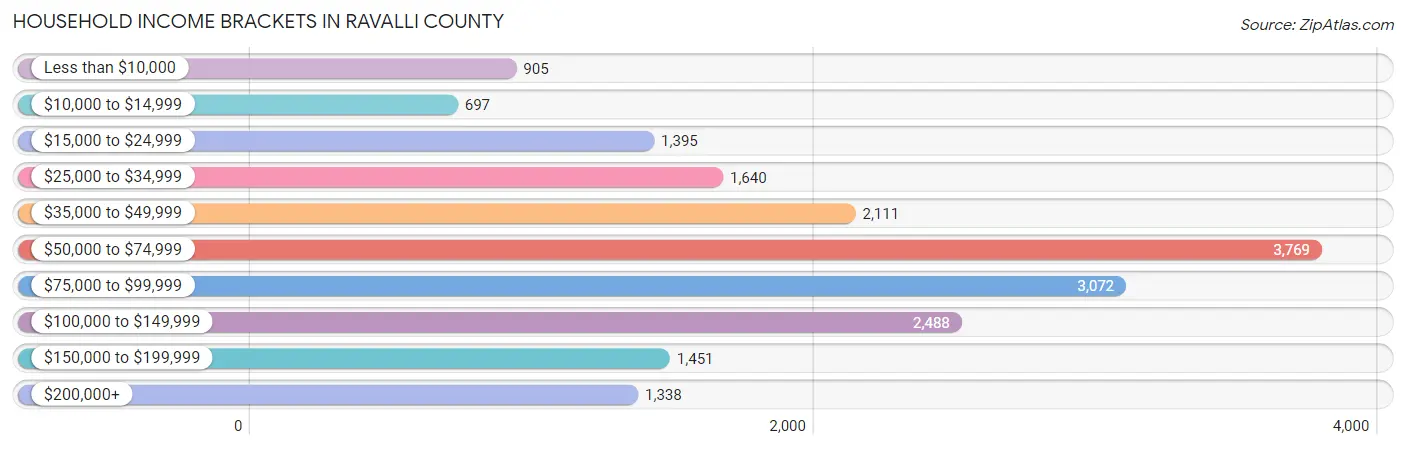
Household Income Brackets in Ravalli County
With 3,769 households falling in the category, the $50,000 to $74,999 income range is the most frequent in Ravalli County, accounting for 20.0% of all households. In contrast, only 697 households (3.7%) fall into the $10,000 to $14,999 income bracket, making it the least populous group.
| Income Bracket | # Households | % Households |
| Less than $10,000 | 905 | 4.8% |
| $10,000 to $14,999 | 697 | 3.7% |
| $15,000 to $24,999 | 1,395 | 7.4% |
| $25,000 to $34,999 | 1,640 | 8.7% |
| $35,000 to $49,999 | 2,111 | 11.2% |
| $50,000 to $74,999 | 3,769 | 20.0% |
| $75,000 to $99,999 | 3,072 | 16.3% |
| $100,000 to $149,999 | 2,488 | 13.2% |
| $150,000 to $199,999 | 1,451 | 7.7% |
| $200,000+ | 1,338 | 7.1% |
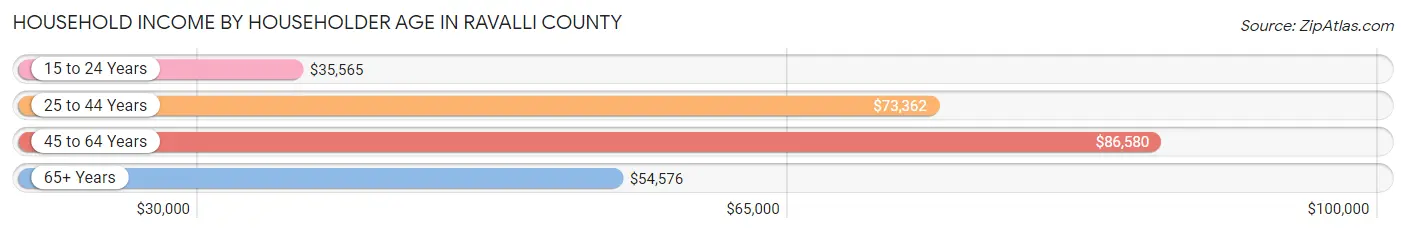
Household Income by Householder Age in Ravalli County
The median household income in Ravalli County is $67,424, with the highest median household income of $86,580 found in the 45 to 64 years age bracket for the primary householder. A total of 6,872 households (36.5%) fall into this category. Meanwhile, the 15 to 24 years age bracket for the primary householder has the lowest median household income of $35,565, with 294 households (1.6%) in this group.
| Income Bracket | # Households | Median Income |
| 15 to 24 Years | 294 (1.6%) | $35,565 |
| 25 to 44 Years | 4,288 (22.8%) | $73,362 |
| 45 to 64 Years | 6,872 (36.5%) | $86,580 |
| 65+ Years | 7,393 (39.2%) | $54,576 |
| Total | 18,847 (100.0%) | $67,424 |
Poverty in Ravalli County
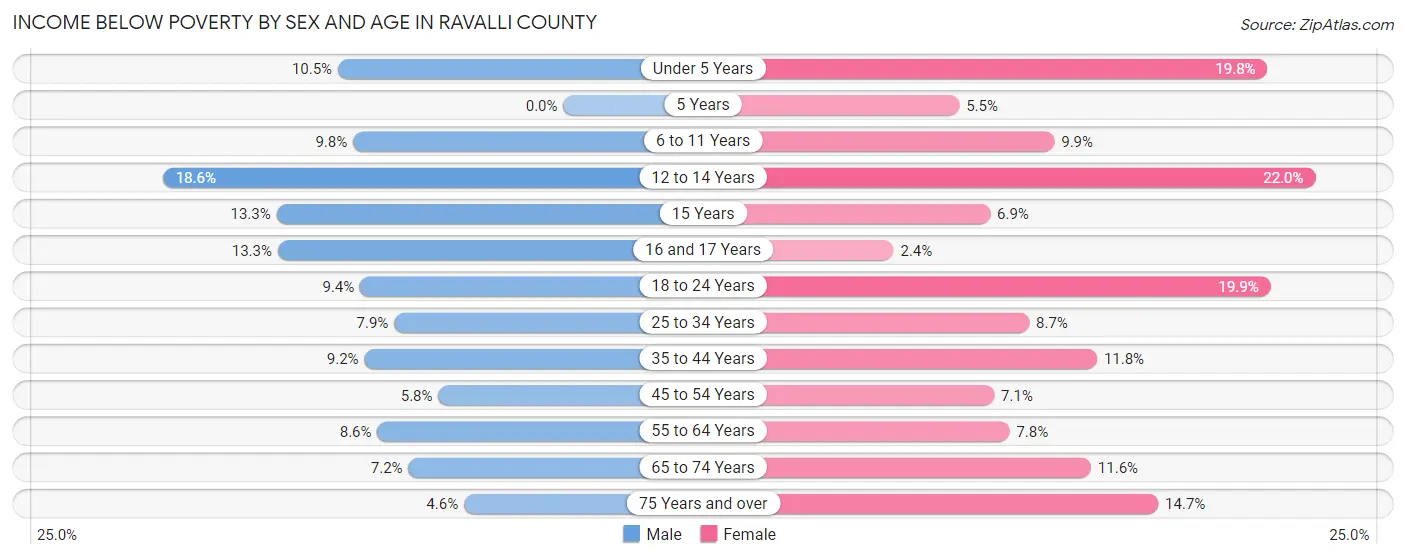
Income Below Poverty by Sex and Age in Ravalli County
With 8.4% poverty level for males and 11.3% for females among the residents of Ravalli County, 12 to 14 year old males and 12 to 14 year old females are the most vulnerable to poverty, with 150 males (18.6%) and 196 females (22.0%) in their respective age groups living below the poverty level.
| Age Bracket | Male | Female |
| Under 5 Years | 104 (10.5%) | 192 (19.8%) |
| 5 Years | 0 (0.0%) | 12 (5.4%) |
| 6 to 11 Years | 143 (9.8%) | 112 (9.9%) |
| 12 to 14 Years | 150 (18.6%) | 196 (22.0%) |
| 15 Years | 43 (13.3%) | 19 (6.9%) |
| 16 and 17 Years | 71 (13.3%) | 12 (2.4%) |
| 18 to 24 Years | 143 (9.4%) | 247 (19.9%) |
| 25 to 34 Years | 166 (7.9%) | 185 (8.7%) |
| 35 to 44 Years | 236 (9.2%) | 298 (11.8%) |
| 45 to 54 Years | 149 (5.8%) | 182 (7.1%) |
| 55 to 64 Years | 311 (8.6%) | 300 (7.8%) |
| 65 to 74 Years | 259 (7.2%) | 427 (11.6%) |
| 75 Years and over | 97 (4.6%) | 318 (14.7%) |
| Total | 1,872 (8.4%) | 2,500 (11.3%) |
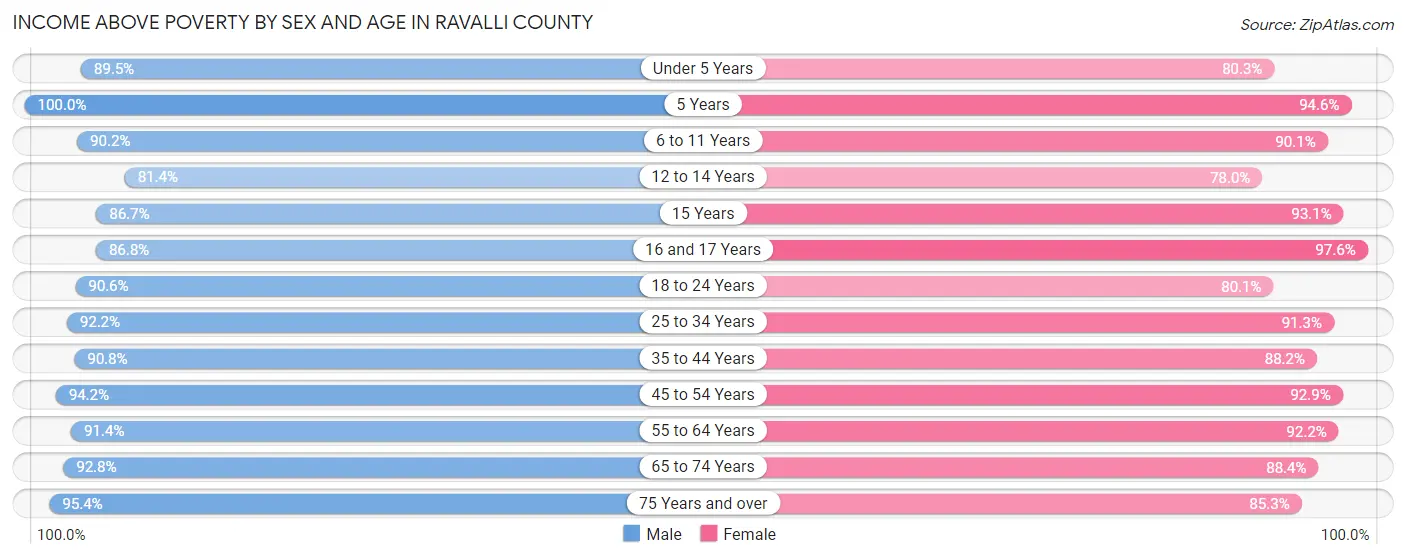
Income Above Poverty by Sex and Age in Ravalli County
According to the poverty statistics in Ravalli County, males aged 5 years and females aged 16 and 17 years are the age groups that are most secure financially, with 100.0% of males and 97.6% of females in these age groups living above the poverty line.
| Age Bracket | Male | Female |
| Under 5 Years | 890 (89.5%) | 780 (80.2%) |
| 5 Years | 219 (100.0%) | 208 (94.6%) |
| 6 to 11 Years | 1,322 (90.2%) | 1,024 (90.1%) |
| 12 to 14 Years | 657 (81.4%) | 696 (78.0%) |
| 15 Years | 280 (86.7%) | 257 (93.1%) |
| 16 and 17 Years | 465 (86.8%) | 487 (97.6%) |
| 18 to 24 Years | 1,374 (90.6%) | 994 (80.1%) |
| 25 to 34 Years | 1,949 (92.1%) | 1,944 (91.3%) |
| 35 to 44 Years | 2,321 (90.8%) | 2,219 (88.2%) |
| 45 to 54 Years | 2,421 (94.2%) | 2,393 (92.9%) |
| 55 to 64 Years | 3,292 (91.4%) | 3,555 (92.2%) |
| 65 to 74 Years | 3,341 (92.8%) | 3,267 (88.4%) |
| 75 Years and over | 2,008 (95.4%) | 1,848 (85.3%) |
| Total | 20,539 (91.6%) | 19,672 (88.7%) |
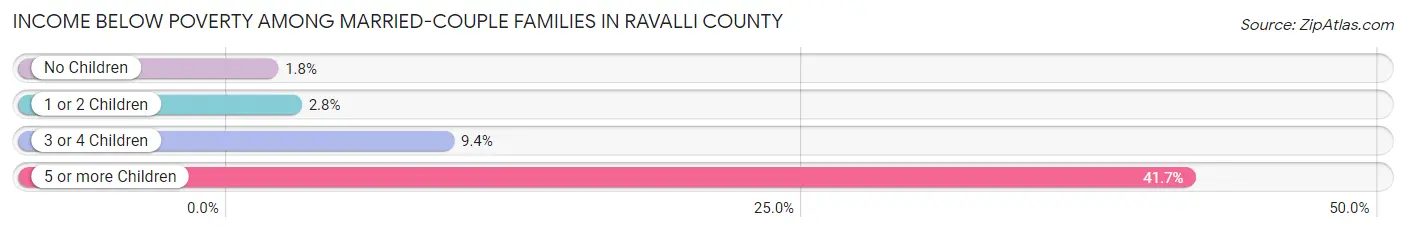
Income Below Poverty Among Married-Couple Families in Ravalli County
The poverty statistics for married-couple families in Ravalli County show that 2.7% or 291 of the total 10,648 families live below the poverty line. Families with 5 or more children have the highest poverty rate of 41.7%, comprising of 20 families. On the other hand, families with no children have the lowest poverty rate of 1.8%, which includes 128 families.
| Children | Above Poverty | Below Poverty |
| No Children | 7,171 (98.3%) | 128 (1.8%) |
| 1 or 2 Children | 2,454 (97.2%) | 70 (2.8%) |
| 3 or 4 Children | 704 (90.6%) | 73 (9.4%) |
| 5 or more Children | 28 (58.3%) | 20 (41.7%) |
| Total | 10,357 (97.3%) | 291 (2.7%) |
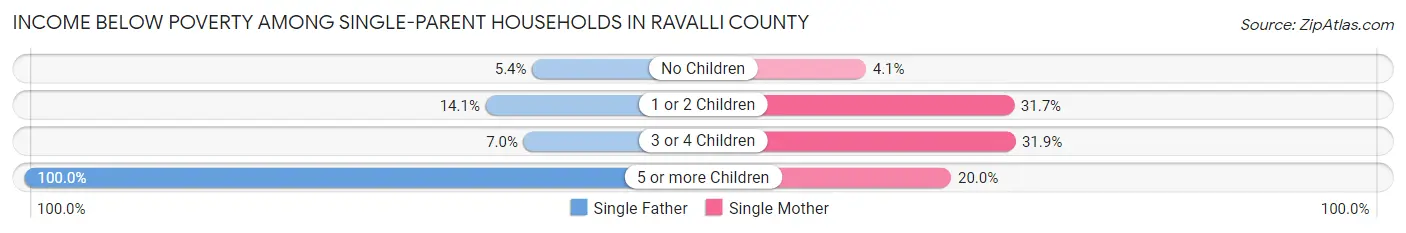
Income Below Poverty Among Single-Parent Households in Ravalli County
According to the poverty data in Ravalli County, 7.7% or 60 single-father households and 21.5% or 299 single-mother households are living below the poverty line. Among single-father households, those with 5 or more children have the highest poverty rate, with 3 households (100.0%) experiencing poverty. Likewise, among single-mother households, those with 3 or 4 children have the highest poverty rate, with 30 households (31.9%) falling below the poverty line.
| Children | Single Father | Single Mother |
| No Children | 30 (5.4%) | 21 (4.1%) |
| 1 or 2 Children | 23 (14.1%) | 247 (31.7%) |
| 3 or 4 Children | 4 (7.0%) | 30 (31.9%) |
| 5 or more Children | 3 (100.0%) | 1 (20.0%) |
| Total | 60 (7.7%) | 299 (21.5%) |
Income Below Poverty Among Married-Couple vs Single-Parent Households in Ravalli County
The poverty data for Ravalli County shows that 291 of the married-couple family households (2.7%) and 359 of the single-parent households (16.6%) are living below the poverty level. Within the married-couple family households, those with 5 or more children have the highest poverty rate, with 20 households (41.7%) falling below the poverty line. Among the single-parent households, those with 5 or more children have the highest poverty rate, with 4 household (50.0%) living below poverty.
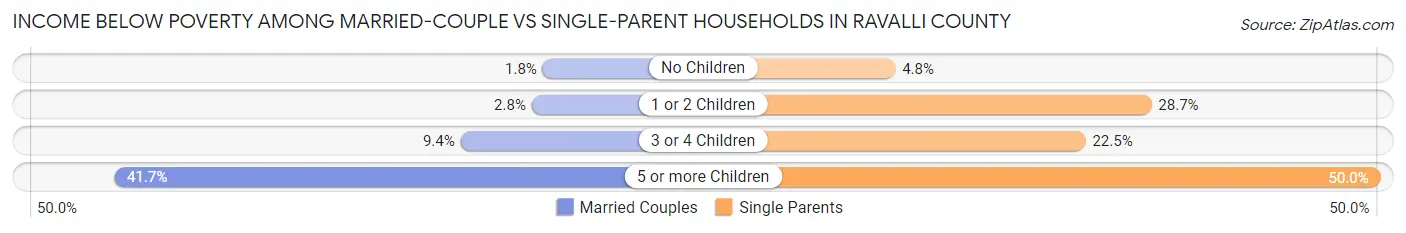
| Children | Married-Couple Families | Single-Parent Households |
| No Children | 128 (1.8%) | 51 (4.8%) |
| 1 or 2 Children | 70 (2.8%) | 270 (28.7%) |
| 3 or 4 Children | 73 (9.4%) | 34 (22.5%) |
| 5 or more Children | 20 (41.7%) | 4 (50.0%) |
| Total | 291 (2.7%) | 359 (16.6%) |
Employment Characteristics in Ravalli County
Employment by Class of Employer in Ravalli County
Among the 19,483 employed individuals in Ravalli County, private company employees (11,553 | 59.3%), self-employed (not incorporated) (1,997 | 10.2%), and not-for-profit organizations (1,830 | 9.4%) make up the most common classes of employment.
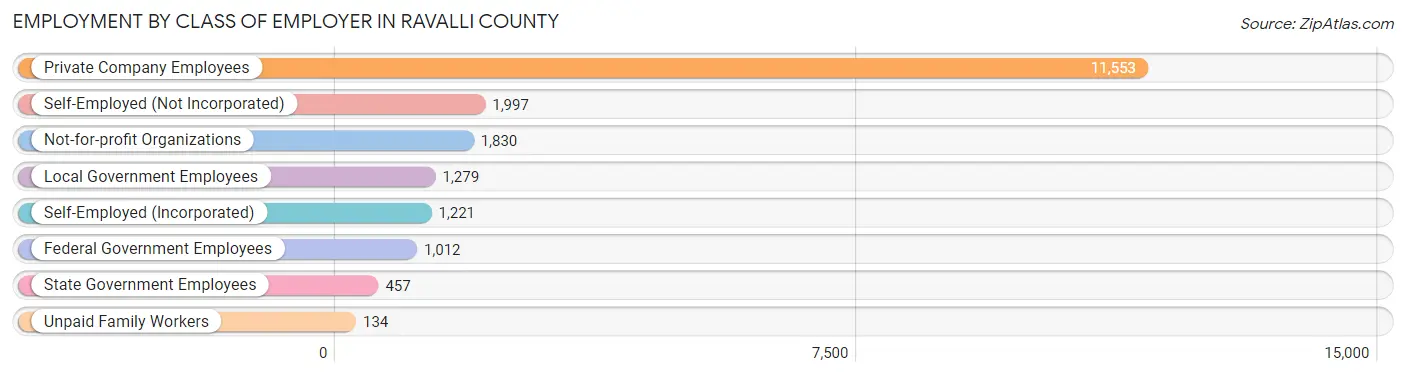
| Employer Class | # Employees | % Employees |
| Private Company Employees | 11,553 | 59.3% |
| Self-Employed (Incorporated) | 1,221 | 6.3% |
| Self-Employed (Not Incorporated) | 1,997 | 10.2% |
| Not-for-profit Organizations | 1,830 | 9.4% |
| Local Government Employees | 1,279 | 6.6% |
| State Government Employees | 457 | 2.4% |
| Federal Government Employees | 1,012 | 5.2% |
| Unpaid Family Workers | 134 | 0.7% |
| Total | 19,483 | 100.0% |
Employment Status by Age in Ravalli County
According to the labor force statistics for Ravalli County, out of the total population over 16 years of age (37,498), 56.4% or 21,149 individuals are in the labor force, with 4.4% or 931 of them unemployed. The age group with the highest labor force participation rate is 25 to 29 years, with 84.3% or 1,589 individuals in the labor force. Within the labor force, the 16 to 19 years age range has the highest percentage of unemployed individuals, with 11.6% or 133 of them being unemployed.
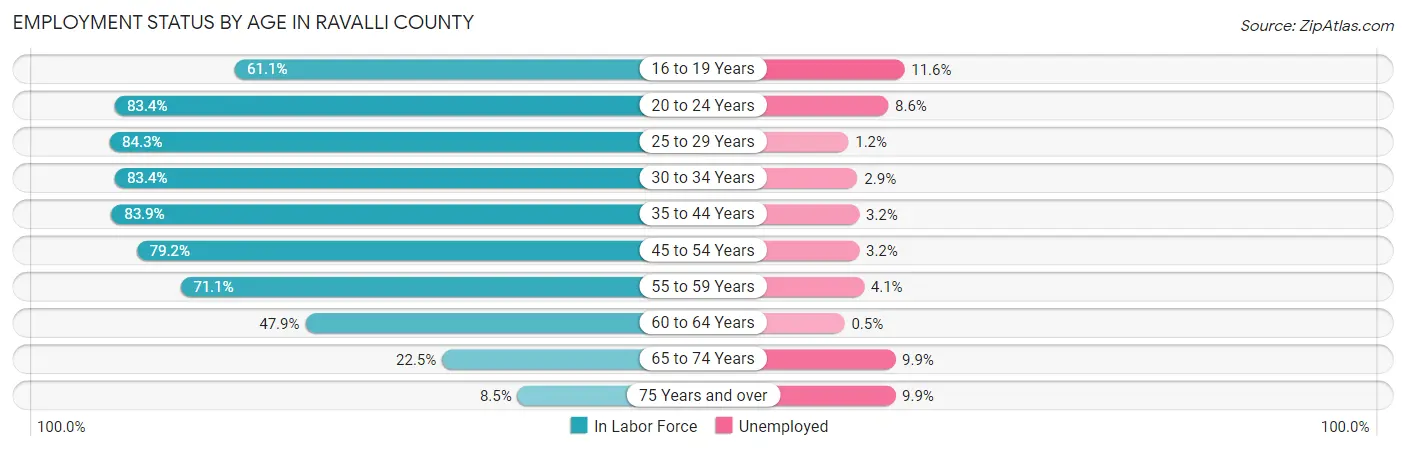
| Age Bracket | In Labor Force | Unemployed |
| 16 to 19 Years | 1,149 (61.1%) | 133 (11.6%) |
| 20 to 24 Years | 1,604 (83.4%) | 138 (8.6%) |
| 25 to 29 Years | 1,589 (84.3%) | 19 (1.2%) |
| 30 to 34 Years | 1,972 (83.4%) | 57 (2.9%) |
| 35 to 44 Years | 4,269 (83.9%) | 137 (3.2%) |
| 45 to 54 Years | 4,075 (79.2%) | 130 (3.2%) |
| 55 to 59 Years | 2,683 (71.1%) | 110 (4.1%) |
| 60 to 64 Years | 1,769 (47.9%) | 9 (0.5%) |
| 65 to 74 Years | 1,648 (22.5%) | 163 (9.9%) |
| 75 Years and over | 376 (8.5%) | 37 (9.9%) |
| Total | 21,149 (56.4%) | 931 (4.4%) |
Employment Status by Educational Attainment in Ravalli County
According to labor force statistics for Ravalli County, 74.5% of individuals (16,353) out of the total population between 25 and 64 years of age (21,950) are in the labor force, with 2.8% or 458 of them being unemployed. The group with the highest labor force participation rate are those with the educational attainment of bachelor's degree or higher, with 81.1% or 5,001 individuals in the labor force. Within the labor force, individuals with less than high school education have the highest percentage of unemployment, with 15.6% or 151 of them being unemployed.
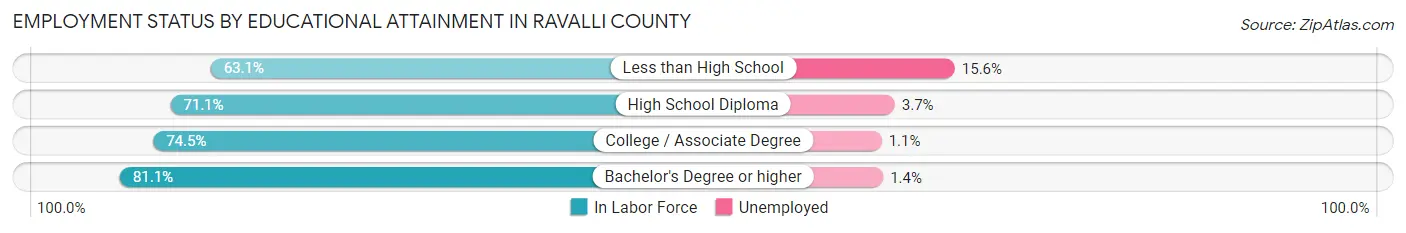
| Educational Attainment | In Labor Force | Unemployed |
| Less than High School | 971 (63.1%) | 240 (15.6%) |
| High School Diploma | 4,626 (71.1%) | 241 (3.7%) |
| College / Associate Degree | 5,765 (74.5%) | 85 (1.1%) |
| Bachelor's Degree or higher | 5,001 (81.1%) | 86 (1.4%) |
| Total | 16,353 (74.5%) | 615 (2.8%) |
Employment Occupations by Sex in Ravalli County
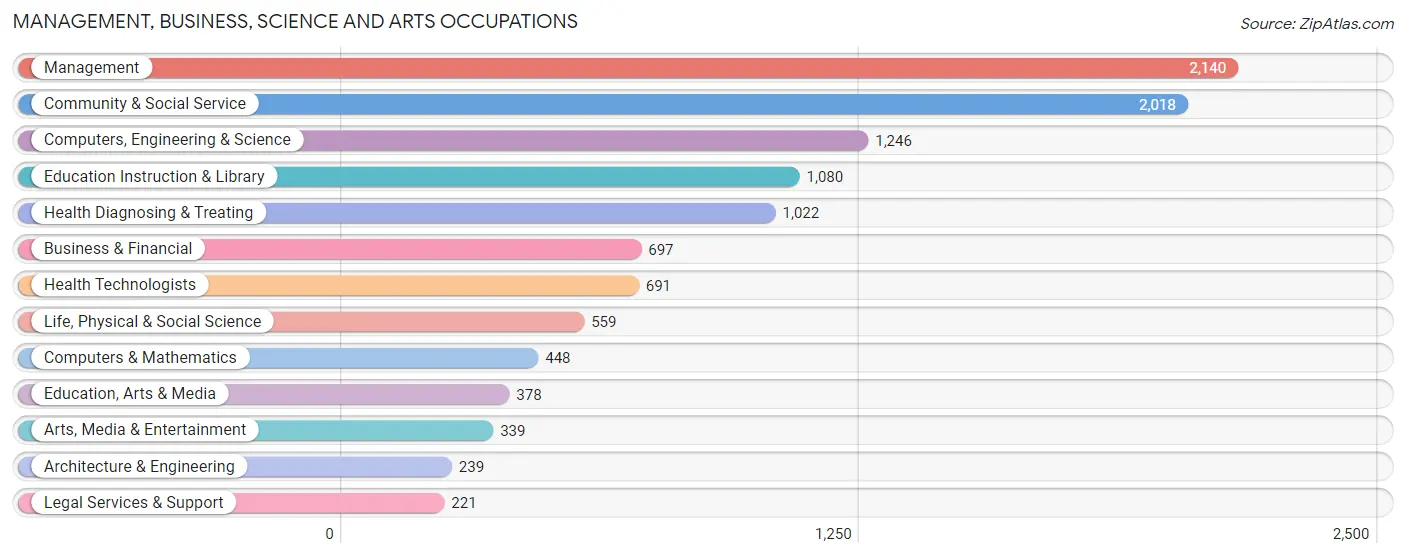
Management, Business, Science and Arts Occupations
The most common Management, Business, Science and Arts occupations in Ravalli County are Management (2,140 | 10.6%), Community & Social Service (2,018 | 10.0%), Computers, Engineering & Science (1,246 | 6.2%), Education Instruction & Library (1,080 | 5.3%), and Health Diagnosing & Treating (1,022 | 5.1%).
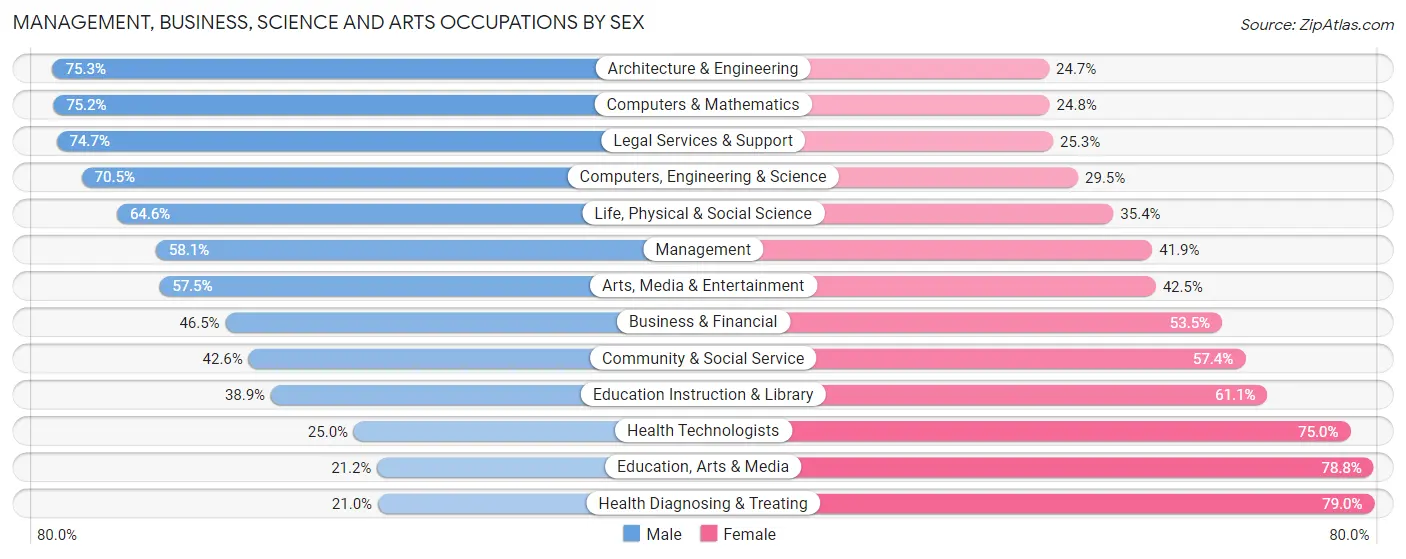
Management, Business, Science and Arts Occupations by Sex
Within the Management, Business, Science and Arts occupations in Ravalli County, the most male-oriented occupations are Architecture & Engineering (75.3%), Computers & Mathematics (75.2%), and Legal Services & Support (74.7%), while the most female-oriented occupations are Health Diagnosing & Treating (79.0%), Education, Arts & Media (78.8%), and Health Technologists (75.0%).
| Occupation | Male | Female |
| Management | 1,243 (58.1%) | 897 (41.9%) |
| Business & Financial | 324 (46.5%) | 373 (53.5%) |
| Computers, Engineering & Science | 878 (70.5%) | 368 (29.5%) |
| Computers & Mathematics | 337 (75.2%) | 111 (24.8%) |
| Architecture & Engineering | 180 (75.3%) | 59 (24.7%) |
| Life, Physical & Social Science | 361 (64.6%) | 198 (35.4%) |
| Community & Social Service | 860 (42.6%) | 1,158 (57.4%) |
| Education, Arts & Media | 80 (21.2%) | 298 (78.8%) |
| Legal Services & Support | 165 (74.7%) | 56 (25.3%) |
| Education Instruction & Library | 420 (38.9%) | 660 (61.1%) |
| Arts, Media & Entertainment | 195 (57.5%) | 144 (42.5%) |
| Health Diagnosing & Treating | 215 (21.0%) | 807 (79.0%) |
| Health Technologists | 173 (25.0%) | 518 (75.0%) |
| Total (Category) | 3,520 (49.4%) | 3,603 (50.6%) |
| Total (Overall) | 10,725 (53.1%) | 9,470 (46.9%) |
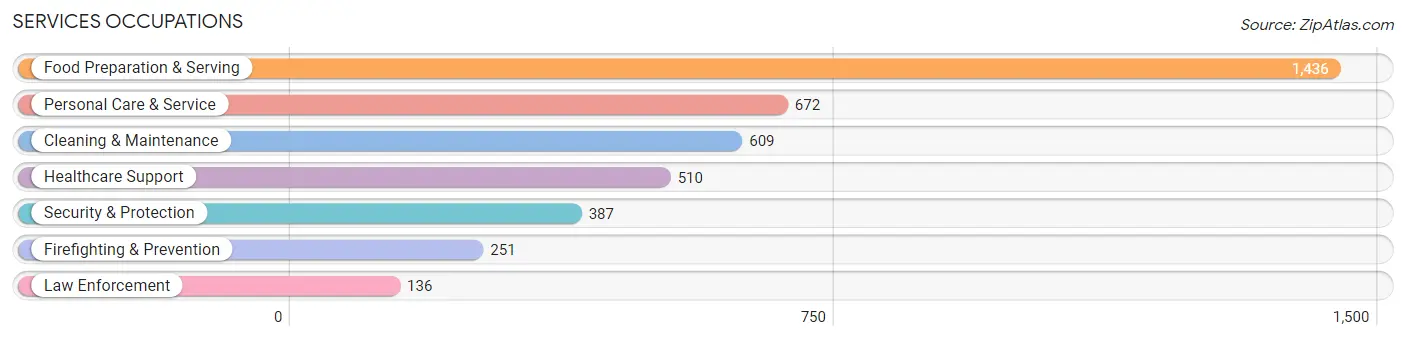
Services Occupations
The most common Services occupations in Ravalli County are Food Preparation & Serving (1,436 | 7.1%), Personal Care & Service (672 | 3.3%), Cleaning & Maintenance (609 | 3.0%), Healthcare Support (510 | 2.5%), and Security & Protection (387 | 1.9%).
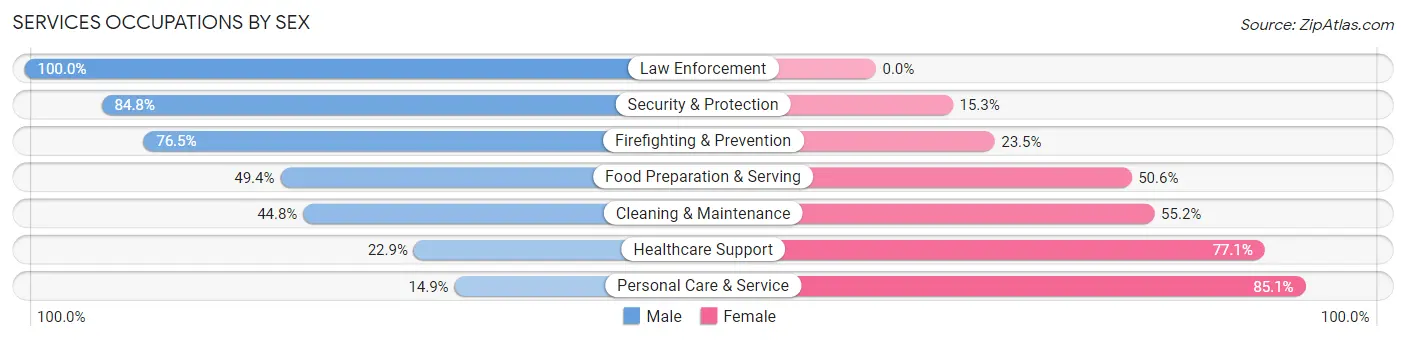
Services Occupations by Sex
Within the Services occupations in Ravalli County, the most male-oriented occupations are Law Enforcement (100.0%), Security & Protection (84.8%), and Firefighting & Prevention (76.5%), while the most female-oriented occupations are Personal Care & Service (85.1%), Healthcare Support (77.1%), and Cleaning & Maintenance (55.2%).
| Occupation | Male | Female |
| Healthcare Support | 117 (22.9%) | 393 (77.1%) |
| Security & Protection | 328 (84.8%) | 59 (15.2%) |
| Firefighting & Prevention | 192 (76.5%) | 59 (23.5%) |
| Law Enforcement | 136 (100.0%) | 0 (0.0%) |
| Food Preparation & Serving | 709 (49.4%) | 727 (50.6%) |
| Cleaning & Maintenance | 273 (44.8%) | 336 (55.2%) |
| Personal Care & Service | 100 (14.9%) | 572 (85.1%) |
| Total (Category) | 1,527 (42.2%) | 2,087 (57.8%) |
| Total (Overall) | 10,725 (53.1%) | 9,470 (46.9%) |
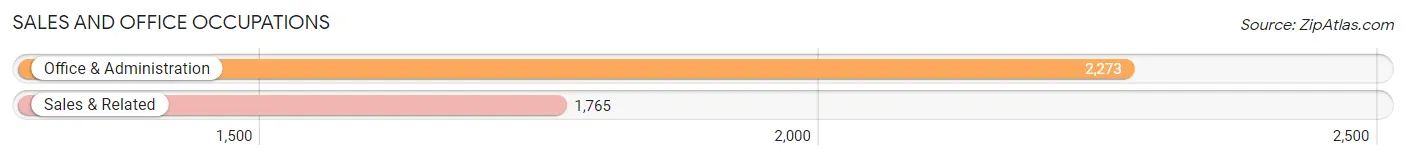
Sales and Office Occupations
The most common Sales and Office occupations in Ravalli County are Office & Administration (2,273 | 11.3%), and Sales & Related (1,765 | 8.7%).
Sales and Office Occupations by Sex
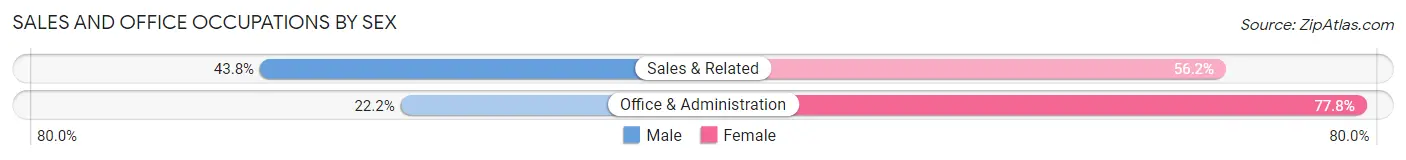
| Occupation | Male | Female |
| Sales & Related | 773 (43.8%) | 992 (56.2%) |
| Office & Administration | 504 (22.2%) | 1,769 (77.8%) |
| Total (Category) | 1,277 (31.6%) | 2,761 (68.4%) |
| Total (Overall) | 10,725 (53.1%) | 9,470 (46.9%) |
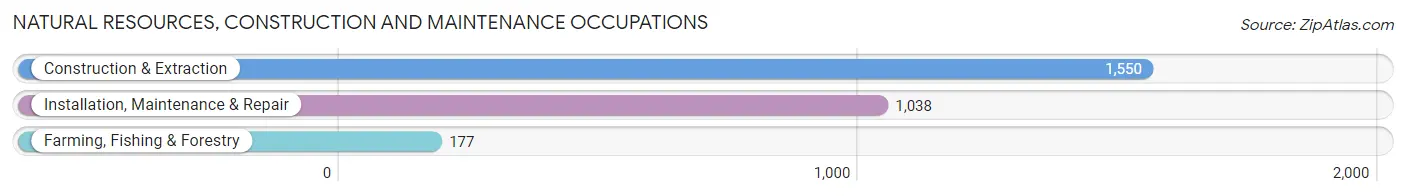
Natural Resources, Construction and Maintenance Occupations
The most common Natural Resources, Construction and Maintenance occupations in Ravalli County are Construction & Extraction (1,550 | 7.7%), Installation, Maintenance & Repair (1,038 | 5.1%), and Farming, Fishing & Forestry (177 | 0.9%).
Natural Resources, Construction and Maintenance Occupations by Sex
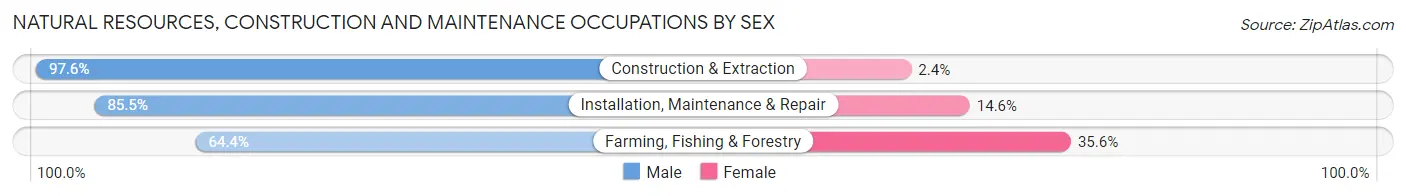
| Occupation | Male | Female |
| Farming, Fishing & Forestry | 114 (64.4%) | 63 (35.6%) |
| Construction & Extraction | 1,513 (97.6%) | 37 (2.4%) |
| Installation, Maintenance & Repair | 887 (85.5%) | 151 (14.5%) |
| Total (Category) | 2,514 (90.9%) | 251 (9.1%) |
| Total (Overall) | 10,725 (53.1%) | 9,470 (46.9%) |
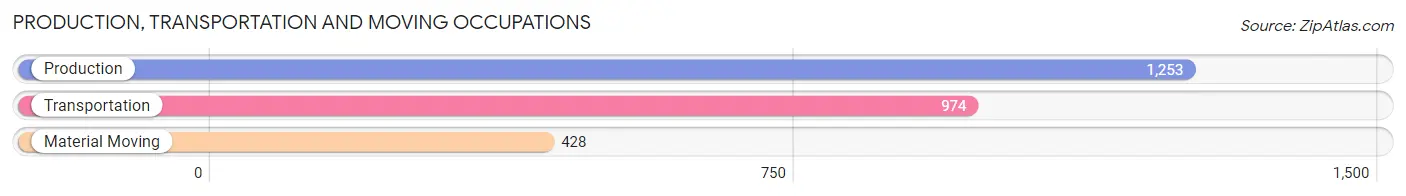
Production, Transportation and Moving Occupations
The most common Production, Transportation and Moving occupations in Ravalli County are Production (1,253 | 6.2%), Transportation (974 | 4.8%), and Material Moving (428 | 2.1%).
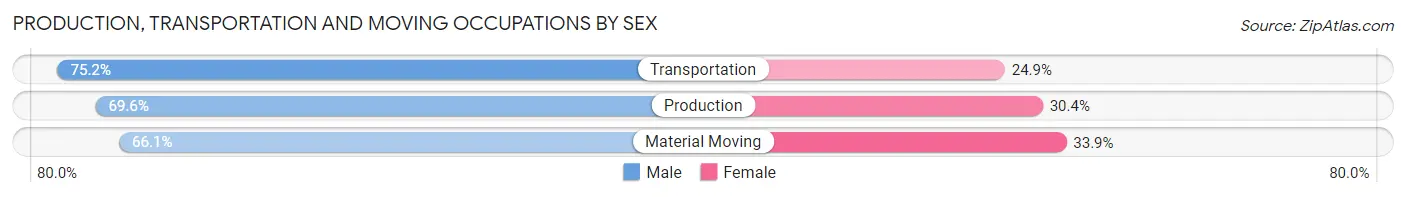
Production, Transportation and Moving Occupations by Sex
| Occupation | Male | Female |
| Production | 872 (69.6%) | 381 (30.4%) |
| Transportation | 732 (75.1%) | 242 (24.8%) |
| Material Moving | 283 (66.1%) | 145 (33.9%) |
| Total (Category) | 1,887 (71.1%) | 768 (28.9%) |
| Total (Overall) | 10,725 (53.1%) | 9,470 (46.9%) |
Employment Industries by Sex in Ravalli County
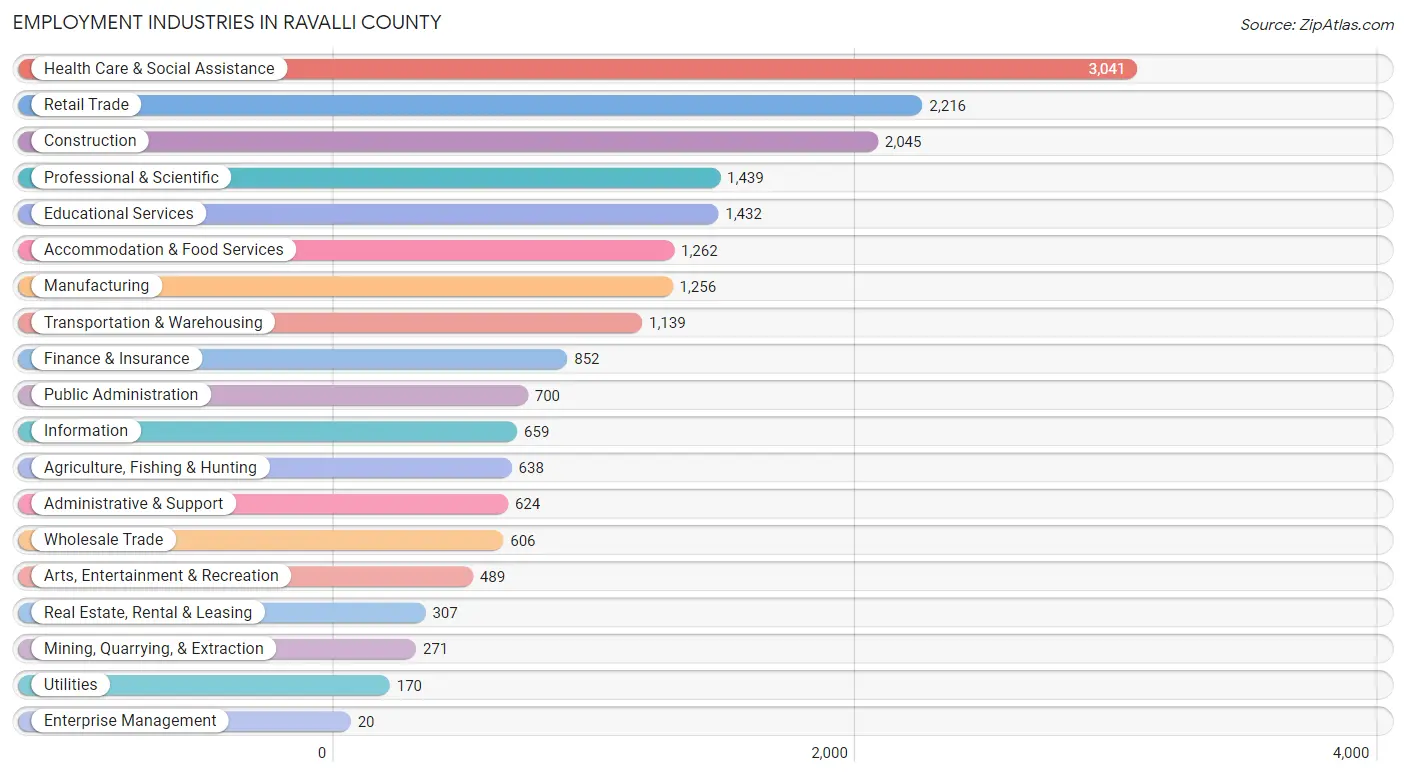
Employment Industries in Ravalli County
The major employment industries in Ravalli County include Health Care & Social Assistance (3,041 | 15.1%), Retail Trade (2,216 | 11.0%), Construction (2,045 | 10.1%), Professional & Scientific (1,439 | 7.1%), and Educational Services (1,432 | 7.1%).
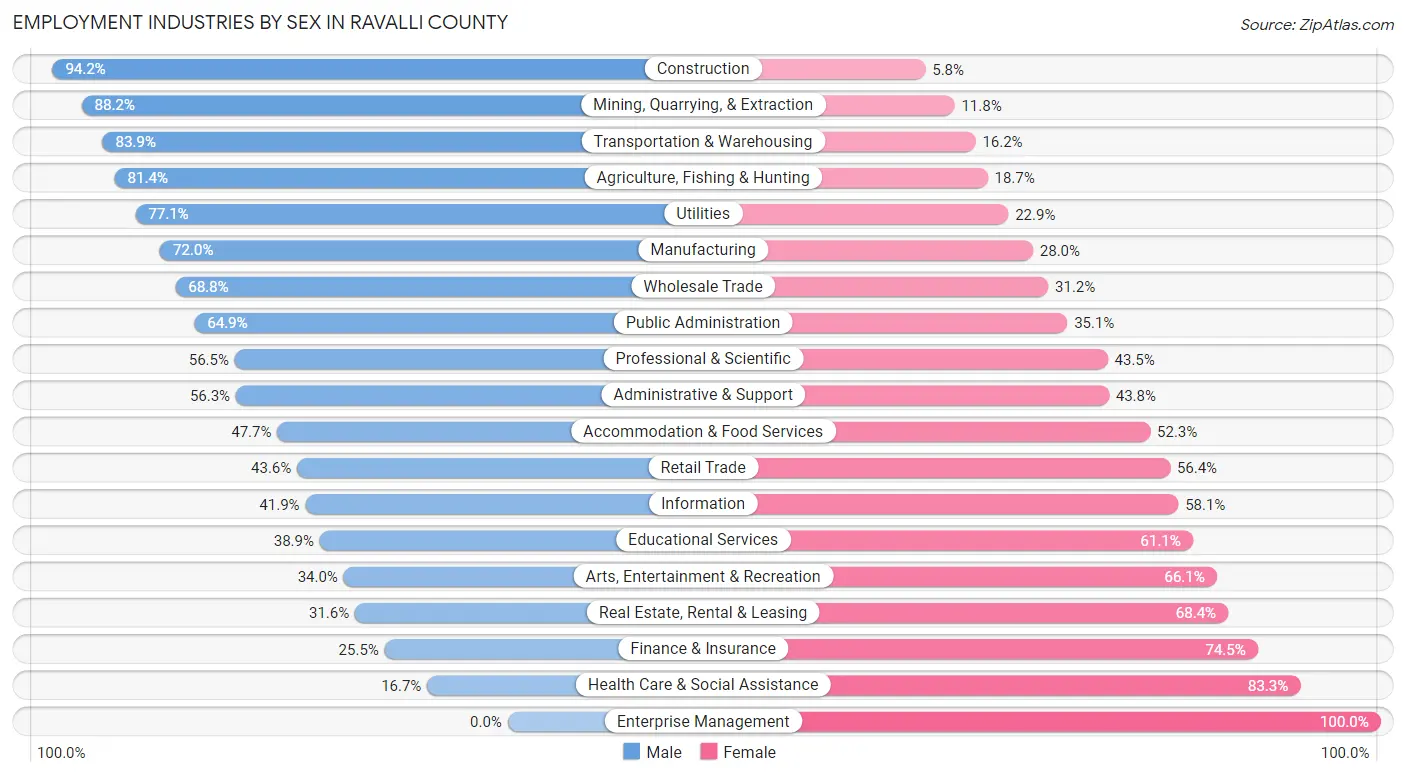
Employment Industries by Sex in Ravalli County
The Ravalli County industries that see more men than women are Construction (94.2%), Mining, Quarrying, & Extraction (88.2%), and Transportation & Warehousing (83.9%), whereas the industries that tend to have a higher number of women are Enterprise Management (100.0%), Health Care & Social Assistance (83.3%), and Finance & Insurance (74.5%).
| Industry | Male | Female |
| Agriculture, Fishing & Hunting | 519 (81.4%) | 119 (18.6%) |
| Mining, Quarrying, & Extraction | 239 (88.2%) | 32 (11.8%) |
| Construction | 1,927 (94.2%) | 118 (5.8%) |
| Manufacturing | 904 (72.0%) | 352 (28.0%) |
| Wholesale Trade | 417 (68.8%) | 189 (31.2%) |
| Retail Trade | 966 (43.6%) | 1,250 (56.4%) |
| Transportation & Warehousing | 955 (83.9%) | 184 (16.2%) |
| Utilities | 131 (77.1%) | 39 (22.9%) |
| Information | 276 (41.9%) | 383 (58.1%) |
| Finance & Insurance | 217 (25.5%) | 635 (74.5%) |
| Real Estate, Rental & Leasing | 97 (31.6%) | 210 (68.4%) |
| Professional & Scientific | 813 (56.5%) | 626 (43.5%) |
| Enterprise Management | 0 (0.0%) | 20 (100.0%) |
| Administrative & Support | 351 (56.2%) | 273 (43.8%) |
| Educational Services | 557 (38.9%) | 875 (61.1%) |
| Health Care & Social Assistance | 507 (16.7%) | 2,534 (83.3%) |
| Arts, Entertainment & Recreation | 166 (34.0%) | 323 (66.0%) |
| Accommodation & Food Services | 602 (47.7%) | 660 (52.3%) |
| Public Administration | 454 (64.9%) | 246 (35.1%) |
| Total | 10,725 (53.1%) | 9,470 (46.9%) |
Education in Ravalli County
School Enrollment in Ravalli County
The most common levels of schooling among the 7,721 students in Ravalli County are high school (2,046 | 26.5%), middle school (2,019 | 26.2%), and elementary school (1,639 | 21.2%).
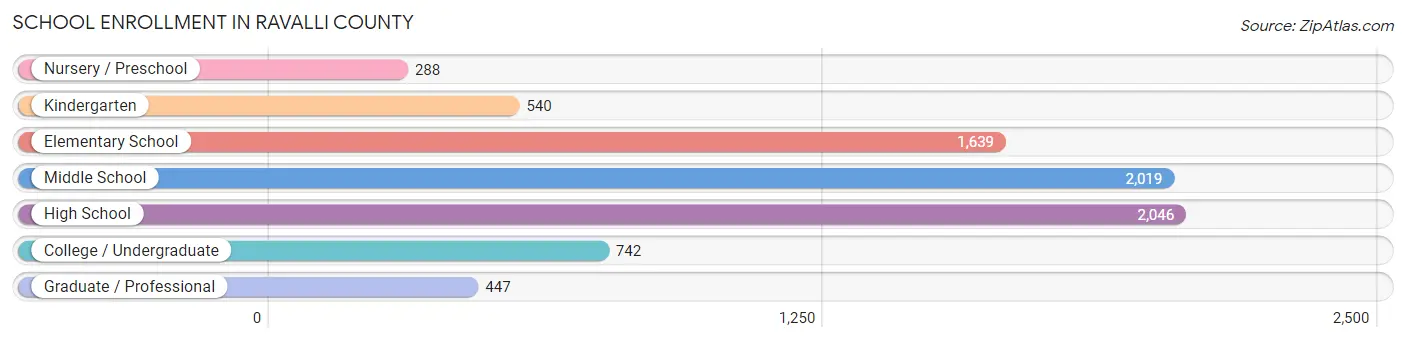
| School Level | # Students | % Students |
| Nursery / Preschool | 288 | 3.7% |
| Kindergarten | 540 | 7.0% |
| Elementary School | 1,639 | 21.2% |
| Middle School | 2,019 | 26.2% |
| High School | 2,046 | 26.5% |
| College / Undergraduate | 742 | 9.6% |
| Graduate / Professional | 447 | 5.8% |
| Total | 7,721 | 100.0% |
School Enrollment by Age by Funding Source in Ravalli County
Out of a total of 7,721 students who are enrolled in schools in Ravalli County, 1,382 (17.9%) attend a private institution, while the remaining 6,339 (82.1%) are enrolled in public schools. The age group of 35 years and over has the highest likelihood of being enrolled in private schools, with 180 (47.5% in the age bracket) enrolled. Conversely, the age group of 15 to 17 year olds has the lowest likelihood of being enrolled in a private school, with 1,437 (91.3% in the age bracket) attending a public institution.
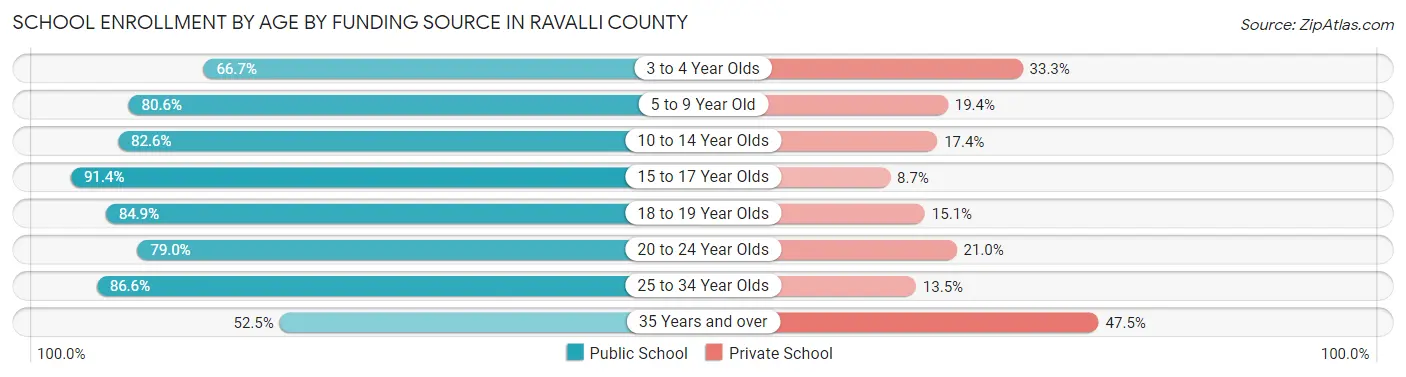
| Age Bracket | Public School | Private School |
| 3 to 4 Year Olds | 144 (66.7%) | 72 (33.3%) |
| 5 to 9 Year Old | 1,517 (80.6%) | 365 (19.4%) |
| 10 to 14 Year Olds | 2,057 (82.6%) | 434 (17.4%) |
| 15 to 17 Year Olds | 1,437 (91.3%) | 136 (8.6%) |
| 18 to 19 Year Olds | 331 (84.9%) | 59 (15.1%) |
| 20 to 24 Year Olds | 342 (79.0%) | 91 (21.0%) |
| 25 to 34 Year Olds | 309 (86.6%) | 48 (13.5%) |
| 35 Years and over | 199 (52.5%) | 180 (47.5%) |
| Total | 6,339 (82.1%) | 1,382 (17.9%) |
Educational Attainment by Field of Study in Ravalli County
Education (1,613 | 15.1%), bio, nature & agricultural (1,552 | 14.6%), business (1,170 | 11.0%), social sciences (872 | 8.2%), and science & technology (803 | 7.5%) are the most common fields of study among 10,654 individuals in Ravalli County who have obtained a bachelor's degree or higher.
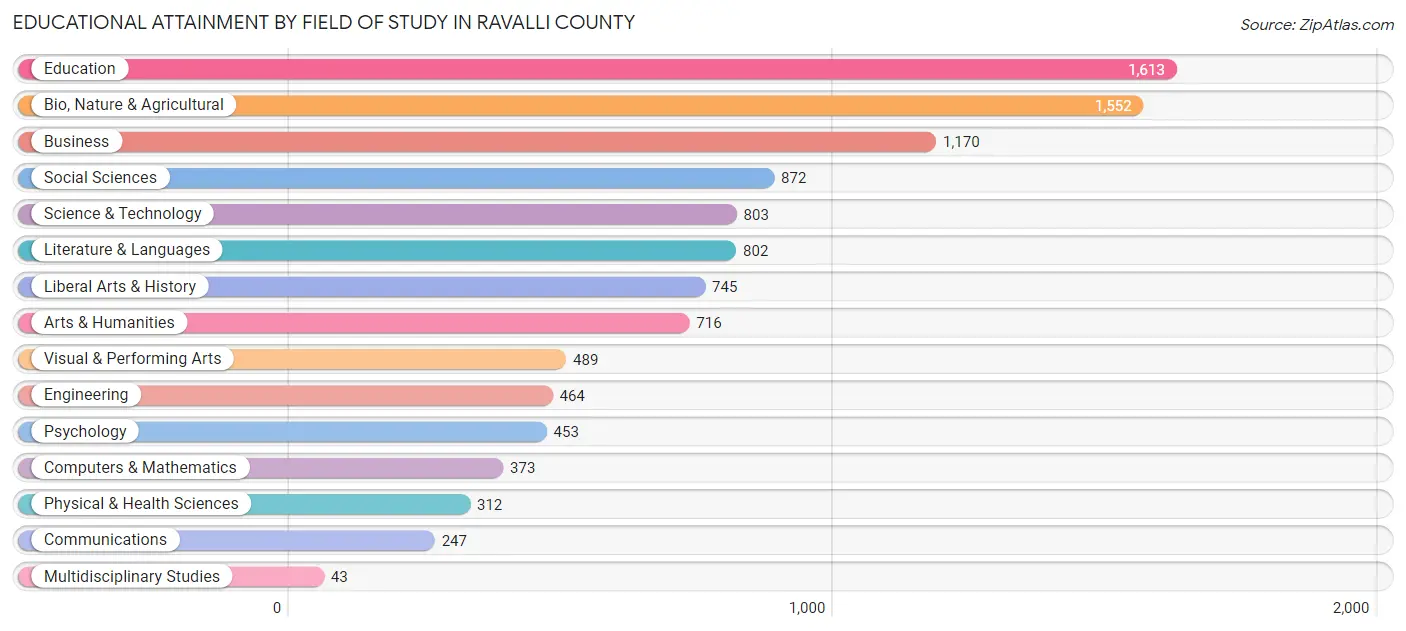
| Field of Study | # Graduates | % Graduates |
| Computers & Mathematics | 373 | 3.5% |
| Bio, Nature & Agricultural | 1,552 | 14.6% |
| Physical & Health Sciences | 312 | 2.9% |
| Psychology | 453 | 4.3% |
| Social Sciences | 872 | 8.2% |
| Engineering | 464 | 4.4% |
| Multidisciplinary Studies | 43 | 0.4% |
| Science & Technology | 803 | 7.5% |
| Business | 1,170 | 11.0% |
| Education | 1,613 | 15.1% |
| Literature & Languages | 802 | 7.5% |
| Liberal Arts & History | 745 | 7.0% |
| Visual & Performing Arts | 489 | 4.6% |
| Communications | 247 | 2.3% |
| Arts & Humanities | 716 | 6.7% |
| Total | 10,654 | 100.0% |
Transportation & Commute in Ravalli County
Vehicle Availability by Sex in Ravalli County
The most prevalent vehicle ownership categories in Ravalli County are males with 2 vehicles (3,308, accounting for 32.0%) and females with 2 vehicles (3,197, making up 36.5%).
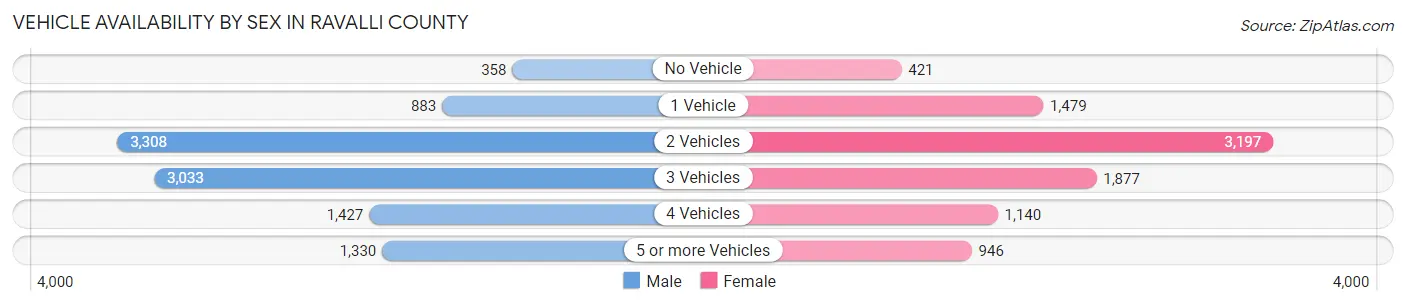
| Vehicles Available | Male | Female |
| No Vehicle | 358 (3.5%) | 421 (4.6%) |
| 1 Vehicle | 883 (8.5%) | 1,479 (16.3%) |
| 2 Vehicles | 3,308 (32.0%) | 3,197 (35.3%) |
| 3 Vehicles | 3,033 (29.3%) | 1,877 (20.7%) |
| 4 Vehicles | 1,427 (13.8%) | 1,140 (12.6%) |
| 5 or more Vehicles | 1,330 (12.9%) | 946 (10.4%) |
| Total | 10,339 (100.0%) | 9,060 (100.0%) |
Commute Time in Ravalli County
The most frequently occuring commute durations in Ravalli County are 10 to 14 minutes (3,044 commuters, 17.8%), 5 to 9 minutes (2,978 commuters, 17.4%), and 15 to 19 minutes (2,367 commuters, 13.8%).
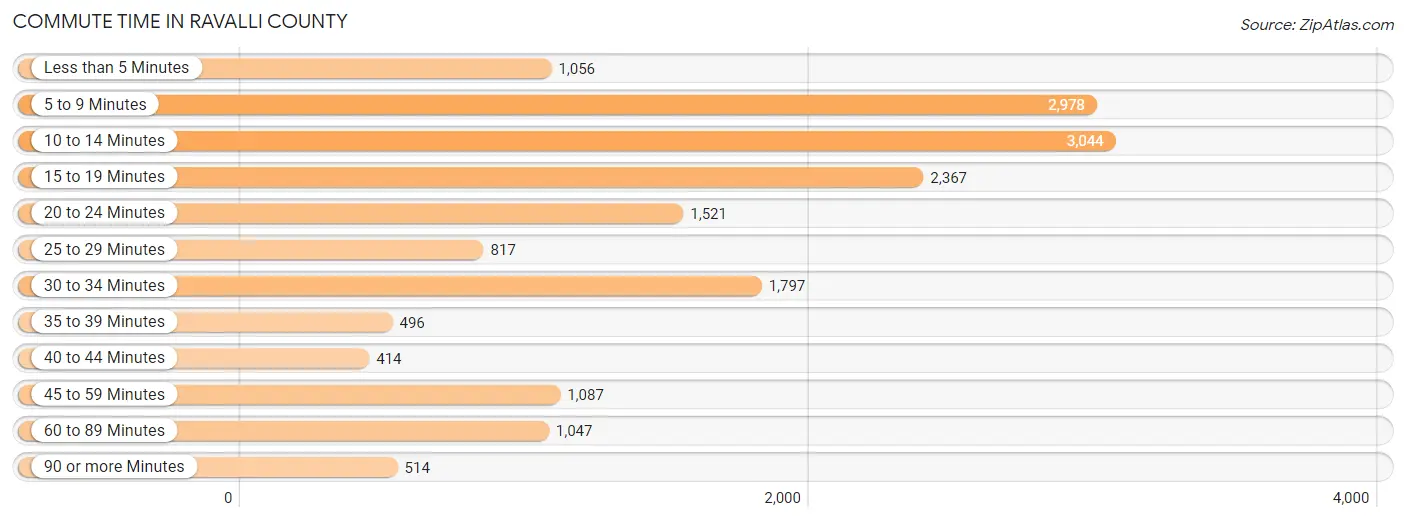
| Commute Time | # Commuters | % Commuters |
| Less than 5 Minutes | 1,056 | 6.2% |
| 5 to 9 Minutes | 2,978 | 17.4% |
| 10 to 14 Minutes | 3,044 | 17.8% |
| 15 to 19 Minutes | 2,367 | 13.8% |
| 20 to 24 Minutes | 1,521 | 8.9% |
| 25 to 29 Minutes | 817 | 4.8% |
| 30 to 34 Minutes | 1,797 | 10.5% |
| 35 to 39 Minutes | 496 | 2.9% |
| 40 to 44 Minutes | 414 | 2.4% |
| 45 to 59 Minutes | 1,087 | 6.3% |
| 60 to 89 Minutes | 1,047 | 6.1% |
| 90 or more Minutes | 514 | 3.0% |
Commute Time by Sex in Ravalli County
The most common commute times in Ravalli County are 5 to 9 minutes (1,759 commuters, 19.1%) for males and 10 to 14 minutes (1,796 commuters, 22.6%) for females.
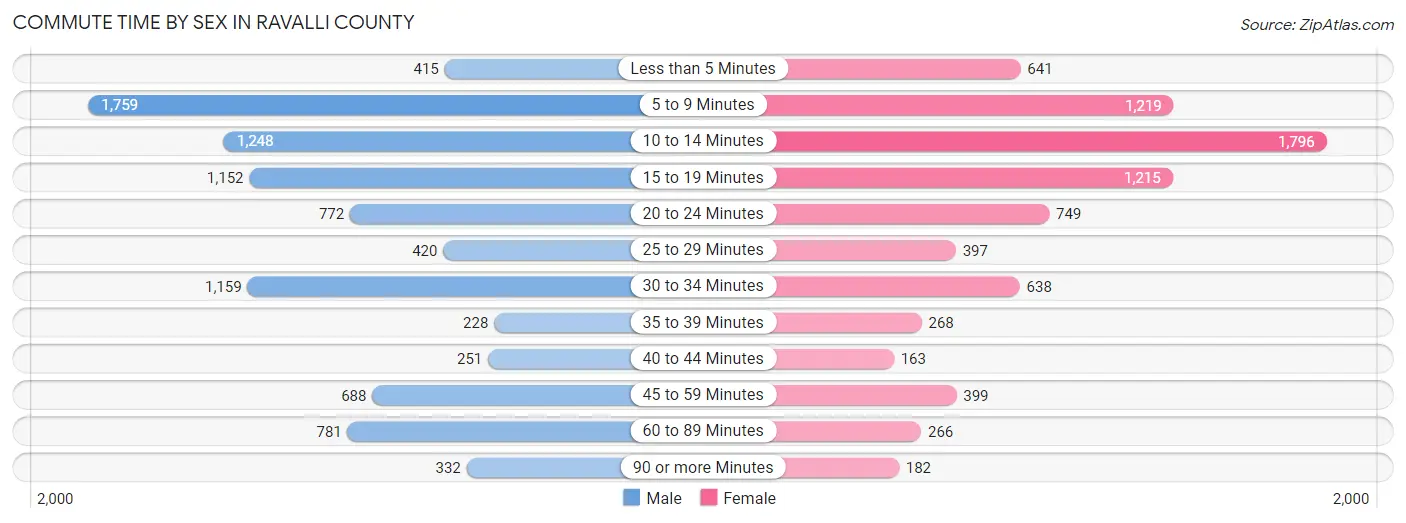
| Commute Time | Male | Female |
| Less than 5 Minutes | 415 (4.5%) | 641 (8.1%) |
| 5 to 9 Minutes | 1,759 (19.1%) | 1,219 (15.4%) |
| 10 to 14 Minutes | 1,248 (13.6%) | 1,796 (22.6%) |
| 15 to 19 Minutes | 1,152 (12.5%) | 1,215 (15.3%) |
| 20 to 24 Minutes | 772 (8.4%) | 749 (9.4%) |
| 25 to 29 Minutes | 420 (4.6%) | 397 (5.0%) |
| 30 to 34 Minutes | 1,159 (12.6%) | 638 (8.0%) |
| 35 to 39 Minutes | 228 (2.5%) | 268 (3.4%) |
| 40 to 44 Minutes | 251 (2.7%) | 163 (2.1%) |
| 45 to 59 Minutes | 688 (7.5%) | 399 (5.0%) |
| 60 to 89 Minutes | 781 (8.5%) | 266 (3.4%) |
| 90 or more Minutes | 332 (3.6%) | 182 (2.3%) |
Time of Departure to Work by Sex in Ravalli County
The most frequent times of departure to work in Ravalli County are 7:30 AM to 7:59 AM (1,853, 20.1%) for males and 7:30 AM to 7:59 AM (1,794, 22.6%) for females.
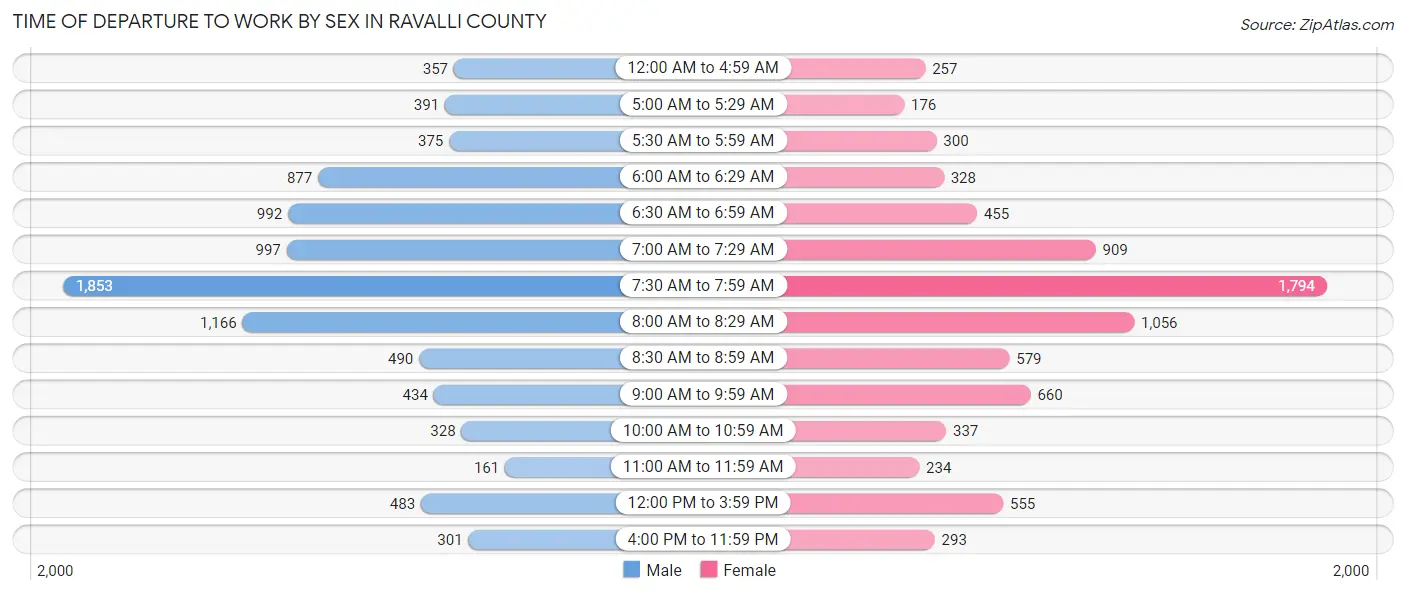
| Time of Departure | Male | Female |
| 12:00 AM to 4:59 AM | 357 (3.9%) | 257 (3.2%) |
| 5:00 AM to 5:29 AM | 391 (4.3%) | 176 (2.2%) |
| 5:30 AM to 5:59 AM | 375 (4.1%) | 300 (3.8%) |
| 6:00 AM to 6:29 AM | 877 (9.5%) | 328 (4.1%) |
| 6:30 AM to 6:59 AM | 992 (10.8%) | 455 (5.7%) |
| 7:00 AM to 7:29 AM | 997 (10.8%) | 909 (11.5%) |
| 7:30 AM to 7:59 AM | 1,853 (20.1%) | 1,794 (22.6%) |
| 8:00 AM to 8:29 AM | 1,166 (12.7%) | 1,056 (13.3%) |
| 8:30 AM to 8:59 AM | 490 (5.3%) | 579 (7.3%) |
| 9:00 AM to 9:59 AM | 434 (4.7%) | 660 (8.3%) |
| 10:00 AM to 10:59 AM | 328 (3.6%) | 337 (4.3%) |
| 11:00 AM to 11:59 AM | 161 (1.8%) | 234 (2.9%) |
| 12:00 PM to 3:59 PM | 483 (5.2%) | 555 (7.0%) |
| 4:00 PM to 11:59 PM | 301 (3.3%) | 293 (3.7%) |
| Total | 9,205 (100.0%) | 7,933 (100.0%) |
Housing Occupancy in Ravalli County
Occupancy by Ownership in Ravalli County
Of the total 18,847 dwellings in Ravalli County, owner-occupied units account for 14,591 (77.4%), while renter-occupied units make up 4,256 (22.6%).
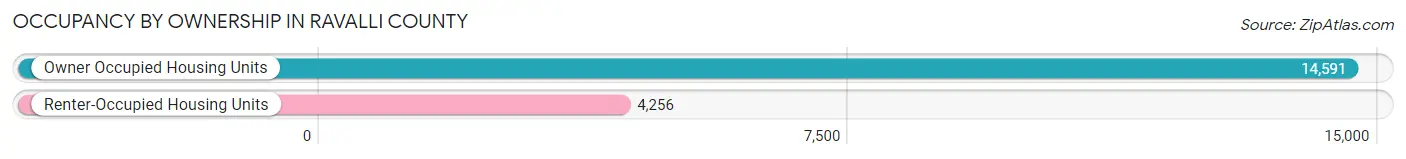
| Occupancy | # Housing Units | % Housing Units |
| Owner Occupied Housing Units | 14,591 | 77.4% |
| Renter-Occupied Housing Units | 4,256 | 22.6% |
| Total Occupied Housing Units | 18,847 | 100.0% |
Occupancy by Household Size in Ravalli County
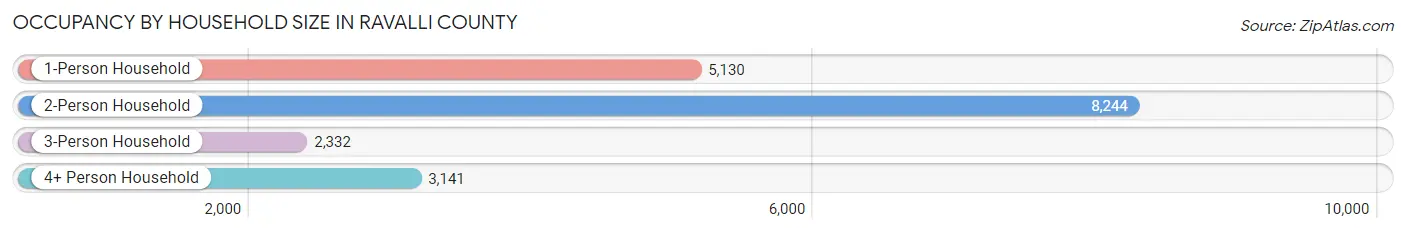
| Household Size | # Housing Units | % Housing Units |
| 1-Person Household | 5,130 | 27.2% |
| 2-Person Household | 8,244 | 43.7% |
| 3-Person Household | 2,332 | 12.4% |
| 4+ Person Household | 3,141 | 16.7% |
| Total Housing Units | 18,847 | 100.0% |
Occupancy by Ownership by Household Size in Ravalli County
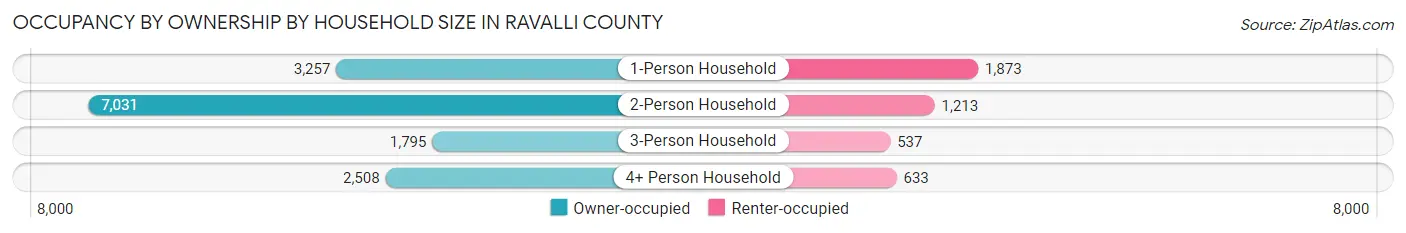
| Household Size | Owner-occupied | Renter-occupied |
| 1-Person Household | 3,257 (63.5%) | 1,873 (36.5%) |
| 2-Person Household | 7,031 (85.3%) | 1,213 (14.7%) |
| 3-Person Household | 1,795 (77.0%) | 537 (23.0%) |
| 4+ Person Household | 2,508 (79.8%) | 633 (20.2%) |
| Total Housing Units | 14,591 (77.4%) | 4,256 (22.6%) |
Occupancy by Educational Attainment in Ravalli County
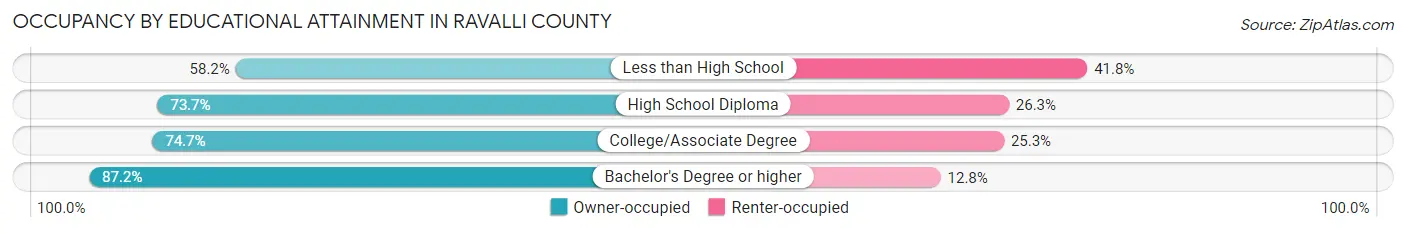
| Household Size | Owner-occupied | Renter-occupied |
| Less than High School | 499 (58.2%) | 359 (41.8%) |
| High School Diploma | 4,076 (73.7%) | 1,455 (26.3%) |
| College/Associate Degree | 5,056 (74.7%) | 1,715 (25.3%) |
| Bachelor's Degree or higher | 4,960 (87.2%) | 727 (12.8%) |
Occupancy by Age of Householder in Ravalli County
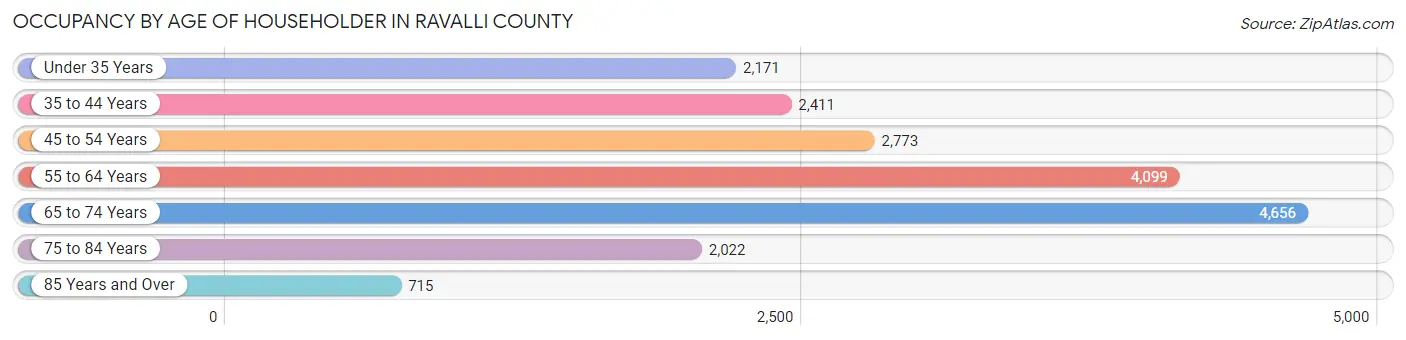
| Age Bracket | # Households | % Households |
| Under 35 Years | 2,171 | 11.5% |
| 35 to 44 Years | 2,411 | 12.8% |
| 45 to 54 Years | 2,773 | 14.7% |
| 55 to 64 Years | 4,099 | 21.7% |
| 65 to 74 Years | 4,656 | 24.7% |
| 75 to 84 Years | 2,022 | 10.7% |
| 85 Years and Over | 715 | 3.8% |
| Total | 18,847 | 100.0% |
Housing Finances in Ravalli County
Median Income by Occupancy in Ravalli County
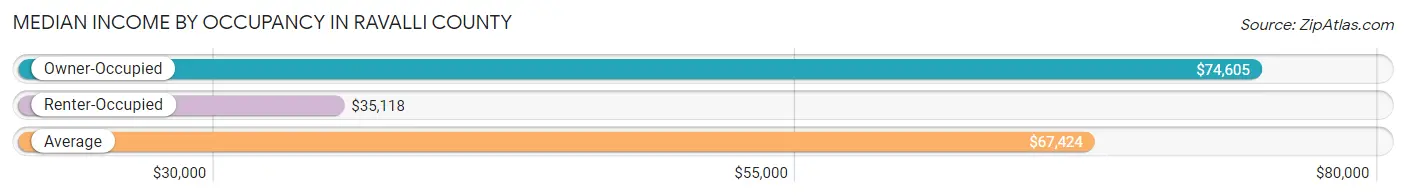
| Occupancy Type | # Households | Median Income |
| Owner-Occupied | 14,591 (77.4%) | $74,605 |
| Renter-Occupied | 4,256 (22.6%) | $35,118 |
| Average | 18,847 (100.0%) | $67,424 |
Occupancy by Householder Income Bracket in Ravalli County
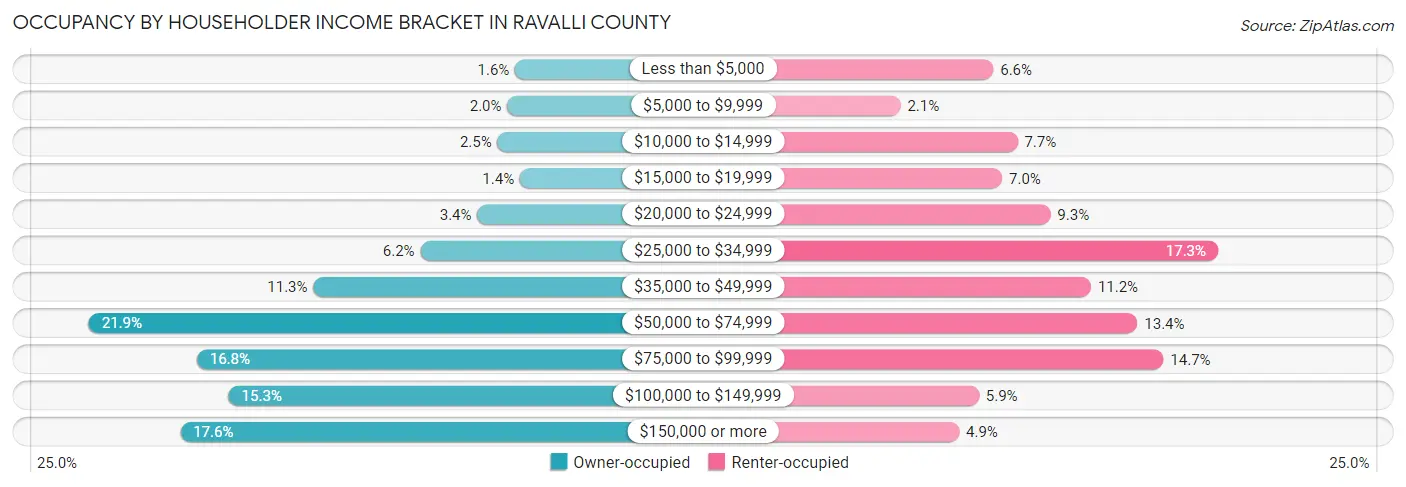
| Income Bracket | Owner-occupied | Renter-occupied |
| Less than $5,000 | 240 (1.6%) | 279 (6.6%) |
| $5,000 to $9,999 | 294 (2.0%) | 91 (2.1%) |
| $10,000 to $14,999 | 362 (2.5%) | 328 (7.7%) |
| $15,000 to $19,999 | 206 (1.4%) | 297 (7.0%) |
| $20,000 to $24,999 | 502 (3.4%) | 395 (9.3%) |
| $25,000 to $34,999 | 897 (6.1%) | 734 (17.2%) |
| $35,000 to $49,999 | 1,641 (11.3%) | 477 (11.2%) |
| $50,000 to $74,999 | 3,201 (21.9%) | 571 (13.4%) |
| $75,000 to $99,999 | 2,452 (16.8%) | 624 (14.7%) |
| $100,000 to $149,999 | 2,229 (15.3%) | 250 (5.9%) |
| $150,000 or more | 2,567 (17.6%) | 210 (4.9%) |
| Total | 14,591 (100.0%) | 4,256 (100.0%) |
Monthly Housing Cost Tiers in Ravalli County
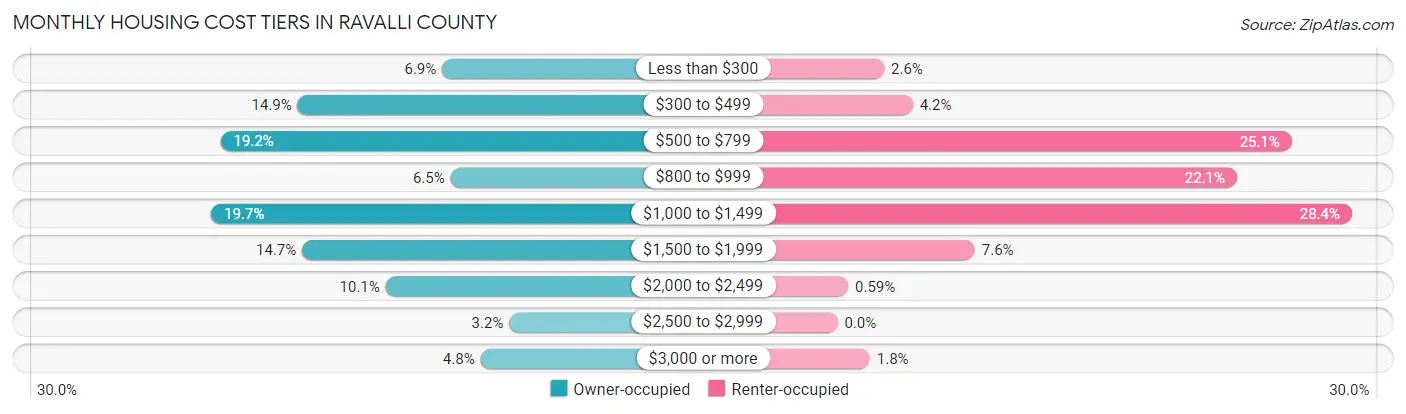
| Monthly Cost | Owner-occupied | Renter-occupied |
| Less than $300 | 1,013 (6.9%) | 110 (2.6%) |
| $300 to $499 | 2,177 (14.9%) | 177 (4.2%) |
| $500 to $799 | 2,799 (19.2%) | 1,068 (25.1%) |
| $800 to $999 | 944 (6.5%) | 939 (22.1%) |
| $1,000 to $1,499 | 2,875 (19.7%) | 1,209 (28.4%) |
| $1,500 to $1,999 | 2,141 (14.7%) | 323 (7.6%) |
| $2,000 to $2,499 | 1,468 (10.1%) | 25 (0.6%) |
| $2,500 to $2,999 | 471 (3.2%) | 0 (0.0%) |
| $3,000 or more | 703 (4.8%) | 76 (1.8%) |
| Total | 14,591 (100.0%) | 4,256 (100.0%) |
Physical Housing Characteristics in Ravalli County
Housing Structures in Ravalli County
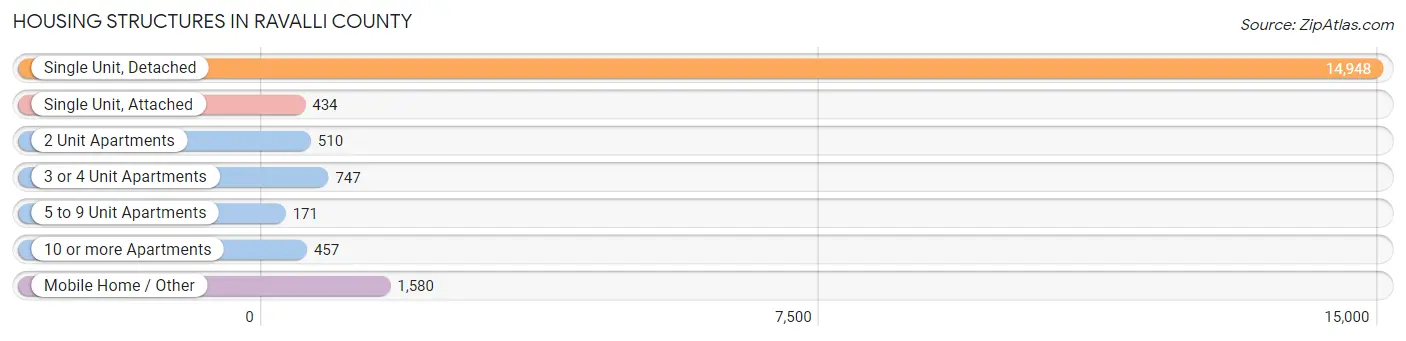
| Structure Type | # Housing Units | % Housing Units |
| Single Unit, Detached | 14,948 | 79.3% |
| Single Unit, Attached | 434 | 2.3% |
| 2 Unit Apartments | 510 | 2.7% |
| 3 or 4 Unit Apartments | 747 | 4.0% |
| 5 to 9 Unit Apartments | 171 | 0.9% |
| 10 or more Apartments | 457 | 2.4% |
| Mobile Home / Other | 1,580 | 8.4% |
| Total | 18,847 | 100.0% |
Housing Structures by Occupancy in Ravalli County
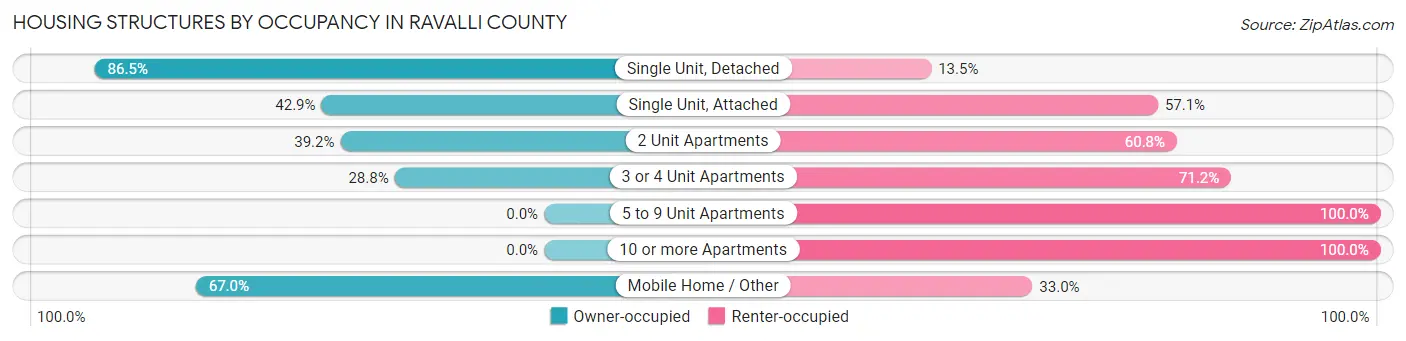
| Structure Type | Owner-occupied | Renter-occupied |
| Single Unit, Detached | 12,931 (86.5%) | 2,017 (13.5%) |
| Single Unit, Attached | 186 (42.9%) | 248 (57.1%) |
| 2 Unit Apartments | 200 (39.2%) | 310 (60.8%) |
| 3 or 4 Unit Apartments | 215 (28.8%) | 532 (71.2%) |
| 5 to 9 Unit Apartments | 0 (0.0%) | 171 (100.0%) |
| 10 or more Apartments | 0 (0.0%) | 457 (100.0%) |
| Mobile Home / Other | 1,059 (67.0%) | 521 (33.0%) |
| Total | 14,591 (77.4%) | 4,256 (22.6%) |
Housing Structures by Number of Rooms in Ravalli County
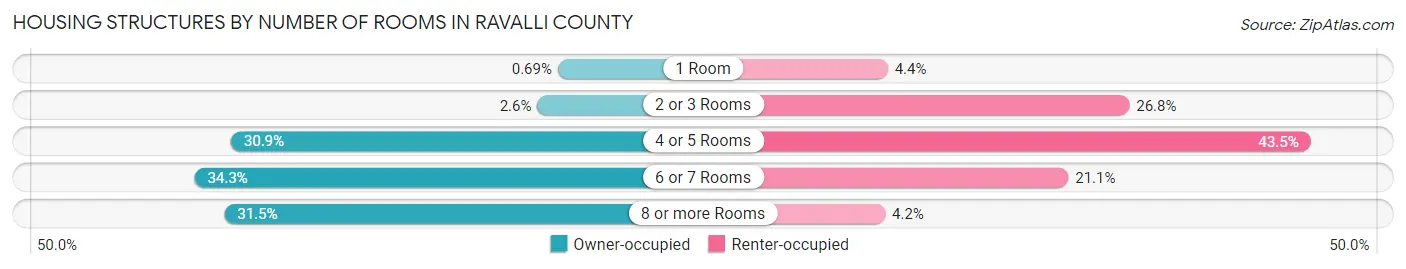
| Number of Rooms | Owner-occupied | Renter-occupied |
| 1 Room | 100 (0.7%) | 188 (4.4%) |
| 2 or 3 Rooms | 376 (2.6%) | 1,139 (26.8%) |
| 4 or 5 Rooms | 4,512 (30.9%) | 1,852 (43.5%) |
| 6 or 7 Rooms | 5,003 (34.3%) | 899 (21.1%) |
| 8 or more Rooms | 4,600 (31.5%) | 178 (4.2%) |
| Total | 14,591 (100.0%) | 4,256 (100.0%) |
Housing Structure by Heating Type in Ravalli County
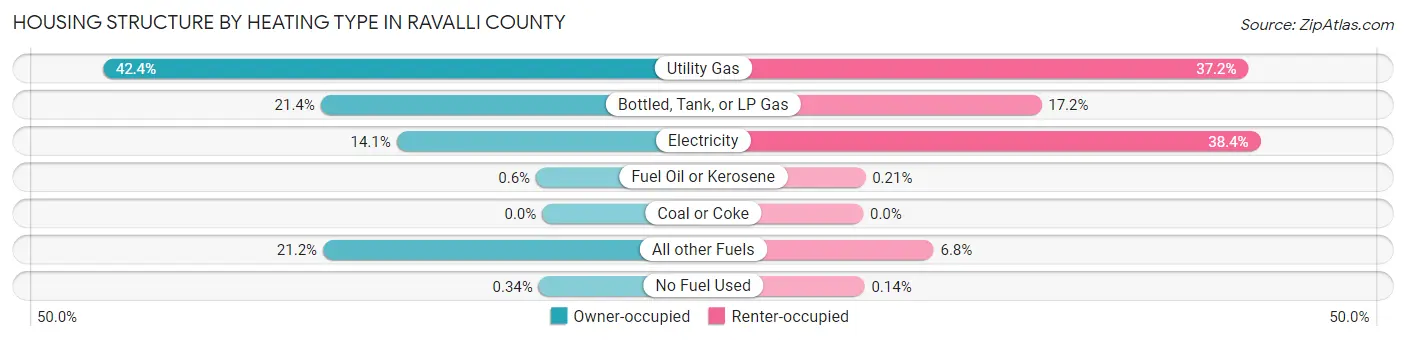
| Heating Type | Owner-occupied | Renter-occupied |
| Utility Gas | 6,192 (42.4%) | 1,584 (37.2%) |
| Bottled, Tank, or LP Gas | 3,122 (21.4%) | 733 (17.2%) |
| Electricity | 2,051 (14.1%) | 1,634 (38.4%) |
| Fuel Oil or Kerosene | 87 (0.6%) | 9 (0.2%) |
| Coal or Coke | 0 (0.0%) | 0 (0.0%) |
| All other Fuels | 3,090 (21.2%) | 290 (6.8%) |
| No Fuel Used | 49 (0.3%) | 6 (0.1%) |
| Total | 14,591 (100.0%) | 4,256 (100.0%) |
Household Vehicle Usage in Ravalli County
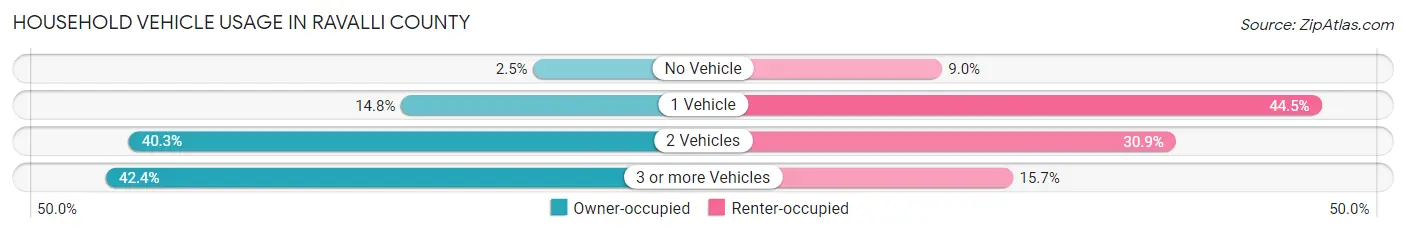
| Vehicles per Household | Owner-occupied | Renter-occupied |
| No Vehicle | 365 (2.5%) | 383 (9.0%) |
| 1 Vehicle | 2,165 (14.8%) | 1,893 (44.5%) |
| 2 Vehicles | 5,876 (40.3%) | 1,314 (30.9%) |
| 3 or more Vehicles | 6,185 (42.4%) | 666 (15.7%) |
| Total | 14,591 (100.0%) | 4,256 (100.0%) |
Real Estate & Mortgages in Ravalli County
Real Estate and Mortgage Overview in Ravalli County
| Characteristic | Without Mortgage | With Mortgage |
| Housing Units | 6,308 | 8,283 |
| Median Property Value | $378,300 | $378,500 |
| Median Household Income | $63,827 | $1,807 |
| Monthly Housing Costs | $501 | $694 |
| Real Estate Taxes | $1,952 | $210 |
Property Value by Mortgage Status in Ravalli County
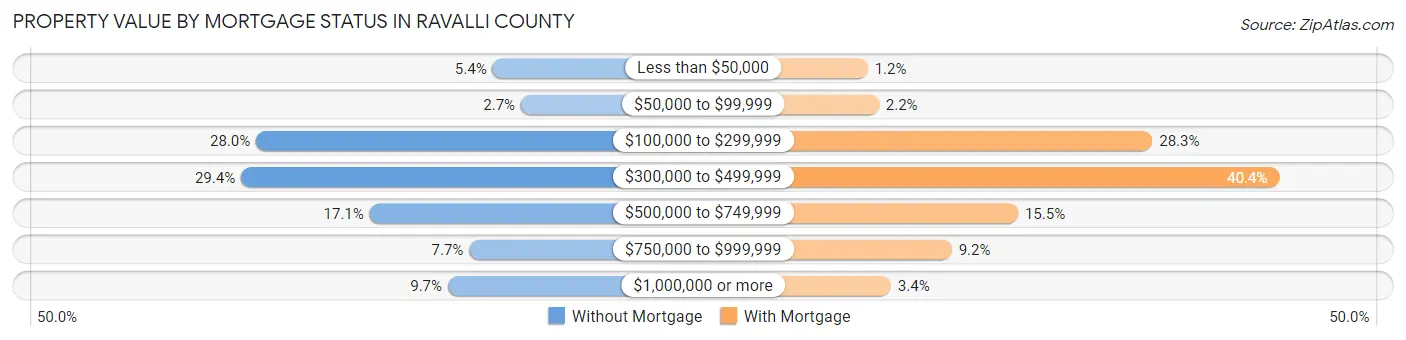
| Property Value | Without Mortgage | With Mortgage |
| Less than $50,000 | 343 (5.4%) | 96 (1.2%) |
| $50,000 to $99,999 | 172 (2.7%) | 184 (2.2%) |
| $100,000 to $299,999 | 1,764 (28.0%) | 2,341 (28.3%) |
| $300,000 to $499,999 | 1,854 (29.4%) | 3,343 (40.4%) |
| $500,000 to $749,999 | 1,081 (17.1%) | 1,281 (15.5%) |
| $750,000 to $999,999 | 483 (7.7%) | 759 (9.2%) |
| $1,000,000 or more | 611 (9.7%) | 279 (3.4%) |
| Total | 6,308 (100.0%) | 8,283 (100.0%) |
Household Income by Mortgage Status in Ravalli County
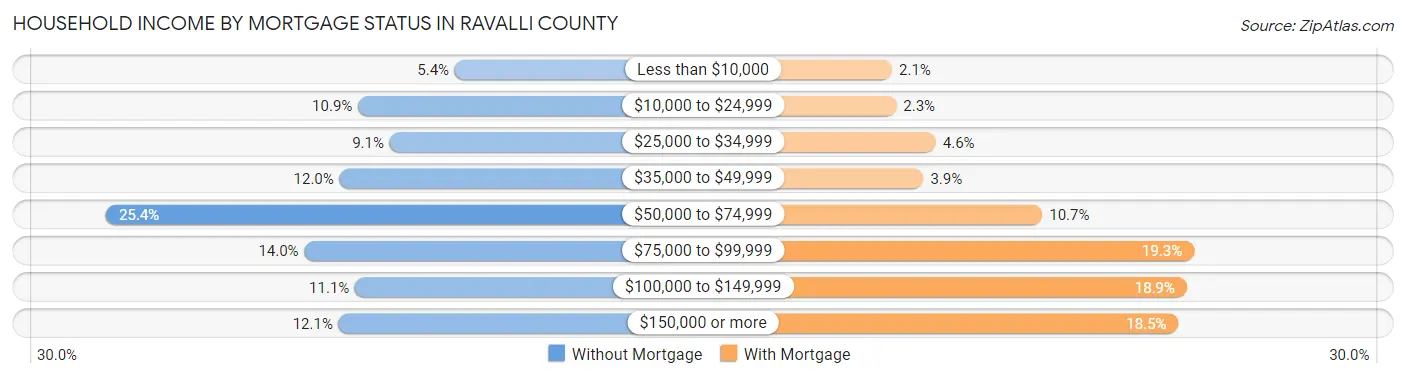
| Household Income | Without Mortgage | With Mortgage |
| Less than $10,000 | 341 (5.4%) | 173 (2.1%) |
| $10,000 to $24,999 | 690 (10.9%) | 193 (2.3%) |
| $25,000 to $34,999 | 576 (9.1%) | 380 (4.6%) |
| $35,000 to $49,999 | 757 (12.0%) | 321 (3.9%) |
| $50,000 to $74,999 | 1,599 (25.4%) | 884 (10.7%) |
| $75,000 to $99,999 | 884 (14.0%) | 1,602 (19.3%) |
| $100,000 to $149,999 | 701 (11.1%) | 1,568 (18.9%) |
| $150,000 or more | 760 (12.0%) | 1,528 (18.4%) |
| Total | 6,308 (100.0%) | 8,283 (100.0%) |
Property Value to Household Income Ratio in Ravalli County
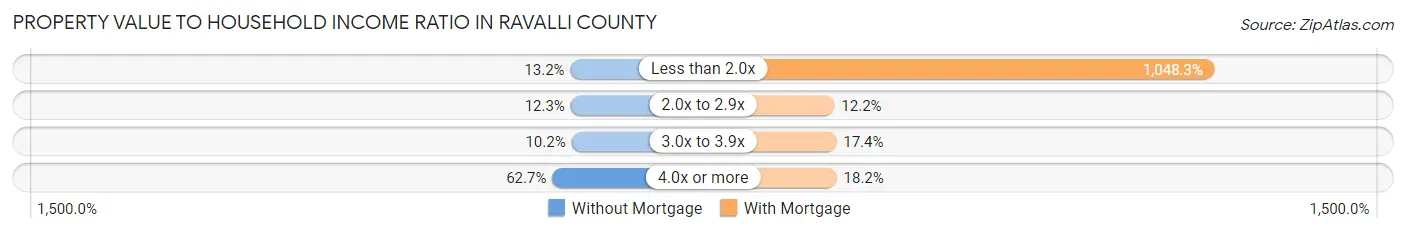
| Value-to-Income Ratio | Without Mortgage | With Mortgage |
| Less than 2.0x | 832 (13.2%) | 86,830 (1,048.3%) |
| 2.0x to 2.9x | 778 (12.3%) | 1,010 (12.2%) |
| 3.0x to 3.9x | 644 (10.2%) | 1,443 (17.4%) |
| 4.0x or more | 3,952 (62.6%) | 1,506 (18.2%) |
| Total | 6,308 (100.0%) | 8,283 (100.0%) |
Real Estate Taxes by Mortgage Status in Ravalli County
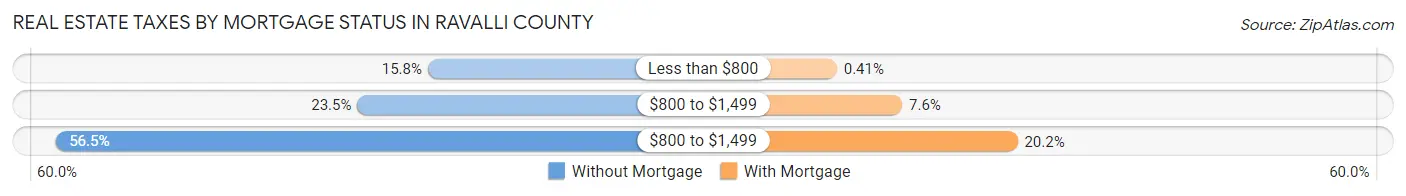
| Property Taxes | Without Mortgage | With Mortgage |
| Less than $800 | 997 (15.8%) | 34 (0.4%) |
| $800 to $1,499 | 1,485 (23.5%) | 627 (7.6%) |
| $800 to $1,499 | 3,566 (56.5%) | 1,674 (20.2%) |
| Total | 6,308 (100.0%) | 8,283 (100.0%) |
Health & Disability in Ravalli County
Health Insurance Coverage by Age in Ravalli County
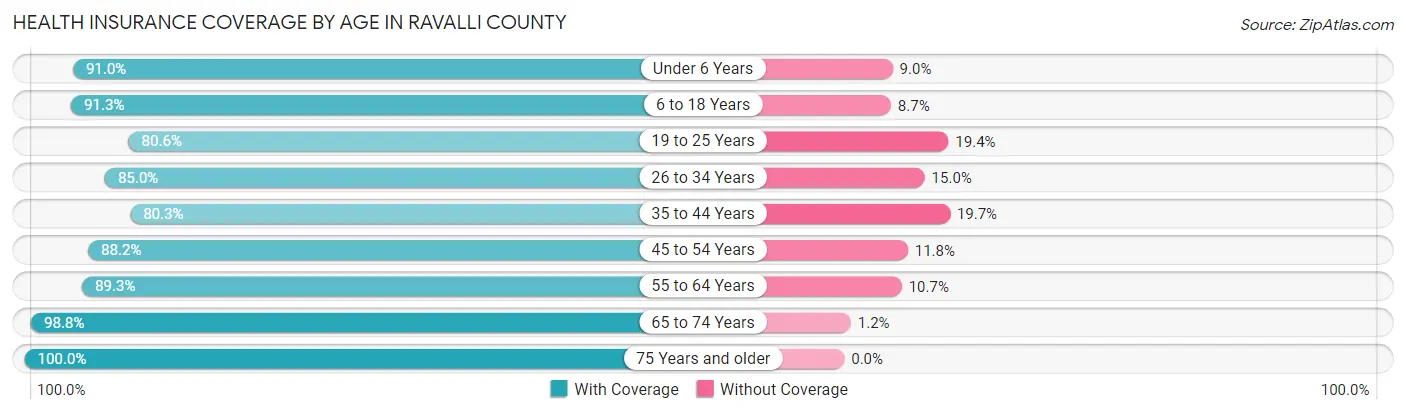
| Age Bracket | With Coverage | Without Coverage |
| Under 6 Years | 2,209 (91.0%) | 219 (9.0%) |
| 6 to 18 Years | 5,894 (91.3%) | 561 (8.7%) |
| 19 to 25 Years | 2,063 (80.6%) | 497 (19.4%) |
| 26 to 34 Years | 3,375 (85.0%) | 595 (15.0%) |
| 35 to 44 Years | 4,068 (80.3%) | 998 (19.7%) |
| 45 to 54 Years | 4,536 (88.2%) | 609 (11.8%) |
| 55 to 64 Years | 6,659 (89.3%) | 799 (10.7%) |
| 65 to 74 Years | 7,205 (98.8%) | 89 (1.2%) |
| 75 Years and older | 4,271 (100.0%) | 0 (0.0%) |
| Total | 40,280 (90.2%) | 4,367 (9.8%) |
Health Insurance Coverage by Citizenship Status in Ravalli County
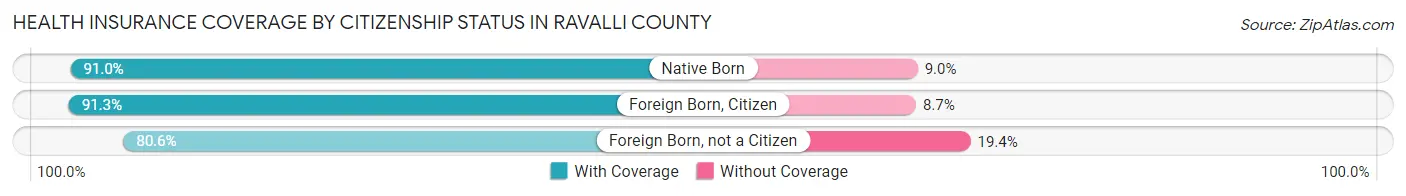
| Citizenship Status | With Coverage | Without Coverage |
| Native Born | 2,209 (91.0%) | 219 (9.0%) |
| Foreign Born, Citizen | 5,894 (91.3%) | 561 (8.7%) |
| Foreign Born, not a Citizen | 2,063 (80.6%) | 497 (19.4%) |
Health Insurance Coverage by Household Income in Ravalli County
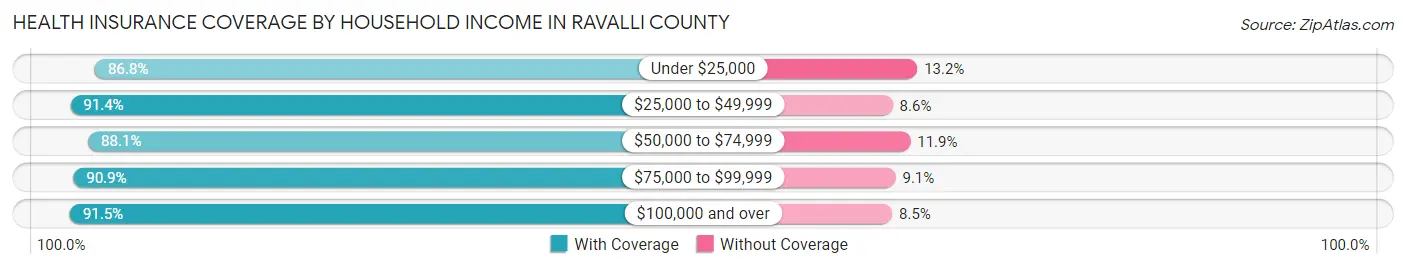
| Household Income | With Coverage | Without Coverage |
| Under $25,000 | 3,844 (86.8%) | 584 (13.2%) |
| $25,000 to $49,999 | 6,419 (91.4%) | 603 (8.6%) |
| $50,000 to $74,999 | 8,176 (88.1%) | 1,104 (11.9%) |
| $75,000 to $99,999 | 7,393 (90.9%) | 743 (9.1%) |
| $100,000 and over | 14,284 (91.5%) | 1,325 (8.5%) |
Public vs Private Health Insurance Coverage by Age in Ravalli County
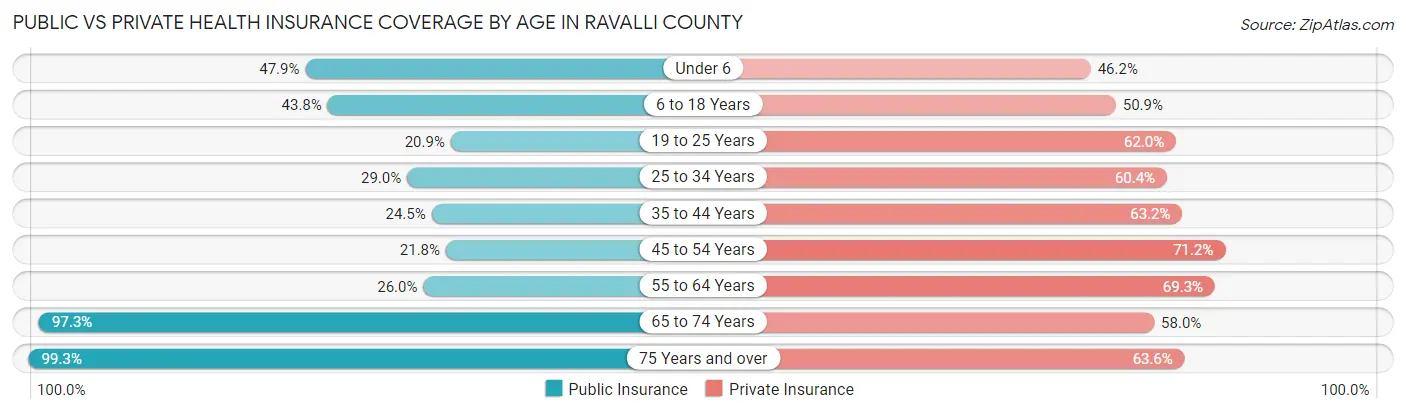
| Age Bracket | Public Insurance | Private Insurance |
| Under 6 | 1,163 (47.9%) | 1,122 (46.2%) |
| 6 to 18 Years | 2,825 (43.8%) | 3,283 (50.9%) |
| 19 to 25 Years | 535 (20.9%) | 1,588 (62.0%) |
| 25 to 34 Years | 1,152 (29.0%) | 2,396 (60.4%) |
| 35 to 44 Years | 1,239 (24.5%) | 3,202 (63.2%) |
| 45 to 54 Years | 1,122 (21.8%) | 3,661 (71.2%) |
| 55 to 64 Years | 1,938 (26.0%) | 5,165 (69.3%) |
| 65 to 74 Years | 7,100 (97.3%) | 4,229 (58.0%) |
| 75 Years and over | 4,240 (99.3%) | 2,718 (63.6%) |
| Total | 21,314 (47.7%) | 27,364 (61.3%) |
Disability Status by Sex by Age in Ravalli County
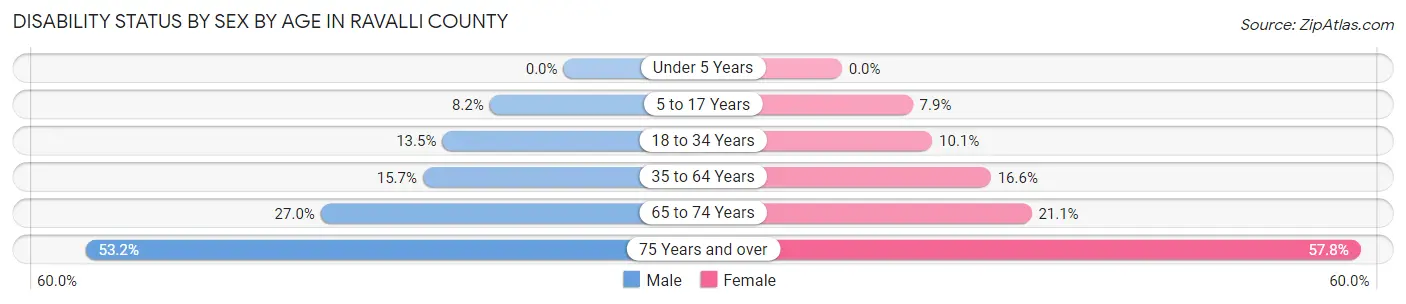
| Age Bracket | Male | Female |
| Under 5 Years | 0 (0.0%) | 0 (0.0%) |
| 5 to 17 Years | 279 (8.2%) | 239 (7.9%) |
| 18 to 34 Years | 490 (13.5%) | 339 (10.1%) |
| 35 to 64 Years | 1,365 (15.7%) | 1,484 (16.6%) |
| 65 to 74 Years | 973 (27.0%) | 780 (21.1%) |
| 75 Years and over | 1,120 (53.2%) | 1,251 (57.8%) |
Disability Class by Sex by Age in Ravalli County
Disability Class: Hearing Difficulty
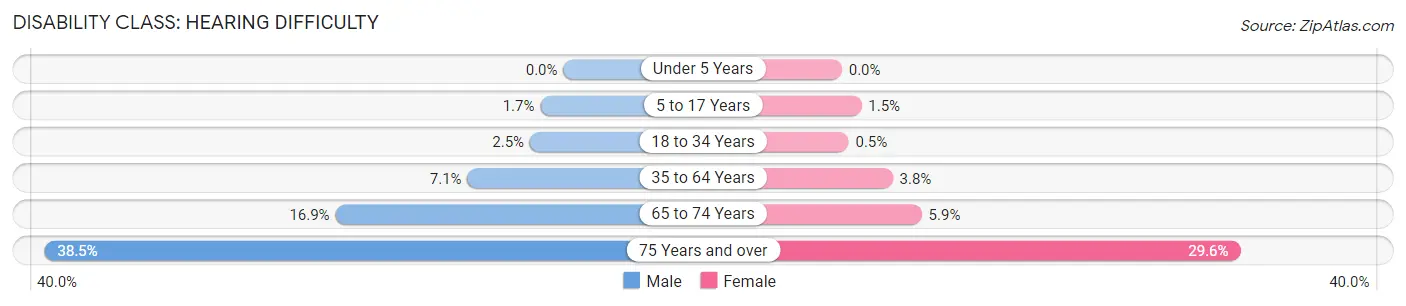
| Age Bracket | Male | Female |
| Under 5 Years | 0 (0.0%) | 0 (0.0%) |
| 5 to 17 Years | 58 (1.7%) | 44 (1.5%) |
| 18 to 34 Years | 90 (2.5%) | 17 (0.5%) |
| 35 to 64 Years | 621 (7.1%) | 337 (3.8%) |
| 65 to 74 Years | 609 (16.9%) | 219 (5.9%) |
| 75 Years and over | 811 (38.5%) | 641 (29.6%) |
Disability Class: Vision Difficulty
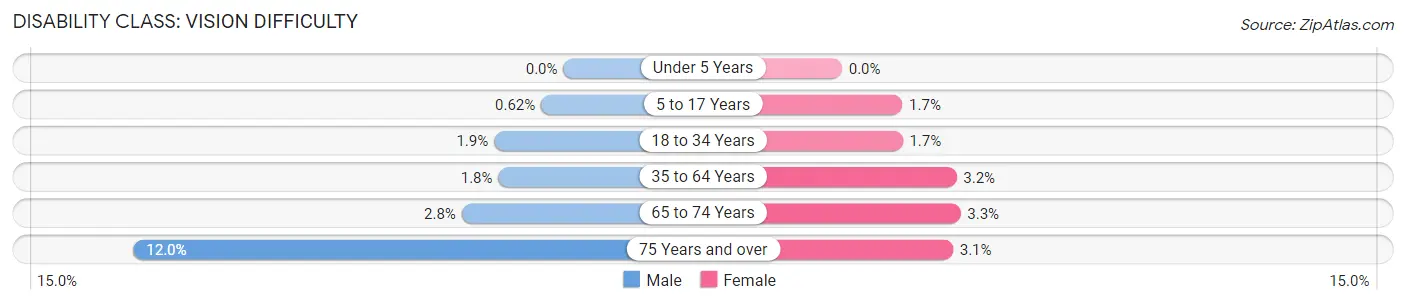
| Age Bracket | Male | Female |
| Under 5 Years | 0 (0.0%) | 0 (0.0%) |
| 5 to 17 Years | 21 (0.6%) | 51 (1.7%) |
| 18 to 34 Years | 70 (1.9%) | 57 (1.7%) |
| 35 to 64 Years | 158 (1.8%) | 285 (3.2%) |
| 65 to 74 Years | 102 (2.8%) | 122 (3.3%) |
| 75 Years and over | 252 (12.0%) | 67 (3.1%) |
Disability Class: Cognitive Difficulty
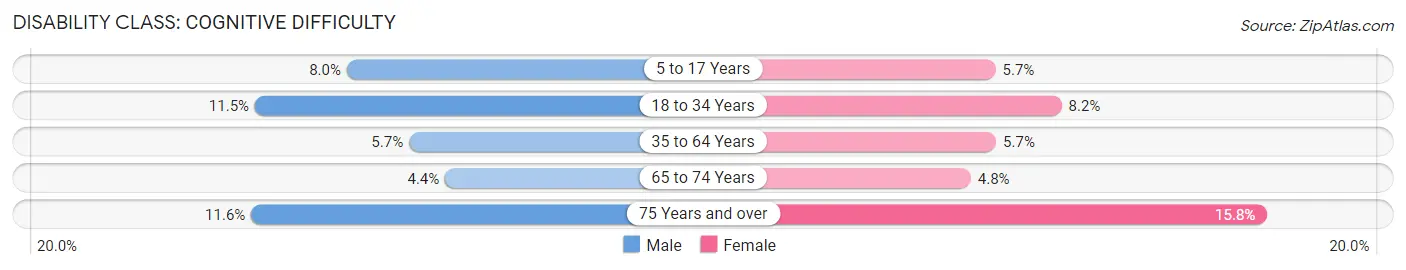
| Age Bracket | Male | Female |
| 5 to 17 Years | 273 (8.0%) | 173 (5.7%) |
| 18 to 34 Years | 416 (11.5%) | 275 (8.2%) |
| 35 to 64 Years | 500 (5.7%) | 513 (5.7%) |
| 65 to 74 Years | 158 (4.4%) | 177 (4.8%) |
| 75 Years and over | 244 (11.6%) | 342 (15.8%) |
Disability Class: Ambulatory Difficulty
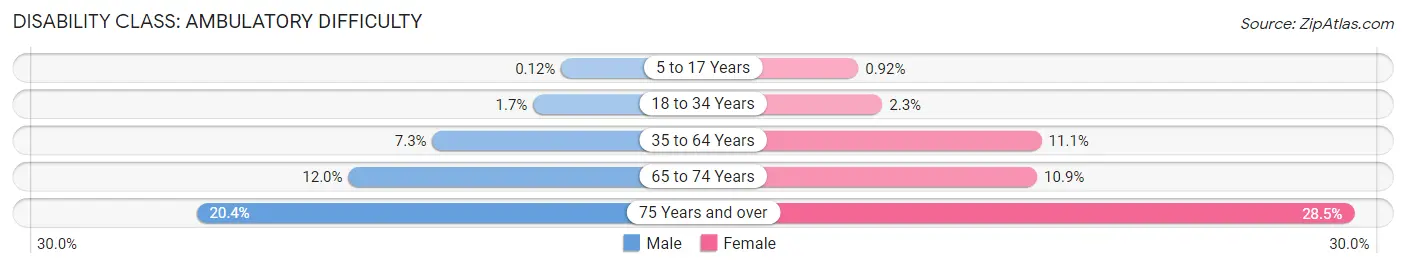
| Age Bracket | Male | Female |
| 5 to 17 Years | 4 (0.1%) | 28 (0.9%) |
| 18 to 34 Years | 61 (1.7%) | 76 (2.3%) |
| 35 to 64 Years | 636 (7.3%) | 996 (11.1%) |
| 65 to 74 Years | 431 (12.0%) | 402 (10.9%) |
| 75 Years and over | 430 (20.4%) | 618 (28.5%) |
Disability Class: Self-Care Difficulty
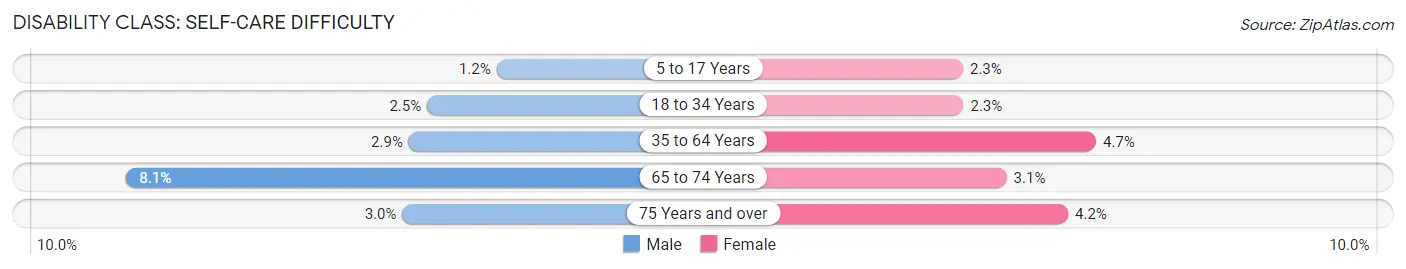
| Age Bracket | Male | Female |
| 5 to 17 Years | 42 (1.2%) | 68 (2.2%) |
| 18 to 34 Years | 92 (2.5%) | 76 (2.3%) |
| 35 to 64 Years | 250 (2.9%) | 422 (4.7%) |
| 65 to 74 Years | 292 (8.1%) | 113 (3.1%) |
| 75 Years and over | 63 (3.0%) | 91 (4.2%) |
Technology Access in Ravalli County
Computing Device Access in Ravalli County
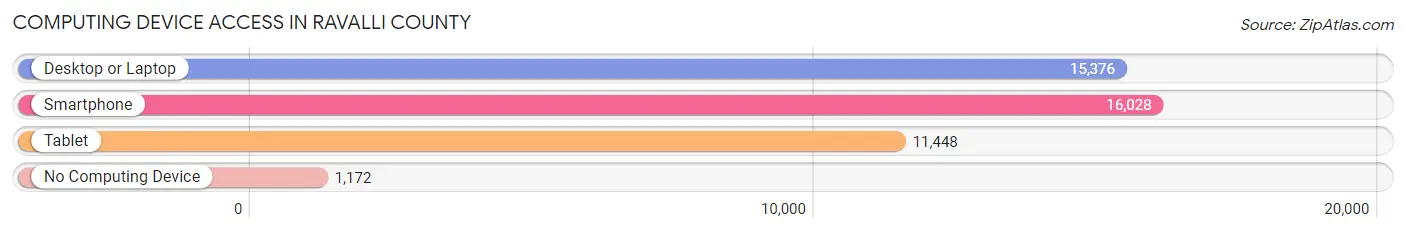
| Device Type | # Households | % Households |
| Desktop or Laptop | 15,376 | 81.6% |
| Smartphone | 16,028 | 85.0% |
| Tablet | 11,448 | 60.7% |
| No Computing Device | 1,172 | 6.2% |
| Total | 18,847 | 100.0% |
Internet Access in Ravalli County
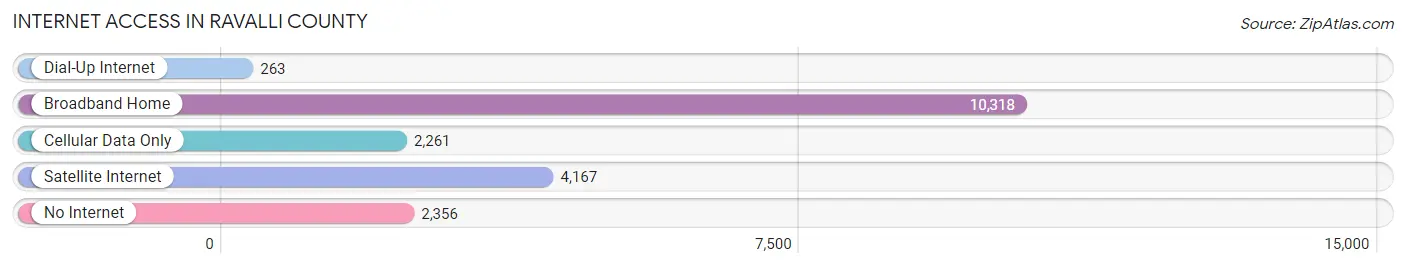
| Internet Type | # Households | % Households |
| Dial-Up Internet | 263 | 1.4% |
| Broadband Home | 10,318 | 54.7% |
| Cellular Data Only | 2,261 | 12.0% |
| Satellite Internet | 4,167 | 22.1% |
| No Internet | 2,356 | 12.5% |
| Total | 18,847 | 100.0% |
Ravalli County Summary
Ravalli County is located in the southwestern corner of Montana, and is bordered by Idaho to the west, Missoula County to the north, Granite County to the east, and Bitterroot National Forest to the south. The county seat is Hamilton, and the largest city is Stevensville. The county was established in 1893 and named after Father Anthony Ravalli, an Italian Jesuit missionary who worked in the area in the 1840s.
Geography
Ravalli County covers an area of 2,636 square miles, making it the fourth largest county in Montana. The county is located in the Bitterroot Valley, which is part of the Rocky Mountain Front. The Bitterroot Mountains form the western border of the county, while the Sapphire Mountains form the eastern border. The Bitterroot River runs through the county, and is a major tributary of the Clark Fork River. The county is home to several lakes, including Flathead Lake, which is the largest natural freshwater lake in the western United States.
The county has a variety of terrain, ranging from the rugged mountains of the Bitterroot Range to the rolling hills of the Bitterroot Valley. The climate is generally mild, with cold winters and warm summers. The average annual precipitation is about 16 inches, and the average annual snowfall is about 40 inches.
Economy
Ravalli County has a diverse economy, with a mix of agriculture, manufacturing, tourism, and government services. Agriculture is the largest sector of the economy, with cattle, hay, and wheat being the main crops. Manufacturing is also important, with the county being home to several wood products companies. Tourism is also a major industry, with the county being home to several ski resorts, as well as numerous outdoor recreation opportunities. The county is also home to several government agencies, including the Bitterroot National Forest and the Bitterroot Valley National Wildlife Refuge.
Demographics
As of the 2010 census, Ravalli County had a population of 40,212. The population is predominantly white (94.3%), with small percentages of Native American (2.2%), Hispanic (1.7%), and Asian (0.7%) populations. The median household income is $45,837, and the median home value is $212,400. The unemployment rate is 4.2%, and the poverty rate is 11.3%.
Conclusion
Ravalli County is a diverse and vibrant county located in the southwestern corner of Montana. The county is home to a variety of terrain, ranging from the rugged mountains of the Bitterroot Range to the rolling hills of the Bitterroot Valley. The economy is diverse, with a mix of agriculture, manufacturing, tourism, and government services. The population is predominantly white, with small percentages of Native American, Hispanic, and Asian populations. The median household income is $45,837, and the median home value is $212,400. The unemployment rate is 4.2%, and the poverty rate is 11.3%.
Common Questions
What is the Total Population of Ravalli County?
Total Population of Ravalli County is 44,876.
What is the Total Male Population of Ravalli County?
Total Male Population of Ravalli County is 22,535.
What is the Total Female Population of Ravalli County?
Total Female Population of Ravalli County is 22,341.
What is the Ratio of Males per 100 Females in Ravalli County?
There are 100.87 Males per 100 Females in Ravalli County.
What is the Ratio of Females per 100 Males in Ravalli County?
There are 99.14 Females per 100 Males in Ravalli County.
What is the Median Population Age in Ravalli County?
Median Population Age in Ravalli County is 49.0 Years.
What is the Average Family Size in Ravalli County
Average Family Size in Ravalli County is 2.9 People.
What is the Average Household Size in Ravalli County
Average Household Size in Ravalli County is 2.4 People.
What is Per Capita Income in Ravalli County?
Per Capita income in Ravalli County is $38,555.
What is the Median Family Income in Ravalli County?
Median Family Income in Ravalli County is $80,623.
What is the Median Household income in Ravalli County?
Median Household Income in Ravalli County is $67,424.
What is Income or Wage Gap in Ravalli County?
Income or Wage Gap in Ravalli County is 38.3%.
Women in Ravalli County earn 61.7 cents for every dollar earned by a man.
What is Family Income Deficit in Ravalli County?
Family Income Deficit in Ravalli County is $11,681.
Families that are below poverty line in Ravalli County earn $11,681 less on average than the poverty threshold level.
What is Inequality or Gini Index in Ravalli County?
Inequality or Gini Index in Ravalli County is 0.45.
How Large is the Labor Force in Ravalli County?
There are 21,149 People in the Labor Forcein in Ravalli County.
What is the Percentage of People in the Labor Force in Ravalli County?
56.4% of People are in the Labor Force in Ravalli County.
What is the Unemployment Rate in Ravalli County?
Unemployment Rate in Ravalli County is 4.4%.