Prairie County, MT
Prairie County Overview
1,283
TOTAL POPULATION
690
MALE POPULATION
593
FEMALE POPULATION
116.36
MALES / 100 FEMALES
85.94
FEMALES / 100 MALES
47.2
MEDIAN AGE
3.3
AVG FAMILY SIZE
2.6
AVG HOUSEHOLD SIZE
$28,287
PER CAPITA INCOME
$68,405
AVG FAMILY INCOME
$44,107
AVG HOUSEHOLD INCOME
62.9%
WAGE / INCOME GAP [ % ]
37.1¢/ $1
WAGE / INCOME GAP [ $ ]
0.52
INEQUALITY / GINI INDEX
577
LABOR FORCE [ PEOPLE ]
56.5%
PERCENT IN LABOR FORCE
2.9%
UNEMPLOYMENT RATE
Prairie County Area Codes
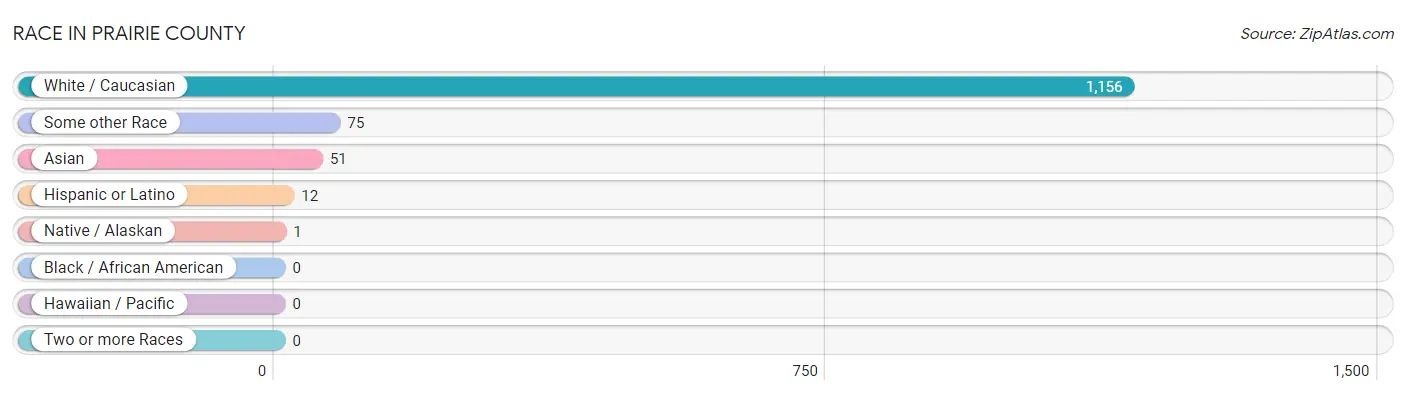
Race in Prairie County
The most populous races in Prairie County are White / Caucasian (1,156 | 90.1%), Some other Race (75 | 5.9%), and Asian (51 | 4.0%).
| Race | # Population | % Population |
| Asian | 51 | 4.0% |
| Black / African American | 0 | 0.0% |
| Hawaiian / Pacific | 0 | 0.0% |
| Hispanic or Latino | 12 | 0.9% |
| Native / Alaskan | 1 | 0.1% |
| White / Caucasian | 1,156 | 90.1% |
| Two or more Races | 0 | 0.0% |
| Some other Race | 75 | 5.9% |
| Total | 1,283 | 100.0% |
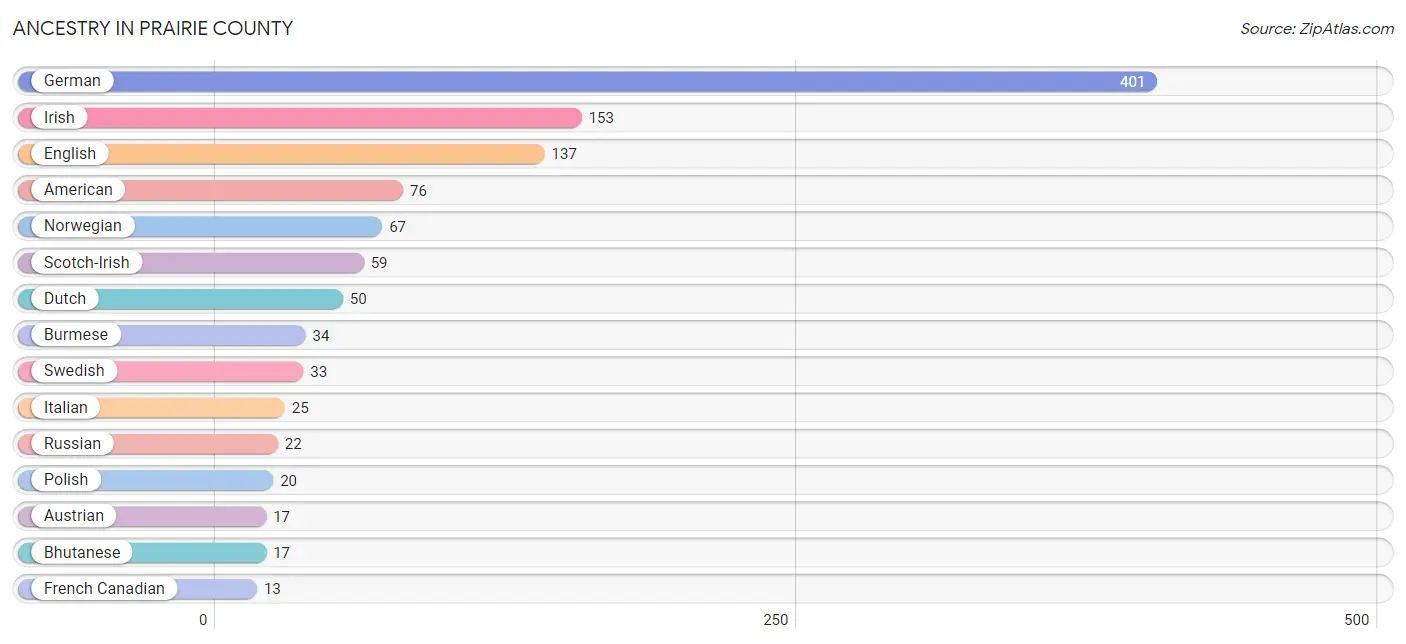
Ancestry in Prairie County
The most populous ancestries reported in Prairie County are German (401 | 31.2%), Irish (153 | 11.9%), English (137 | 10.7%), American (76 | 5.9%), and Norwegian (67 | 5.2%), together accounting for 65.0% of all Prairie County residents.
| Ancestry | # Population | % Population |
| American | 76 | 5.9% |
| Austrian | 17 | 1.3% |
| Bhutanese | 17 | 1.3% |
| British | 6 | 0.5% |
| Burmese | 34 | 2.6% |
| Canadian | 1 | 0.1% |
| Cherokee | 1 | 0.1% |
| Croatian | 8 | 0.6% |
| Danish | 5 | 0.4% |
| Dutch | 50 | 3.9% |
| English | 137 | 10.7% |
| European | 7 | 0.5% |
| French | 8 | 0.6% |
| French Canadian | 13 | 1.0% |
| German | 401 | 31.2% |
| Greek | 12 | 0.9% |
| Iranian | 6 | 0.5% |
| Irish | 153 | 11.9% |
| Italian | 25 | 1.9% |
| Mexican | 7 | 0.5% |
| Norwegian | 67 | 5.2% |
| Pennsylvania German | 3 | 0.2% |
| Polish | 20 | 1.6% |
| Romanian | 8 | 0.6% |
| Russian | 22 | 1.7% |
| Scotch-Irish | 59 | 4.6% |
| Scottish | 2 | 0.2% |
| Swedish | 33 | 2.6% |
| Swiss | 4 | 0.3% | View All 29 Rows |
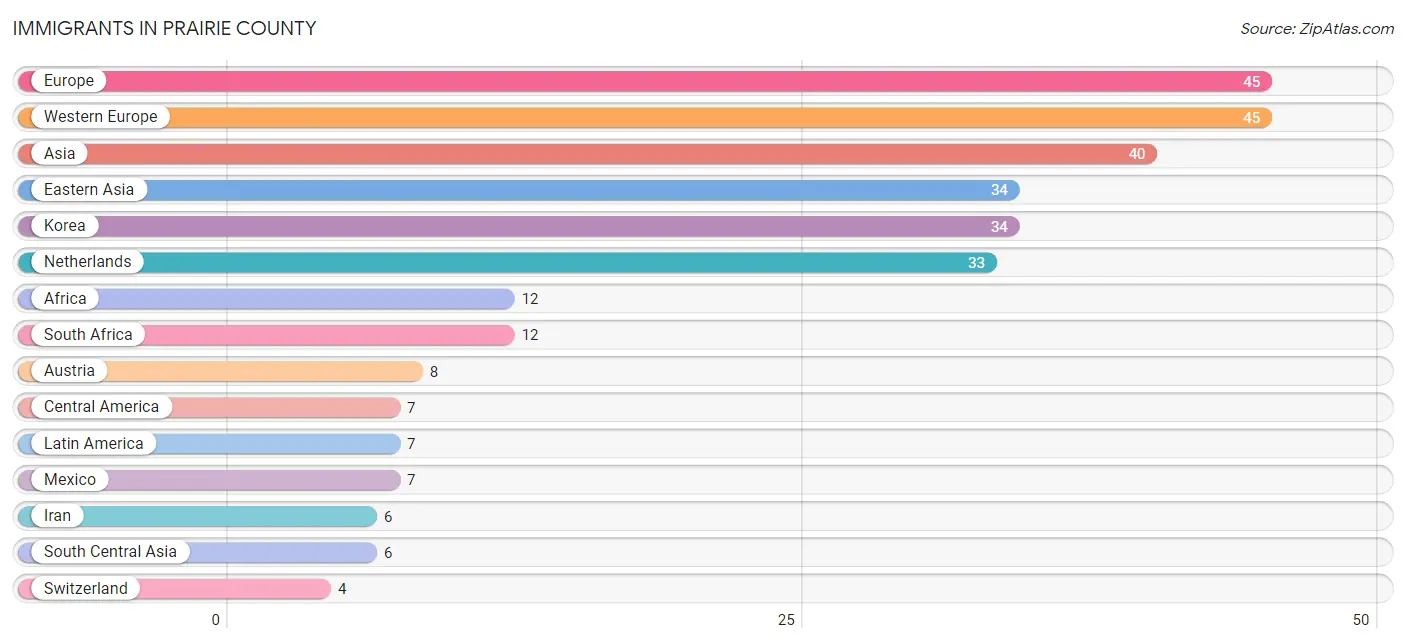
Immigrants in Prairie County
The most numerous immigrant groups reported in Prairie County came from Europe (45 | 3.5%), Western Europe (45 | 3.5%), Asia (40 | 3.1%), Eastern Asia (34 | 2.6%), and Korea (34 | 2.6%), together accounting for 15.4% of all Prairie County residents.
| Immigration Origin | # Population | % Population |
| Africa | 12 | 0.9% |
| Asia | 40 | 3.1% |
| Austria | 8 | 0.6% |
| Central America | 7 | 0.5% |
| Eastern Asia | 34 | 2.6% |
| Europe | 45 | 3.5% |
| Iran | 6 | 0.5% |
| Korea | 34 | 2.6% |
| Latin America | 7 | 0.5% |
| Mexico | 7 | 0.5% |
| Netherlands | 33 | 2.6% |
| South Africa | 12 | 0.9% |
| South Central Asia | 6 | 0.5% |
| Switzerland | 4 | 0.3% |
| Western Europe | 45 | 3.5% | View All 15 Rows |
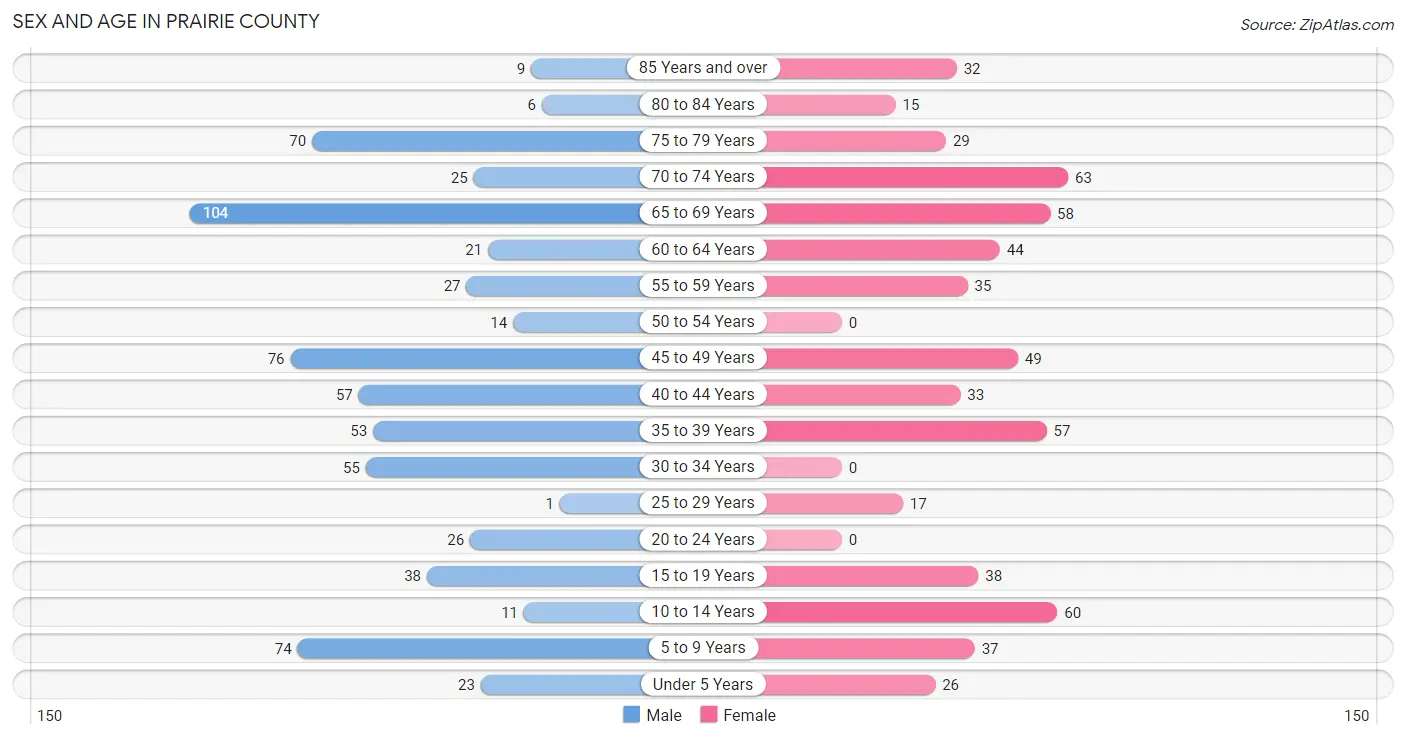
Sex and Age in Prairie County
Sex and Age in Prairie County
The most populous age groups in Prairie County are 65 to 69 Years (104 | 15.1%) for men and 70 to 74 Years (63 | 10.6%) for women.
| Age Bracket | Male | Female |
| Under 5 Years | 23 (3.3%) | 26 (4.4%) |
| 5 to 9 Years | 74 (10.7%) | 37 (6.2%) |
| 10 to 14 Years | 11 (1.6%) | 60 (10.1%) |
| 15 to 19 Years | 38 (5.5%) | 38 (6.4%) |
| 20 to 24 Years | 26 (3.8%) | 0 (0.0%) |
| 25 to 29 Years | 1 (0.1%) | 17 (2.9%) |
| 30 to 34 Years | 55 (8.0%) | 0 (0.0%) |
| 35 to 39 Years | 53 (7.7%) | 57 (9.6%) |
| 40 to 44 Years | 57 (8.3%) | 33 (5.6%) |
| 45 to 49 Years | 76 (11.0%) | 49 (8.3%) |
| 50 to 54 Years | 14 (2.0%) | 0 (0.0%) |
| 55 to 59 Years | 27 (3.9%) | 35 (5.9%) |
| 60 to 64 Years | 21 (3.0%) | 44 (7.4%) |
| 65 to 69 Years | 104 (15.1%) | 58 (9.8%) |
| 70 to 74 Years | 25 (3.6%) | 63 (10.6%) |
| 75 to 79 Years | 70 (10.1%) | 29 (4.9%) |
| 80 to 84 Years | 6 (0.9%) | 15 (2.5%) |
| 85 Years and over | 9 (1.3%) | 32 (5.4%) |
| Total | 690 (100.0%) | 593 (100.0%) |
Families and Households in Prairie County
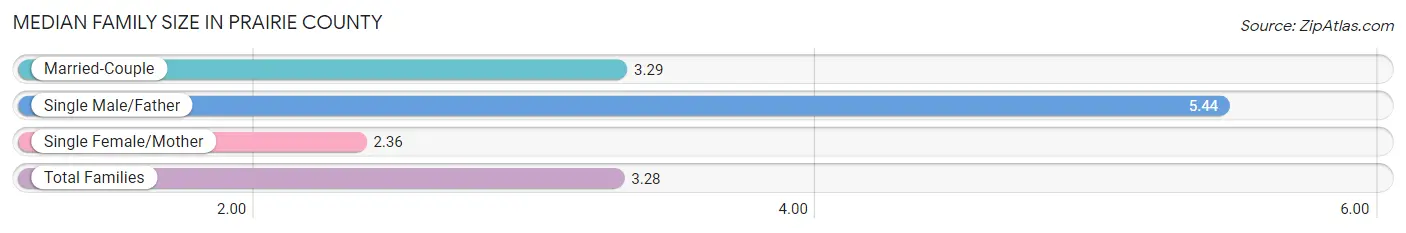
Median Family Size in Prairie County
The median family size in Prairie County is 3.28 persons per family, with single male/father families (9 | 3.2%) accounting for the largest median family size of 5.44 persons per family. On the other hand, single female/mother families (25 | 8.8%) represent the smallest median family size with 2.36 persons per family.
| Family Type | # Families | Family Size |
| Married-Couple | 249 (88.0%) | 3.29 |
| Single Male/Father | 9 (3.2%) | 5.44 |
| Single Female/Mother | 25 (8.8%) | 2.36 |
| Total Families | 283 (100.0%) | 3.28 |
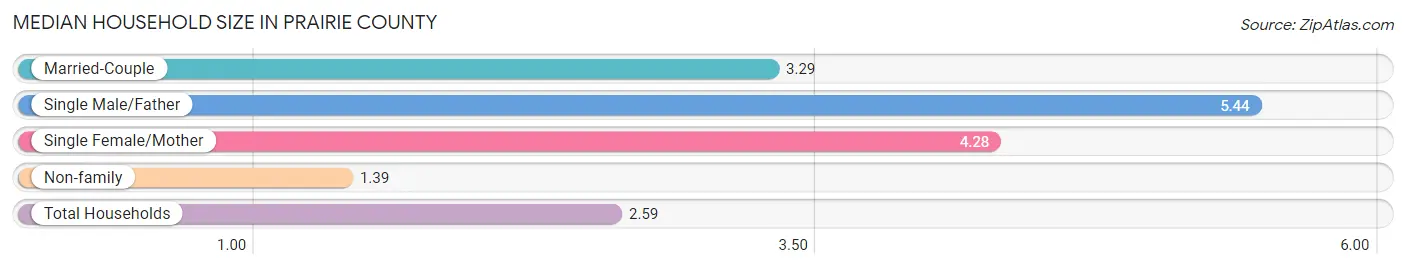
Median Household Size in Prairie County
The median household size in Prairie County is 2.59 persons per household, with single male/father households (9 | 1.9%) accounting for the largest median household size of 5.44 persons per household. non-family households (202 | 41.6%) represent the smallest median household size with 1.39 persons per household.
| Household Type | # Households | Household Size |
| Married-Couple | 249 (51.3%) | 3.29 |
| Single Male/Father | 9 (1.9%) | 5.44 |
| Single Female/Mother | 25 (5.1%) | 4.28 |
| Non-family | 202 (41.6%) | 1.39 |
| Total Households | 485 (100.0%) | 2.59 |
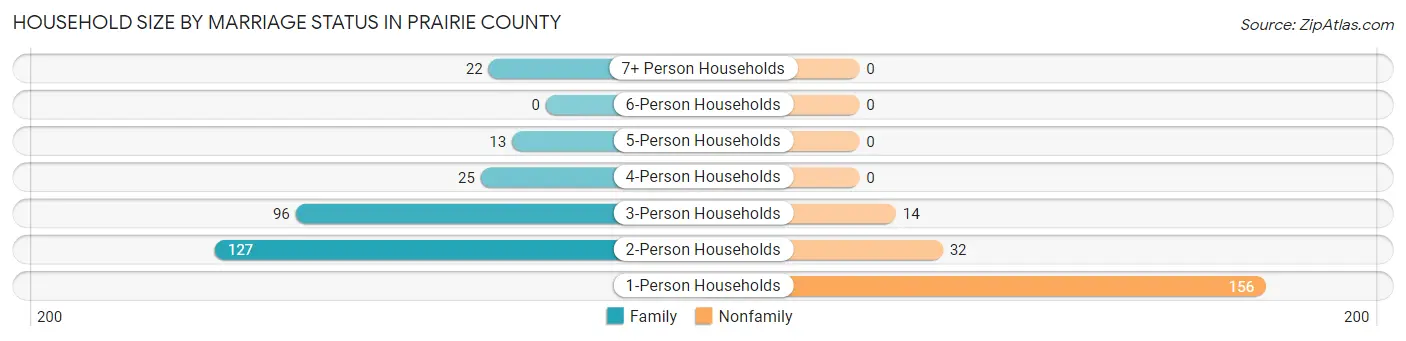
Household Size by Marriage Status in Prairie County
Out of a total of 485 households in Prairie County, 283 (58.4%) are family households, while 202 (41.6%) are nonfamily households. The most numerous type of family households are 2-person households, comprising 127, and the most common type of nonfamily households are 1-person households, comprising 156.
| Household Size | Family Households | Nonfamily Households |
| 1-Person Households | - | 156 (32.2%) |
| 2-Person Households | 127 (26.2%) | 32 (6.6%) |
| 3-Person Households | 96 (19.8%) | 14 (2.9%) |
| 4-Person Households | 25 (5.1%) | 0 (0.0%) |
| 5-Person Households | 13 (2.7%) | 0 (0.0%) |
| 6-Person Households | 0 (0.0%) | 0 (0.0%) |
| 7+ Person Households | 22 (4.5%) | 0 (0.0%) |
| Total | 283 (58.4%) | 202 (41.6%) |
Female Fertility in Prairie County
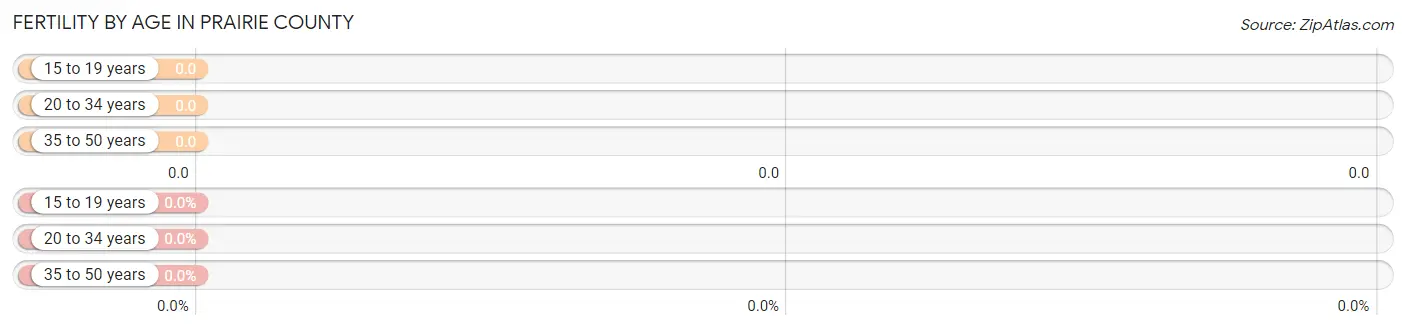
Fertility by Age in Prairie County
| Age Bracket | Women with Births | Births / 1,000 Women |
| 15 to 19 years | 0 (0.0%) | 0.0 |
| 20 to 34 years | 0 (0.0%) | 0.0 |
| 35 to 50 years | 0 (0.0%) | 0.0 |
| Total | 0 (0.0%) | 0.0 |
Fertility by Age by Marriage Status in Prairie County

| Age Bracket | Married | Unmarried |
| 15 to 19 years | 0 (0.0%) | 0 (0.0%) |
| 20 to 34 years | 0 (0.0%) | 0 (0.0%) |
| 35 to 50 years | 0 (0.0%) | 0 (0.0%) |
| Total | 0 (0.0%) | 0 (0.0%) |
Fertility by Education in Prairie County
| Educational Attainment | Women with Births | Births / 1,000 Women |
| Less than High School | 0 (0.0%) | 0.0 |
| High School Diploma | 0 (0.0%) | 0.0 |
| College or Associate's Degree | 0 (0.0%) | 0.0 |
| Bachelor's Degree | 0 (0.0%) | 0.0 |
| Graduate Degree | 0 (0.0%) | 0.0 |
| Total | 0 (0.0%) | 0.0 |
Fertility by Education by Marriage Status in Prairie County

| Educational Attainment | Married | Unmarried |
| Less than High School | 0 (0.0%) | 0 (0.0%) |
| High School Diploma | 0 (0.0%) | 0 (0.0%) |
| College or Associate's Degree | 0 (0.0%) | 0 (0.0%) |
| Bachelor's Degree | 0 (0.0%) | 0 (0.0%) |
| Graduate Degree | 0 (0.0%) | 0 (0.0%) |
| Total | 0 (0.0%) | 0 (0.0%) |
Income in Prairie County
Income Overview in Prairie County
Per Capita Income in Prairie County is $28,287, while median incomes of families and households are $68,405 and $44,107 respectively.
| Characteristic | Number | Measure |
| Per Capita Income | 1,283 | $28,287 |
| Median Family Income | 283 | $68,405 |
| Mean Family Income | 283 | $93,280 |
| Median Household Income | 485 | $44,107 |
| Mean Household Income | 485 | $69,469 |
| Income Deficit | 283 | $0 |
| Wage / Income Gap (%) | 1,283 | 62.91% |
| Wage / Income Gap ($) | 1,283 | 37.09¢ per $1 |
| Gini / Inequality Index | 1,283 | 0.52 |
Earnings by Sex in Prairie County
Average Earnings in Prairie County are $27,455, $43,056 for men and $15,969 for women, a difference of 62.9%.
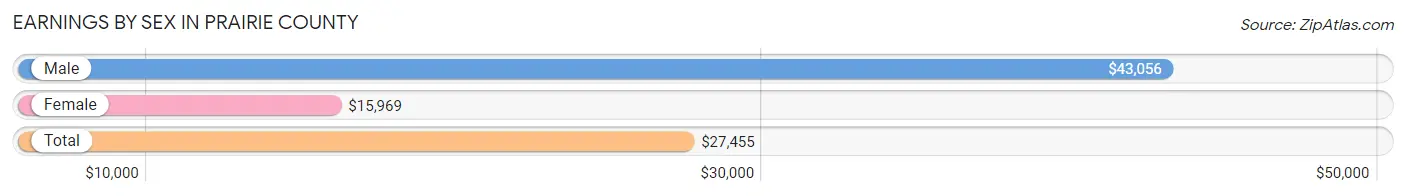
| Sex | Number | Average Earnings |
| Male | 370 (61.2%) | $43,056 |
| Female | 235 (38.8%) | $15,969 |
| Total | 605 (100.0%) | $27,455 |
Earnings by Sex by Income Bracket in Prairie County
The most common earnings brackets in Prairie County are $55,000 to $64,999 for men (53 | 14.3%) and $15,000 to $17,499 for women (40 | 17.0%).
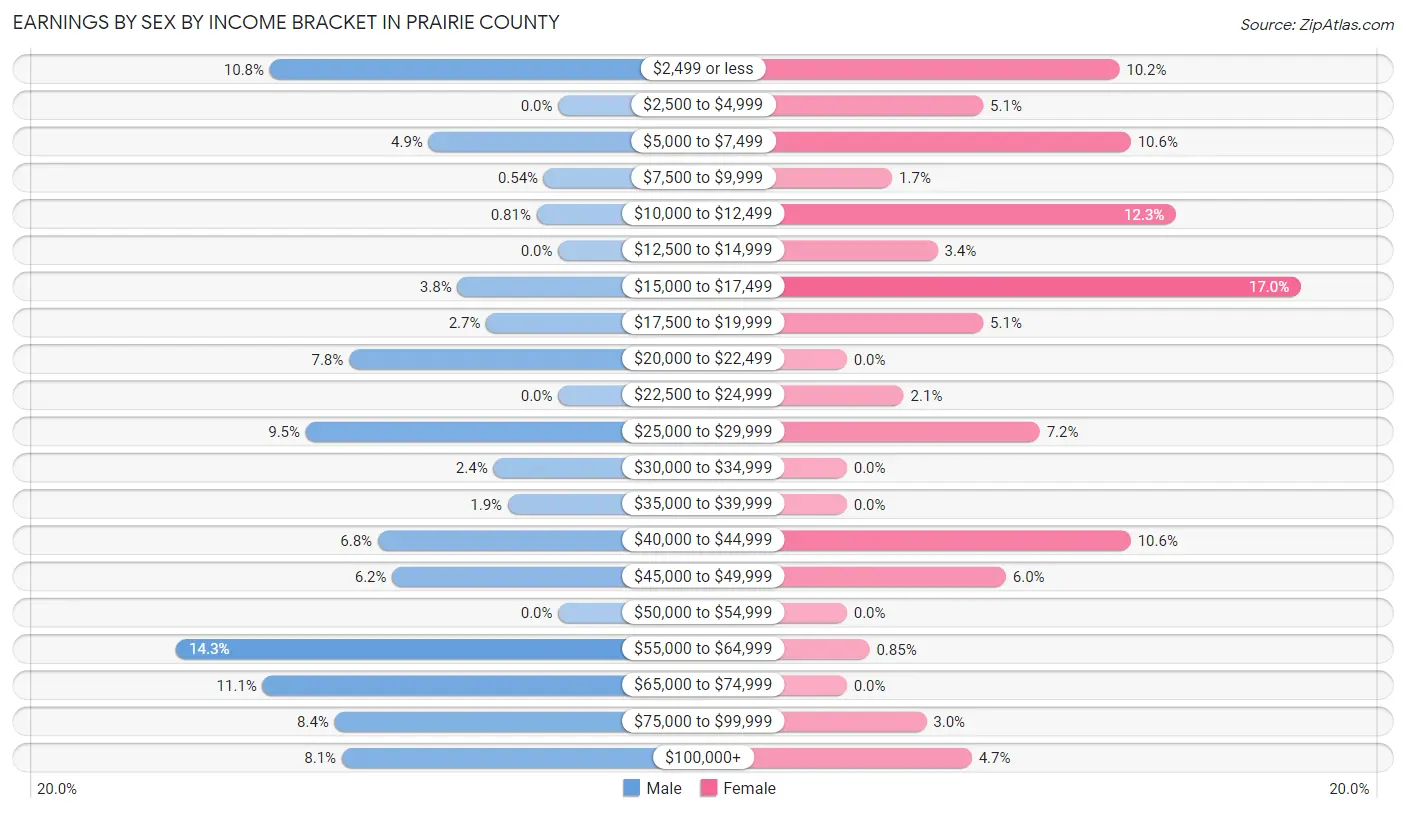
| Income | Male | Female |
| $2,499 or less | 40 (10.8%) | 24 (10.2%) |
| $2,500 to $4,999 | 0 (0.0%) | 12 (5.1%) |
| $5,000 to $7,499 | 18 (4.9%) | 25 (10.6%) |
| $7,500 to $9,999 | 2 (0.5%) | 4 (1.7%) |
| $10,000 to $12,499 | 3 (0.8%) | 29 (12.3%) |
| $12,500 to $14,999 | 0 (0.0%) | 8 (3.4%) |
| $15,000 to $17,499 | 14 (3.8%) | 40 (17.0%) |
| $17,500 to $19,999 | 10 (2.7%) | 12 (5.1%) |
| $20,000 to $22,499 | 29 (7.8%) | 0 (0.0%) |
| $22,500 to $24,999 | 0 (0.0%) | 5 (2.1%) |
| $25,000 to $29,999 | 35 (9.5%) | 17 (7.2%) |
| $30,000 to $34,999 | 9 (2.4%) | 0 (0.0%) |
| $35,000 to $39,999 | 7 (1.9%) | 0 (0.0%) |
| $40,000 to $44,999 | 25 (6.8%) | 25 (10.6%) |
| $45,000 to $49,999 | 23 (6.2%) | 14 (6.0%) |
| $50,000 to $54,999 | 0 (0.0%) | 0 (0.0%) |
| $55,000 to $64,999 | 53 (14.3%) | 2 (0.9%) |
| $65,000 to $74,999 | 41 (11.1%) | 0 (0.0%) |
| $75,000 to $99,999 | 31 (8.4%) | 7 (3.0%) |
| $100,000+ | 30 (8.1%) | 11 (4.7%) |
| Total | 370 (100.0%) | 235 (100.0%) |
Earnings by Sex by Educational Attainment in Prairie County
Average earnings in Prairie County are $47,750 for men and $15,969 for women, a difference of 66.6%. Men with an educational attainment of bachelor's degree enjoy the highest average annual earnings of $80,208, while those with high school diploma education earn the least with $39,643. Women with an educational attainment of high school diploma earn the most with the average annual earnings of $16,750, while those with college or associate's degree education have the smallest earnings of $13,750.
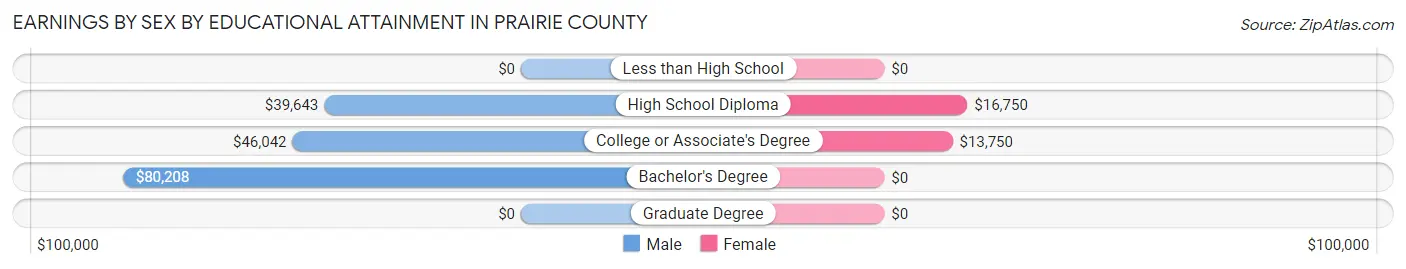
| Educational Attainment | Male Income | Female Income |
| Less than High School | - | - |
| High School Diploma | $39,643 | $16,750 |
| College or Associate's Degree | $46,042 | $13,750 |
| Bachelor's Degree | $80,208 | $0 |
| Graduate Degree | - | - |
| Total | $47,750 | $15,969 |
Family Income in Prairie County
Family Income Brackets in Prairie County
According to the Prairie County family income data, there are 57 families falling into the $35,000 to $49,999 income range, which is the most common income bracket and makes up 20.1% of all families.
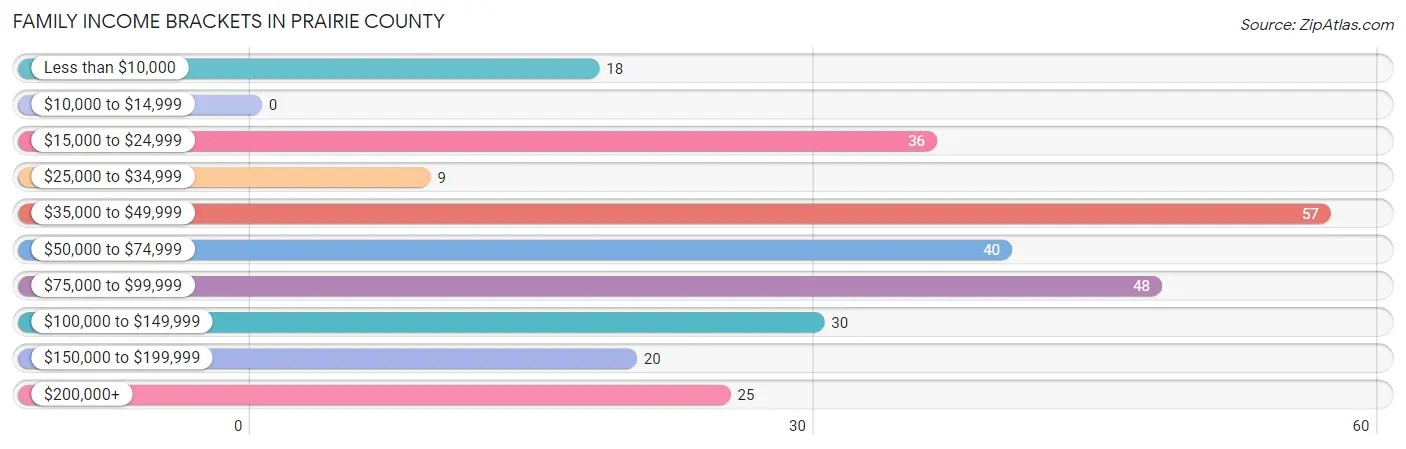
| Income Bracket | # Families | % Families |
| Less than $10,000 | 18 | 6.4% |
| $10,000 to $14,999 | 0 | 0.0% |
| $15,000 to $24,999 | 36 | 12.7% |
| $25,000 to $34,999 | 9 | 3.2% |
| $35,000 to $49,999 | 57 | 20.1% |
| $50,000 to $74,999 | 40 | 14.1% |
| $75,000 to $99,999 | 48 | 17.0% |
| $100,000 to $149,999 | 30 | 10.6% |
| $150,000 to $199,999 | 20 | 7.1% |
| $200,000+ | 25 | 8.8% |
Family Income by Famaliy Size in Prairie County
3-person families (71 | 25.1%) account for the highest median family income in Prairie County with $76,250 per family, while 3-person families (71 | 25.1%) have the highest median income of $25,417 per family member.
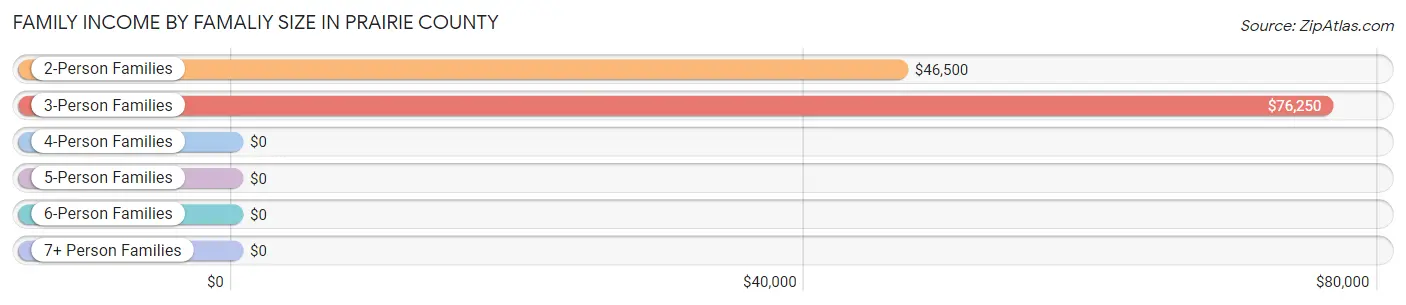
| Income Bracket | # Families | Median Income |
| 2-Person Families | 152 (53.7%) | $46,500 |
| 3-Person Families | 71 (25.1%) | $76,250 |
| 4-Person Families | 25 (8.8%) | $0 |
| 5-Person Families | 13 (4.6%) | $0 |
| 6-Person Families | 0 (0.0%) | $0 |
| 7+ Person Families | 22 (7.8%) | $0 |
| Total | 283 (100.0%) | $68,405 |
Family Income by Number of Earners in Prairie County
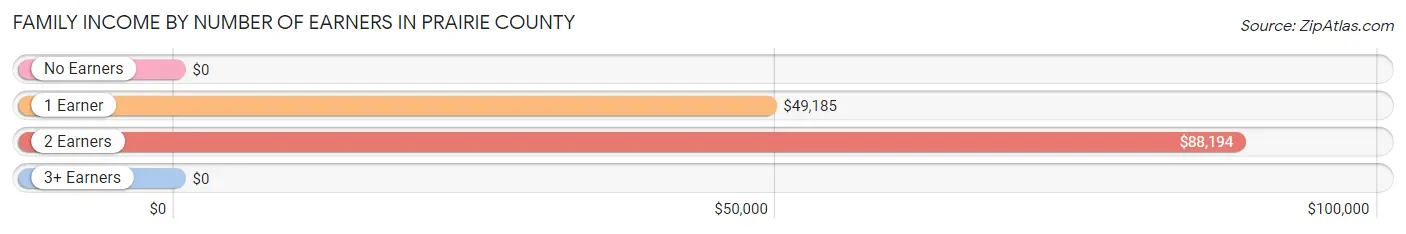
| Number of Earners | # Families | Median Income |
| No Earners | 66 (23.3%) | $0 |
| 1 Earner | 79 (27.9%) | $49,185 |
| 2 Earners | 118 (41.7%) | $88,194 |
| 3+ Earners | 20 (7.1%) | $0 |
| Total | 283 (100.0%) | $68,405 |
Household Income in Prairie County
Household Income Brackets in Prairie County
With 97 households falling in the category, the $35,000 to $49,999 income range is the most frequent in Prairie County, accounting for 20.0% of all households. In contrast, only 20 households (4.1%) fall into the $150,000 to $199,999 income bracket, making it the least populous group.
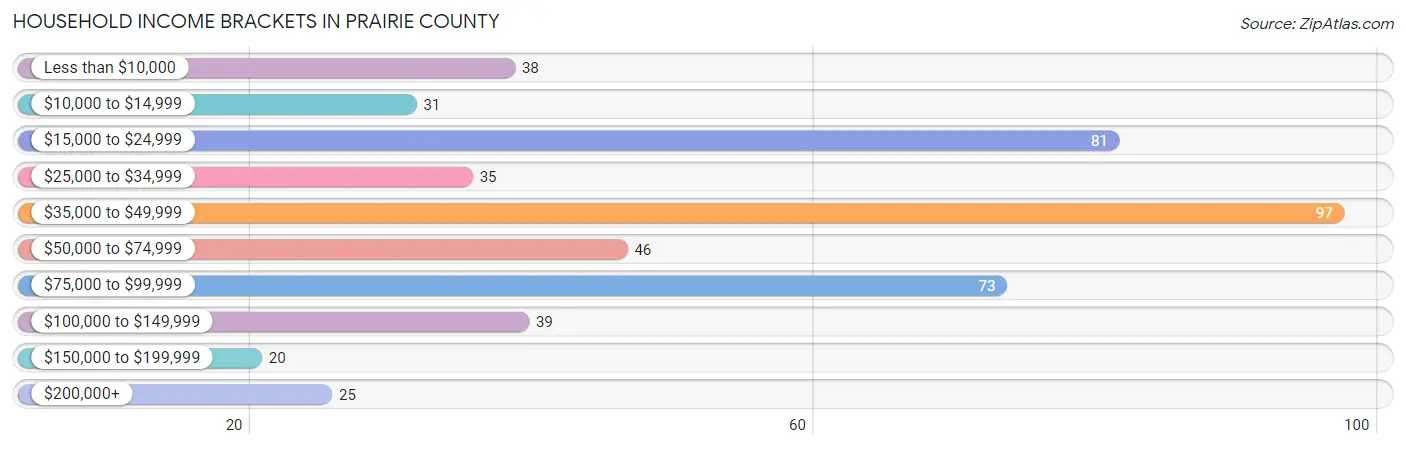
| Income Bracket | # Households | % Households |
| Less than $10,000 | 38 | 7.8% |
| $10,000 to $14,999 | 31 | 6.4% |
| $15,000 to $24,999 | 81 | 16.7% |
| $25,000 to $34,999 | 35 | 7.2% |
| $35,000 to $49,999 | 97 | 20.0% |
| $50,000 to $74,999 | 46 | 9.5% |
| $75,000 to $99,999 | 73 | 15.1% |
| $100,000 to $149,999 | 39 | 8.0% |
| $150,000 to $199,999 | 20 | 4.1% |
| $200,000+ | 25 | 5.2% |
Household Income by Householder Age in Prairie County
The median household income in Prairie County is $44,107, with the highest median household income of $49,342 found in the 45 to 64 years age bracket for the primary householder. A total of 146 households (30.1%) fall into this category. Meanwhile, the 15 to 24 years age bracket for the primary householder has the lowest median household income of $0, with 7 households (1.4%) in this group.
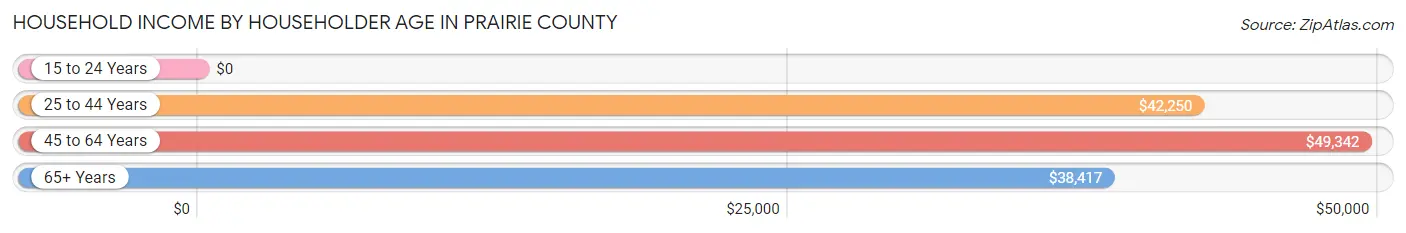
| Income Bracket | # Households | Median Income |
| 15 to 24 Years | 7 (1.4%) | $0 |
| 25 to 44 Years | 105 (21.6%) | $42,250 |
| 45 to 64 Years | 146 (30.1%) | $49,342 |
| 65+ Years | 227 (46.8%) | $38,417 |
| Total | 485 (100.0%) | $44,107 |
Poverty in Prairie County
Income Below Poverty by Sex and Age in Prairie County
With 24.0% poverty level for males and 20.2% for females among the residents of Prairie County, under 5 year old males and 25 to 34 year old females are the most vulnerable to poverty, with 23 males (100.0%) and 17 females (100.0%) in their respective age groups living below the poverty level.
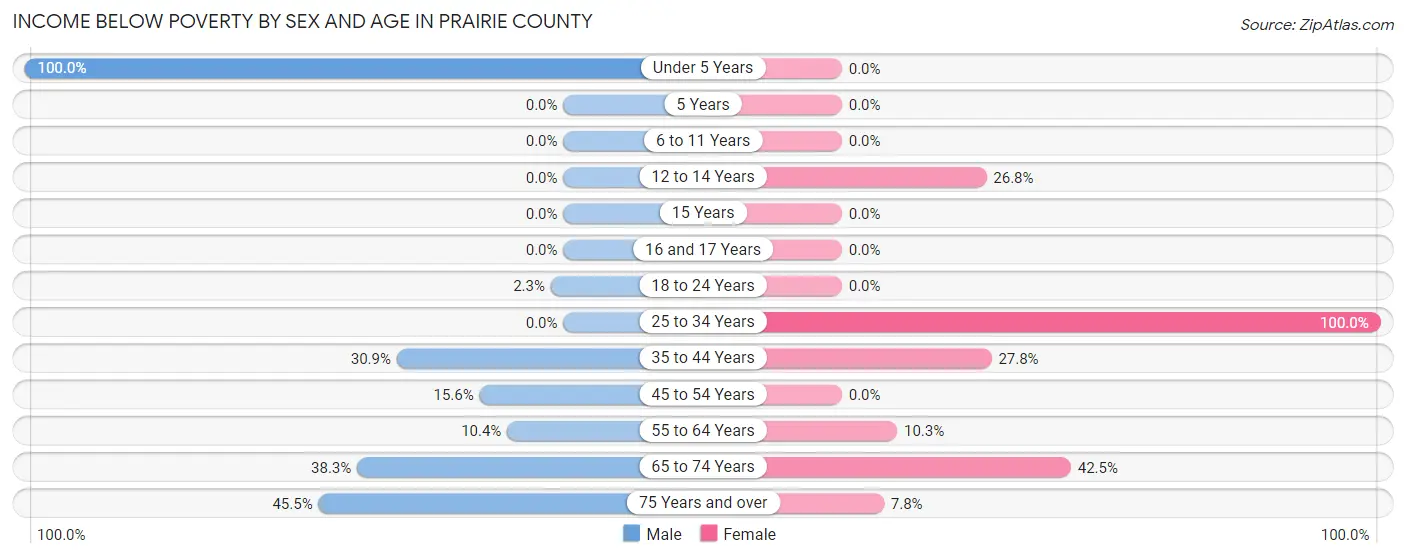
| Age Bracket | Male | Female |
| Under 5 Years | 23 (100.0%) | 0 (0.0%) |
| 5 Years | 0 (0.0%) | 0 (0.0%) |
| 6 to 11 Years | 0 (0.0%) | 0 (0.0%) |
| 12 to 14 Years | 0 (0.0%) | 11 (26.8%) |
| 15 Years | 0 (0.0%) | 0 (0.0%) |
| 16 and 17 Years | 0 (0.0%) | 0 (0.0%) |
| 18 to 24 Years | 1 (2.3%) | 0 (0.0%) |
| 25 to 34 Years | 0 (0.0%) | 17 (100.0%) |
| 35 to 44 Years | 34 (30.9%) | 25 (27.8%) |
| 45 to 54 Years | 14 (15.6%) | 0 (0.0%) |
| 55 to 64 Years | 5 (10.4%) | 8 (10.3%) |
| 65 to 74 Years | 49 (38.3%) | 51 (42.5%) |
| 75 Years and over | 35 (45.5%) | 5 (7.8%) |
| Total | 161 (24.0%) | 117 (20.2%) |
Income Above Poverty by Sex and Age in Prairie County
According to the poverty statistics in Prairie County, males aged 5 years and females aged under 5 years are the age groups that are most secure financially, with 100.0% of males and 100.0% of females in these age groups living above the poverty line.
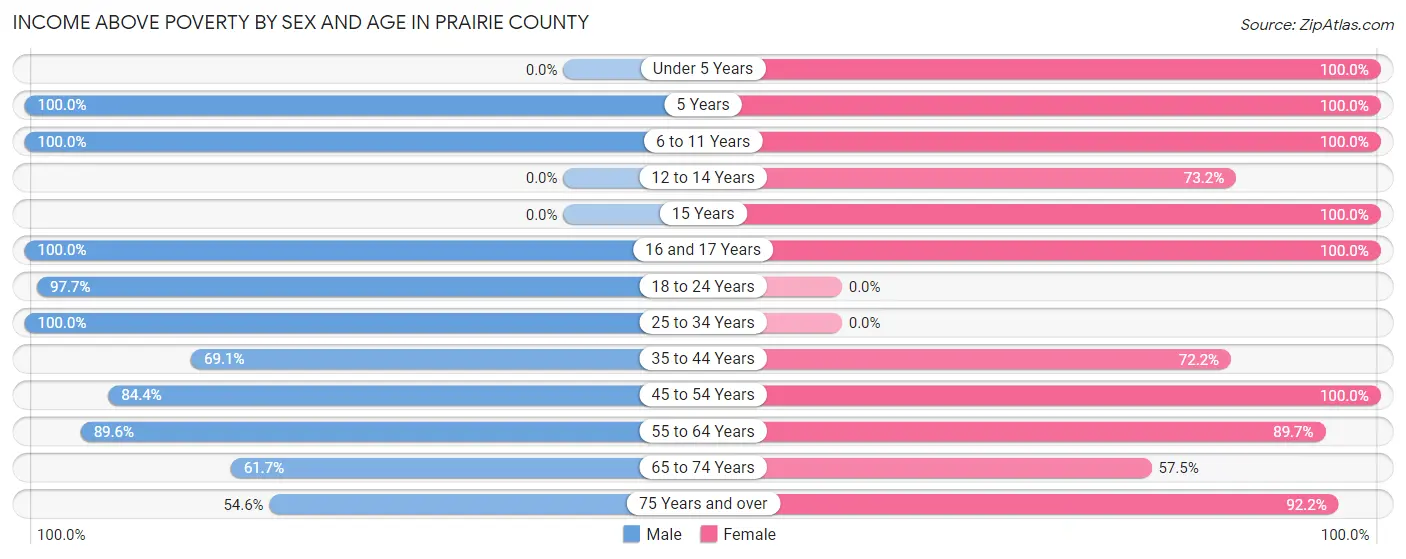
| Age Bracket | Male | Female |
| Under 5 Years | 0 (0.0%) | 26 (100.0%) |
| 5 Years | 8 (100.0%) | 9 (100.0%) |
| 6 to 11 Years | 66 (100.0%) | 47 (100.0%) |
| 12 to 14 Years | 0 (0.0%) | 30 (73.2%) |
| 15 Years | 0 (0.0%) | 31 (100.0%) |
| 16 and 17 Years | 21 (100.0%) | 7 (100.0%) |
| 18 to 24 Years | 42 (97.7%) | 0 (0.0%) |
| 25 to 34 Years | 56 (100.0%) | 0 (0.0%) |
| 35 to 44 Years | 76 (69.1%) | 65 (72.2%) |
| 45 to 54 Years | 76 (84.4%) | 49 (100.0%) |
| 55 to 64 Years | 43 (89.6%) | 70 (89.7%) |
| 65 to 74 Years | 79 (61.7%) | 69 (57.5%) |
| 75 Years and over | 42 (54.5%) | 59 (92.2%) |
| Total | 509 (76.0%) | 462 (79.8%) |
Income Below Poverty Among Married-Couple Families in Prairie County
The poverty statistics for married-couple families in Prairie County show that 10.8% or 27 of the total 249 families live below the poverty line. Families with no children have the highest poverty rate of 18.4%, comprising of 27 families. On the other hand, families with 1 or 2 children have the lowest poverty rate of 0.0%, which includes 0 families.
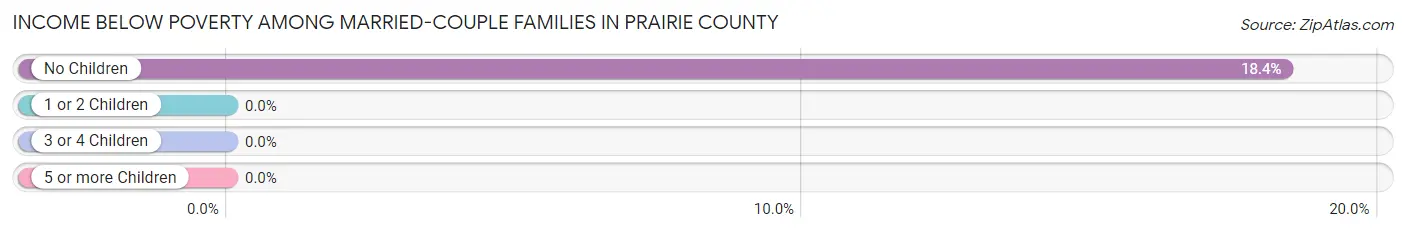
| Children | Above Poverty | Below Poverty |
| No Children | 120 (81.6%) | 27 (18.4%) |
| 1 or 2 Children | 78 (100.0%) | 0 (0.0%) |
| 3 or 4 Children | 2 (100.0%) | 0 (0.0%) |
| 5 or more Children | 22 (100.0%) | 0 (0.0%) |
| Total | 222 (89.2%) | 27 (10.8%) |
Income Below Poverty Among Single-Parent Households in Prairie County
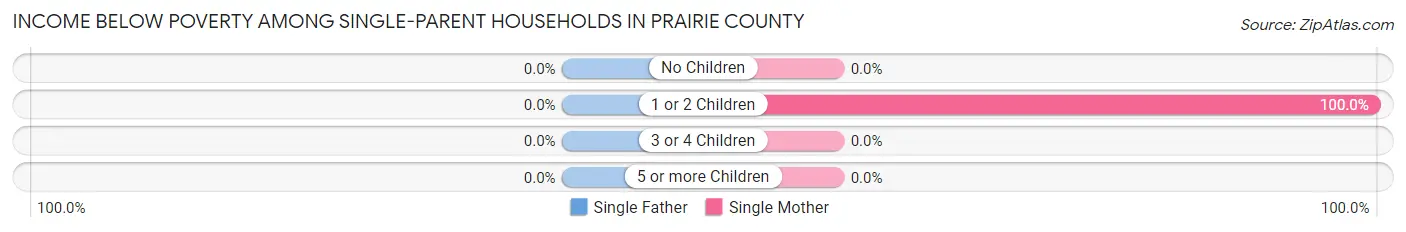
| Children | Single Father | Single Mother |
| No Children | 0 (0.0%) | 0 (0.0%) |
| 1 or 2 Children | 0 (0.0%) | 25 (100.0%) |
| 3 or 4 Children | 0 (0.0%) | 0 (0.0%) |
| 5 or more Children | 0 (0.0%) | 0 (0.0%) |
| Total | 0 (0.0%) | 25 (100.0%) |
Income Below Poverty Among Married-Couple vs Single-Parent Households in Prairie County
The poverty data for Prairie County shows that 27 of the married-couple family households (10.8%) and 25 of the single-parent households (73.5%) are living below the poverty level. Within the married-couple family households, those with no children have the highest poverty rate, with 27 households (18.4%) falling below the poverty line. Among the single-parent households, those with 1 or 2 children have the highest poverty rate, with 25 household (100.0%) living below poverty.
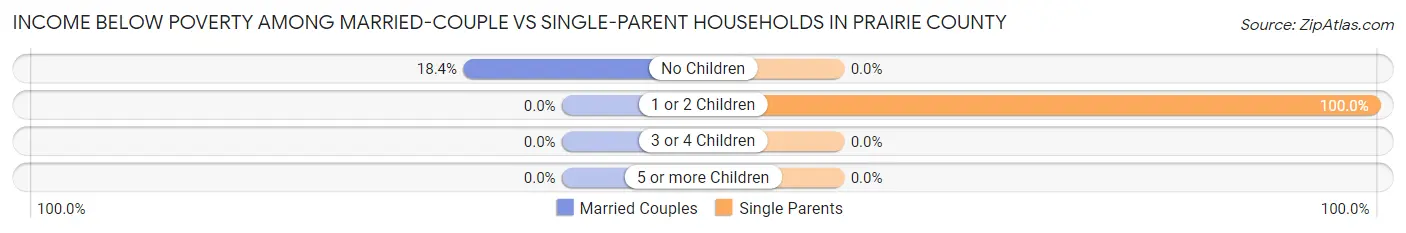
| Children | Married-Couple Families | Single-Parent Households |
| No Children | 27 (18.4%) | 0 (0.0%) |
| 1 or 2 Children | 0 (0.0%) | 25 (100.0%) |
| 3 or 4 Children | 0 (0.0%) | 0 (0.0%) |
| 5 or more Children | 0 (0.0%) | 0 (0.0%) |
| Total | 27 (10.8%) | 25 (73.5%) |
Employment Characteristics in Prairie County
Employment by Class of Employer in Prairie County
Among the 555 employed individuals in Prairie County, private company employees (321 | 57.8%), self-employed (not incorporated) (101 | 18.2%), and self-employed (incorporated) (59 | 10.6%) make up the most common classes of employment.
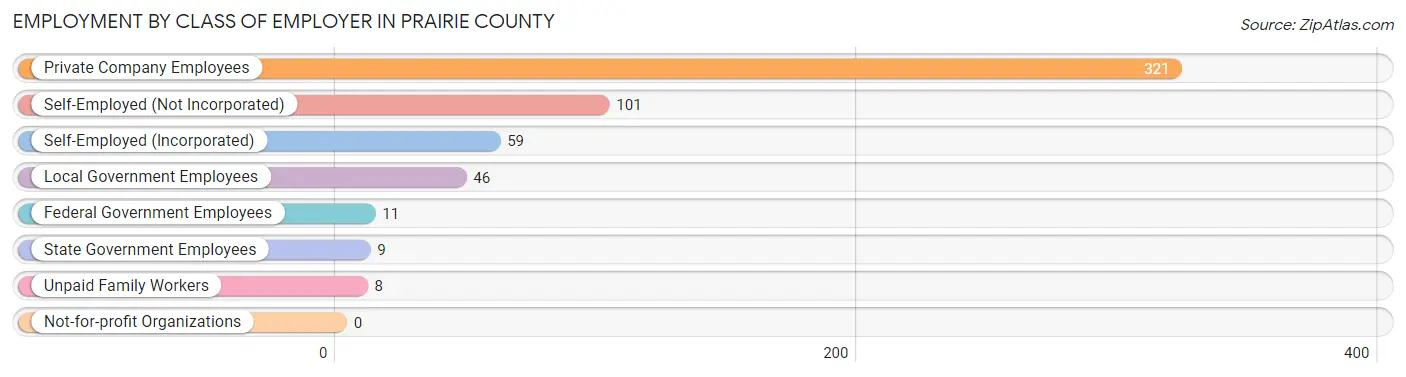
| Employer Class | # Employees | % Employees |
| Private Company Employees | 321 | 57.8% |
| Self-Employed (Incorporated) | 59 | 10.6% |
| Self-Employed (Not Incorporated) | 101 | 18.2% |
| Not-for-profit Organizations | 0 | 0.0% |
| Local Government Employees | 46 | 8.3% |
| State Government Employees | 9 | 1.6% |
| Federal Government Employees | 11 | 2.0% |
| Unpaid Family Workers | 8 | 1.4% |
| Total | 555 | 100.0% |
Employment Status by Age in Prairie County
According to the labor force statistics for Prairie County, out of the total population over 16 years of age (1,021), 56.5% or 577 individuals are in the labor force, with 2.9% or 17 of them unemployed. The age group with the highest labor force participation rate is 25 to 29 years, with 100.0% or 18 individuals in the labor force. Within the labor force, the 60 to 64 years age range has the highest percentage of unemployed individuals, with 17.1% or 7 of them being unemployed.
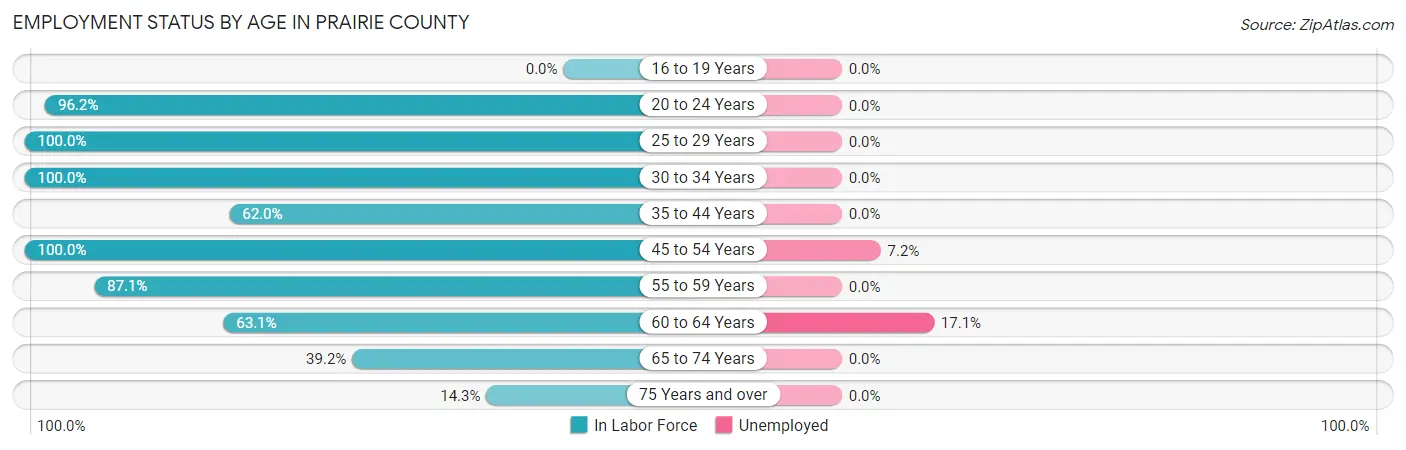
| Age Bracket | In Labor Force | Unemployed |
| 16 to 19 Years | 0 (0.0%) | 0 (0.0%) |
| 20 to 24 Years | 25 (96.2%) | 0 (0.0%) |
| 25 to 29 Years | 18 (100.0%) | 0 (0.0%) |
| 30 to 34 Years | 55 (100.0%) | 0 (0.0%) |
| 35 to 44 Years | 124 (62.0%) | 0 (0.0%) |
| 45 to 54 Years | 139 (100.0%) | 10 (7.2%) |
| 55 to 59 Years | 54 (87.1%) | 0 (0.0%) |
| 60 to 64 Years | 41 (63.1%) | 7 (17.1%) |
| 65 to 74 Years | 98 (39.2%) | 0 (0.0%) |
| 75 Years and over | 23 (14.3%) | 0 (0.0%) |
| Total | 577 (56.5%) | 17 (2.9%) |
Employment Status by Educational Attainment in Prairie County
According to labor force statistics for Prairie County, 80.0% of individuals (431) out of the total population between 25 and 64 years of age (539) are in the labor force, with 3.9% or 17 of them being unemployed. The group with the highest labor force participation rate are those with the educational attainment of college / associate degree, with 91.9% or 148 individuals in the labor force. Within the labor force, individuals with college / associate degree education have the highest percentage of unemployment, with 6.8% or 10 of them being unemployed.
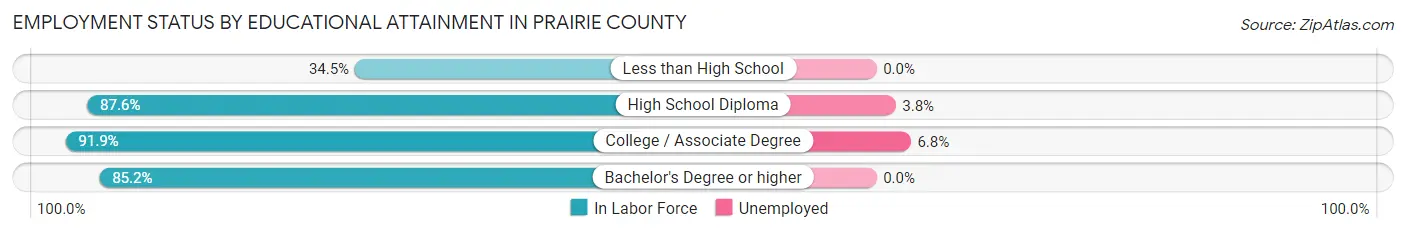
| Educational Attainment | In Labor Force | Unemployed |
| Less than High School | 30 (34.5%) | 0 (0.0%) |
| High School Diploma | 184 (87.6%) | 8 (3.8%) |
| College / Associate Degree | 148 (91.9%) | 11 (6.8%) |
| Bachelor's Degree or higher | 69 (85.2%) | 0 (0.0%) |
| Total | 431 (80.0%) | 21 (3.9%) |
Employment Occupations by Sex in Prairie County
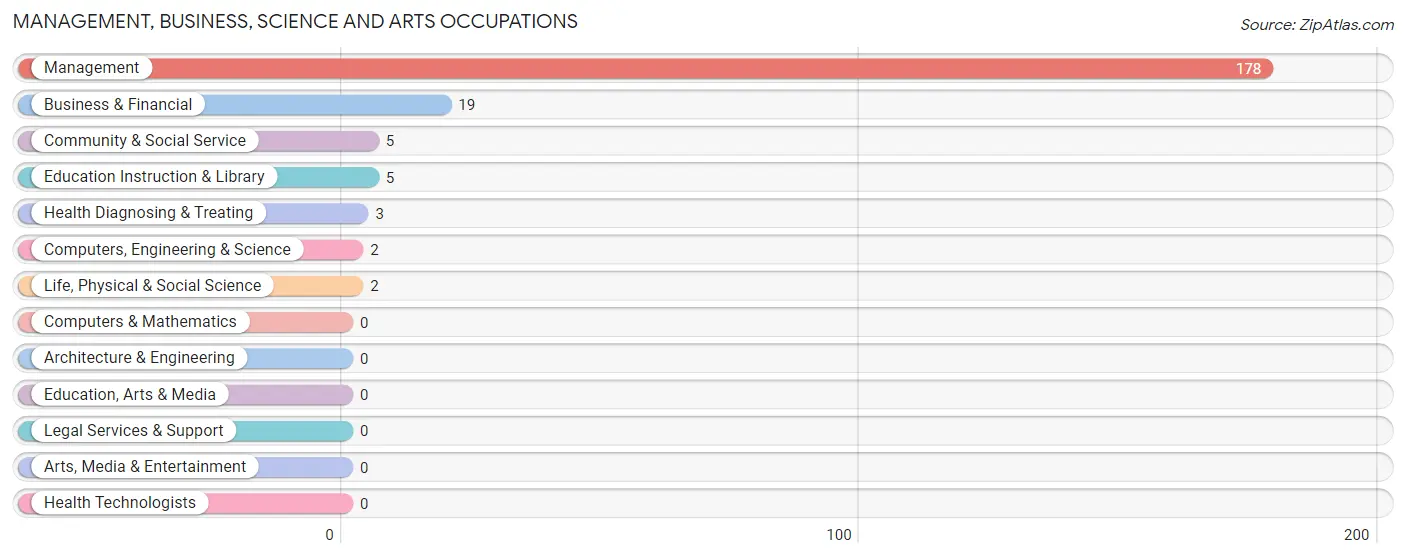
Management, Business, Science and Arts Occupations
The most common Management, Business, Science and Arts occupations in Prairie County are Management (178 | 31.8%), Business & Financial (19 | 3.4%), Community & Social Service (5 | 0.9%), Education Instruction & Library (5 | 0.9%), and Health Diagnosing & Treating (3 | 0.5%).
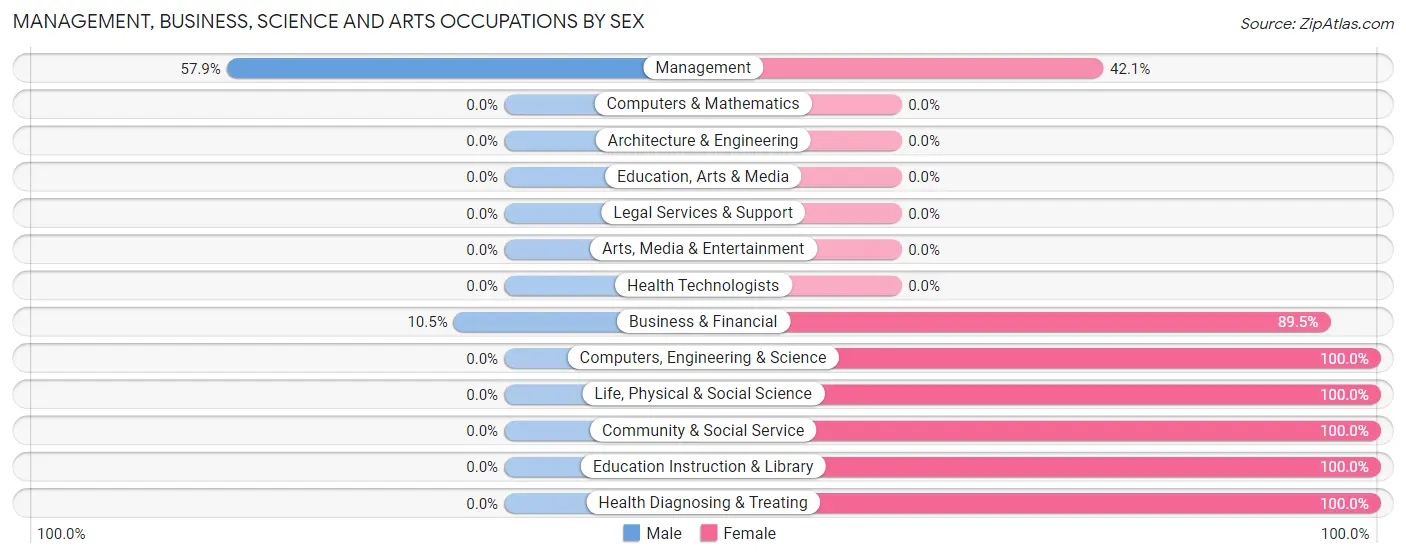
Management, Business, Science and Arts Occupations by Sex
Within the Management, Business, Science and Arts occupations in Prairie County, the most male-oriented occupations are Management (57.9%), and Business & Financial (10.5%), while the most female-oriented occupations are Computers, Engineering & Science (100.0%), Life, Physical & Social Science (100.0%), and Community & Social Service (100.0%).
| Occupation | Male | Female |
| Management | 103 (57.9%) | 75 (42.1%) |
| Business & Financial | 2 (10.5%) | 17 (89.5%) |
| Computers, Engineering & Science | 0 (0.0%) | 2 (100.0%) |
| Computers & Mathematics | 0 (0.0%) | 0 (0.0%) |
| Architecture & Engineering | 0 (0.0%) | 0 (0.0%) |
| Life, Physical & Social Science | 0 (0.0%) | 2 (100.0%) |
| Community & Social Service | 0 (0.0%) | 5 (100.0%) |
| Education, Arts & Media | 0 (0.0%) | 0 (0.0%) |
| Legal Services & Support | 0 (0.0%) | 0 (0.0%) |
| Education Instruction & Library | 0 (0.0%) | 5 (100.0%) |
| Arts, Media & Entertainment | 0 (0.0%) | 0 (0.0%) |
| Health Diagnosing & Treating | 0 (0.0%) | 3 (100.0%) |
| Health Technologists | 0 (0.0%) | 0 (0.0%) |
| Total (Category) | 105 (50.7%) | 102 (49.3%) |
| Total (Overall) | 336 (60.0%) | 224 (40.0%) |
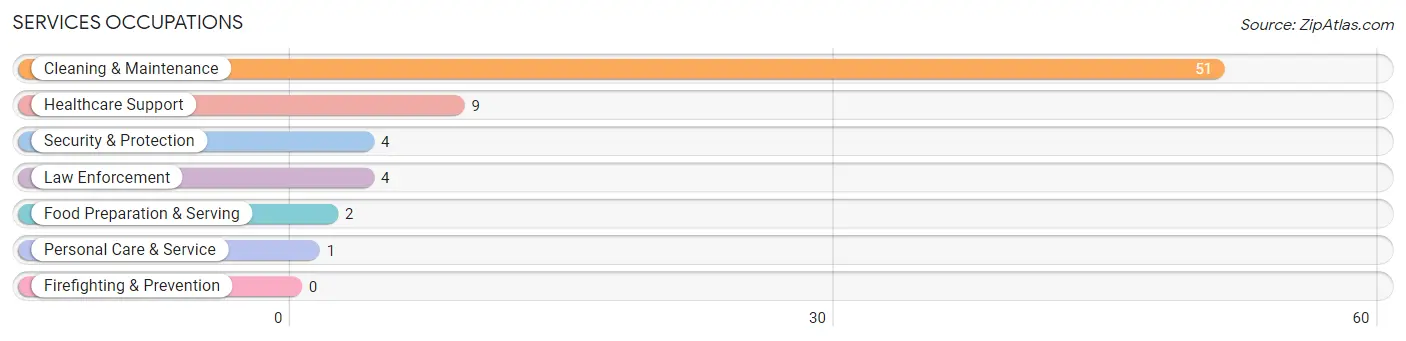
Services Occupations
The most common Services occupations in Prairie County are Cleaning & Maintenance (51 | 9.1%), Healthcare Support (9 | 1.6%), Security & Protection (4 | 0.7%), Law Enforcement (4 | 0.7%), and Food Preparation & Serving (2 | 0.4%).
Services Occupations by Sex
Within the Services occupations in Prairie County, the most male-oriented occupations are Personal Care & Service (100.0%), and Cleaning & Maintenance (64.7%), while the most female-oriented occupations are Healthcare Support (100.0%), Security & Protection (100.0%), and Law Enforcement (100.0%).
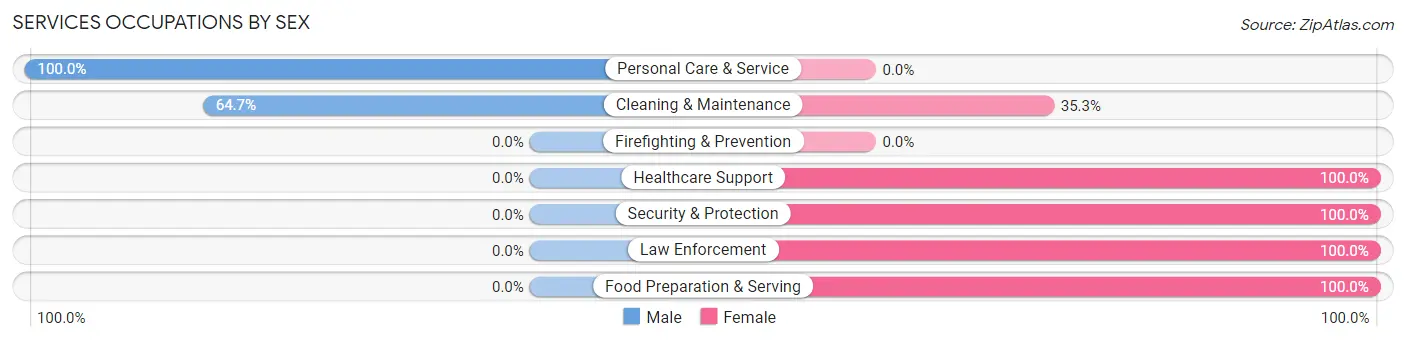
| Occupation | Male | Female |
| Healthcare Support | 0 (0.0%) | 9 (100.0%) |
| Security & Protection | 0 (0.0%) | 4 (100.0%) |
| Firefighting & Prevention | 0 (0.0%) | 0 (0.0%) |
| Law Enforcement | 0 (0.0%) | 4 (100.0%) |
| Food Preparation & Serving | 0 (0.0%) | 2 (100.0%) |
| Cleaning & Maintenance | 33 (64.7%) | 18 (35.3%) |
| Personal Care & Service | 1 (100.0%) | 0 (0.0%) |
| Total (Category) | 34 (50.7%) | 33 (49.2%) |
| Total (Overall) | 336 (60.0%) | 224 (40.0%) |
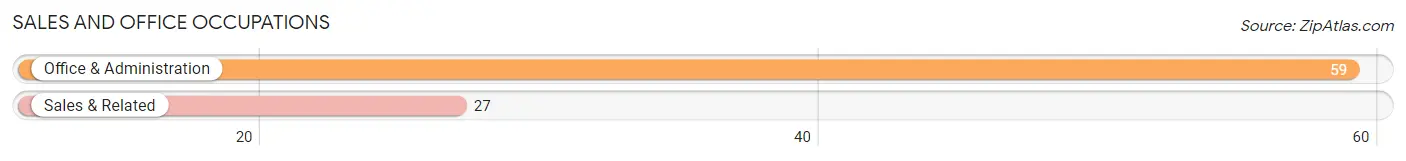
Sales and Office Occupations
The most common Sales and Office occupations in Prairie County are Office & Administration (59 | 10.5%), and Sales & Related (27 | 4.8%).
Sales and Office Occupations by Sex
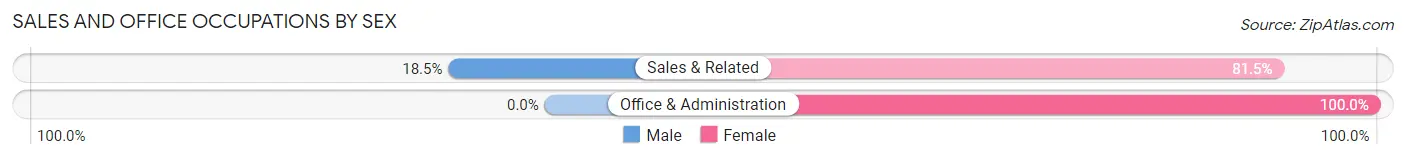
| Occupation | Male | Female |
| Sales & Related | 5 (18.5%) | 22 (81.5%) |
| Office & Administration | 0 (0.0%) | 59 (100.0%) |
| Total (Category) | 5 (5.8%) | 81 (94.2%) |
| Total (Overall) | 336 (60.0%) | 224 (40.0%) |
Natural Resources, Construction and Maintenance Occupations
The most common Natural Resources, Construction and Maintenance occupations in Prairie County are Farming, Fishing & Forestry (56 | 10.0%), and Construction & Extraction (55 | 9.8%).
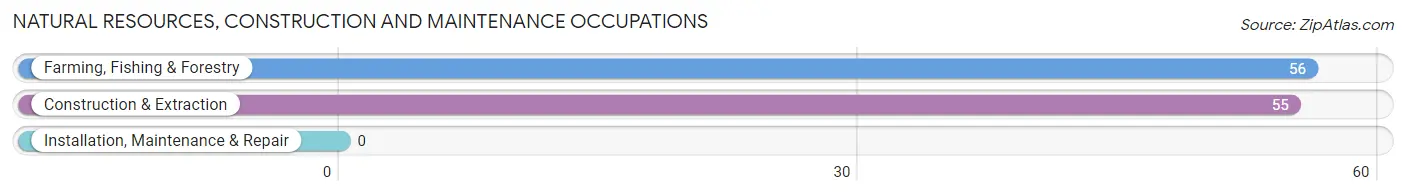
Natural Resources, Construction and Maintenance Occupations by Sex
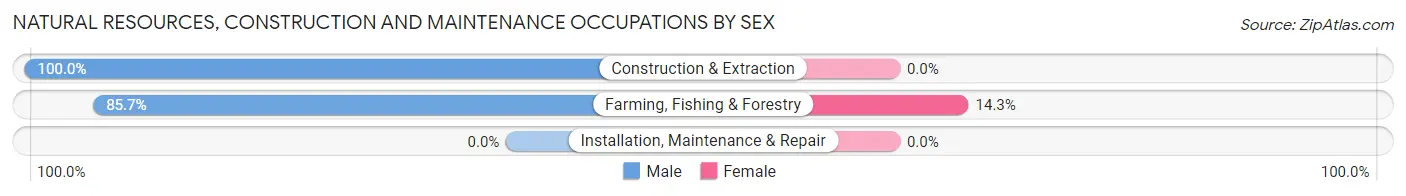
| Occupation | Male | Female |
| Farming, Fishing & Forestry | 48 (85.7%) | 8 (14.3%) |
| Construction & Extraction | 55 (100.0%) | 0 (0.0%) |
| Installation, Maintenance & Repair | 0 (0.0%) | 0 (0.0%) |
| Total (Category) | 103 (92.8%) | 8 (7.2%) |
| Total (Overall) | 336 (60.0%) | 224 (40.0%) |
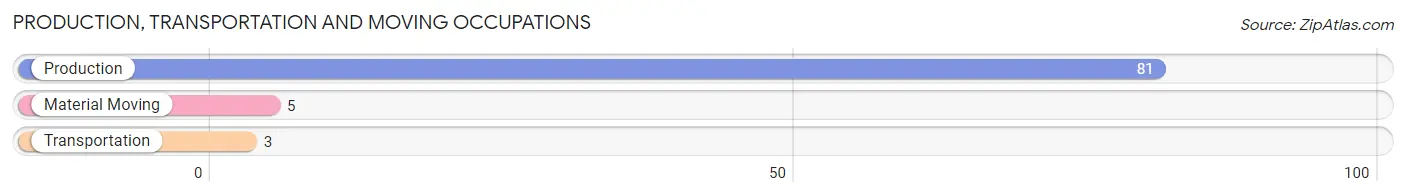
Production, Transportation and Moving Occupations
The most common Production, Transportation and Moving occupations in Prairie County are Production (81 | 14.5%), Material Moving (5 | 0.9%), and Transportation (3 | 0.5%).
Production, Transportation and Moving Occupations by Sex
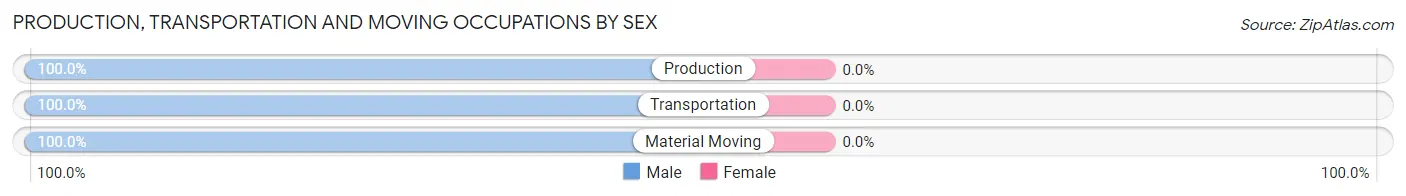
| Occupation | Male | Female |
| Production | 81 (100.0%) | 0 (0.0%) |
| Transportation | 3 (100.0%) | 0 (0.0%) |
| Material Moving | 5 (100.0%) | 0 (0.0%) |
| Total (Category) | 89 (100.0%) | 0 (0.0%) |
| Total (Overall) | 336 (60.0%) | 224 (40.0%) |
Employment Industries by Sex in Prairie County
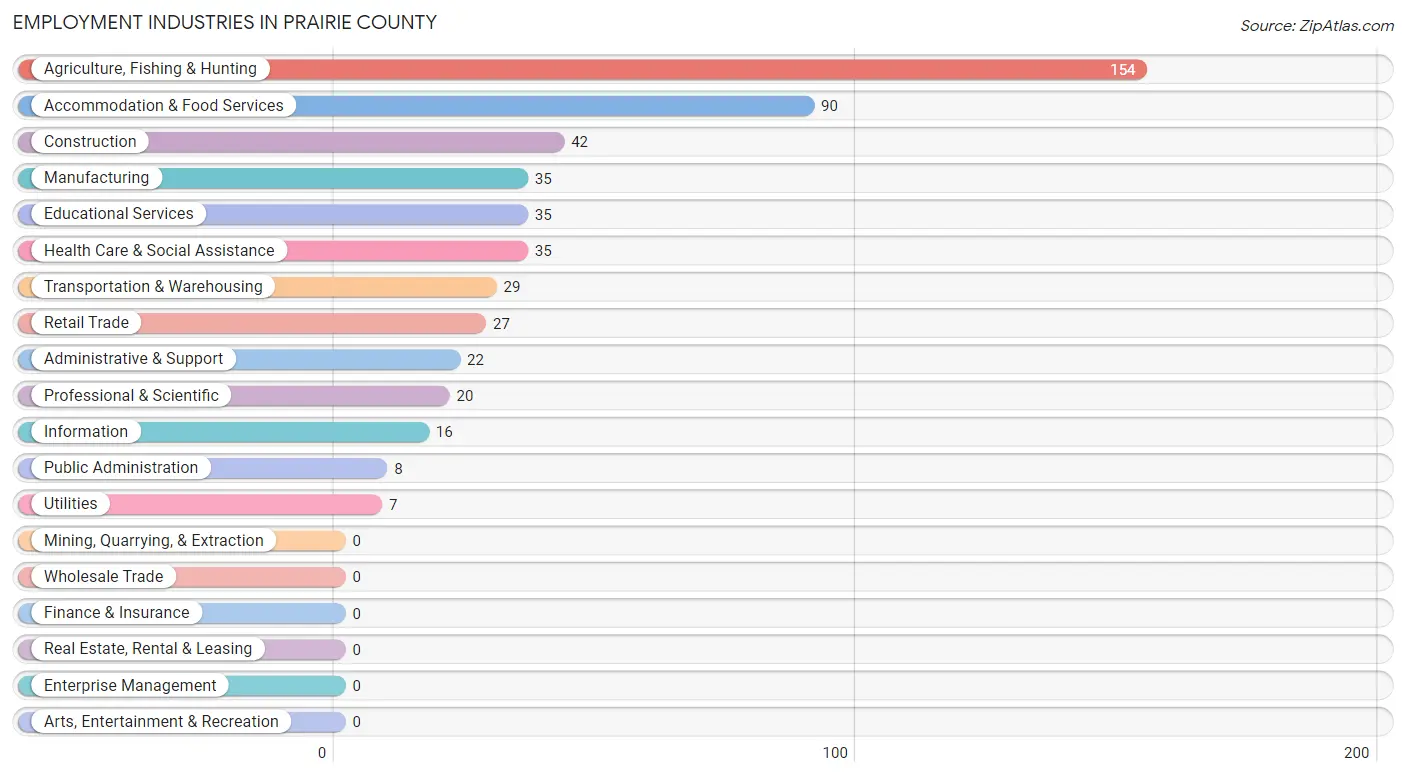
Employment Industries in Prairie County
The major employment industries in Prairie County include Agriculture, Fishing & Hunting (154 | 27.5%), Accommodation & Food Services (90 | 16.1%), Construction (42 | 7.5%), Manufacturing (35 | 6.2%), and Educational Services (35 | 6.2%).
Employment Industries by Sex in Prairie County
The Prairie County industries that see more men than women are Construction (100.0%), Manufacturing (100.0%), and Utilities (100.0%), whereas the industries that tend to have a higher number of women are Information (100.0%), Professional & Scientific (100.0%), and Educational Services (85.7%).
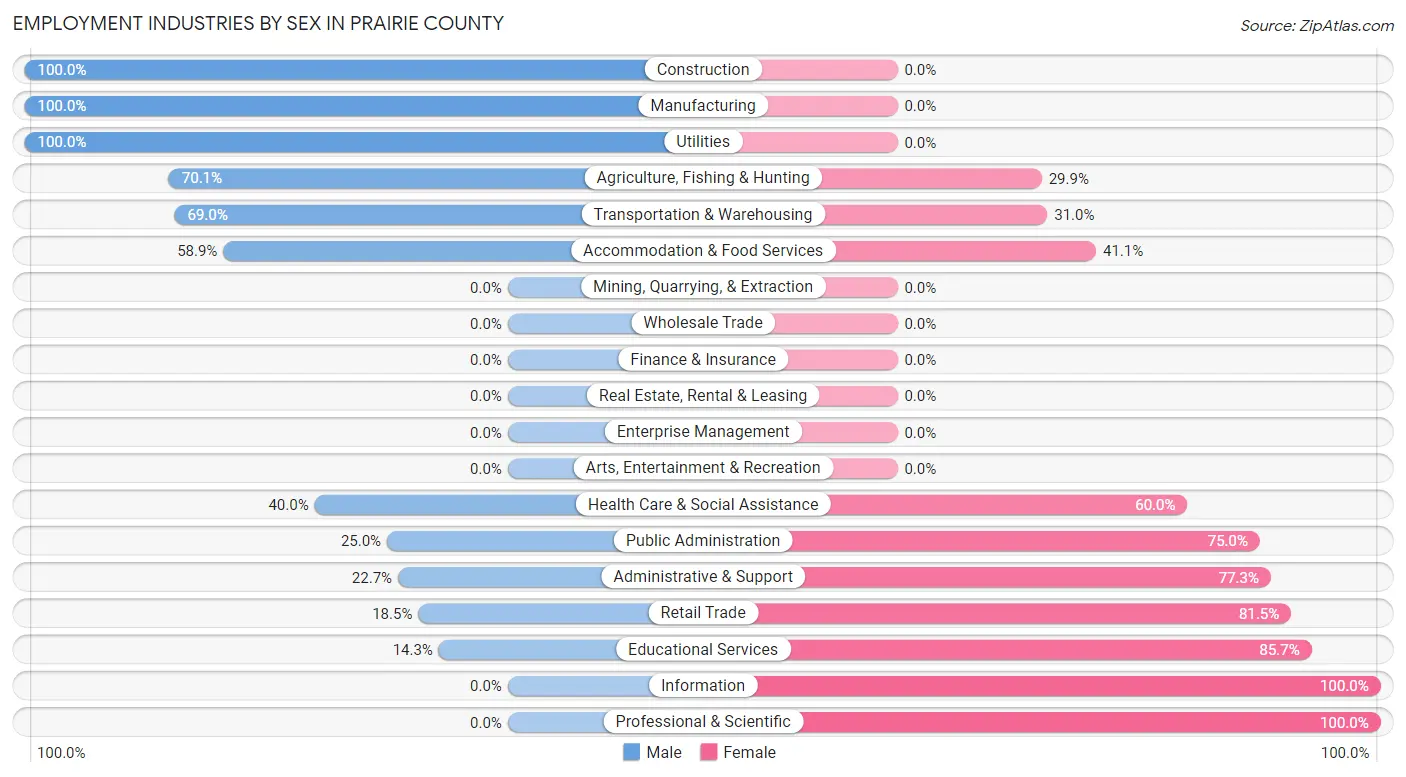
| Industry | Male | Female |
| Agriculture, Fishing & Hunting | 108 (70.1%) | 46 (29.9%) |
| Mining, Quarrying, & Extraction | 0 (0.0%) | 0 (0.0%) |
| Construction | 42 (100.0%) | 0 (0.0%) |
| Manufacturing | 35 (100.0%) | 0 (0.0%) |
| Wholesale Trade | 0 (0.0%) | 0 (0.0%) |
| Retail Trade | 5 (18.5%) | 22 (81.5%) |
| Transportation & Warehousing | 20 (69.0%) | 9 (31.0%) |
| Utilities | 7 (100.0%) | 0 (0.0%) |
| Information | 0 (0.0%) | 16 (100.0%) |
| Finance & Insurance | 0 (0.0%) | 0 (0.0%) |
| Real Estate, Rental & Leasing | 0 (0.0%) | 0 (0.0%) |
| Professional & Scientific | 0 (0.0%) | 20 (100.0%) |
| Enterprise Management | 0 (0.0%) | 0 (0.0%) |
| Administrative & Support | 5 (22.7%) | 17 (77.3%) |
| Educational Services | 5 (14.3%) | 30 (85.7%) |
| Health Care & Social Assistance | 14 (40.0%) | 21 (60.0%) |
| Arts, Entertainment & Recreation | 0 (0.0%) | 0 (0.0%) |
| Accommodation & Food Services | 53 (58.9%) | 37 (41.1%) |
| Public Administration | 2 (25.0%) | 6 (75.0%) |
| Total | 336 (60.0%) | 224 (40.0%) |
Education in Prairie County
School Enrollment in Prairie County
The most common levels of schooling among the 260 students in Prairie County are elementary school (88 | 33.9%), high school (76 | 29.2%), and middle school (71 | 27.3%).
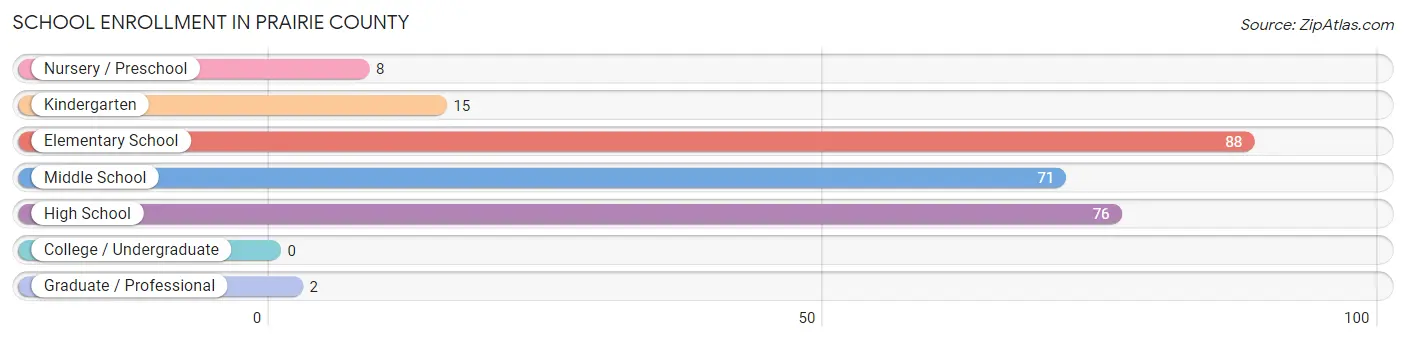
| School Level | # Students | % Students |
| Nursery / Preschool | 8 | 3.1% |
| Kindergarten | 15 | 5.8% |
| Elementary School | 88 | 33.9% |
| Middle School | 71 | 27.3% |
| High School | 76 | 29.2% |
| College / Undergraduate | 0 | 0.0% |
| Graduate / Professional | 2 | 0.8% |
| Total | 260 | 100.0% |
School Enrollment by Age by Funding Source in Prairie County
Out of a total of 260 students who are enrolled in schools in Prairie County, 113 (43.5%) attend a private institution, while the remaining 147 (56.5%) are enrolled in public schools. The age group of 18 to 19 year olds has the highest likelihood of being enrolled in private schools, with 17 (100.0% in the age bracket) enrolled. Conversely, the age group of 35 years and over has the lowest likelihood of being enrolled in a private school, with 2 (100.0% in the age bracket) attending a public institution.
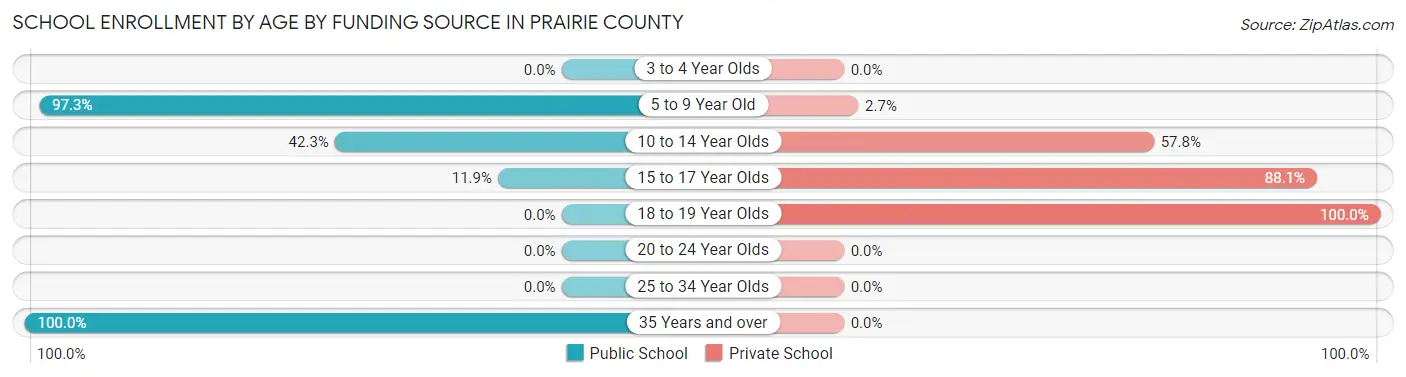
| Age Bracket | Public School | Private School |
| 3 to 4 Year Olds | 0 (0.0%) | 0 (0.0%) |
| 5 to 9 Year Old | 108 (97.3%) | 3 (2.7%) |
| 10 to 14 Year Olds | 30 (42.2%) | 41 (57.8%) |
| 15 to 17 Year Olds | 7 (11.9%) | 52 (88.1%) |
| 18 to 19 Year Olds | 0 (0.0%) | 17 (100.0%) |
| 20 to 24 Year Olds | 0 (0.0%) | 0 (0.0%) |
| 25 to 34 Year Olds | 0 (0.0%) | 0 (0.0%) |
| 35 Years and over | 2 (100.0%) | 0 (0.0%) |
| Total | 147 (56.5%) | 113 (43.5%) |
Educational Attainment by Field of Study in Prairie County
Liberal arts & history (112 | 40.9%), education (47 | 17.2%), business (36 | 13.1%), social sciences (21 | 7.7%), and psychology (18 | 6.6%) are the most common fields of study among 274 individuals in Prairie County who have obtained a bachelor's degree or higher.
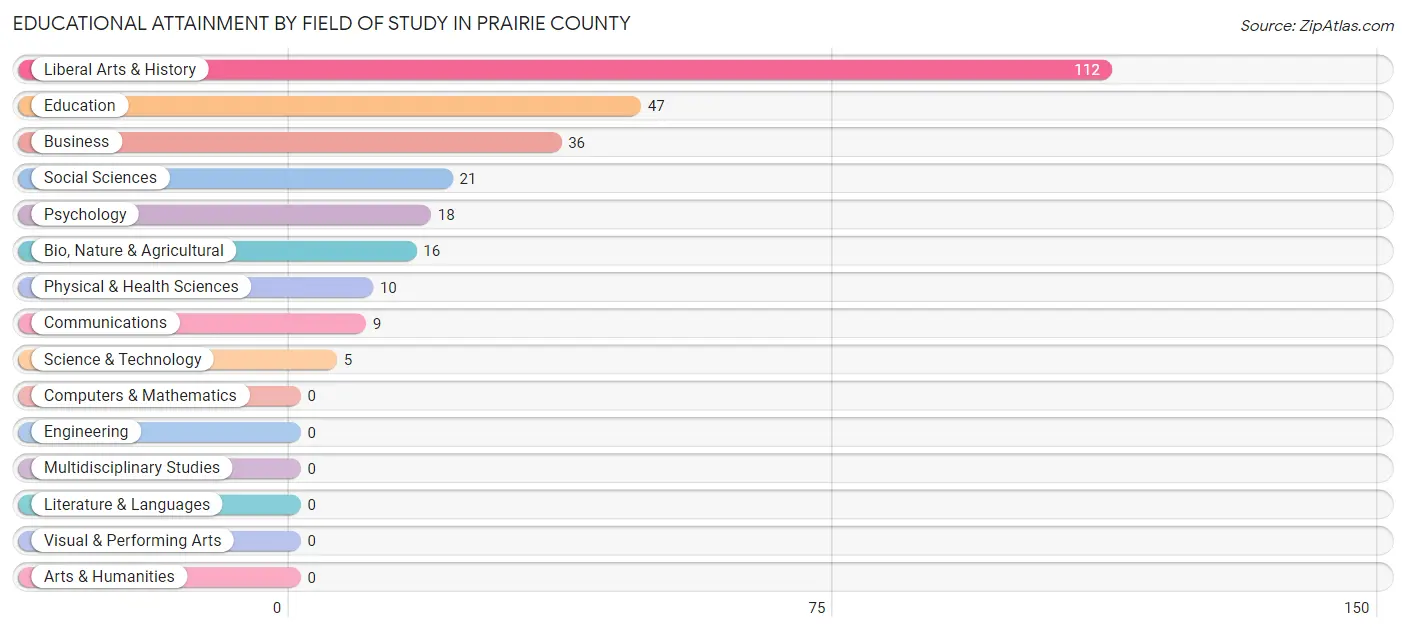
| Field of Study | # Graduates | % Graduates |
| Computers & Mathematics | 0 | 0.0% |
| Bio, Nature & Agricultural | 16 | 5.8% |
| Physical & Health Sciences | 10 | 3.6% |
| Psychology | 18 | 6.6% |
| Social Sciences | 21 | 7.7% |
| Engineering | 0 | 0.0% |
| Multidisciplinary Studies | 0 | 0.0% |
| Science & Technology | 5 | 1.8% |
| Business | 36 | 13.1% |
| Education | 47 | 17.2% |
| Literature & Languages | 0 | 0.0% |
| Liberal Arts & History | 112 | 40.9% |
| Visual & Performing Arts | 0 | 0.0% |
| Communications | 9 | 3.3% |
| Arts & Humanities | 0 | 0.0% |
| Total | 274 | 100.0% |
Transportation & Commute in Prairie County
Vehicle Availability by Sex in Prairie County
The most prevalent vehicle ownership categories in Prairie County are males with 3 vehicles (113, accounting for 33.9%) and females with 3 vehicles (40, making up 51.6%).
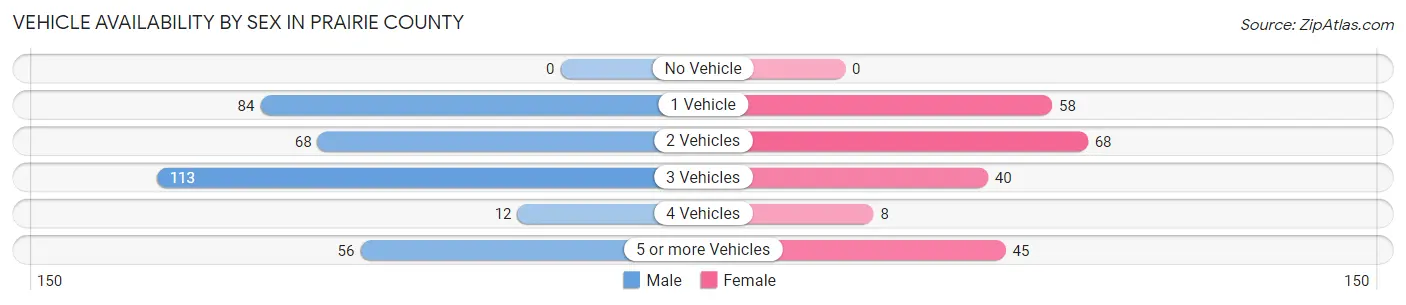
| Vehicles Available | Male | Female |
| No Vehicle | 0 (0.0%) | 0 (0.0%) |
| 1 Vehicle | 84 (25.2%) | 58 (26.5%) |
| 2 Vehicles | 68 (20.4%) | 68 (31.0%) |
| 3 Vehicles | 113 (33.9%) | 40 (18.3%) |
| 4 Vehicles | 12 (3.6%) | 8 (3.6%) |
| 5 or more Vehicles | 56 (16.8%) | 45 (20.5%) |
| Total | 333 (100.0%) | 219 (100.0%) |
Commute Time in Prairie County
The most frequently occuring commute durations in Prairie County are less than 5 minutes (155 commuters, 37.0%), 5 to 9 minutes (83 commuters, 19.8%), and 30 to 34 minutes (55 commuters, 13.1%).
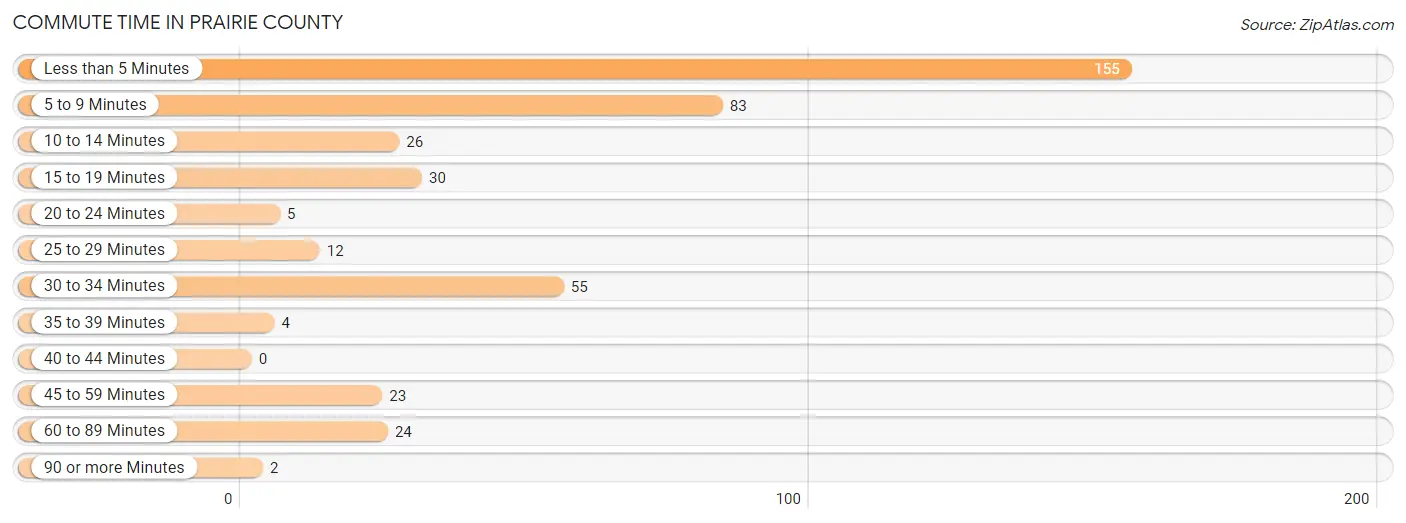
| Commute Time | # Commuters | % Commuters |
| Less than 5 Minutes | 155 | 37.0% |
| 5 to 9 Minutes | 83 | 19.8% |
| 10 to 14 Minutes | 26 | 6.2% |
| 15 to 19 Minutes | 30 | 7.2% |
| 20 to 24 Minutes | 5 | 1.2% |
| 25 to 29 Minutes | 12 | 2.9% |
| 30 to 34 Minutes | 55 | 13.1% |
| 35 to 39 Minutes | 4 | 0.9% |
| 40 to 44 Minutes | 0 | 0.0% |
| 45 to 59 Minutes | 23 | 5.5% |
| 60 to 89 Minutes | 24 | 5.7% |
| 90 or more Minutes | 2 | 0.5% |
Commute Time by Sex in Prairie County
The most common commute times in Prairie County are less than 5 minutes (130 commuters, 49.8%) for males and 5 to 9 minutes (45 commuters, 28.5%) for females.
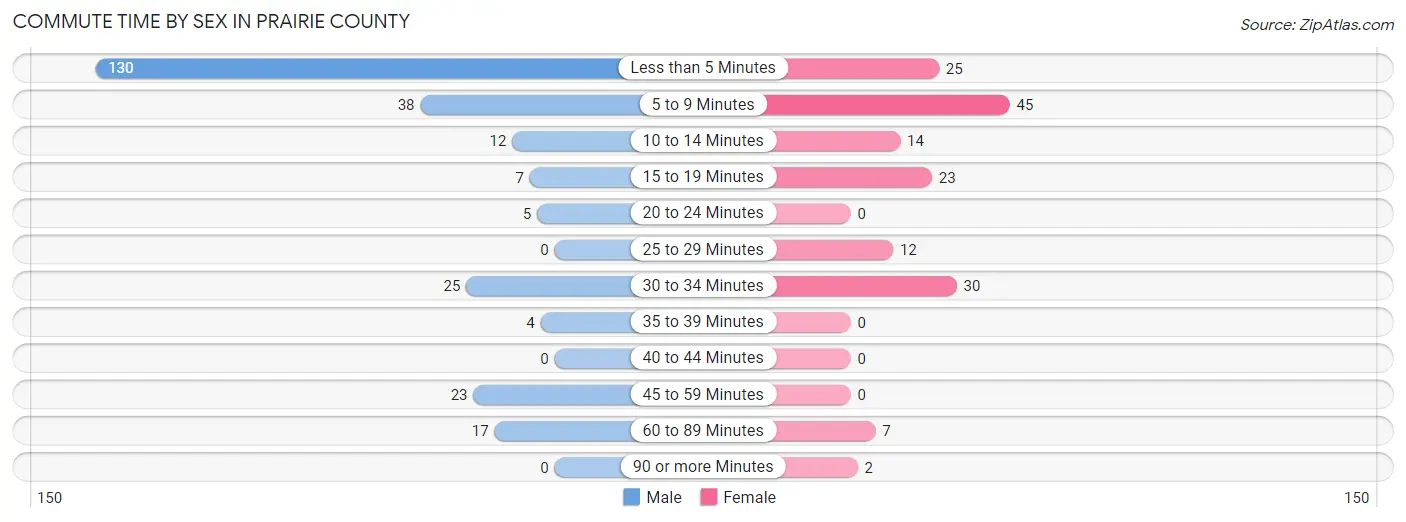
| Commute Time | Male | Female |
| Less than 5 Minutes | 130 (49.8%) | 25 (15.8%) |
| 5 to 9 Minutes | 38 (14.6%) | 45 (28.5%) |
| 10 to 14 Minutes | 12 (4.6%) | 14 (8.9%) |
| 15 to 19 Minutes | 7 (2.7%) | 23 (14.6%) |
| 20 to 24 Minutes | 5 (1.9%) | 0 (0.0%) |
| 25 to 29 Minutes | 0 (0.0%) | 12 (7.6%) |
| 30 to 34 Minutes | 25 (9.6%) | 30 (19.0%) |
| 35 to 39 Minutes | 4 (1.5%) | 0 (0.0%) |
| 40 to 44 Minutes | 0 (0.0%) | 0 (0.0%) |
| 45 to 59 Minutes | 23 (8.8%) | 0 (0.0%) |
| 60 to 89 Minutes | 17 (6.5%) | 7 (4.4%) |
| 90 or more Minutes | 0 (0.0%) | 2 (1.3%) |
Time of Departure to Work by Sex in Prairie County
The most frequent times of departure to work in Prairie County are 7:00 AM to 7:29 AM (95, 36.4%) for males and 7:30 AM to 7:59 AM (66, 41.8%) for females.
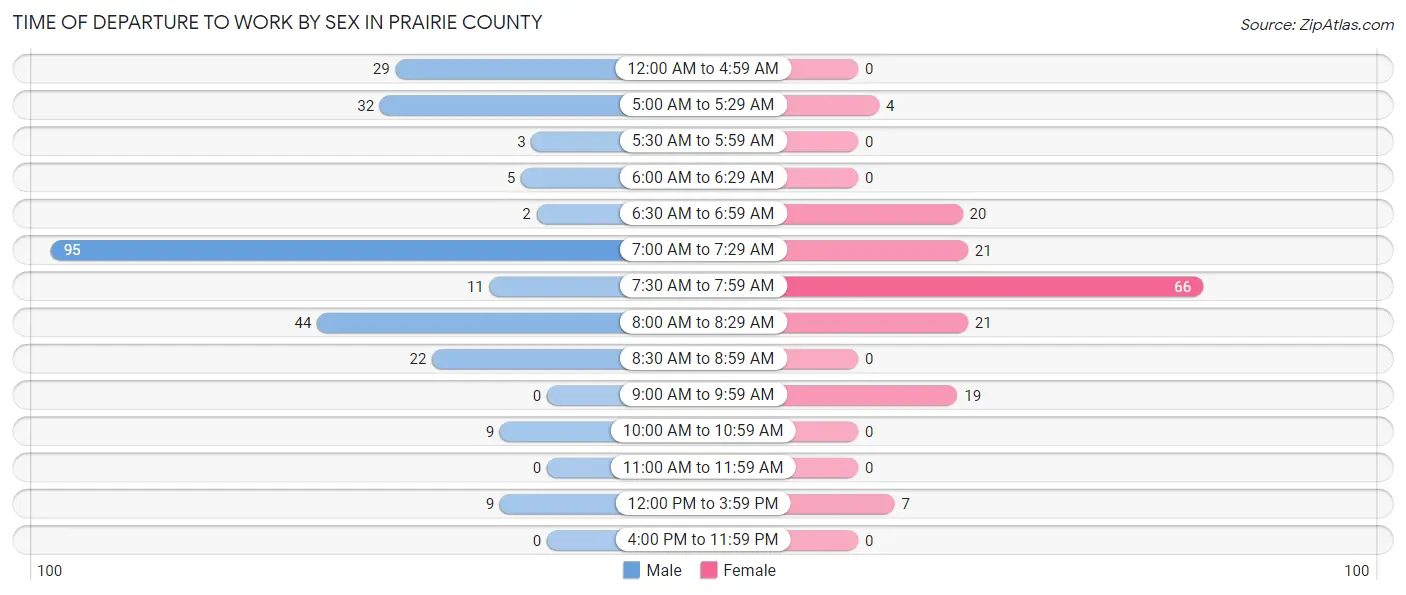
| Time of Departure | Male | Female |
| 12:00 AM to 4:59 AM | 29 (11.1%) | 0 (0.0%) |
| 5:00 AM to 5:29 AM | 32 (12.3%) | 4 (2.5%) |
| 5:30 AM to 5:59 AM | 3 (1.1%) | 0 (0.0%) |
| 6:00 AM to 6:29 AM | 5 (1.9%) | 0 (0.0%) |
| 6:30 AM to 6:59 AM | 2 (0.8%) | 20 (12.7%) |
| 7:00 AM to 7:29 AM | 95 (36.4%) | 21 (13.3%) |
| 7:30 AM to 7:59 AM | 11 (4.2%) | 66 (41.8%) |
| 8:00 AM to 8:29 AM | 44 (16.9%) | 21 (13.3%) |
| 8:30 AM to 8:59 AM | 22 (8.4%) | 0 (0.0%) |
| 9:00 AM to 9:59 AM | 0 (0.0%) | 19 (12.0%) |
| 10:00 AM to 10:59 AM | 9 (3.5%) | 0 (0.0%) |
| 11:00 AM to 11:59 AM | 0 (0.0%) | 0 (0.0%) |
| 12:00 PM to 3:59 PM | 9 (3.5%) | 7 (4.4%) |
| 4:00 PM to 11:59 PM | 0 (0.0%) | 0 (0.0%) |
| Total | 261 (100.0%) | 158 (100.0%) |
Housing Occupancy in Prairie County
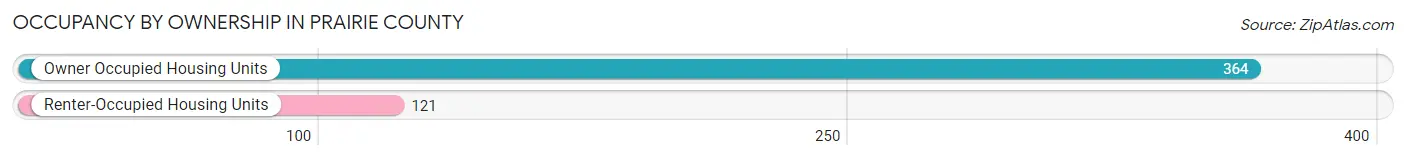
Occupancy by Ownership in Prairie County
Of the total 485 dwellings in Prairie County, owner-occupied units account for 364 (75.0%), while renter-occupied units make up 121 (24.9%).
| Occupancy | # Housing Units | % Housing Units |
| Owner Occupied Housing Units | 364 | 75.0% |
| Renter-Occupied Housing Units | 121 | 24.9% |
| Total Occupied Housing Units | 485 | 100.0% |
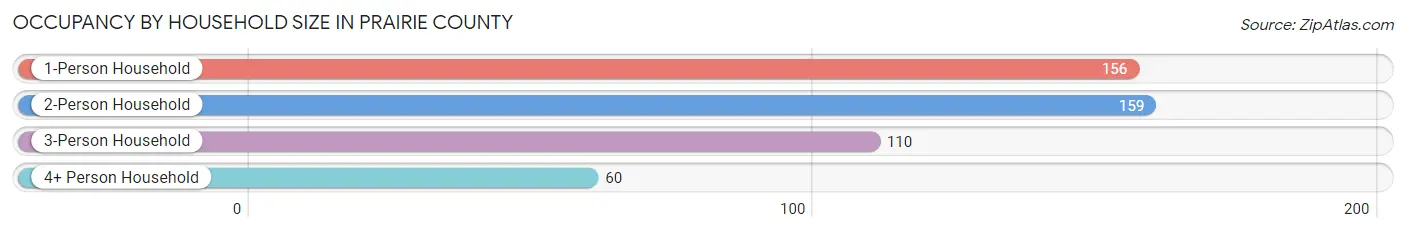
Occupancy by Household Size in Prairie County
| Household Size | # Housing Units | % Housing Units |
| 1-Person Household | 156 | 32.2% |
| 2-Person Household | 159 | 32.8% |
| 3-Person Household | 110 | 22.7% |
| 4+ Person Household | 60 | 12.4% |
| Total Housing Units | 485 | 100.0% |
Occupancy by Ownership by Household Size in Prairie County
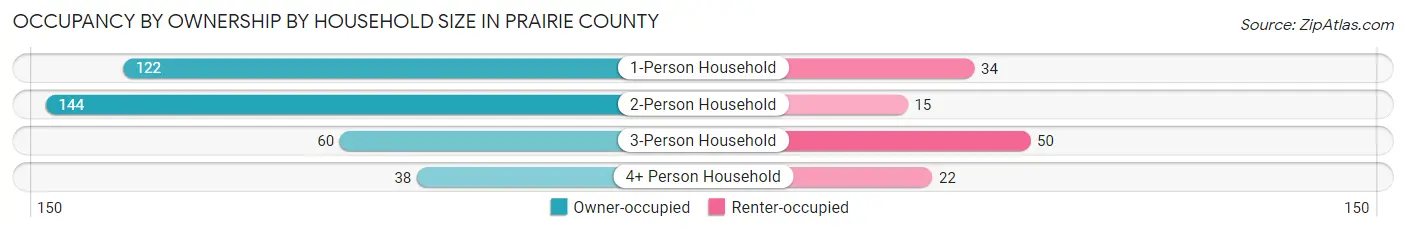
| Household Size | Owner-occupied | Renter-occupied |
| 1-Person Household | 122 (78.2%) | 34 (21.8%) |
| 2-Person Household | 144 (90.6%) | 15 (9.4%) |
| 3-Person Household | 60 (54.5%) | 50 (45.5%) |
| 4+ Person Household | 38 (63.3%) | 22 (36.7%) |
| Total Housing Units | 364 (75.0%) | 121 (24.9%) |
Occupancy by Educational Attainment in Prairie County
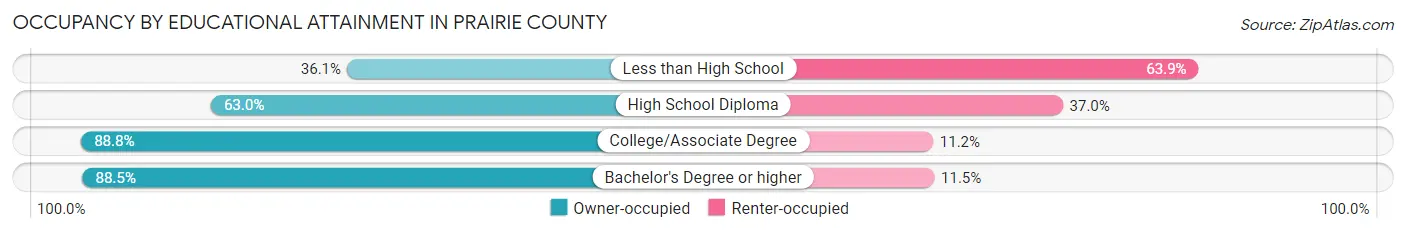
| Household Size | Owner-occupied | Renter-occupied |
| Less than High School | 13 (36.1%) | 23 (63.9%) |
| High School Diploma | 116 (63.0%) | 68 (37.0%) |
| College/Associate Degree | 158 (88.8%) | 20 (11.2%) |
| Bachelor's Degree or higher | 77 (88.5%) | 10 (11.5%) |
Occupancy by Age of Householder in Prairie County
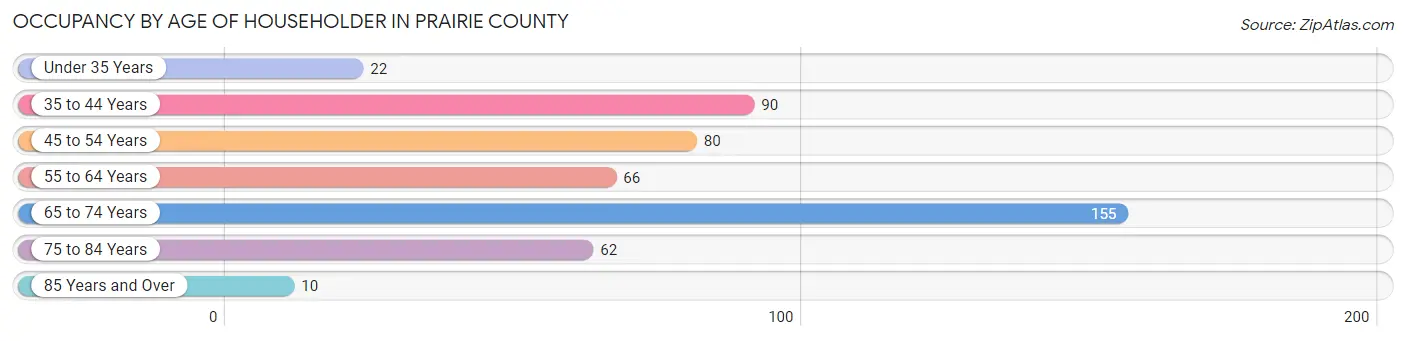
| Age Bracket | # Households | % Households |
| Under 35 Years | 22 | 4.5% |
| 35 to 44 Years | 90 | 18.6% |
| 45 to 54 Years | 80 | 16.5% |
| 55 to 64 Years | 66 | 13.6% |
| 65 to 74 Years | 155 | 32.0% |
| 75 to 84 Years | 62 | 12.8% |
| 85 Years and Over | 10 | 2.1% |
| Total | 485 | 100.0% |
Housing Finances in Prairie County
Median Income by Occupancy in Prairie County
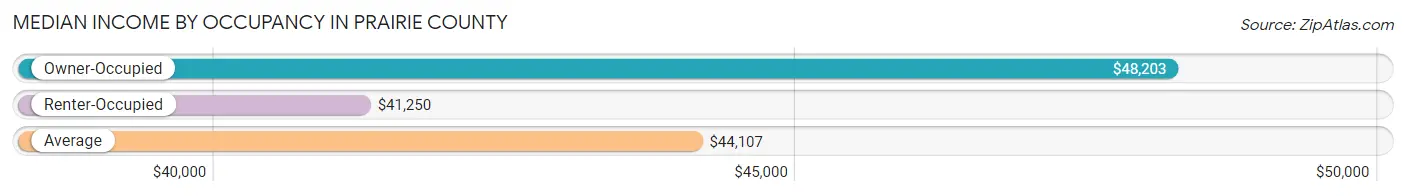
| Occupancy Type | # Households | Median Income |
| Owner-Occupied | 364 (75.0%) | $48,203 |
| Renter-Occupied | 121 (24.9%) | $41,250 |
| Average | 485 (100.0%) | $44,107 |
Occupancy by Householder Income Bracket in Prairie County
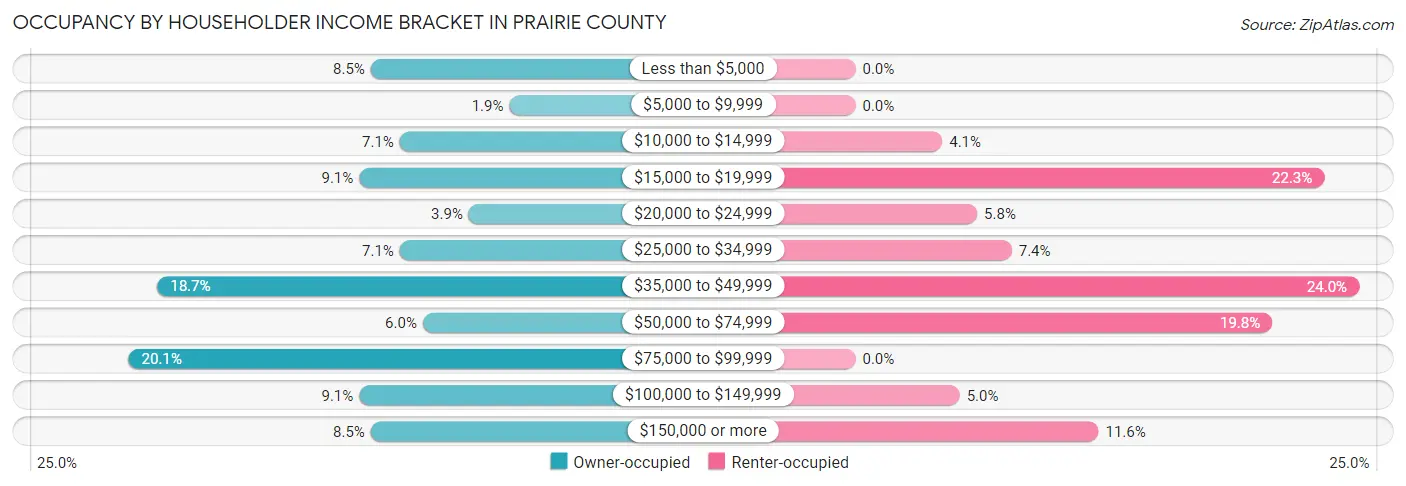
| Income Bracket | Owner-occupied | Renter-occupied |
| Less than $5,000 | 31 (8.5%) | 0 (0.0%) |
| $5,000 to $9,999 | 7 (1.9%) | 0 (0.0%) |
| $10,000 to $14,999 | 26 (7.1%) | 5 (4.1%) |
| $15,000 to $19,999 | 33 (9.1%) | 27 (22.3%) |
| $20,000 to $24,999 | 14 (3.8%) | 7 (5.8%) |
| $25,000 to $34,999 | 26 (7.1%) | 9 (7.4%) |
| $35,000 to $49,999 | 68 (18.7%) | 29 (24.0%) |
| $50,000 to $74,999 | 22 (6.0%) | 24 (19.8%) |
| $75,000 to $99,999 | 73 (20.1%) | 0 (0.0%) |
| $100,000 to $149,999 | 33 (9.1%) | 6 (5.0%) |
| $150,000 or more | 31 (8.5%) | 14 (11.6%) |
| Total | 364 (100.0%) | 121 (100.0%) |
Monthly Housing Cost Tiers in Prairie County
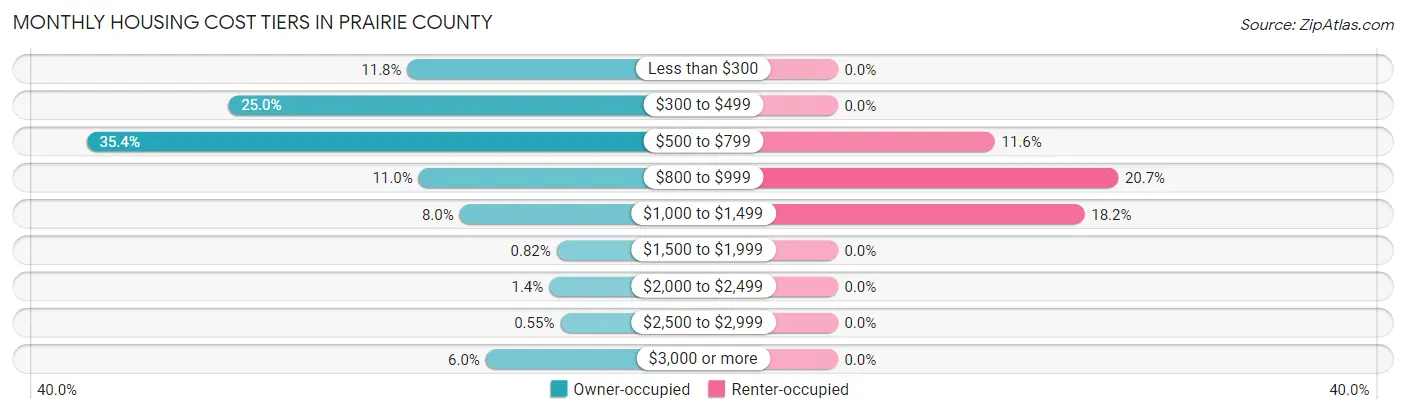
| Monthly Cost | Owner-occupied | Renter-occupied |
| Less than $300 | 43 (11.8%) | 0 (0.0%) |
| $300 to $499 | 91 (25.0%) | 0 (0.0%) |
| $500 to $799 | 129 (35.4%) | 14 (11.6%) |
| $800 to $999 | 40 (11.0%) | 25 (20.7%) |
| $1,000 to $1,499 | 29 (8.0%) | 22 (18.2%) |
| $1,500 to $1,999 | 3 (0.8%) | 0 (0.0%) |
| $2,000 to $2,499 | 5 (1.4%) | 0 (0.0%) |
| $2,500 to $2,999 | 2 (0.5%) | 0 (0.0%) |
| $3,000 or more | 22 (6.0%) | 0 (0.0%) |
| Total | 364 (100.0%) | 121 (100.0%) |
Physical Housing Characteristics in Prairie County
Housing Structures in Prairie County
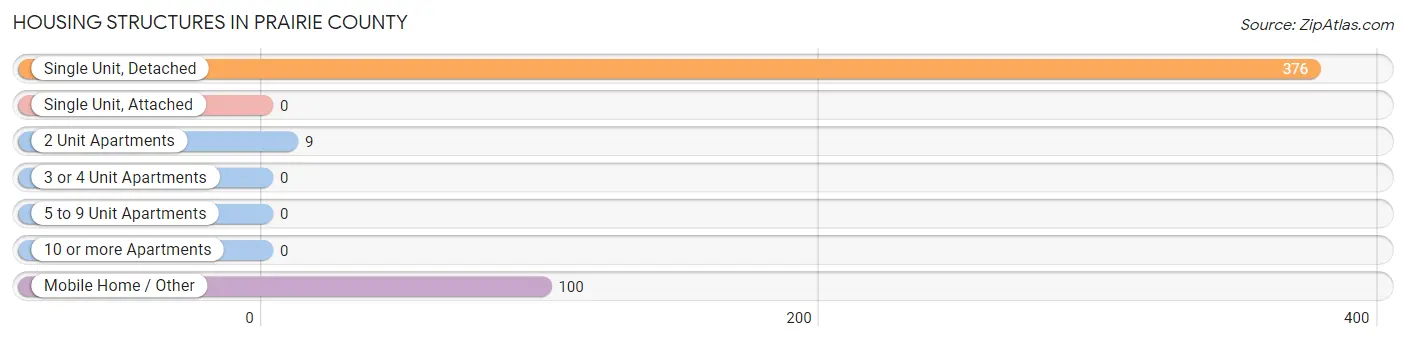
| Structure Type | # Housing Units | % Housing Units |
| Single Unit, Detached | 376 | 77.5% |
| Single Unit, Attached | 0 | 0.0% |
| 2 Unit Apartments | 9 | 1.9% |
| 3 or 4 Unit Apartments | 0 | 0.0% |
| 5 to 9 Unit Apartments | 0 | 0.0% |
| 10 or more Apartments | 0 | 0.0% |
| Mobile Home / Other | 100 | 20.6% |
| Total | 485 | 100.0% |
Housing Structures by Occupancy in Prairie County
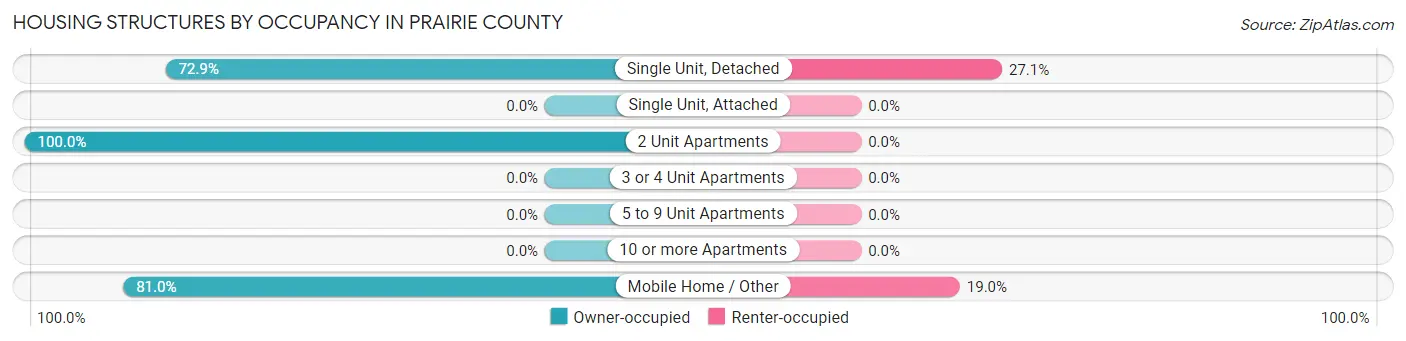
| Structure Type | Owner-occupied | Renter-occupied |
| Single Unit, Detached | 274 (72.9%) | 102 (27.1%) |
| Single Unit, Attached | 0 (0.0%) | 0 (0.0%) |
| 2 Unit Apartments | 9 (100.0%) | 0 (0.0%) |
| 3 or 4 Unit Apartments | 0 (0.0%) | 0 (0.0%) |
| 5 to 9 Unit Apartments | 0 (0.0%) | 0 (0.0%) |
| 10 or more Apartments | 0 (0.0%) | 0 (0.0%) |
| Mobile Home / Other | 81 (81.0%) | 19 (19.0%) |
| Total | 364 (75.0%) | 121 (24.9%) |
Housing Structures by Number of Rooms in Prairie County
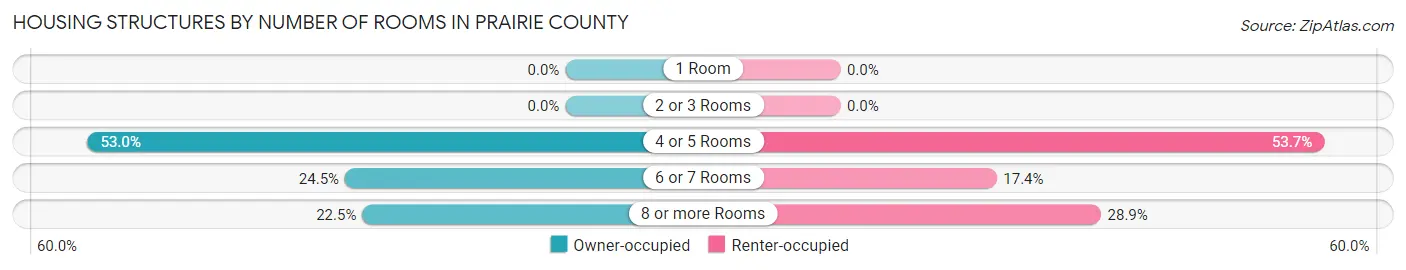
| Number of Rooms | Owner-occupied | Renter-occupied |
| 1 Room | 0 (0.0%) | 0 (0.0%) |
| 2 or 3 Rooms | 0 (0.0%) | 0 (0.0%) |
| 4 or 5 Rooms | 193 (53.0%) | 65 (53.7%) |
| 6 or 7 Rooms | 89 (24.4%) | 21 (17.4%) |
| 8 or more Rooms | 82 (22.5%) | 35 (28.9%) |
| Total | 364 (100.0%) | 121 (100.0%) |
Housing Structure by Heating Type in Prairie County
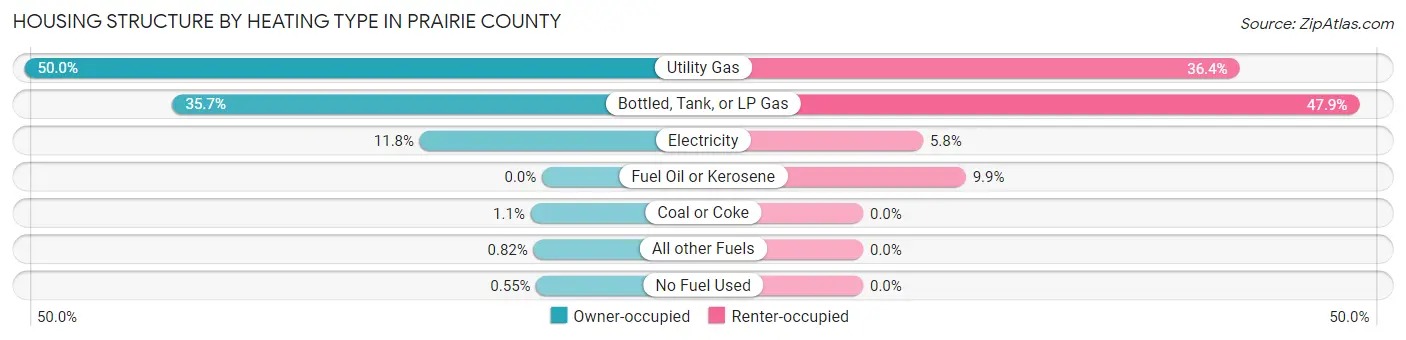
| Heating Type | Owner-occupied | Renter-occupied |
| Utility Gas | 182 (50.0%) | 44 (36.4%) |
| Bottled, Tank, or LP Gas | 130 (35.7%) | 58 (47.9%) |
| Electricity | 43 (11.8%) | 7 (5.8%) |
| Fuel Oil or Kerosene | 0 (0.0%) | 12 (9.9%) |
| Coal or Coke | 4 (1.1%) | 0 (0.0%) |
| All other Fuels | 3 (0.8%) | 0 (0.0%) |
| No Fuel Used | 2 (0.5%) | 0 (0.0%) |
| Total | 364 (100.0%) | 121 (100.0%) |
Household Vehicle Usage in Prairie County
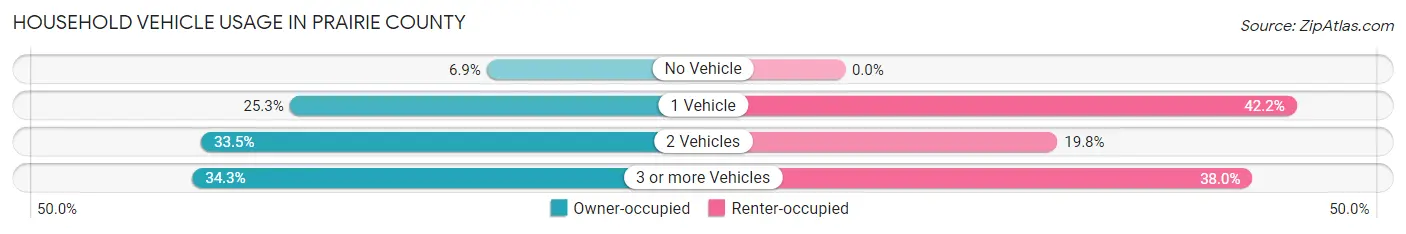
| Vehicles per Household | Owner-occupied | Renter-occupied |
| No Vehicle | 25 (6.9%) | 0 (0.0%) |
| 1 Vehicle | 92 (25.3%) | 51 (42.1%) |
| 2 Vehicles | 122 (33.5%) | 24 (19.8%) |
| 3 or more Vehicles | 125 (34.3%) | 46 (38.0%) |
| Total | 364 (100.0%) | 121 (100.0%) |
Real Estate & Mortgages in Prairie County
Real Estate and Mortgage Overview in Prairie County
| Characteristic | Without Mortgage | With Mortgage |
| Housing Units | 265 | 99 |
| Median Property Value | $147,300 | $0 |
| Median Household Income | $37,625 | $4 |
| Monthly Housing Costs | $497 | $0 |
| Real Estate Taxes | $1,388 | $0 |
Property Value by Mortgage Status in Prairie County
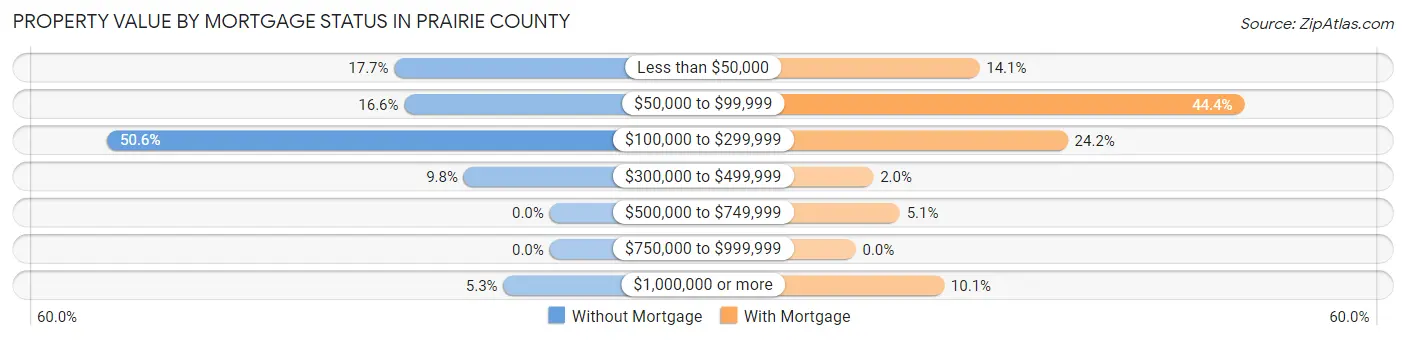
| Property Value | Without Mortgage | With Mortgage |
| Less than $50,000 | 47 (17.7%) | 14 (14.1%) |
| $50,000 to $99,999 | 44 (16.6%) | 44 (44.4%) |
| $100,000 to $299,999 | 134 (50.6%) | 24 (24.2%) |
| $300,000 to $499,999 | 26 (9.8%) | 2 (2.0%) |
| $500,000 to $749,999 | 0 (0.0%) | 5 (5.1%) |
| $750,000 to $999,999 | 0 (0.0%) | 0 (0.0%) |
| $1,000,000 or more | 14 (5.3%) | 10 (10.1%) |
| Total | 265 (100.0%) | 99 (100.0%) |
Household Income by Mortgage Status in Prairie County
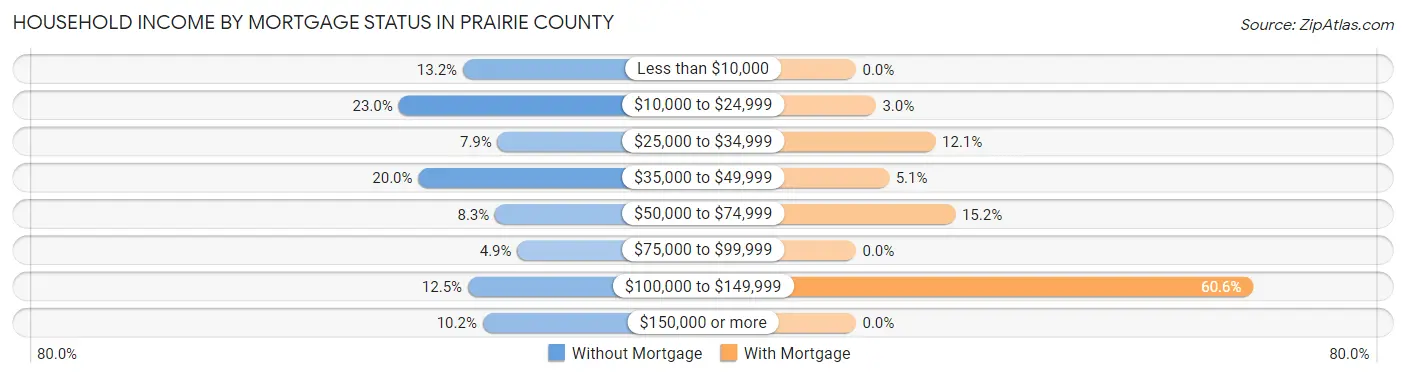
| Household Income | Without Mortgage | With Mortgage |
| Less than $10,000 | 35 (13.2%) | 0 (0.0%) |
| $10,000 to $24,999 | 61 (23.0%) | 3 (3.0%) |
| $25,000 to $34,999 | 21 (7.9%) | 12 (12.1%) |
| $35,000 to $49,999 | 53 (20.0%) | 5 (5.1%) |
| $50,000 to $74,999 | 22 (8.3%) | 15 (15.1%) |
| $75,000 to $99,999 | 13 (4.9%) | 0 (0.0%) |
| $100,000 to $149,999 | 33 (12.4%) | 60 (60.6%) |
| $150,000 or more | 27 (10.2%) | 0 (0.0%) |
| Total | 265 (100.0%) | 99 (100.0%) |
Property Value to Household Income Ratio in Prairie County
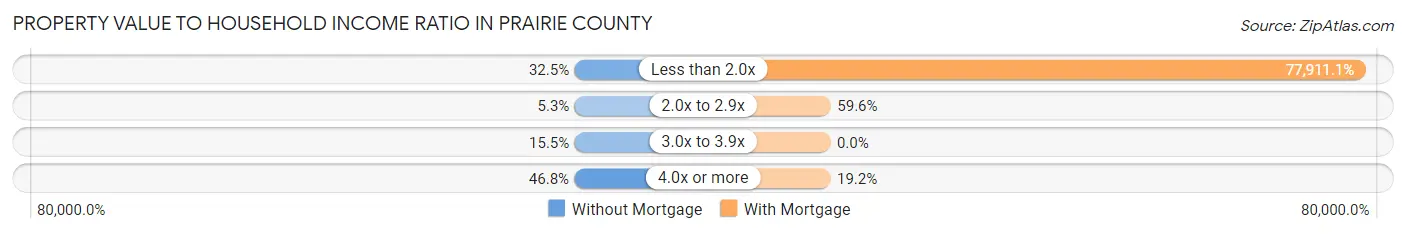
| Value-to-Income Ratio | Without Mortgage | With Mortgage |
| Less than 2.0x | 86 (32.5%) | 77,132 (77,911.1%) |
| 2.0x to 2.9x | 14 (5.3%) | 59 (59.6%) |
| 3.0x to 3.9x | 41 (15.5%) | 0 (0.0%) |
| 4.0x or more | 124 (46.8%) | 19 (19.2%) |
| Total | 265 (100.0%) | 99 (100.0%) |
Real Estate Taxes by Mortgage Status in Prairie County
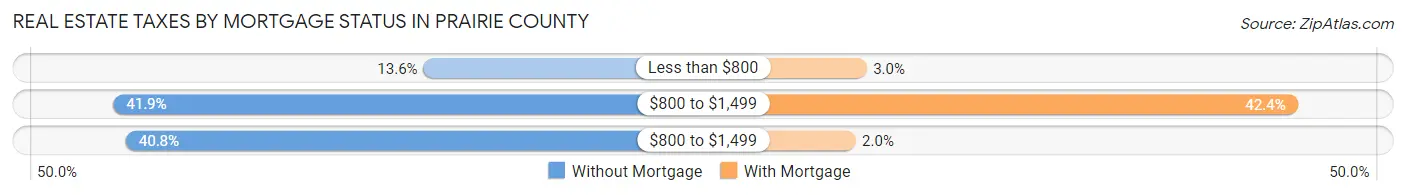
| Property Taxes | Without Mortgage | With Mortgage |
| Less than $800 | 36 (13.6%) | 3 (3.0%) |
| $800 to $1,499 | 111 (41.9%) | 42 (42.4%) |
| $800 to $1,499 | 108 (40.7%) | 2 (2.0%) |
| Total | 265 (100.0%) | 99 (100.0%) |
Health & Disability in Prairie County
Health Insurance Coverage by Age in Prairie County
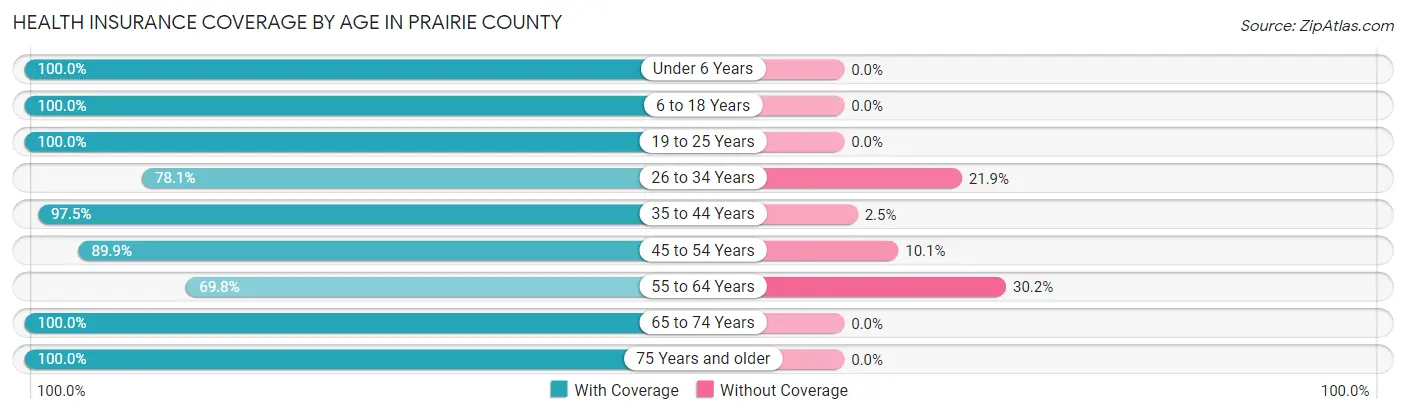
| Age Bracket | With Coverage | Without Coverage |
| Under 6 Years | 66 (100.0%) | 0 (0.0%) |
| 6 to 18 Years | 241 (100.0%) | 0 (0.0%) |
| 19 to 25 Years | 26 (100.0%) | 0 (0.0%) |
| 26 to 34 Years | 57 (78.1%) | 16 (21.9%) |
| 35 to 44 Years | 195 (97.5%) | 5 (2.5%) |
| 45 to 54 Years | 125 (89.9%) | 14 (10.1%) |
| 55 to 64 Years | 88 (69.8%) | 38 (30.2%) |
| 65 to 74 Years | 248 (100.0%) | 0 (0.0%) |
| 75 Years and older | 141 (100.0%) | 0 (0.0%) |
| Total | 1,187 (94.2%) | 73 (5.8%) |
Health Insurance Coverage by Citizenship Status in Prairie County
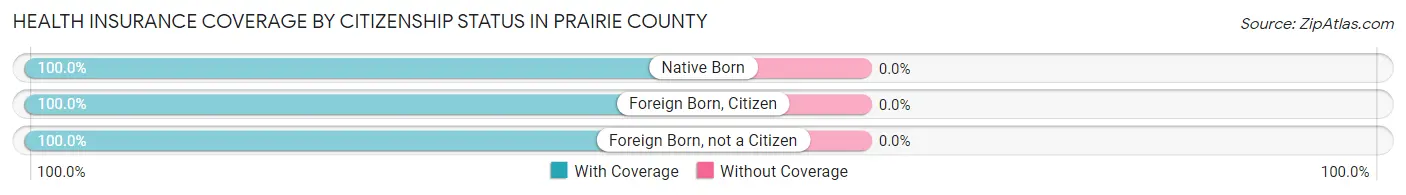
| Citizenship Status | With Coverage | Without Coverage |
| Native Born | 66 (100.0%) | 0 (0.0%) |
| Foreign Born, Citizen | 241 (100.0%) | 0 (0.0%) |
| Foreign Born, not a Citizen | 26 (100.0%) | 0 (0.0%) |
Health Insurance Coverage by Household Income in Prairie County
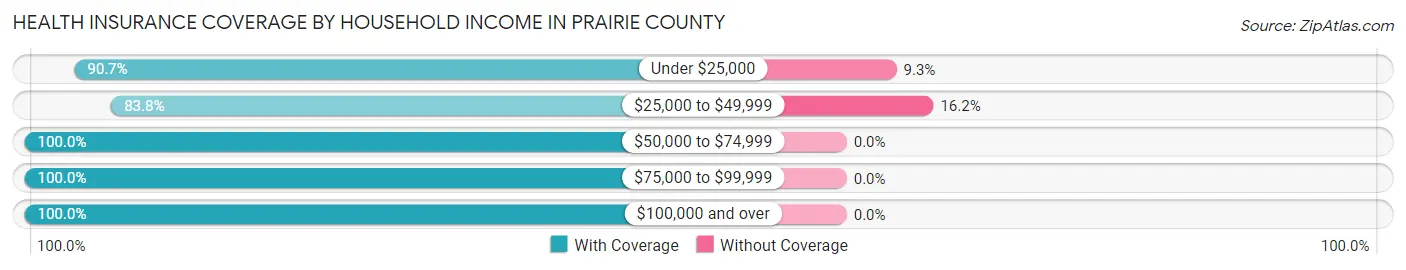
| Household Income | With Coverage | Without Coverage |
| Under $25,000 | 272 (90.7%) | 28 (9.3%) |
| $25,000 to $49,999 | 227 (83.8%) | 44 (16.2%) |
| $50,000 to $74,999 | 225 (100.0%) | 0 (0.0%) |
| $75,000 to $99,999 | 199 (100.0%) | 0 (0.0%) |
| $100,000 and over | 260 (100.0%) | 0 (0.0%) |
Public vs Private Health Insurance Coverage by Age in Prairie County
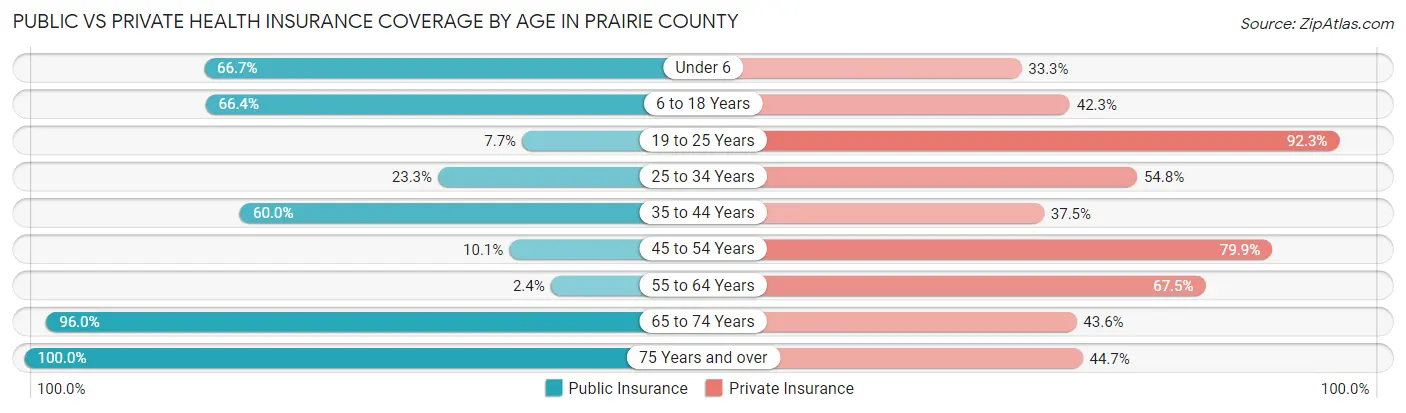
| Age Bracket | Public Insurance | Private Insurance |
| Under 6 | 44 (66.7%) | 22 (33.3%) |
| 6 to 18 Years | 160 (66.4%) | 102 (42.3%) |
| 19 to 25 Years | 2 (7.7%) | 24 (92.3%) |
| 25 to 34 Years | 17 (23.3%) | 40 (54.8%) |
| 35 to 44 Years | 120 (60.0%) | 75 (37.5%) |
| 45 to 54 Years | 14 (10.1%) | 111 (79.9%) |
| 55 to 64 Years | 3 (2.4%) | 85 (67.5%) |
| 65 to 74 Years | 238 (96.0%) | 108 (43.5%) |
| 75 Years and over | 141 (100.0%) | 63 (44.7%) |
| Total | 739 (58.7%) | 630 (50.0%) |
Disability Status by Sex by Age in Prairie County
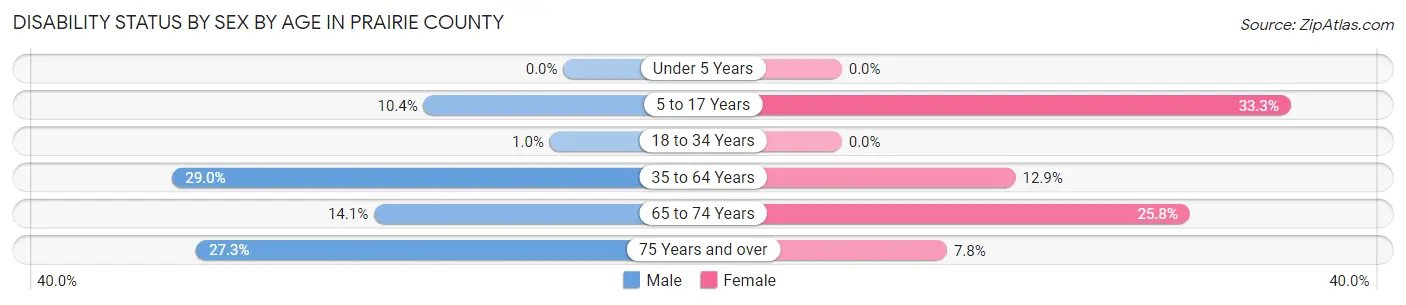
| Age Bracket | Male | Female |
| Under 5 Years | 0 (0.0%) | 0 (0.0%) |
| 5 to 17 Years | 11 (10.4%) | 45 (33.3%) |
| 18 to 34 Years | 1 (1.0%) | 0 (0.0%) |
| 35 to 64 Years | 72 (29.0%) | 28 (12.9%) |
| 65 to 74 Years | 18 (14.1%) | 31 (25.8%) |
| 75 Years and over | 21 (27.3%) | 5 (7.8%) |
Disability Class by Sex by Age in Prairie County
Disability Class: Hearing Difficulty
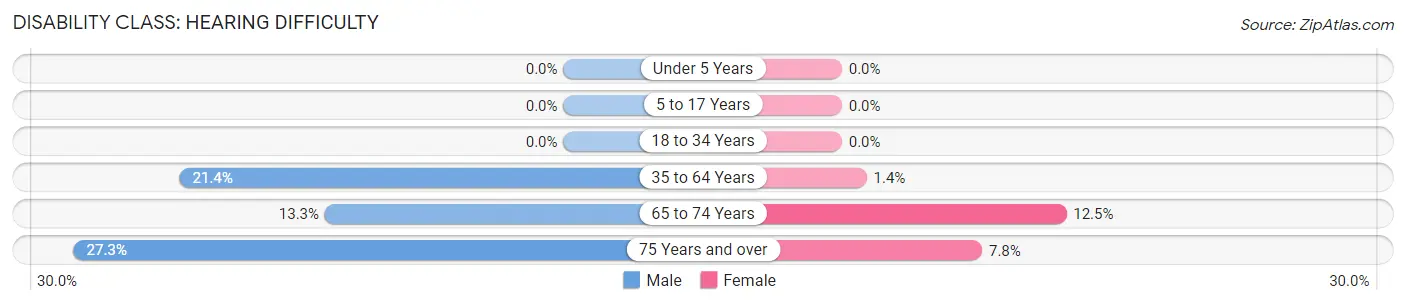
| Age Bracket | Male | Female |
| Under 5 Years | 0 (0.0%) | 0 (0.0%) |
| 5 to 17 Years | 0 (0.0%) | 0 (0.0%) |
| 18 to 34 Years | 0 (0.0%) | 0 (0.0%) |
| 35 to 64 Years | 53 (21.4%) | 3 (1.4%) |
| 65 to 74 Years | 17 (13.3%) | 15 (12.5%) |
| 75 Years and over | 21 (27.3%) | 5 (7.8%) |
Disability Class: Vision Difficulty
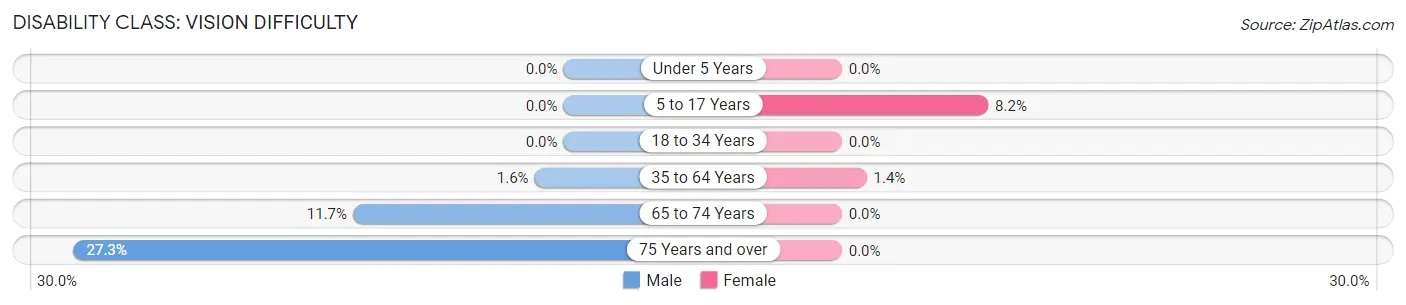
| Age Bracket | Male | Female |
| Under 5 Years | 0 (0.0%) | 0 (0.0%) |
| 5 to 17 Years | 0 (0.0%) | 11 (8.2%) |
| 18 to 34 Years | 0 (0.0%) | 0 (0.0%) |
| 35 to 64 Years | 4 (1.6%) | 3 (1.4%) |
| 65 to 74 Years | 15 (11.7%) | 0 (0.0%) |
| 75 Years and over | 21 (27.3%) | 0 (0.0%) |
Disability Class: Cognitive Difficulty
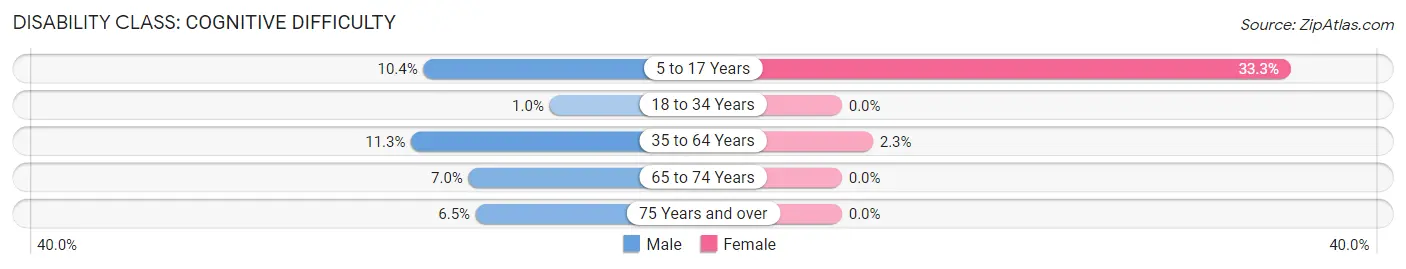
| Age Bracket | Male | Female |
| 5 to 17 Years | 11 (10.4%) | 45 (33.3%) |
| 18 to 34 Years | 1 (1.0%) | 0 (0.0%) |
| 35 to 64 Years | 28 (11.3%) | 5 (2.3%) |
| 65 to 74 Years | 9 (7.0%) | 0 (0.0%) |
| 75 Years and over | 5 (6.5%) | 0 (0.0%) |
Disability Class: Ambulatory Difficulty
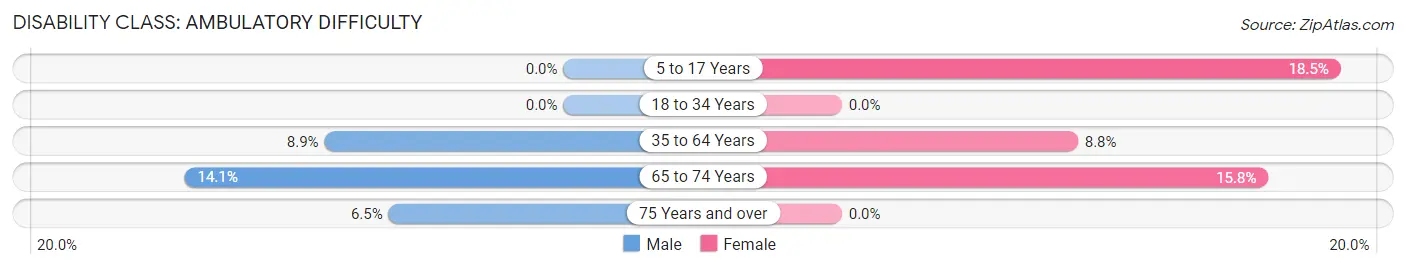
| Age Bracket | Male | Female |
| 5 to 17 Years | 0 (0.0%) | 25 (18.5%) |
| 18 to 34 Years | 0 (0.0%) | 0 (0.0%) |
| 35 to 64 Years | 22 (8.9%) | 19 (8.8%) |
| 65 to 74 Years | 18 (14.1%) | 19 (15.8%) |
| 75 Years and over | 5 (6.5%) | 0 (0.0%) |
Disability Class: Self-Care Difficulty
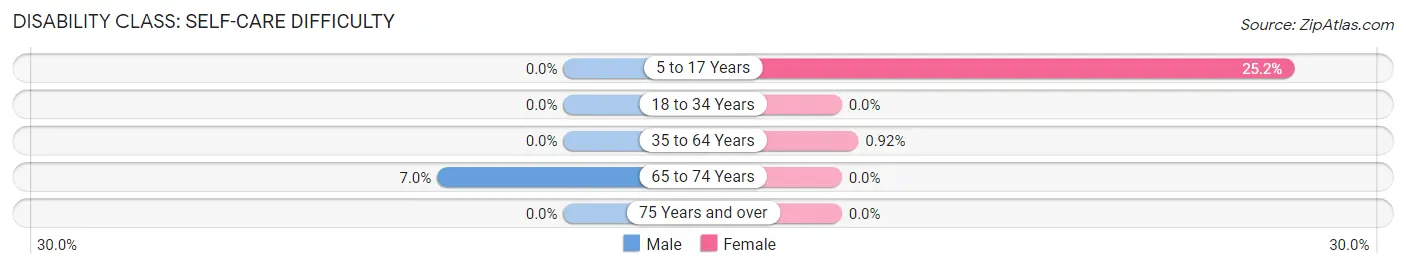
| Age Bracket | Male | Female |
| 5 to 17 Years | 0 (0.0%) | 34 (25.2%) |
| 18 to 34 Years | 0 (0.0%) | 0 (0.0%) |
| 35 to 64 Years | 0 (0.0%) | 2 (0.9%) |
| 65 to 74 Years | 9 (7.0%) | 0 (0.0%) |
| 75 Years and over | 0 (0.0%) | 0 (0.0%) |
Technology Access in Prairie County
Computing Device Access in Prairie County
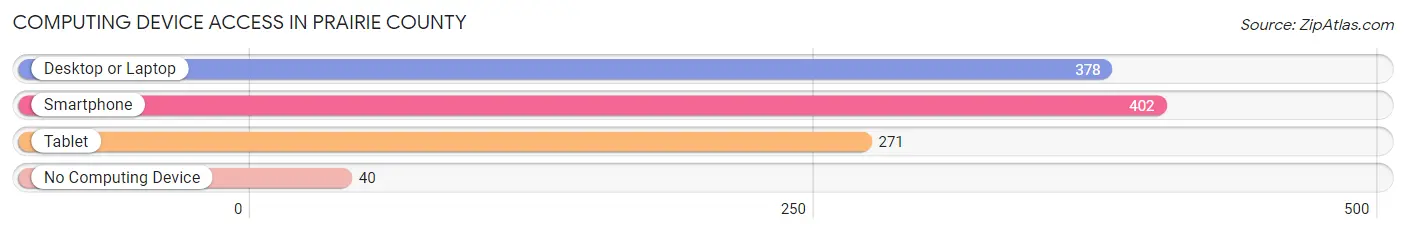
| Device Type | # Households | % Households |
| Desktop or Laptop | 378 | 77.9% |
| Smartphone | 402 | 82.9% |
| Tablet | 271 | 55.9% |
| No Computing Device | 40 | 8.3% |
| Total | 485 | 100.0% |
Internet Access in Prairie County
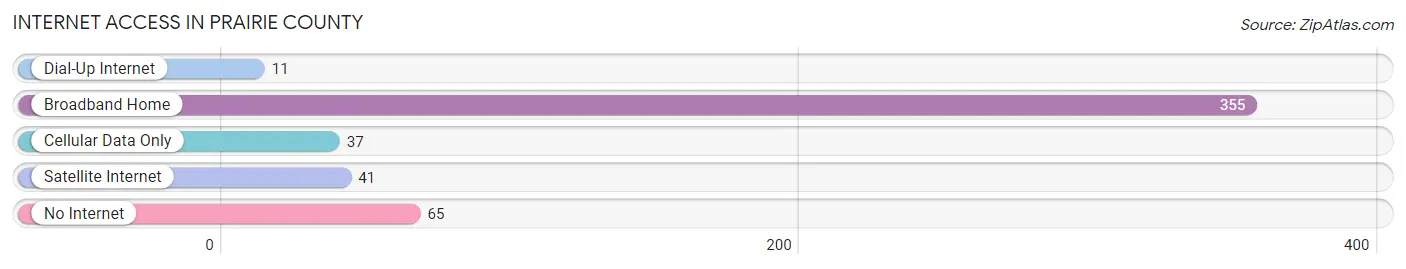
| Internet Type | # Households | % Households |
| Dial-Up Internet | 11 | 2.3% |
| Broadband Home | 355 | 73.2% |
| Cellular Data Only | 37 | 7.6% |
| Satellite Internet | 41 | 8.5% |
| No Internet | 65 | 13.4% |
| Total | 485 | 100.0% |
Prairie County Summary
Prairie County, Montana is located in the north-central part of the state, and is bordered by the Missouri River to the east, the Yellowstone River to the south, and the Musselshell River to the west. The county seat is Terry, and the largest city is Terry. Prairie County is part of the Great Plains region of Montana, and is home to a variety of wildlife, including deer, elk, antelope, and bighorn sheep.
History
Prairie County was established in 1887, and was named for the prairie-like landscape of the area. The county was originally inhabited by the Crow and Sioux Native American tribes, who used the area for hunting and gathering. The first settlers in the area were ranchers, who established homesteads in the late 1800s. The county was officially organized in 1889, and the first county seat was established in Terry.
Geography
Prairie County covers an area of 1,845 square miles, and is located in the north-central part of Montana. The county is bordered by the Missouri River to the east, the Yellowstone River to the south, and the Musselshell River to the west. The county is part of the Great Plains region of Montana, and is characterized by rolling hills, grasslands, and prairies. The highest point in the county is the summit of Big Baldy Mountain, which has an elevation of 4,945 feet.
Economy
The economy of Prairie County is largely based on agriculture and ranching. The county is home to a variety of crops, including wheat, barley, oats, and hay. Cattle ranching is also an important part of the local economy, and the county is home to a number of large ranches. Other industries in the county include oil and gas production, tourism, and manufacturing.
Demographics
As of the 2010 census, the population of Prairie County was 1,845, with a population density of 1 person per square mile. The median household income in the county was $37,917, and the median age was 44. The largest racial group in the county was White (97.2%), followed by Native American (1.2%), and Hispanic or Latino (0.7%).
Conclusion
Prairie County, Montana is a rural county located in the north-central part of the state. The county is home to a variety of wildlife, and is characterized by rolling hills, grasslands, and prairies. The economy of the county is largely based on agriculture and ranching, and the population is predominantly White. Prairie County is a beautiful and unique part of Montana, and is a great place to live and work.
Common Questions
What is the Total Population of Prairie County?
Total Population of Prairie County is 1,283.
What is the Total Male Population of Prairie County?
Total Male Population of Prairie County is 690.
What is the Total Female Population of Prairie County?
Total Female Population of Prairie County is 593.
What is the Ratio of Males per 100 Females in Prairie County?
There are 116.36 Males per 100 Females in Prairie County.
What is the Ratio of Females per 100 Males in Prairie County?
There are 85.94 Females per 100 Males in Prairie County.
What is the Median Population Age in Prairie County?
Median Population Age in Prairie County is 47.2 Years.
What is the Average Family Size in Prairie County
Average Family Size in Prairie County is 3.3 People.
What is the Average Household Size in Prairie County
Average Household Size in Prairie County is 2.6 People.
What is Per Capita Income in Prairie County?
Per Capita income in Prairie County is $28,287.
What is the Median Family Income in Prairie County?
Median Family Income in Prairie County is $68,405.
What is the Median Household income in Prairie County?
Median Household Income in Prairie County is $44,107.
What is Income or Wage Gap in Prairie County?
Income or Wage Gap in Prairie County is 62.9%.
Women in Prairie County earn 37.1 cents for every dollar earned by a man.
What is Inequality or Gini Index in Prairie County?
Inequality or Gini Index in Prairie County is 0.52.
How Large is the Labor Force in Prairie County?
There are 577 People in the Labor Forcein in Prairie County.
What is the Percentage of People in the Labor Force in Prairie County?
56.5% of People are in the Labor Force in Prairie County.
What is the Unemployment Rate in Prairie County?
Unemployment Rate in Prairie County is 2.9%.