Powder River County, MT
Powder River County Map
Powder River County Overview
1,773
TOTAL POPULATION
876
MALE POPULATION
897
FEMALE POPULATION
97.66
MALES / 100 FEMALES
102.40
FEMALES / 100 MALES
49.9
MEDIAN AGE
2.7
AVG FAMILY SIZE
2.3
AVG HOUSEHOLD SIZE
$38,588
PER CAPITA INCOME
$79,000
AVG FAMILY INCOME
$60,313
AVG HOUSEHOLD INCOME
16.8%
WAGE / INCOME GAP [ % ]
83.2¢/ $1
WAGE / INCOME GAP [ $ ]
0.47
INEQUALITY / GINI INDEX
918
LABOR FORCE [ PEOPLE ]
61.3%
PERCENT IN LABOR FORCE
1.0%
UNEMPLOYMENT RATE
Powder River County Area Codes
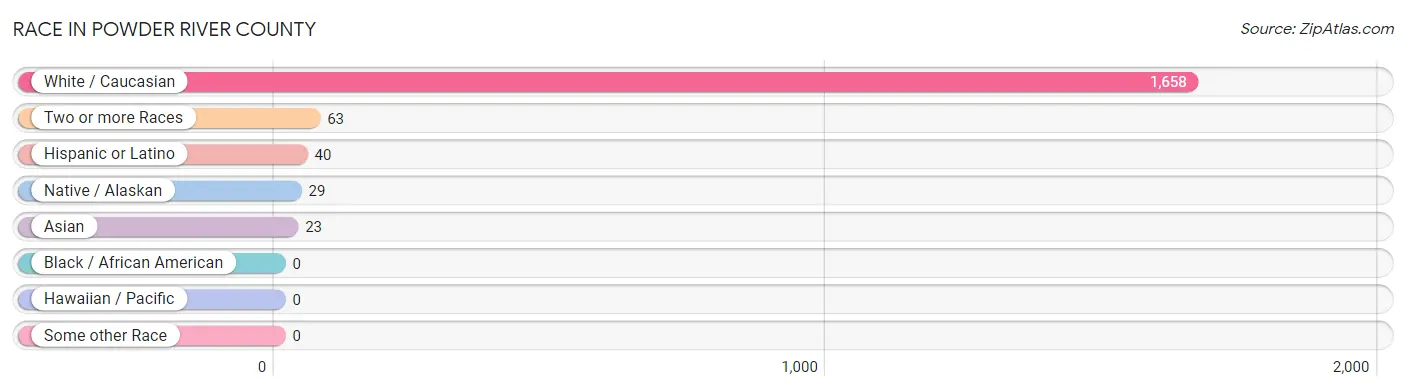
Race in Powder River County
The most populous races in Powder River County are White / Caucasian (1,658 | 93.5%), Two or more Races (63 | 3.5%), and Hispanic or Latino (40 | 2.3%).
| Race | # Population | % Population |
| Asian | 23 | 1.3% |
| Black / African American | 0 | 0.0% |
| Hawaiian / Pacific | 0 | 0.0% |
| Hispanic or Latino | 40 | 2.3% |
| Native / Alaskan | 29 | 1.6% |
| White / Caucasian | 1,658 | 93.5% |
| Two or more Races | 63 | 3.5% |
| Some other Race | 0 | 0.0% |
| Total | 1,773 | 100.0% |
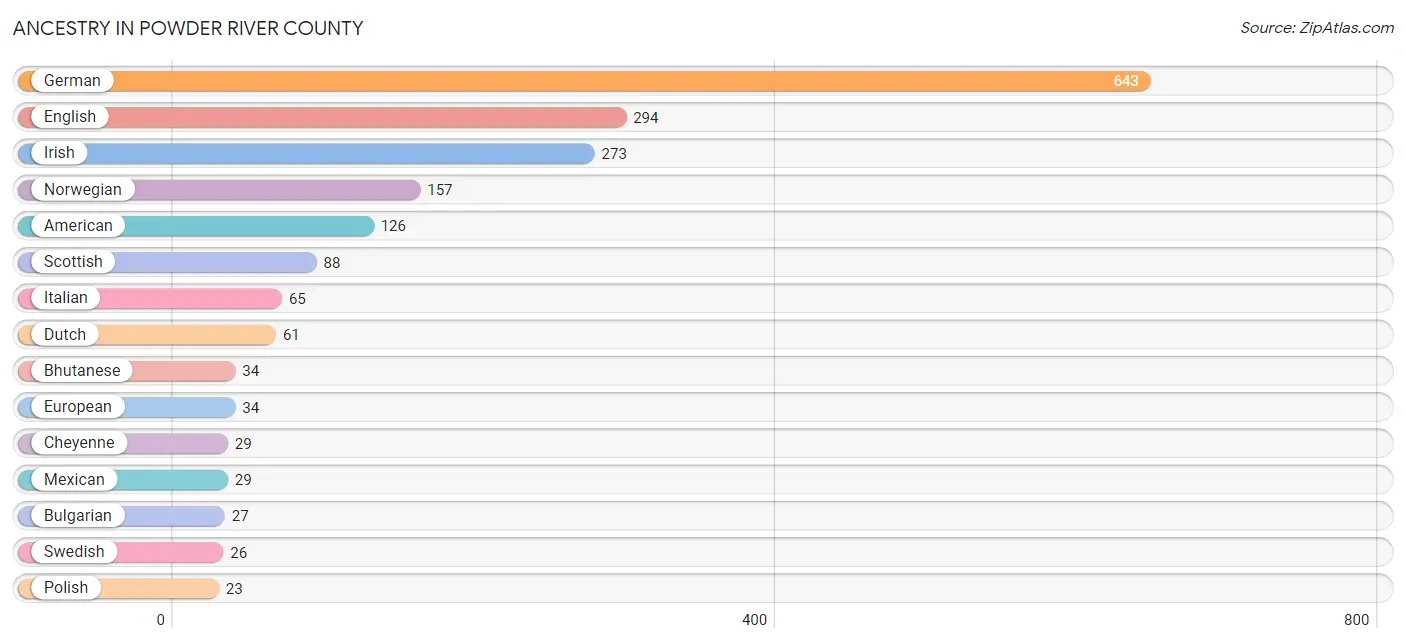
Ancestry in Powder River County
The most populous ancestries reported in Powder River County are German (643 | 36.3%), English (294 | 16.6%), Irish (273 | 15.4%), Norwegian (157 | 8.9%), and American (126 | 7.1%), together accounting for 84.2% of all Powder River County residents.
| Ancestry | # Population | % Population |
| American | 126 | 7.1% |
| Basque | 3 | 0.2% |
| Bhutanese | 34 | 1.9% |
| British | 3 | 0.2% |
| Bulgarian | 27 | 1.5% |
| Canadian | 3 | 0.2% |
| Cheyenne | 29 | 1.6% |
| Czech | 8 | 0.4% |
| Danish | 11 | 0.6% |
| Dutch | 61 | 3.4% |
| Eastern European | 6 | 0.3% |
| English | 294 | 16.6% |
| Estonian | 2 | 0.1% |
| European | 34 | 1.9% |
| Finnish | 4 | 0.2% |
| French | 17 | 1.0% |
| French Canadian | 4 | 0.2% |
| German | 643 | 36.3% |
| Irish | 273 | 15.4% |
| Italian | 65 | 3.7% |
| Korean | 9 | 0.5% |
| Mexican | 29 | 1.6% |
| Northern European | 3 | 0.2% |
| Norwegian | 157 | 8.9% |
| Polish | 23 | 1.3% |
| Russian | 20 | 1.1% |
| Scandinavian | 3 | 0.2% |
| Scotch-Irish | 12 | 0.7% |
| Scottish | 88 | 5.0% |
| Swedish | 26 | 1.5% |
| Swiss | 5 | 0.3% |
| Welsh | 12 | 0.7% | View All 32 Rows |
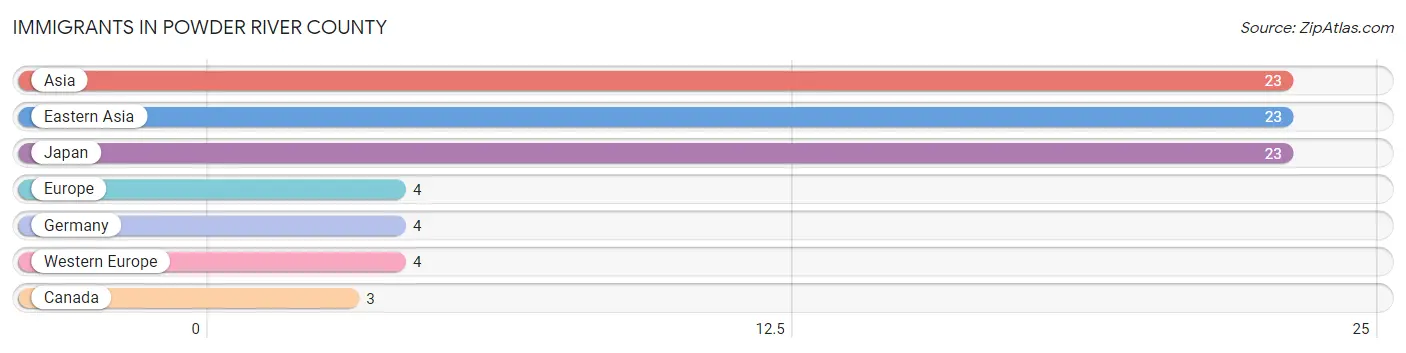
Immigrants in Powder River County
The most numerous immigrant groups reported in Powder River County came from Asia (23 | 1.3%), Eastern Asia (23 | 1.3%), Japan (23 | 1.3%), Europe (4 | 0.2%), and Germany (4 | 0.2%), together accounting for 4.4% of all Powder River County residents.
| Immigration Origin | # Population | % Population |
| Asia | 23 | 1.3% |
| Canada | 3 | 0.2% |
| Eastern Asia | 23 | 1.3% |
| Europe | 4 | 0.2% |
| Germany | 4 | 0.2% |
| Japan | 23 | 1.3% |
| Western Europe | 4 | 0.2% | View All 7 Rows |
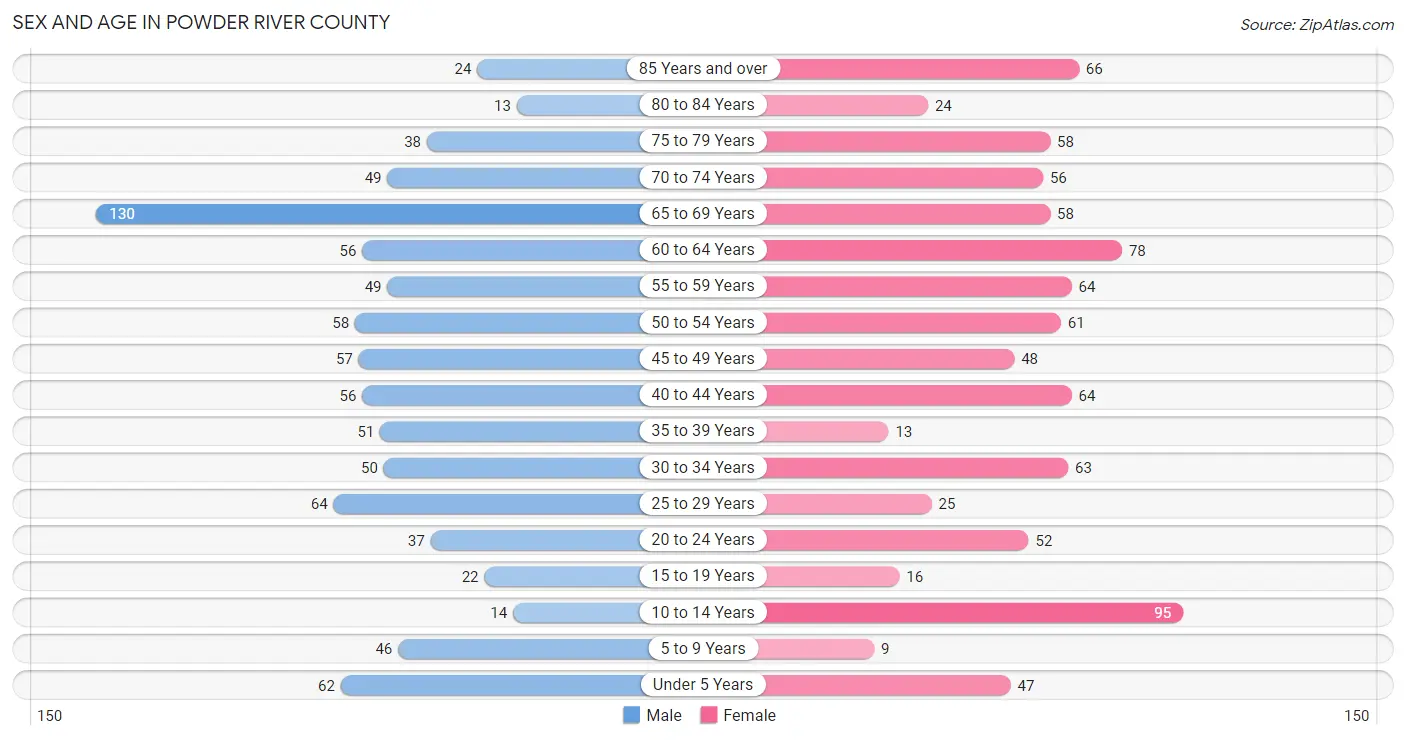
Sex and Age in Powder River County
Sex and Age in Powder River County
The most populous age groups in Powder River County are 65 to 69 Years (130 | 14.8%) for men and 10 to 14 Years (95 | 10.6%) for women.
| Age Bracket | Male | Female |
| Under 5 Years | 62 (7.1%) | 47 (5.2%) |
| 5 to 9 Years | 46 (5.2%) | 9 (1.0%) |
| 10 to 14 Years | 14 (1.6%) | 95 (10.6%) |
| 15 to 19 Years | 22 (2.5%) | 16 (1.8%) |
| 20 to 24 Years | 37 (4.2%) | 52 (5.8%) |
| 25 to 29 Years | 64 (7.3%) | 25 (2.8%) |
| 30 to 34 Years | 50 (5.7%) | 63 (7.0%) |
| 35 to 39 Years | 51 (5.8%) | 13 (1.5%) |
| 40 to 44 Years | 56 (6.4%) | 64 (7.1%) |
| 45 to 49 Years | 57 (6.5%) | 48 (5.3%) |
| 50 to 54 Years | 58 (6.6%) | 61 (6.8%) |
| 55 to 59 Years | 49 (5.6%) | 64 (7.1%) |
| 60 to 64 Years | 56 (6.4%) | 78 (8.7%) |
| 65 to 69 Years | 130 (14.8%) | 58 (6.5%) |
| 70 to 74 Years | 49 (5.6%) | 56 (6.2%) |
| 75 to 79 Years | 38 (4.3%) | 58 (6.5%) |
| 80 to 84 Years | 13 (1.5%) | 24 (2.7%) |
| 85 Years and over | 24 (2.7%) | 66 (7.4%) |
| Total | 876 (100.0%) | 897 (100.0%) |
Families and Households in Powder River County
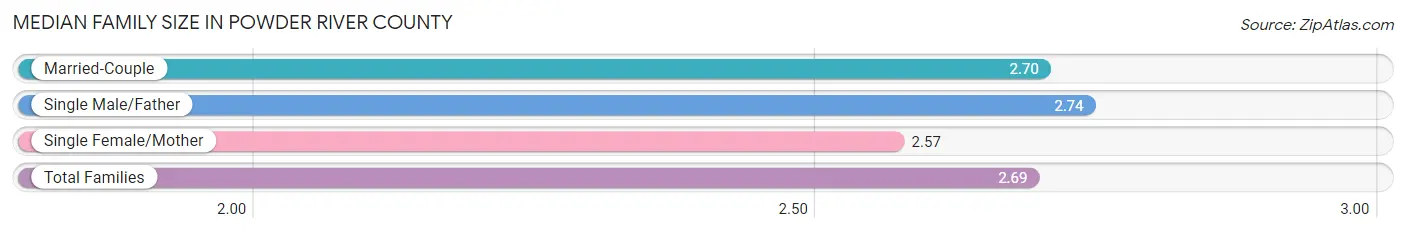
Median Family Size in Powder River County
The median family size in Powder River County is 2.69 persons per family, with single male/father families (31 | 6.0%) accounting for the largest median family size of 2.74 persons per family. On the other hand, single female/mother families (44 | 8.5%) represent the smallest median family size with 2.57 persons per family.
| Family Type | # Families | Family Size |
| Married-Couple | 441 (85.5%) | 2.70 |
| Single Male/Father | 31 (6.0%) | 2.74 |
| Single Female/Mother | 44 (8.5%) | 2.57 |
| Total Families | 516 (100.0%) | 2.69 |
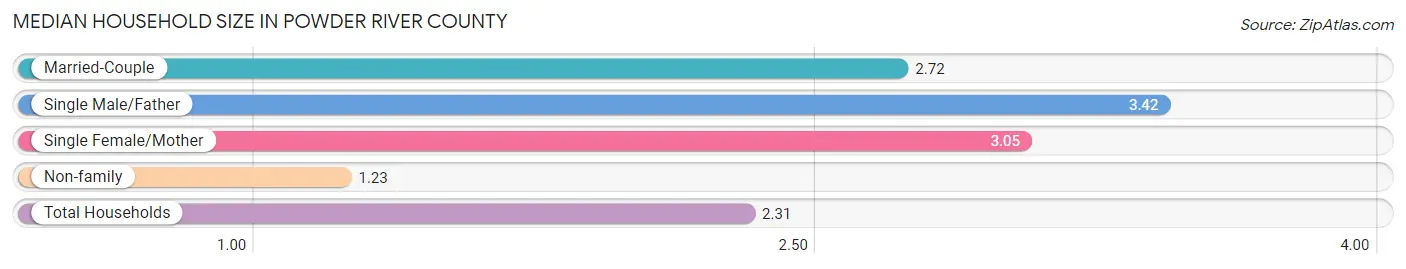
Median Household Size in Powder River County
The median household size in Powder River County is 2.31 persons per household, with single male/father households (31 | 4.2%) accounting for the largest median household size of 3.42 persons per household. non-family households (230 | 30.8%) represent the smallest median household size with 1.23 persons per household.
| Household Type | # Households | Household Size |
| Married-Couple | 441 (59.1%) | 2.72 |
| Single Male/Father | 31 (4.2%) | 3.42 |
| Single Female/Mother | 44 (5.9%) | 3.05 |
| Non-family | 230 (30.8%) | 1.23 |
| Total Households | 746 (100.0%) | 2.31 |
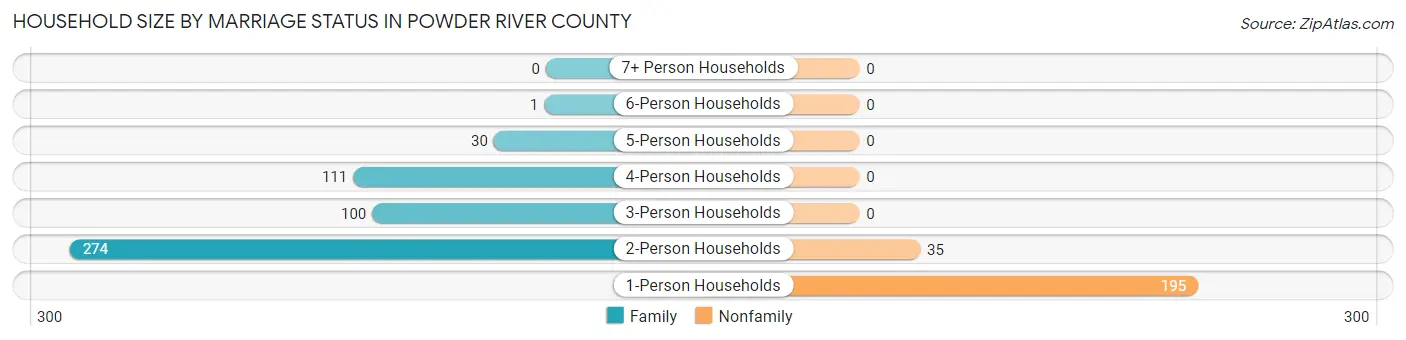
Household Size by Marriage Status in Powder River County
Out of a total of 746 households in Powder River County, 516 (69.2%) are family households, while 230 (30.8%) are nonfamily households. The most numerous type of family households are 2-person households, comprising 274, and the most common type of nonfamily households are 1-person households, comprising 195.
| Household Size | Family Households | Nonfamily Households |
| 1-Person Households | - | 195 (26.1%) |
| 2-Person Households | 274 (36.7%) | 35 (4.7%) |
| 3-Person Households | 100 (13.4%) | 0 (0.0%) |
| 4-Person Households | 111 (14.9%) | 0 (0.0%) |
| 5-Person Households | 30 (4.0%) | 0 (0.0%) |
| 6-Person Households | 1 (0.1%) | 0 (0.0%) |
| 7+ Person Households | 0 (0.0%) | 0 (0.0%) |
| Total | 516 (69.2%) | 230 (30.8%) |
Female Fertility in Powder River County
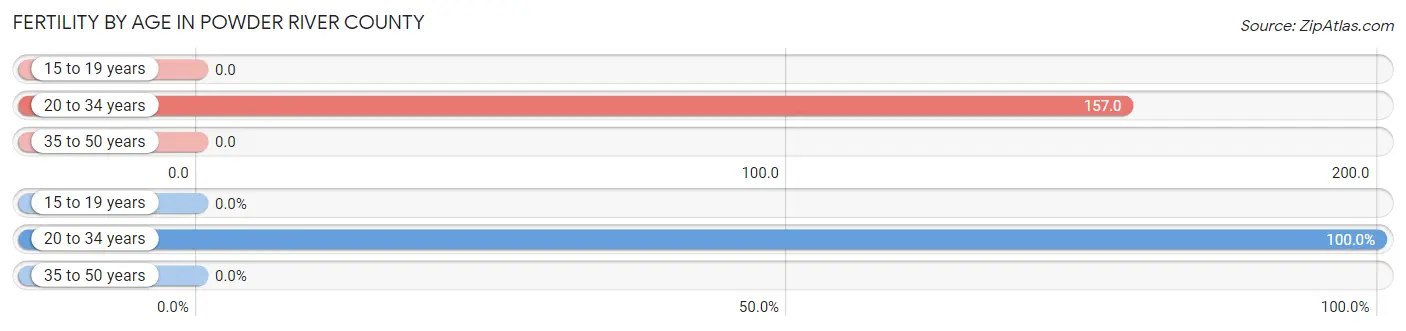
Fertility by Age in Powder River County
Average fertility rate in Powder River County is 72.0 births per 1,000 women. Women in the age bracket of 20 to 34 years have the highest fertility rate with 157.0 births per 1,000 women. Women in the age bracket of 20 to 34 years acount for 100.0% of all women with births.
| Age Bracket | Women with Births | Births / 1,000 Women |
| 15 to 19 years | 0 (0.0%) | 0.0 |
| 20 to 34 years | 22 (100.0%) | 157.0 |
| 35 to 50 years | 0 (0.0%) | 0.0 |
| Total | 22 (100.0%) | 72.0 |
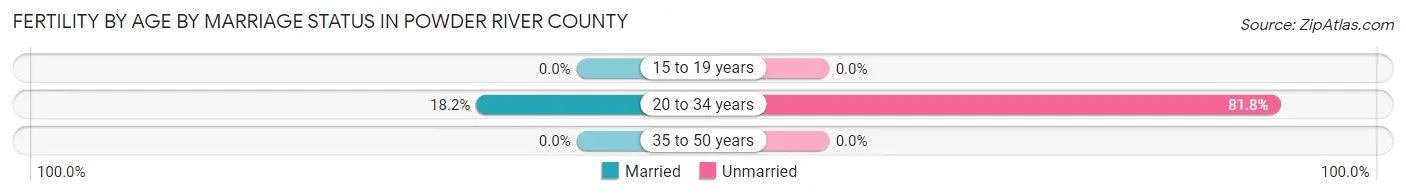
Fertility by Age by Marriage Status in Powder River County
18.2% of women with births (22) in Powder River County are married. The highest percentage of unmarried women with births falls into 20 to 34 years age bracket with 81.8% of them unmarried at the time of birth, while the lowest percentage of unmarried women with births belong to 20 to 34 years age bracket with 81.8% of them unmarried.
| Age Bracket | Married | Unmarried |
| 15 to 19 years | 0 (0.0%) | 0 (0.0%) |
| 20 to 34 years | 4 (18.2%) | 18 (81.8%) |
| 35 to 50 years | 0 (0.0%) | 0 (0.0%) |
| Total | 4 (18.2%) | 18 (81.8%) |
Fertility by Education in Powder River County
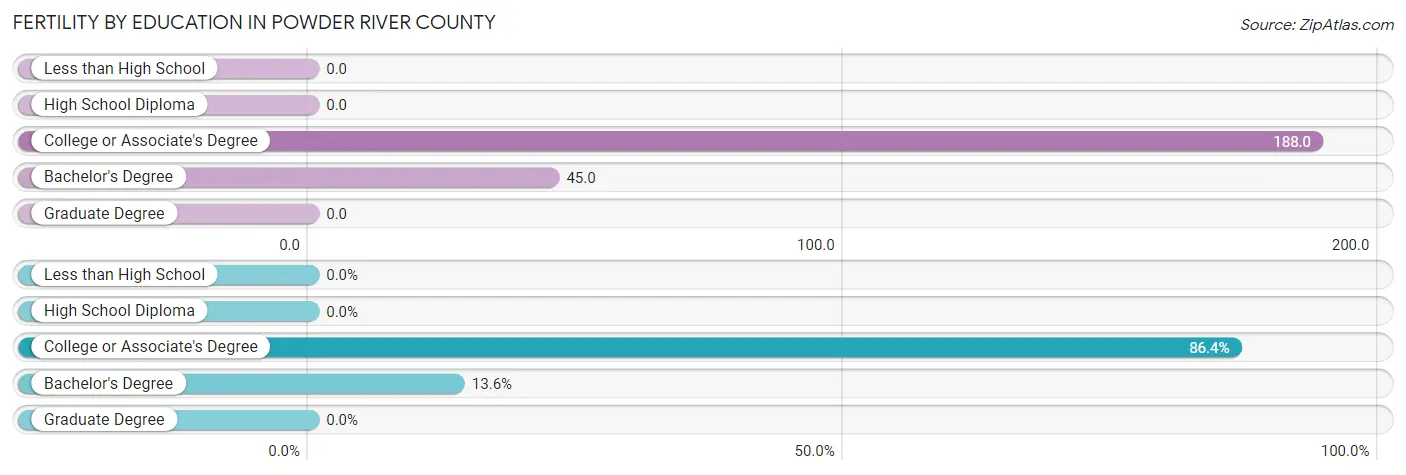
| Educational Attainment | Women with Births | Births / 1,000 Women |
| Less than High School | 0 (0.0%) | 0.0 |
| High School Diploma | 0 (0.0%) | 0.0 |
| College or Associate's Degree | 19 (86.4%) | 188.0 |
| Bachelor's Degree | 3 (13.6%) | 45.0 |
| Graduate Degree | 0 (0.0%) | 0.0 |
| Total | 22 (100.0%) | 72.0 |
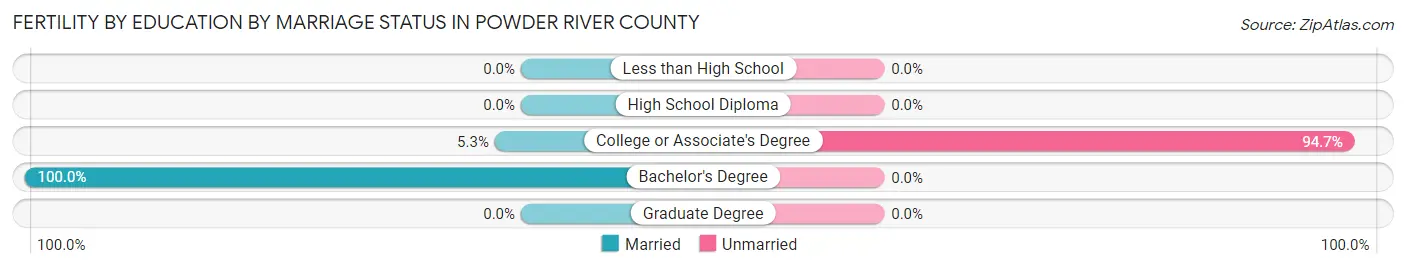
Fertility by Education by Marriage Status in Powder River County
81.8% of women with births in Powder River County are unmarried. Women with the educational attainment of bachelor's degree are most likely to be married with 100.0% of them married at childbirth, while women with the educational attainment of college or associate's degree are least likely to be married with 94.7% of them unmarried at childbirth.
| Educational Attainment | Married | Unmarried |
| Less than High School | 0 (0.0%) | 0 (0.0%) |
| High School Diploma | 0 (0.0%) | 0 (0.0%) |
| College or Associate's Degree | 1 (5.3%) | 18 (94.7%) |
| Bachelor's Degree | 3 (100.0%) | 0 (0.0%) |
| Graduate Degree | 0 (0.0%) | 0 (0.0%) |
| Total | 4 (18.2%) | 18 (81.8%) |
Income in Powder River County
Income Overview in Powder River County
Per Capita Income in Powder River County is $38,588, while median incomes of families and households are $79,000 and $60,313 respectively.
| Characteristic | Number | Measure |
| Per Capita Income | 1,773 | $38,588 |
| Median Family Income | 516 | $79,000 |
| Mean Family Income | 516 | $101,771 |
| Median Household Income | 746 | $60,313 |
| Mean Household Income | 746 | $89,103 |
| Income Deficit | 516 | $0 |
| Wage / Income Gap (%) | 1,773 | 16.83% |
| Wage / Income Gap ($) | 1,773 | 83.17¢ per $1 |
| Gini / Inequality Index | 1,773 | 0.47 |
Earnings by Sex in Powder River County
Average Earnings in Powder River County are $34,071, $35,571 for men and $29,583 for women, a difference of 16.8%.
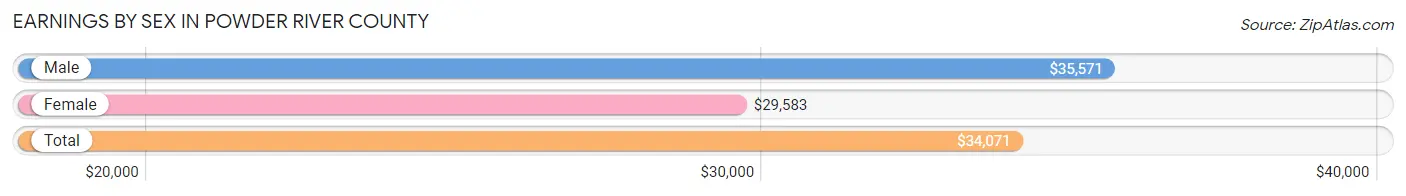
| Sex | Number | Average Earnings |
| Male | 602 (57.8%) | $35,571 |
| Female | 440 (42.2%) | $29,583 |
| Total | 1,042 (100.0%) | $34,071 |
Earnings by Sex by Income Bracket in Powder River County
The most common earnings brackets in Powder River County are $100,000+ for men (89 | 14.8%) and $55,000 to $64,999 for women (64 | 14.5%).
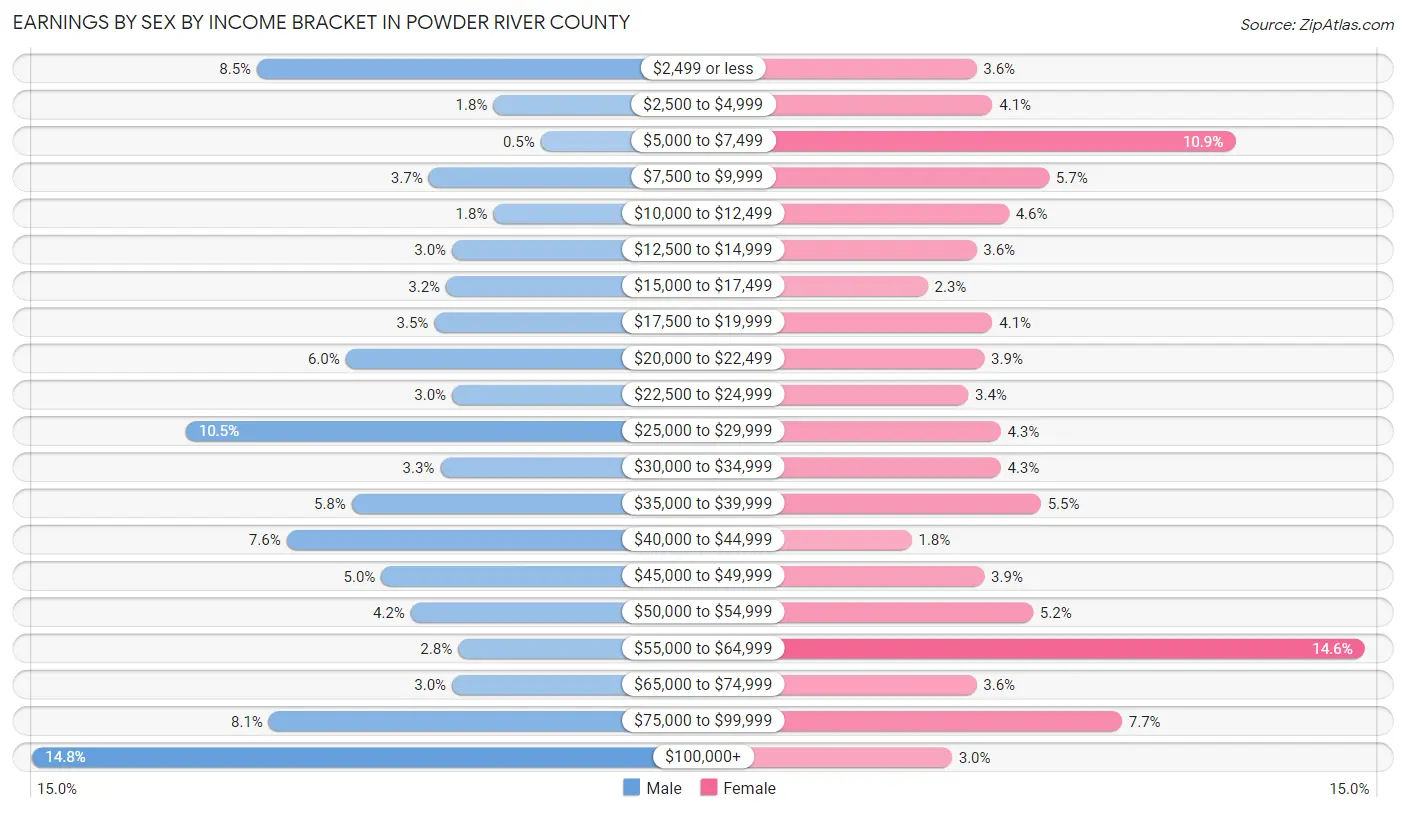
| Income | Male | Female |
| $2,499 or less | 51 (8.5%) | 16 (3.6%) |
| $2,500 to $4,999 | 11 (1.8%) | 18 (4.1%) |
| $5,000 to $7,499 | 3 (0.5%) | 48 (10.9%) |
| $7,500 to $9,999 | 22 (3.6%) | 25 (5.7%) |
| $10,000 to $12,499 | 11 (1.8%) | 20 (4.5%) |
| $12,500 to $14,999 | 18 (3.0%) | 16 (3.6%) |
| $15,000 to $17,499 | 19 (3.2%) | 10 (2.3%) |
| $17,500 to $19,999 | 21 (3.5%) | 18 (4.1%) |
| $20,000 to $22,499 | 36 (6.0%) | 17 (3.9%) |
| $22,500 to $24,999 | 18 (3.0%) | 15 (3.4%) |
| $25,000 to $29,999 | 63 (10.5%) | 19 (4.3%) |
| $30,000 to $34,999 | 20 (3.3%) | 19 (4.3%) |
| $35,000 to $39,999 | 35 (5.8%) | 24 (5.4%) |
| $40,000 to $44,999 | 46 (7.6%) | 8 (1.8%) |
| $45,000 to $49,999 | 30 (5.0%) | 17 (3.9%) |
| $50,000 to $54,999 | 25 (4.2%) | 23 (5.2%) |
| $55,000 to $64,999 | 17 (2.8%) | 64 (14.5%) |
| $65,000 to $74,999 | 18 (3.0%) | 16 (3.6%) |
| $75,000 to $99,999 | 49 (8.1%) | 34 (7.7%) |
| $100,000+ | 89 (14.8%) | 13 (2.9%) |
| Total | 602 (100.0%) | 440 (100.0%) |
Earnings by Sex by Educational Attainment in Powder River County
Average earnings in Powder River County are $36,767 for men and $34,667 for women, a difference of 5.7%. Men with an educational attainment of high school diploma enjoy the highest average annual earnings of $43,750, while those with less than high school education earn the least with $28,125. Women with an educational attainment of graduate degree earn the most with the average annual earnings of $56,225, while those with college or associate's degree education have the smallest earnings of $22,000.
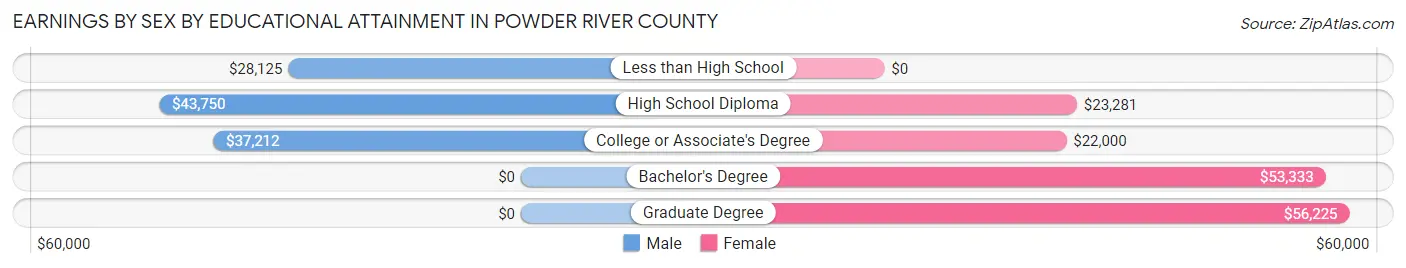
| Educational Attainment | Male Income | Female Income |
| Less than High School | $28,125 | $0 |
| High School Diploma | $43,750 | $23,281 |
| College or Associate's Degree | $37,212 | $22,000 |
| Bachelor's Degree | - | - |
| Graduate Degree | - | - |
| Total | $36,767 | $34,667 |
Family Income in Powder River County
Family Income Brackets in Powder River County
According to the Powder River County family income data, there are 139 families falling into the $100,000 to $149,999 income range, which is the most common income bracket and makes up 26.9% of all families. Conversely, the $10,000 to $14,999 income bracket is the least frequent group with only 7 families (1.4%) belonging to this category.
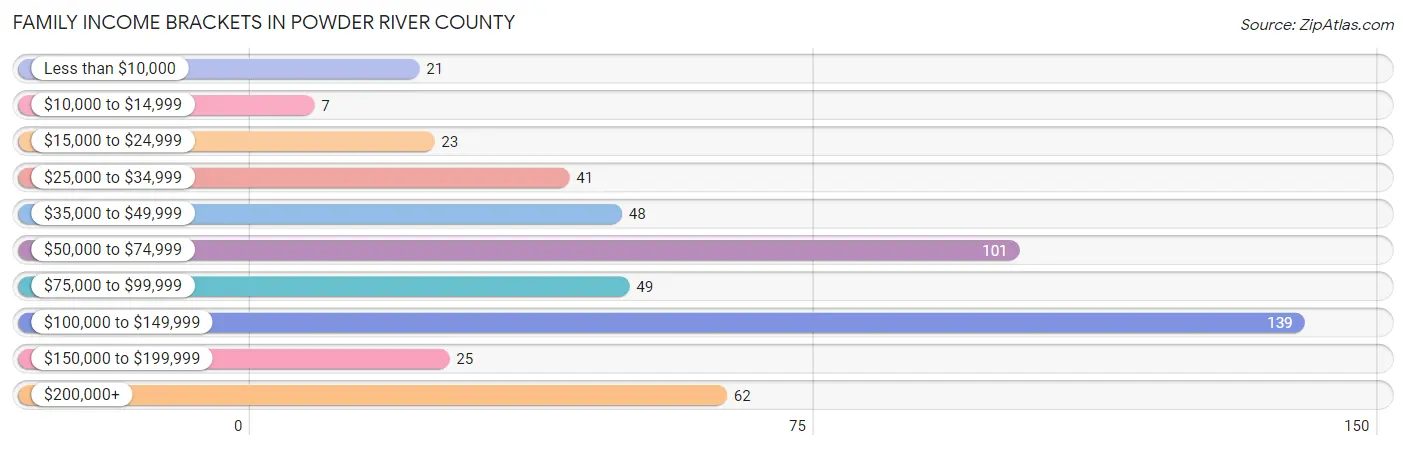
| Income Bracket | # Families | % Families |
| Less than $10,000 | 21 | 4.1% |
| $10,000 to $14,999 | 7 | 1.4% |
| $15,000 to $24,999 | 23 | 4.5% |
| $25,000 to $34,999 | 41 | 7.9% |
| $35,000 to $49,999 | 48 | 9.3% |
| $50,000 to $74,999 | 101 | 19.6% |
| $75,000 to $99,999 | 49 | 9.5% |
| $100,000 to $149,999 | 139 | 26.9% |
| $150,000 to $199,999 | 25 | 4.8% |
| $200,000+ | 62 | 12.0% |
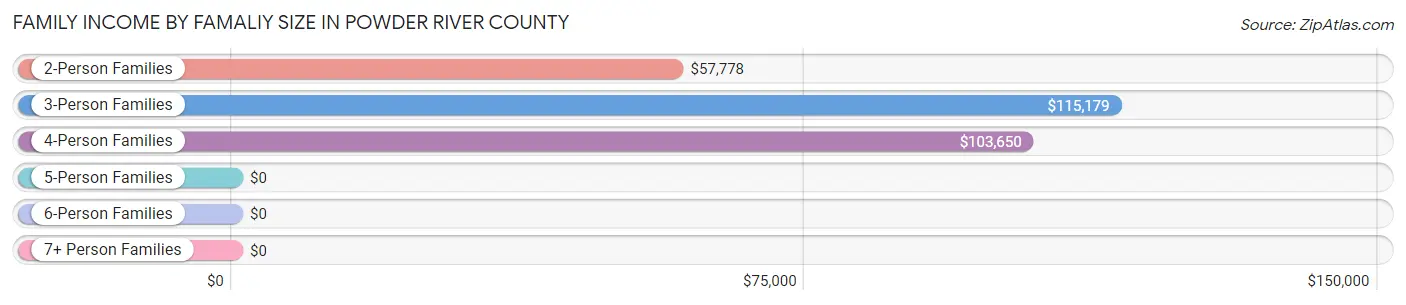
Family Income by Famaliy Size in Powder River County
3-person families (103 | 20.0%) account for the highest median family income in Powder River County with $115,179 per family, while 3-person families (103 | 20.0%) have the highest median income of $38,393 per family member.
| Income Bracket | # Families | Median Income |
| 2-Person Families | 298 (57.8%) | $57,778 |
| 3-Person Families | 103 (20.0%) | $115,179 |
| 4-Person Families | 84 (16.3%) | $103,650 |
| 5-Person Families | 30 (5.8%) | $0 |
| 6-Person Families | 1 (0.2%) | $0 |
| 7+ Person Families | 0 (0.0%) | $0 |
| Total | 516 (100.0%) | $79,000 |
Family Income by Number of Earners in Powder River County
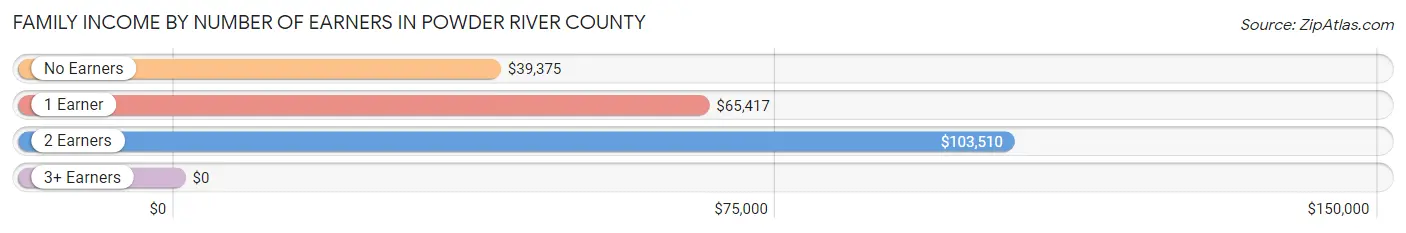
| Number of Earners | # Families | Median Income |
| No Earners | 66 (12.8%) | $39,375 |
| 1 Earner | 145 (28.1%) | $65,417 |
| 2 Earners | 268 (51.9%) | $103,510 |
| 3+ Earners | 37 (7.2%) | $0 |
| Total | 516 (100.0%) | $79,000 |
Household Income in Powder River County
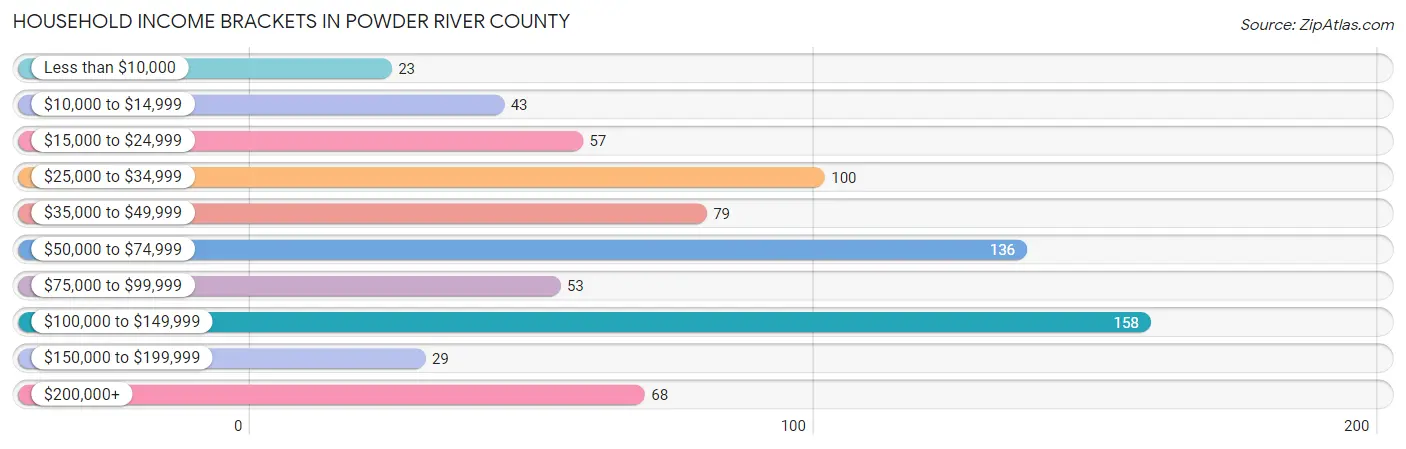
Household Income Brackets in Powder River County
With 158 households falling in the category, the $100,000 to $149,999 income range is the most frequent in Powder River County, accounting for 21.2% of all households. In contrast, only 23 households (3.1%) fall into the less than $10,000 income bracket, making it the least populous group.
| Income Bracket | # Households | % Households |
| Less than $10,000 | 23 | 3.1% |
| $10,000 to $14,999 | 43 | 5.8% |
| $15,000 to $24,999 | 57 | 7.6% |
| $25,000 to $34,999 | 100 | 13.4% |
| $35,000 to $49,999 | 79 | 10.6% |
| $50,000 to $74,999 | 136 | 18.2% |
| $75,000 to $99,999 | 53 | 7.1% |
| $100,000 to $149,999 | 158 | 21.2% |
| $150,000 to $199,999 | 29 | 3.9% |
| $200,000+ | 68 | 9.1% |
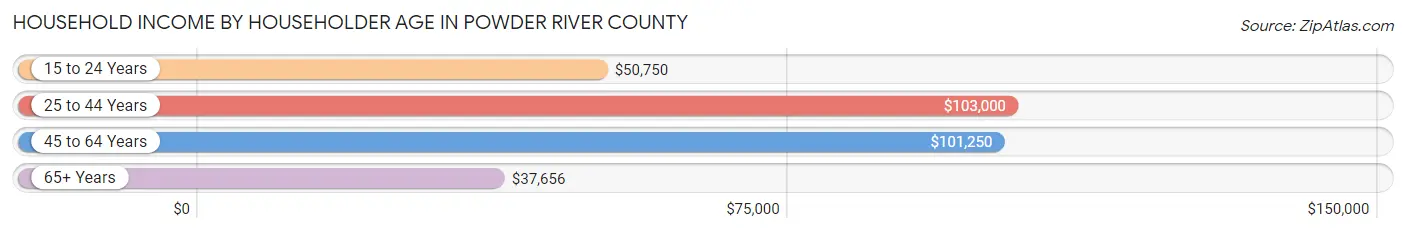
Household Income by Householder Age in Powder River County
The median household income in Powder River County is $60,313, with the highest median household income of $103,000 found in the 25 to 44 years age bracket for the primary householder. A total of 178 households (23.9%) fall into this category. Meanwhile, the 65+ years age bracket for the primary householder has the lowest median household income of $37,656, with 333 households (44.6%) in this group.
| Income Bracket | # Households | Median Income |
| 15 to 24 Years | 21 (2.8%) | $50,750 |
| 25 to 44 Years | 178 (23.9%) | $103,000 |
| 45 to 64 Years | 214 (28.7%) | $101,250 |
| 65+ Years | 333 (44.6%) | $37,656 |
| Total | 746 (100.0%) | $60,313 |
Poverty in Powder River County
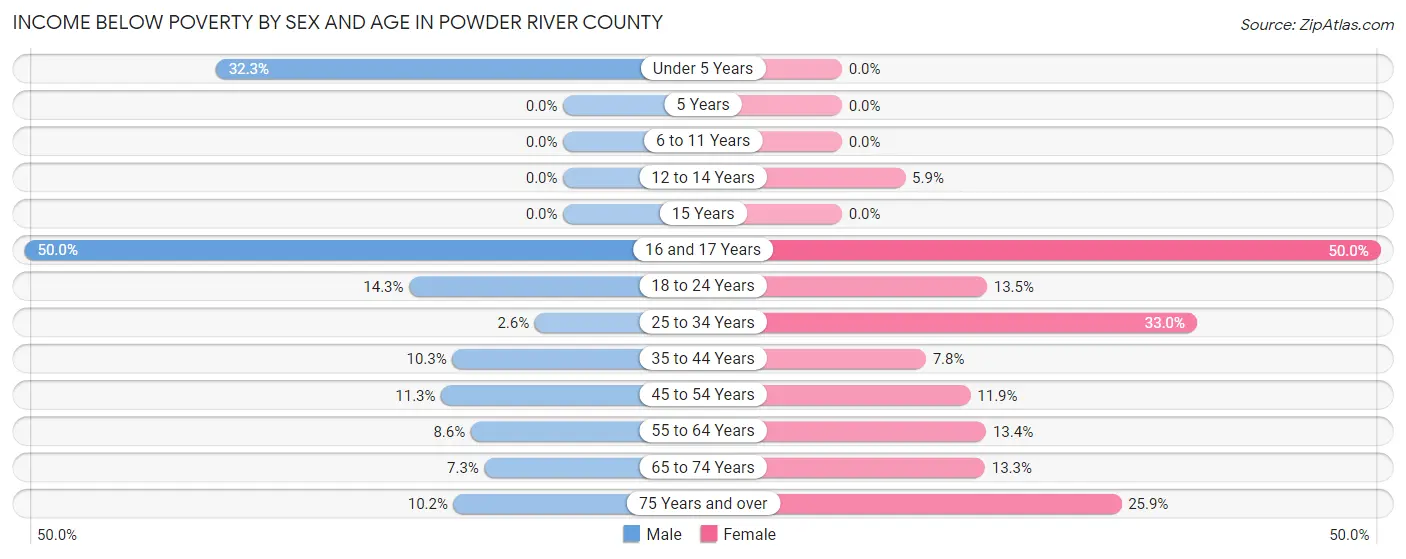
Income Below Poverty by Sex and Age in Powder River County
With 10.1% poverty level for males and 15.2% for females among the residents of Powder River County, 16 and 17 year old males and 16 and 17 year old females are the most vulnerable to poverty, with 5 males (50.0%) and 7 females (50.0%) in their respective age groups living below the poverty level.
| Age Bracket | Male | Female |
| Under 5 Years | 20 (32.3%) | 0 (0.0%) |
| 5 Years | 0 (0.0%) | 0 (0.0%) |
| 6 to 11 Years | 0 (0.0%) | 0 (0.0%) |
| 12 to 14 Years | 0 (0.0%) | 3 (5.9%) |
| 15 Years | 0 (0.0%) | 0 (0.0%) |
| 16 and 17 Years | 5 (50.0%) | 7 (50.0%) |
| 18 to 24 Years | 7 (14.3%) | 7 (13.5%) |
| 25 to 34 Years | 3 (2.6%) | 29 (33.0%) |
| 35 to 44 Years | 11 (10.3%) | 6 (7.8%) |
| 45 to 54 Years | 12 (11.3%) | 13 (11.9%) |
| 55 to 64 Years | 9 (8.6%) | 19 (13.4%) |
| 65 to 74 Years | 13 (7.3%) | 15 (13.3%) |
| 75 Years and over | 6 (10.2%) | 35 (25.9%) |
| Total | 86 (10.1%) | 134 (15.2%) |
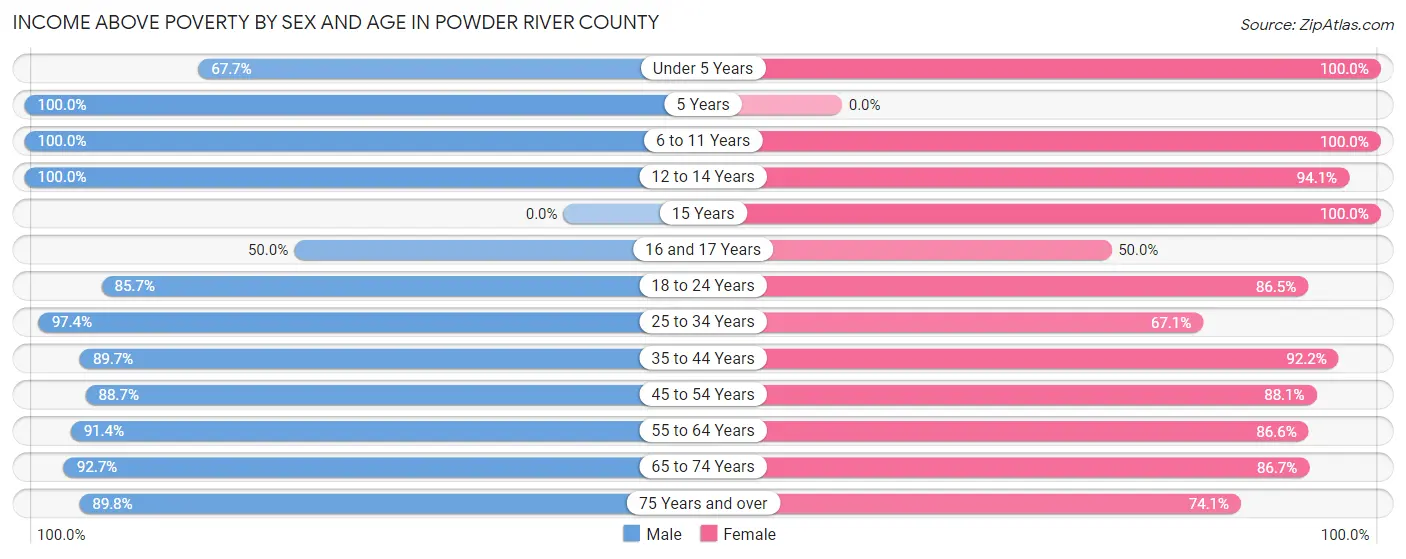
Income Above Poverty by Sex and Age in Powder River County
According to the poverty statistics in Powder River County, males aged 5 years and females aged under 5 years are the age groups that are most secure financially, with 100.0% of males and 100.0% of females in these age groups living above the poverty line.
| Age Bracket | Male | Female |
| Under 5 Years | 42 (67.7%) | 47 (100.0%) |
| 5 Years | 6 (100.0%) | 0 (0.0%) |
| 6 to 11 Years | 47 (100.0%) | 53 (100.0%) |
| 12 to 14 Years | 7 (100.0%) | 48 (94.1%) |
| 15 Years | 0 (0.0%) | 2 (100.0%) |
| 16 and 17 Years | 5 (50.0%) | 7 (50.0%) |
| 18 to 24 Years | 42 (85.7%) | 45 (86.5%) |
| 25 to 34 Years | 111 (97.4%) | 59 (67.0%) |
| 35 to 44 Years | 96 (89.7%) | 71 (92.2%) |
| 45 to 54 Years | 94 (88.7%) | 96 (88.1%) |
| 55 to 64 Years | 96 (91.4%) | 123 (86.6%) |
| 65 to 74 Years | 165 (92.7%) | 98 (86.7%) |
| 75 Years and over | 53 (89.8%) | 100 (74.1%) |
| Total | 764 (89.9%) | 749 (84.8%) |
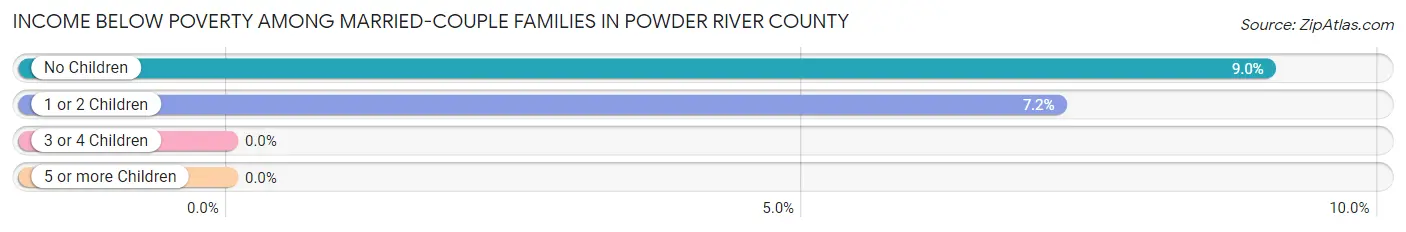
Income Below Poverty Among Married-Couple Families in Powder River County
The poverty statistics for married-couple families in Powder River County show that 7.9% or 35 of the total 441 families live below the poverty line. Families with no children have the highest poverty rate of 9.0%, comprising of 27 families. On the other hand, families with 3 or 4 children have the lowest poverty rate of 0.0%, which includes 0 families.
| Children | Above Poverty | Below Poverty |
| No Children | 272 (91.0%) | 27 (9.0%) |
| 1 or 2 Children | 103 (92.8%) | 8 (7.2%) |
| 3 or 4 Children | 31 (100.0%) | 0 (0.0%) |
| 5 or more Children | 0 (0.0%) | 0 (0.0%) |
| Total | 406 (92.1%) | 35 (7.9%) |
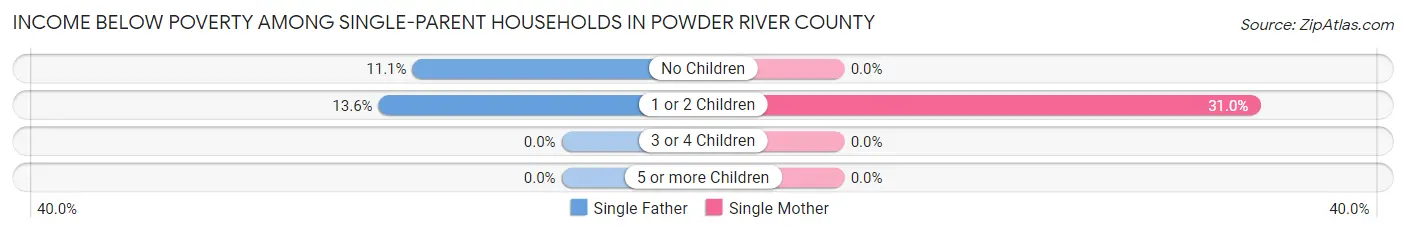
Income Below Poverty Among Single-Parent Households in Powder River County
According to the poverty data in Powder River County, 12.9% or 4 single-father households and 20.4% or 9 single-mother households are living below the poverty line. Among single-father households, those with 1 or 2 children have the highest poverty rate, with 3 households (13.6%) experiencing poverty. Likewise, among single-mother households, those with 1 or 2 children have the highest poverty rate, with 9 households (31.0%) falling below the poverty line.
| Children | Single Father | Single Mother |
| No Children | 1 (11.1%) | 0 (0.0%) |
| 1 or 2 Children | 3 (13.6%) | 9 (31.0%) |
| 3 or 4 Children | 0 (0.0%) | 0 (0.0%) |
| 5 or more Children | 0 (0.0%) | 0 (0.0%) |
| Total | 4 (12.9%) | 9 (20.4%) |
Income Below Poverty Among Married-Couple vs Single-Parent Households in Powder River County
The poverty data for Powder River County shows that 35 of the married-couple family households (7.9%) and 13 of the single-parent households (17.3%) are living below the poverty level. Within the married-couple family households, those with no children have the highest poverty rate, with 27 households (9.0%) falling below the poverty line. Among the single-parent households, those with 1 or 2 children have the highest poverty rate, with 12 household (23.5%) living below poverty.
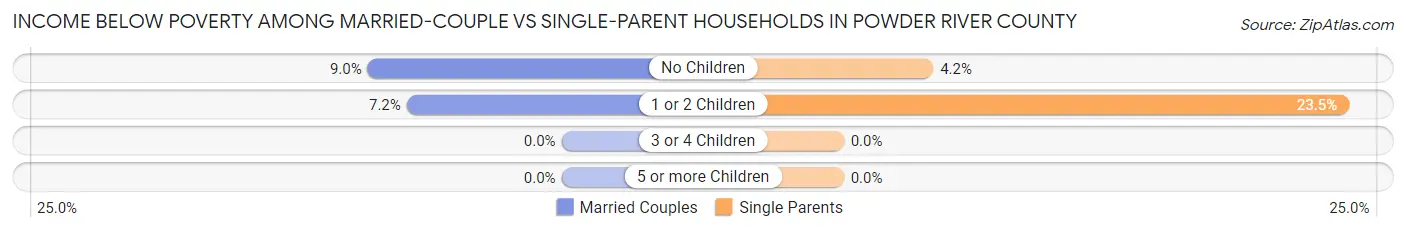
| Children | Married-Couple Families | Single-Parent Households |
| No Children | 27 (9.0%) | 1 (4.2%) |
| 1 or 2 Children | 8 (7.2%) | 12 (23.5%) |
| 3 or 4 Children | 0 (0.0%) | 0 (0.0%) |
| 5 or more Children | 0 (0.0%) | 0 (0.0%) |
| Total | 35 (7.9%) | 13 (17.3%) |
Employment Characteristics in Powder River County
Employment by Class of Employer in Powder River County
Among the 894 employed individuals in Powder River County, private company employees (328 | 36.7%), self-employed (not incorporated) (207 | 23.2%), and local government employees (183 | 20.5%) make up the most common classes of employment.
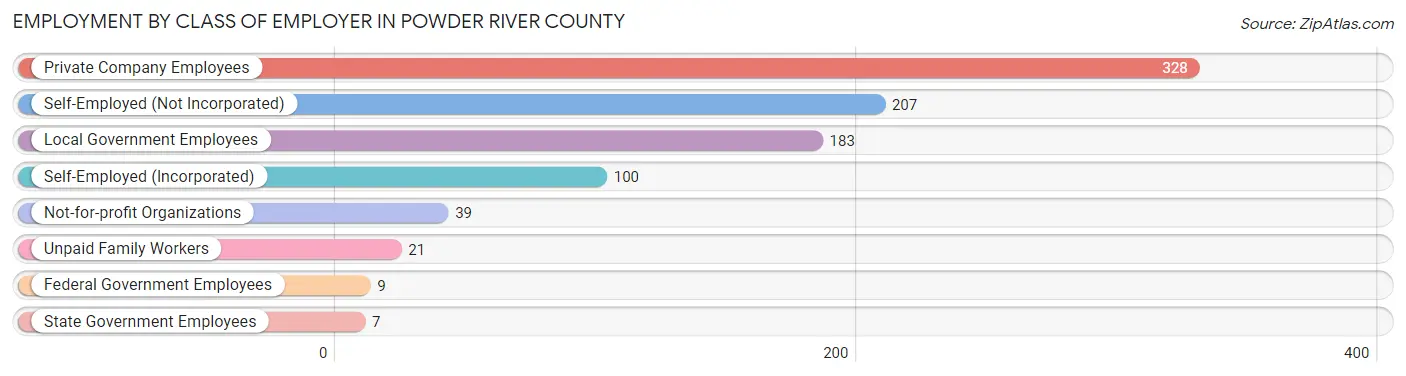
| Employer Class | # Employees | % Employees |
| Private Company Employees | 328 | 36.7% |
| Self-Employed (Incorporated) | 100 | 11.2% |
| Self-Employed (Not Incorporated) | 207 | 23.2% |
| Not-for-profit Organizations | 39 | 4.4% |
| Local Government Employees | 183 | 20.5% |
| State Government Employees | 7 | 0.8% |
| Federal Government Employees | 9 | 1.0% |
| Unpaid Family Workers | 21 | 2.4% |
| Total | 894 | 100.0% |
Employment Status by Age in Powder River County
According to the labor force statistics for Powder River County, out of the total population over 16 years of age (1,498), 61.3% or 918 individuals are in the labor force, with 1.0% or 9 of them unemployed. The age group with the highest labor force participation rate is 20 to 24 years, with 94.4% or 84 individuals in the labor force. Within the labor force, the 16 to 19 years age range has the highest percentage of unemployed individuals, with 29.4% or 5 of them being unemployed.
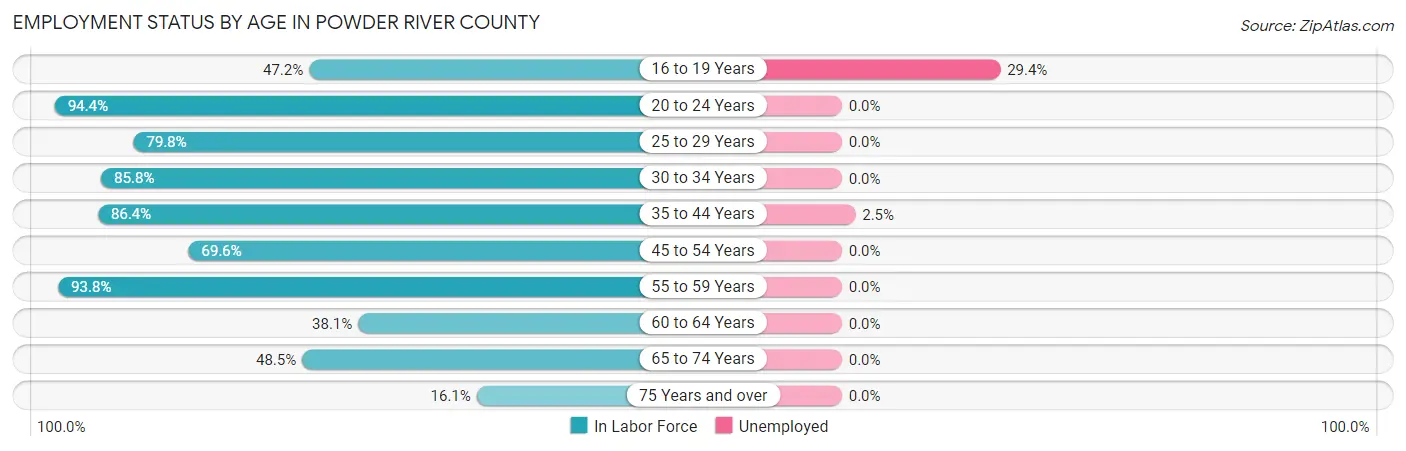
| Age Bracket | In Labor Force | Unemployed |
| 16 to 19 Years | 17 (47.2%) | 5 (29.4%) |
| 20 to 24 Years | 84 (94.4%) | 0 (0.0%) |
| 25 to 29 Years | 71 (79.8%) | 0 (0.0%) |
| 30 to 34 Years | 97 (85.8%) | 0 (0.0%) |
| 35 to 44 Years | 159 (86.4%) | 4 (2.5%) |
| 45 to 54 Years | 156 (69.6%) | 0 (0.0%) |
| 55 to 59 Years | 106 (93.8%) | 0 (0.0%) |
| 60 to 64 Years | 51 (38.1%) | 0 (0.0%) |
| 65 to 74 Years | 142 (48.5%) | 0 (0.0%) |
| 75 Years and over | 36 (16.1%) | 0 (0.0%) |
| Total | 918 (61.3%) | 9 (1.0%) |
Employment Status by Educational Attainment in Powder River County
According to labor force statistics for Powder River County, 74.7% of individuals (640) out of the total population between 25 and 64 years of age (857) are in the labor force, with 0.6% or 4 of them being unemployed. The group with the highest labor force participation rate are those with the educational attainment of bachelor's degree or higher, with 88.8% or 213 individuals in the labor force. Within the labor force, individuals with college / associate degree education have the highest percentage of unemployment, with 1.7% or 4 of them being unemployed.
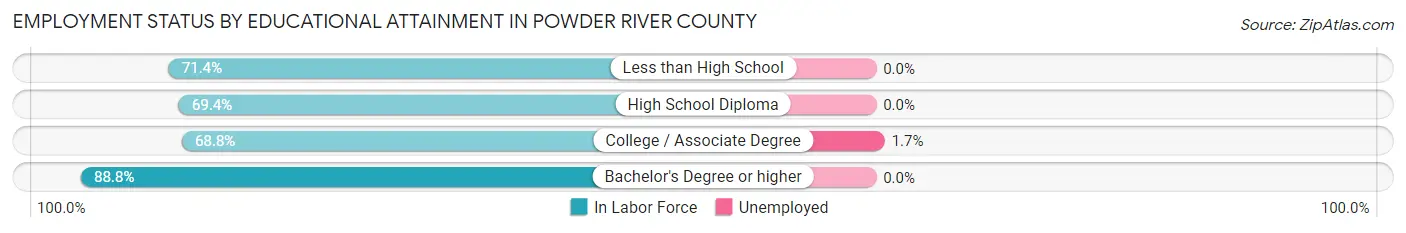
| Educational Attainment | In Labor Force | Unemployed |
| Less than High School | 30 (71.4%) | 0 (0.0%) |
| High School Diploma | 168 (69.4%) | 0 (0.0%) |
| College / Associate Degree | 229 (68.8%) | 6 (1.7%) |
| Bachelor's Degree or higher | 213 (88.8%) | 0 (0.0%) |
| Total | 640 (74.7%) | 5 (0.6%) |
Employment Occupations by Sex in Powder River County
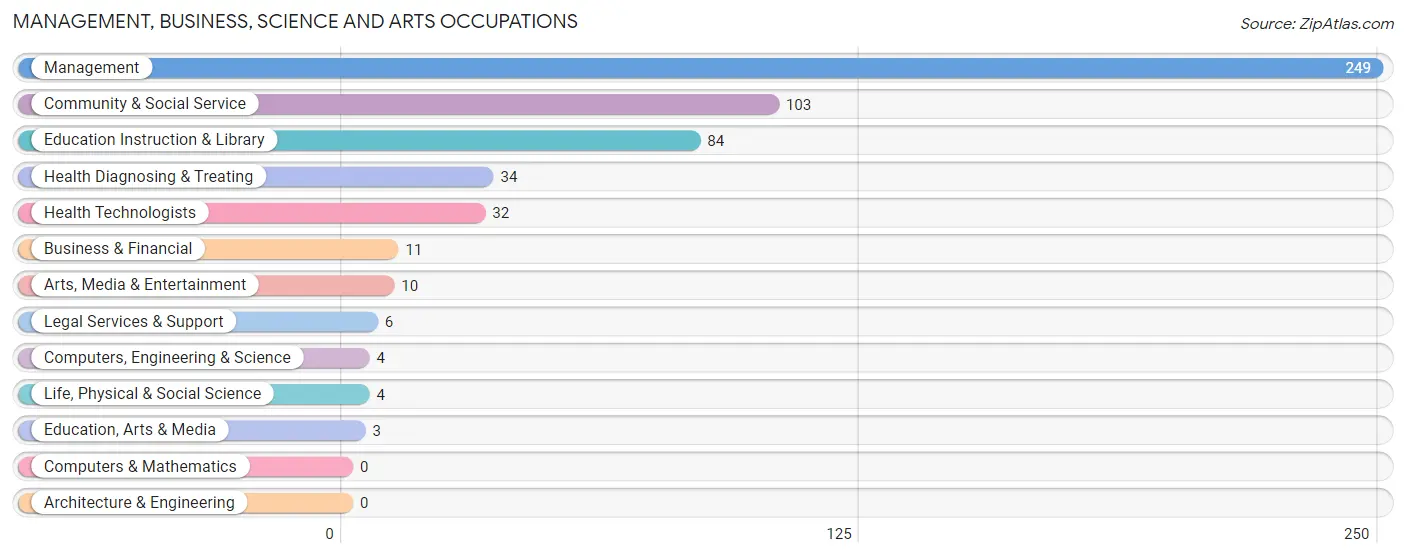
Management, Business, Science and Arts Occupations
The most common Management, Business, Science and Arts occupations in Powder River County are Management (249 | 27.4%), Community & Social Service (103 | 11.3%), Education Instruction & Library (84 | 9.2%), Health Diagnosing & Treating (34 | 3.7%), and Health Technologists (32 | 3.5%).
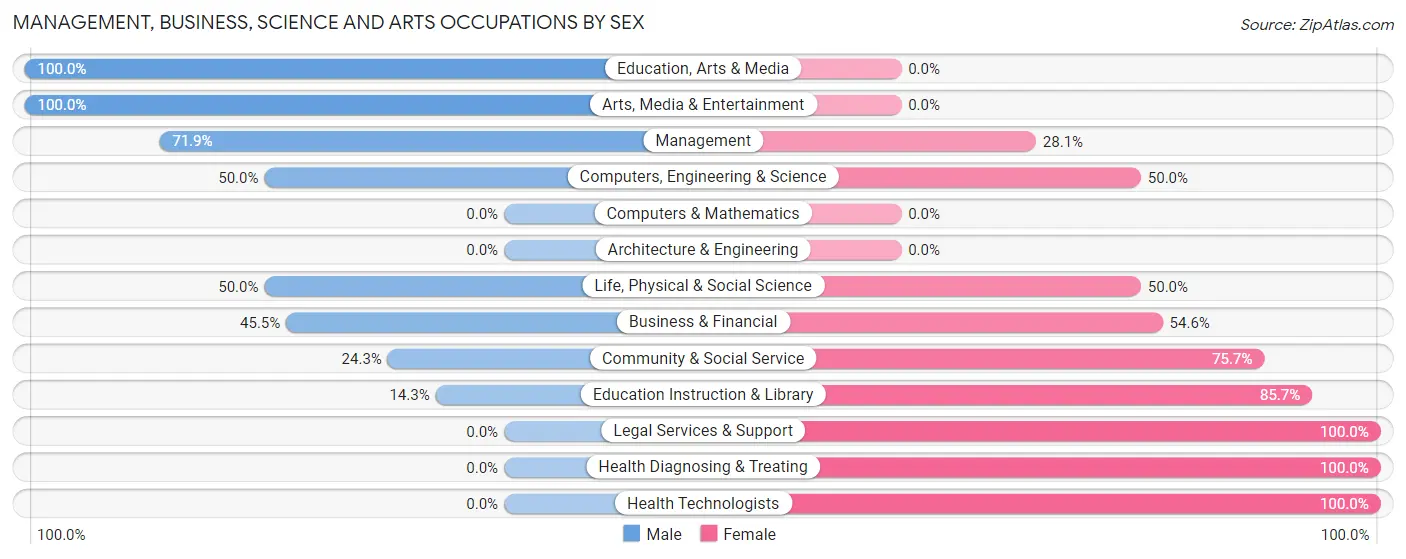
Management, Business, Science and Arts Occupations by Sex
Within the Management, Business, Science and Arts occupations in Powder River County, the most male-oriented occupations are Education, Arts & Media (100.0%), Arts, Media & Entertainment (100.0%), and Management (71.9%), while the most female-oriented occupations are Legal Services & Support (100.0%), Health Diagnosing & Treating (100.0%), and Health Technologists (100.0%).
| Occupation | Male | Female |
| Management | 179 (71.9%) | 70 (28.1%) |
| Business & Financial | 5 (45.5%) | 6 (54.5%) |
| Computers, Engineering & Science | 2 (50.0%) | 2 (50.0%) |
| Computers & Mathematics | 0 (0.0%) | 0 (0.0%) |
| Architecture & Engineering | 0 (0.0%) | 0 (0.0%) |
| Life, Physical & Social Science | 2 (50.0%) | 2 (50.0%) |
| Community & Social Service | 25 (24.3%) | 78 (75.7%) |
| Education, Arts & Media | 3 (100.0%) | 0 (0.0%) |
| Legal Services & Support | 0 (0.0%) | 6 (100.0%) |
| Education Instruction & Library | 12 (14.3%) | 72 (85.7%) |
| Arts, Media & Entertainment | 10 (100.0%) | 0 (0.0%) |
| Health Diagnosing & Treating | 0 (0.0%) | 34 (100.0%) |
| Health Technologists | 0 (0.0%) | 32 (100.0%) |
| Total (Category) | 211 (52.6%) | 190 (47.4%) |
| Total (Overall) | 533 (58.6%) | 377 (41.4%) |
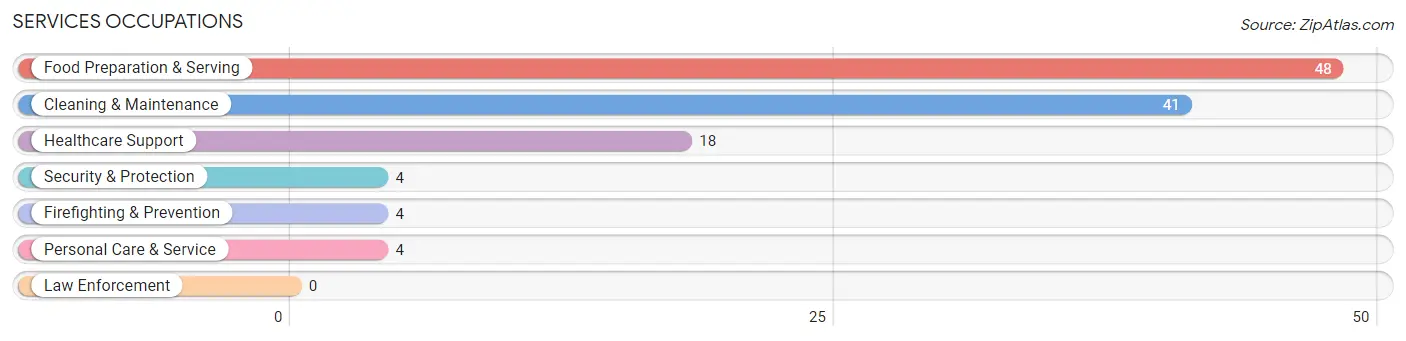
Services Occupations
The most common Services occupations in Powder River County are Food Preparation & Serving (48 | 5.3%), Cleaning & Maintenance (41 | 4.5%), Healthcare Support (18 | 2.0%), Security & Protection (4 | 0.4%), and Firefighting & Prevention (4 | 0.4%).
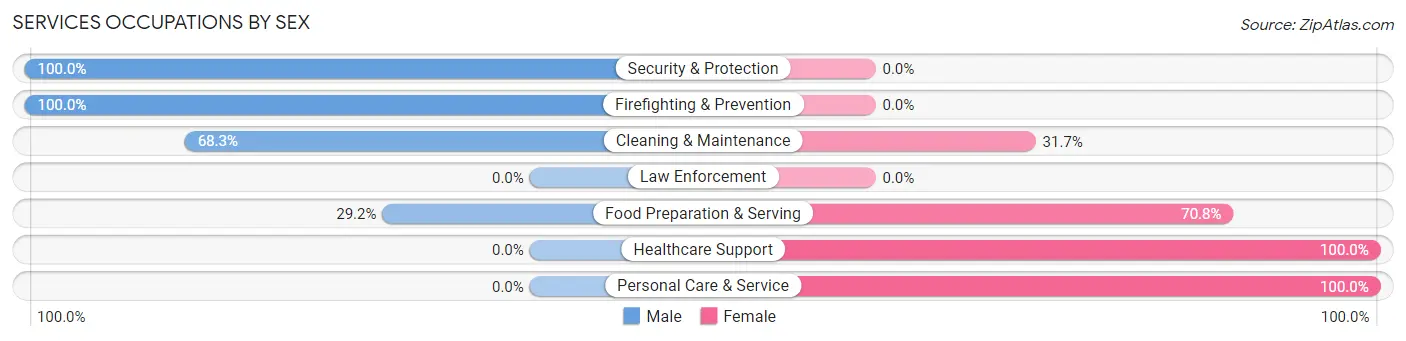
Services Occupations by Sex
Within the Services occupations in Powder River County, the most male-oriented occupations are Security & Protection (100.0%), Firefighting & Prevention (100.0%), and Cleaning & Maintenance (68.3%), while the most female-oriented occupations are Healthcare Support (100.0%), Personal Care & Service (100.0%), and Food Preparation & Serving (70.8%).
| Occupation | Male | Female |
| Healthcare Support | 0 (0.0%) | 18 (100.0%) |
| Security & Protection | 4 (100.0%) | 0 (0.0%) |
| Firefighting & Prevention | 4 (100.0%) | 0 (0.0%) |
| Law Enforcement | 0 (0.0%) | 0 (0.0%) |
| Food Preparation & Serving | 14 (29.2%) | 34 (70.8%) |
| Cleaning & Maintenance | 28 (68.3%) | 13 (31.7%) |
| Personal Care & Service | 0 (0.0%) | 4 (100.0%) |
| Total (Category) | 46 (40.0%) | 69 (60.0%) |
| Total (Overall) | 533 (58.6%) | 377 (41.4%) |
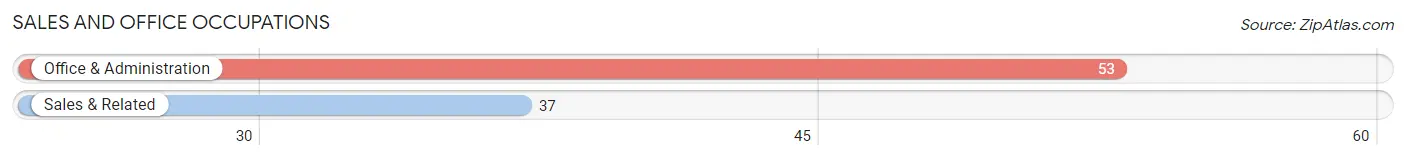
Sales and Office Occupations
The most common Sales and Office occupations in Powder River County are Office & Administration (53 | 5.8%), and Sales & Related (37 | 4.1%).
Sales and Office Occupations by Sex
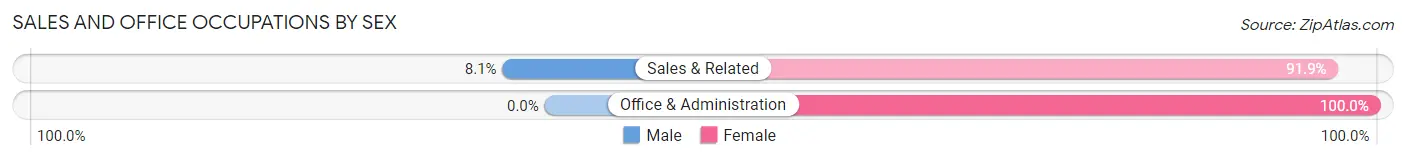
| Occupation | Male | Female |
| Sales & Related | 3 (8.1%) | 34 (91.9%) |
| Office & Administration | 0 (0.0%) | 53 (100.0%) |
| Total (Category) | 3 (3.3%) | 87 (96.7%) |
| Total (Overall) | 533 (58.6%) | 377 (41.4%) |
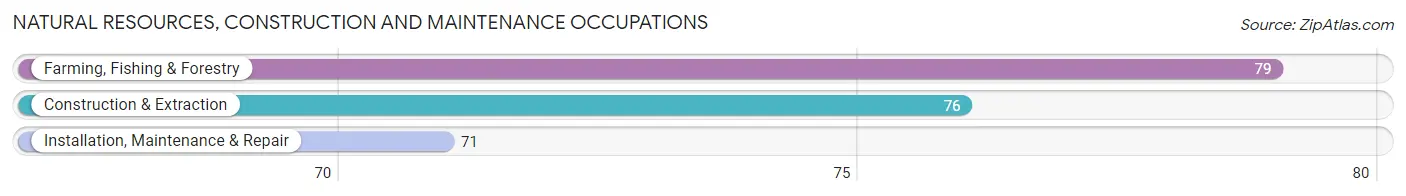
Natural Resources, Construction and Maintenance Occupations
The most common Natural Resources, Construction and Maintenance occupations in Powder River County are Farming, Fishing & Forestry (79 | 8.7%), Construction & Extraction (76 | 8.4%), and Installation, Maintenance & Repair (71 | 7.8%).
Natural Resources, Construction and Maintenance Occupations by Sex
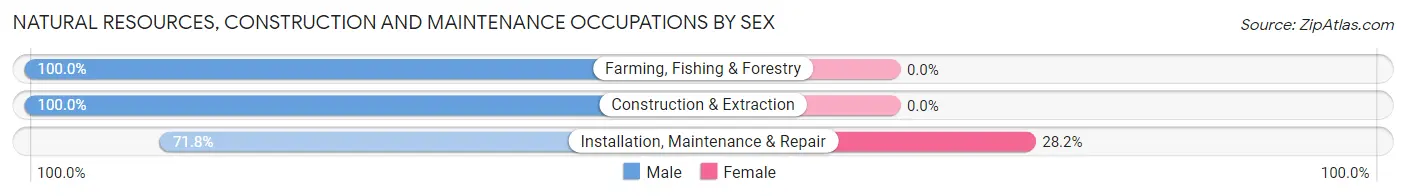
| Occupation | Male | Female |
| Farming, Fishing & Forestry | 79 (100.0%) | 0 (0.0%) |
| Construction & Extraction | 76 (100.0%) | 0 (0.0%) |
| Installation, Maintenance & Repair | 51 (71.8%) | 20 (28.2%) |
| Total (Category) | 206 (91.1%) | 20 (8.8%) |
| Total (Overall) | 533 (58.6%) | 377 (41.4%) |
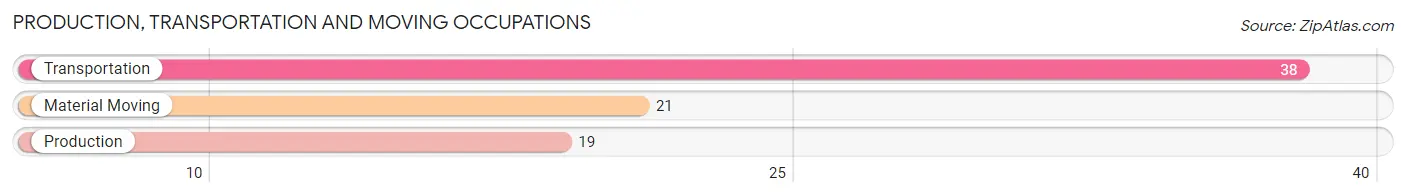
Production, Transportation and Moving Occupations
The most common Production, Transportation and Moving occupations in Powder River County are Transportation (38 | 4.2%), Material Moving (21 | 2.3%), and Production (19 | 2.1%).
Production, Transportation and Moving Occupations by Sex
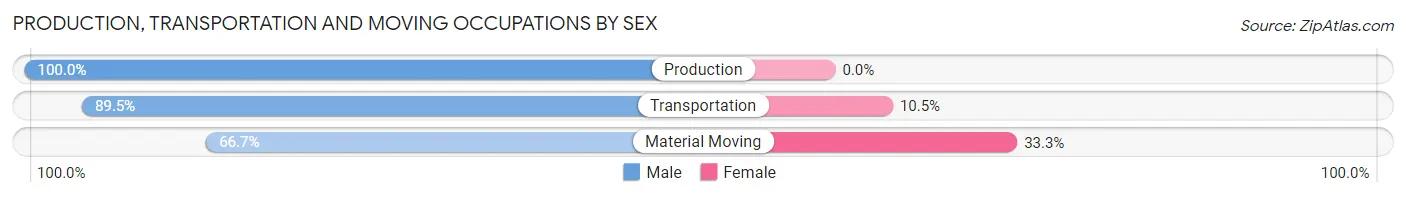
| Occupation | Male | Female |
| Production | 19 (100.0%) | 0 (0.0%) |
| Transportation | 34 (89.5%) | 4 (10.5%) |
| Material Moving | 14 (66.7%) | 7 (33.3%) |
| Total (Category) | 67 (85.9%) | 11 (14.1%) |
| Total (Overall) | 533 (58.6%) | 377 (41.4%) |
Employment Industries by Sex in Powder River County
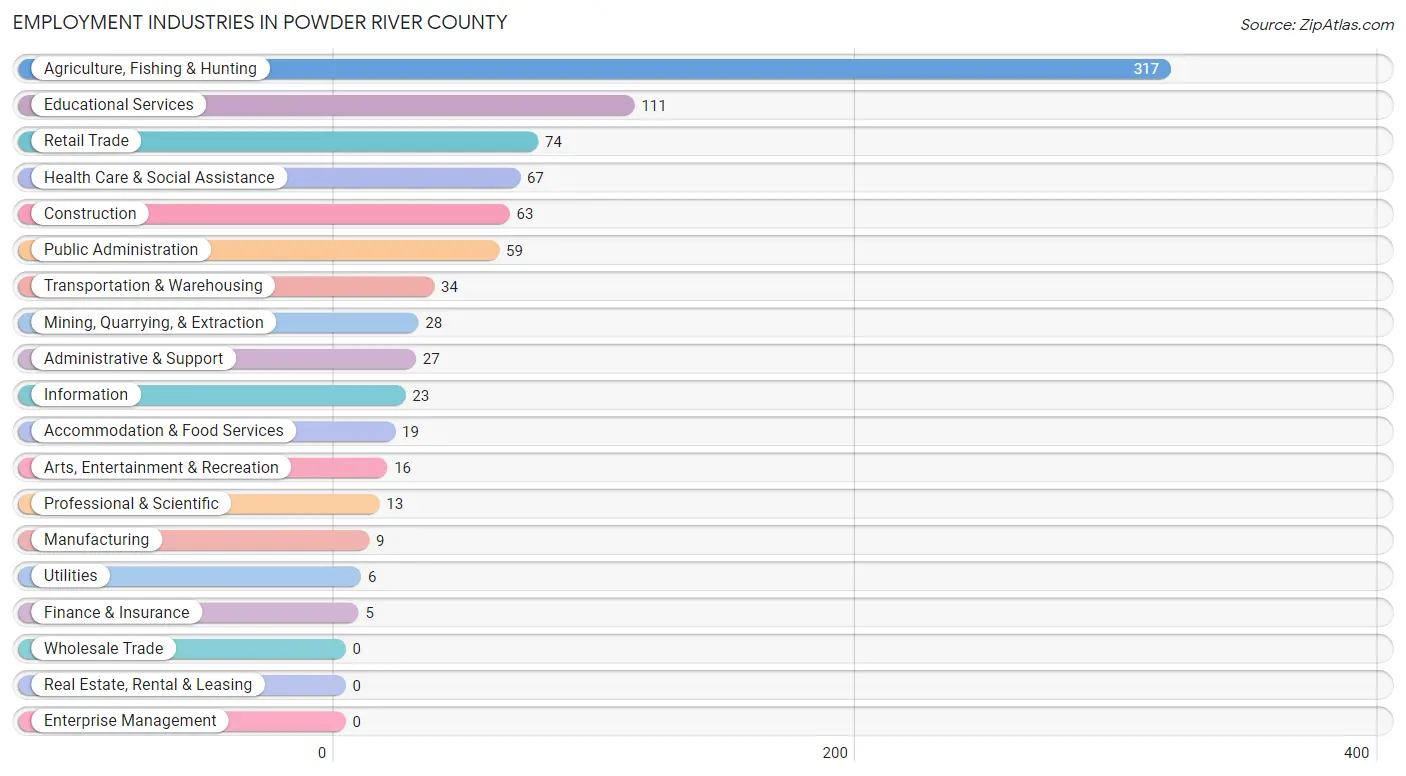
Employment Industries in Powder River County
The major employment industries in Powder River County include Agriculture, Fishing & Hunting (317 | 34.8%), Educational Services (111 | 12.2%), Retail Trade (74 | 8.1%), Health Care & Social Assistance (67 | 7.4%), and Construction (63 | 6.9%).
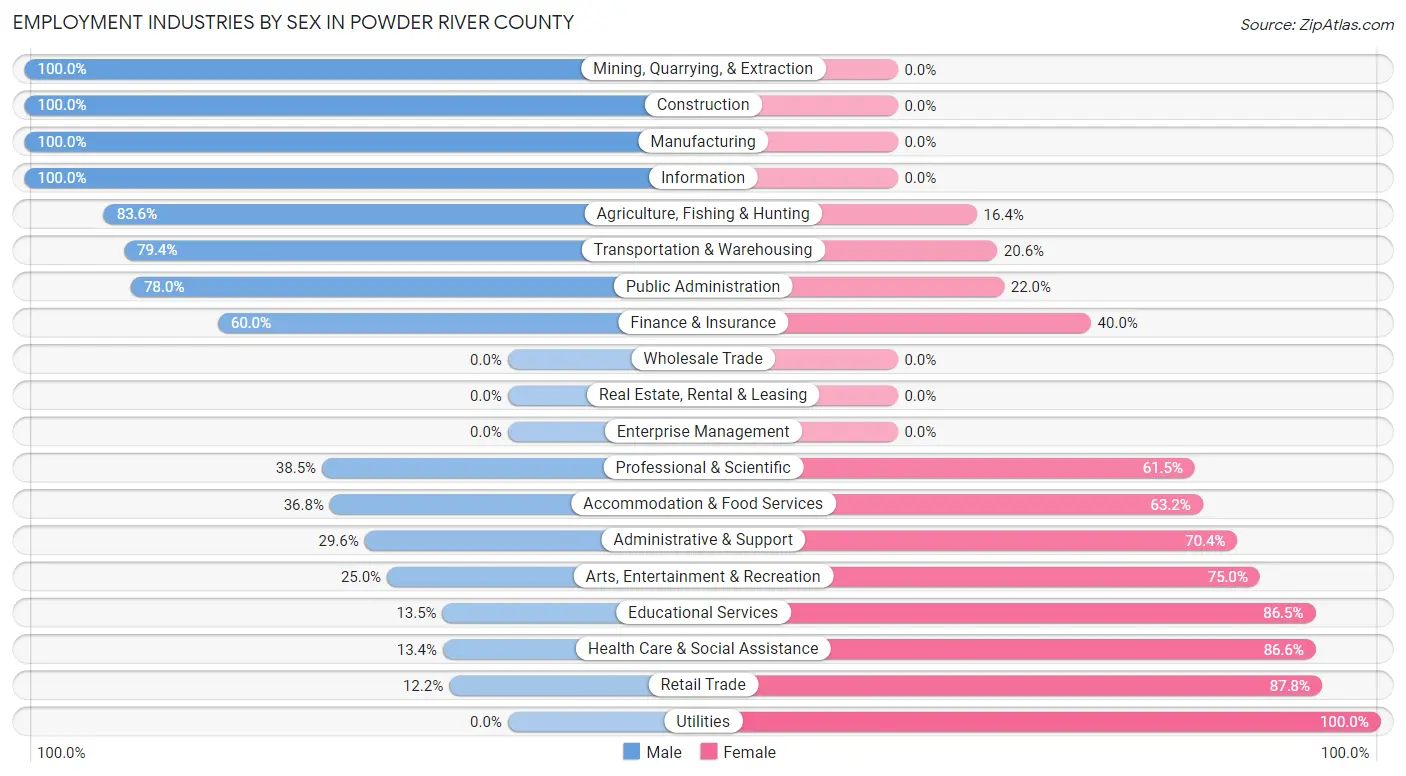
Employment Industries by Sex in Powder River County
The Powder River County industries that see more men than women are Mining, Quarrying, & Extraction (100.0%), Construction (100.0%), and Manufacturing (100.0%), whereas the industries that tend to have a higher number of women are Utilities (100.0%), Retail Trade (87.8%), and Health Care & Social Assistance (86.6%).
| Industry | Male | Female |
| Agriculture, Fishing & Hunting | 265 (83.6%) | 52 (16.4%) |
| Mining, Quarrying, & Extraction | 28 (100.0%) | 0 (0.0%) |
| Construction | 63 (100.0%) | 0 (0.0%) |
| Manufacturing | 9 (100.0%) | 0 (0.0%) |
| Wholesale Trade | 0 (0.0%) | 0 (0.0%) |
| Retail Trade | 9 (12.2%) | 65 (87.8%) |
| Transportation & Warehousing | 27 (79.4%) | 7 (20.6%) |
| Utilities | 0 (0.0%) | 6 (100.0%) |
| Information | 23 (100.0%) | 0 (0.0%) |
| Finance & Insurance | 3 (60.0%) | 2 (40.0%) |
| Real Estate, Rental & Leasing | 0 (0.0%) | 0 (0.0%) |
| Professional & Scientific | 5 (38.5%) | 8 (61.5%) |
| Enterprise Management | 0 (0.0%) | 0 (0.0%) |
| Administrative & Support | 8 (29.6%) | 19 (70.4%) |
| Educational Services | 15 (13.5%) | 96 (86.5%) |
| Health Care & Social Assistance | 9 (13.4%) | 58 (86.6%) |
| Arts, Entertainment & Recreation | 4 (25.0%) | 12 (75.0%) |
| Accommodation & Food Services | 7 (36.8%) | 12 (63.2%) |
| Public Administration | 46 (78.0%) | 13 (22.0%) |
| Total | 533 (58.6%) | 377 (41.4%) |
Education in Powder River County
School Enrollment in Powder River County
The most common levels of schooling among the 241 students in Powder River County are middle school (72 | 29.9%), elementary school (54 | 22.4%), and graduate / professional (38 | 15.8%).
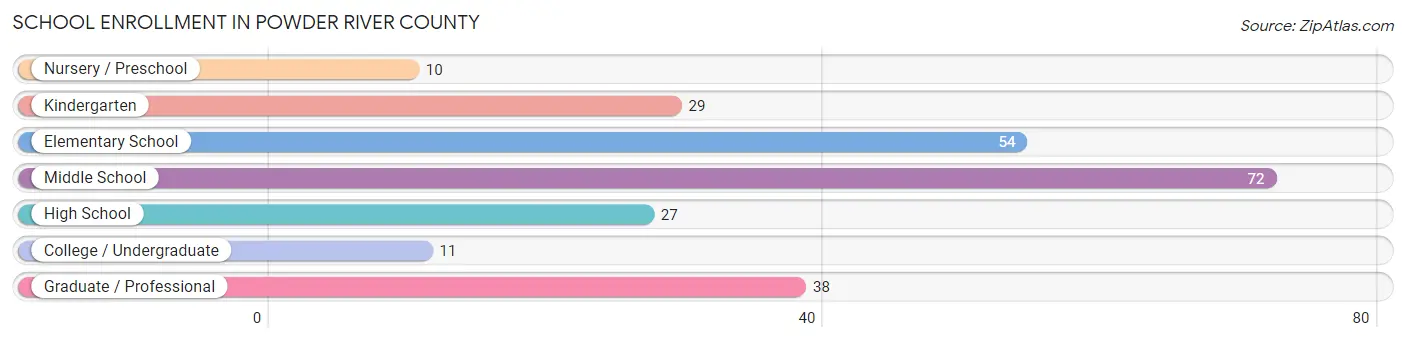
| School Level | # Students | % Students |
| Nursery / Preschool | 10 | 4.2% |
| Kindergarten | 29 | 12.0% |
| Elementary School | 54 | 22.4% |
| Middle School | 72 | 29.9% |
| High School | 27 | 11.2% |
| College / Undergraduate | 11 | 4.6% |
| Graduate / Professional | 38 | 15.8% |
| Total | 241 | 100.0% |
School Enrollment by Age by Funding Source in Powder River County
Out of a total of 241 students who are enrolled in schools in Powder River County, 20 (8.3%) attend a private institution, while the remaining 221 (91.7%) are enrolled in public schools. The age group of 18 to 19 year olds has the highest likelihood of being enrolled in private schools, with 7 (100.0% in the age bracket) enrolled. Conversely, the age group of 5 to 9 year old has the lowest likelihood of being enrolled in a private school, with 49 (100.0% in the age bracket) attending a public institution.
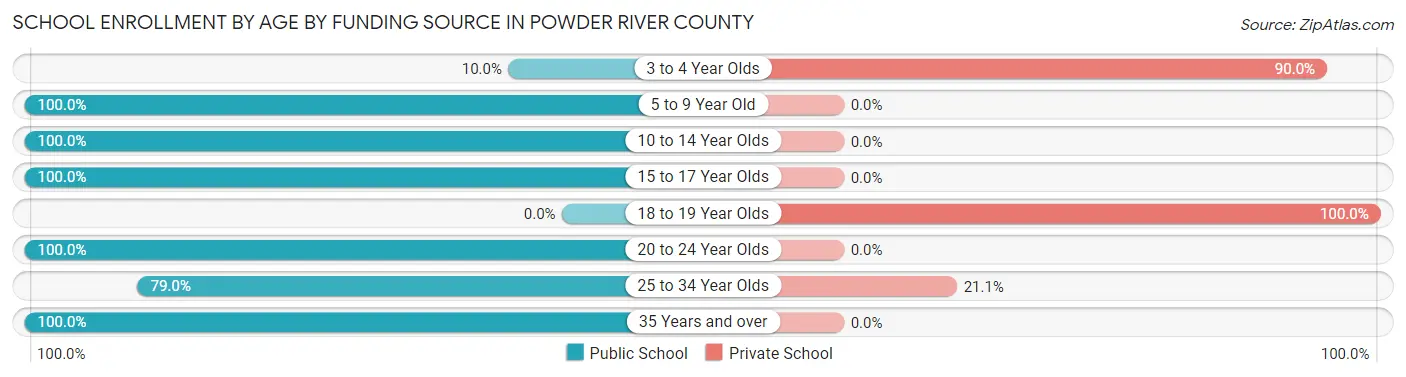
| Age Bracket | Public School | Private School |
| 3 to 4 Year Olds | 1 (10.0%) | 9 (90.0%) |
| 5 to 9 Year Old | 49 (100.0%) | 0 (0.0%) |
| 10 to 14 Year Olds | 109 (100.0%) | 0 (0.0%) |
| 15 to 17 Year Olds | 21 (100.0%) | 0 (0.0%) |
| 18 to 19 Year Olds | 0 (0.0%) | 7 (100.0%) |
| 20 to 24 Year Olds | 20 (100.0%) | 0 (0.0%) |
| 25 to 34 Year Olds | 15 (78.9%) | 4 (21.0%) |
| 35 Years and over | 6 (100.0%) | 0 (0.0%) |
| Total | 221 (91.7%) | 20 (8.3%) |
Educational Attainment by Field of Study in Powder River County
Business (98 | 23.3%), bio, nature & agricultural (90 | 21.4%), education (87 | 20.7%), science & technology (59 | 14.0%), and arts & humanities (25 | 5.9%) are the most common fields of study among 421 individuals in Powder River County who have obtained a bachelor's degree or higher.
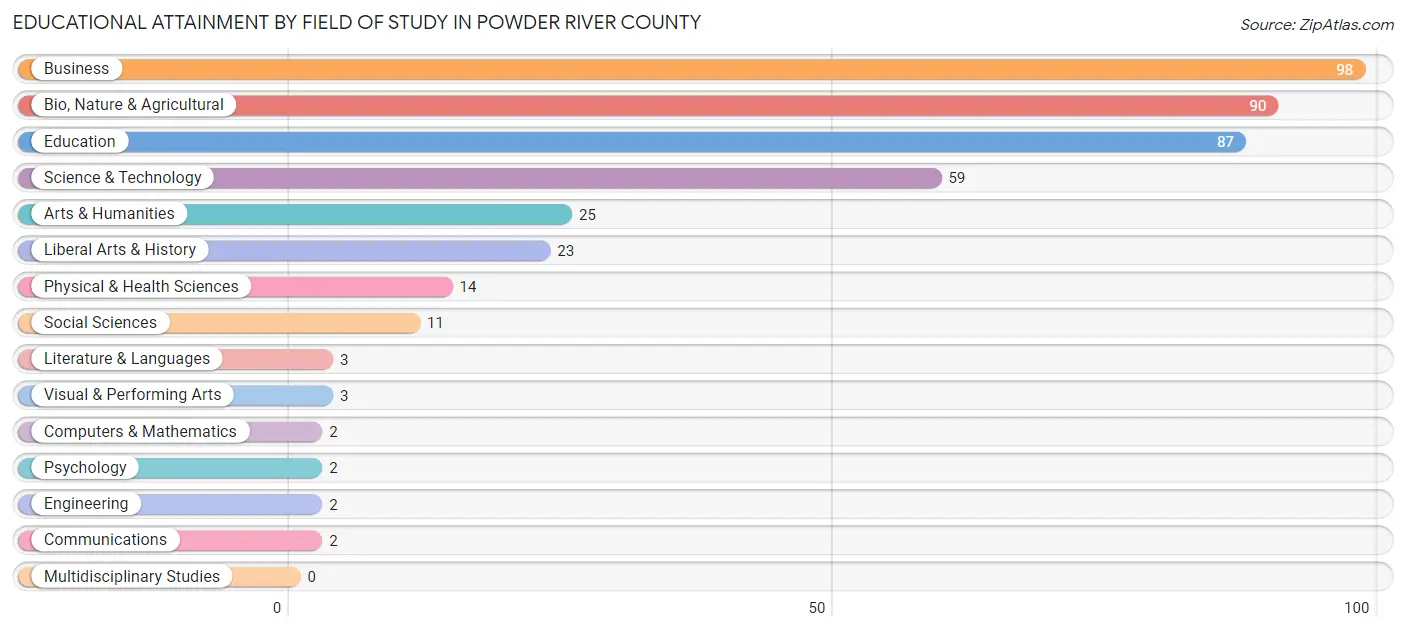
| Field of Study | # Graduates | % Graduates |
| Computers & Mathematics | 2 | 0.5% |
| Bio, Nature & Agricultural | 90 | 21.4% |
| Physical & Health Sciences | 14 | 3.3% |
| Psychology | 2 | 0.5% |
| Social Sciences | 11 | 2.6% |
| Engineering | 2 | 0.5% |
| Multidisciplinary Studies | 0 | 0.0% |
| Science & Technology | 59 | 14.0% |
| Business | 98 | 23.3% |
| Education | 87 | 20.7% |
| Literature & Languages | 3 | 0.7% |
| Liberal Arts & History | 23 | 5.5% |
| Visual & Performing Arts | 3 | 0.7% |
| Communications | 2 | 0.5% |
| Arts & Humanities | 25 | 5.9% |
| Total | 421 | 100.0% |
Transportation & Commute in Powder River County
Vehicle Availability by Sex in Powder River County
The most prevalent vehicle ownership categories in Powder River County are males with 3 vehicles (168, accounting for 32.5%) and females with 3 vehicles (83, making up 45.7%).
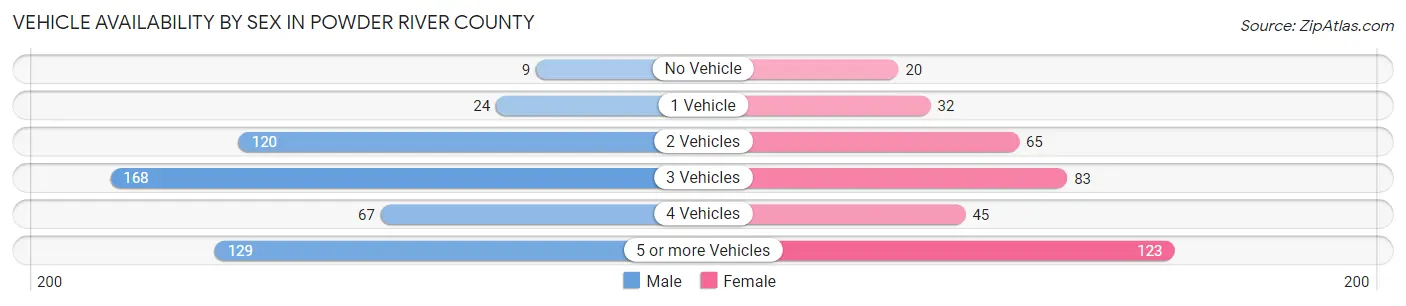
| Vehicles Available | Male | Female |
| No Vehicle | 9 (1.7%) | 20 (5.4%) |
| 1 Vehicle | 24 (4.6%) | 32 (8.7%) |
| 2 Vehicles | 120 (23.2%) | 65 (17.7%) |
| 3 Vehicles | 168 (32.5%) | 83 (22.6%) |
| 4 Vehicles | 67 (13.0%) | 45 (12.2%) |
| 5 or more Vehicles | 129 (24.9%) | 123 (33.4%) |
| Total | 517 (100.0%) | 368 (100.0%) |
Commute Time in Powder River County
The most frequently occuring commute durations in Powder River County are 5 to 9 minutes (248 commuters, 31.8%), less than 5 minutes (223 commuters, 28.6%), and 45 to 59 minutes (115 commuters, 14.7%).
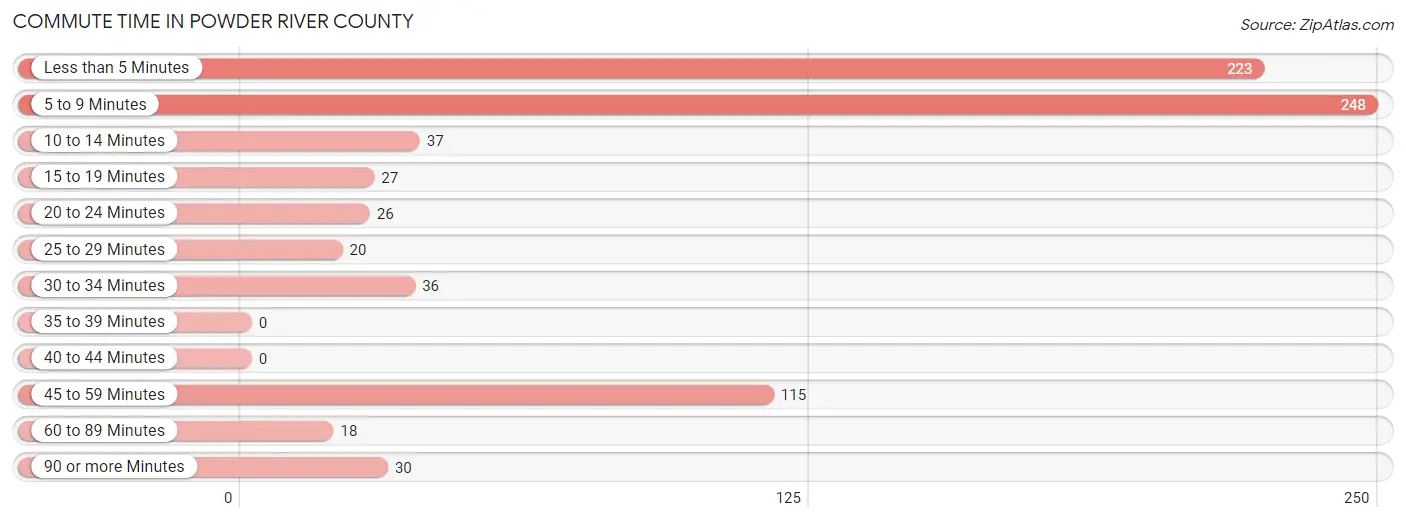
| Commute Time | # Commuters | % Commuters |
| Less than 5 Minutes | 223 | 28.6% |
| 5 to 9 Minutes | 248 | 31.8% |
| 10 to 14 Minutes | 37 | 4.7% |
| 15 to 19 Minutes | 27 | 3.5% |
| 20 to 24 Minutes | 26 | 3.3% |
| 25 to 29 Minutes | 20 | 2.6% |
| 30 to 34 Minutes | 36 | 4.6% |
| 35 to 39 Minutes | 0 | 0.0% |
| 40 to 44 Minutes | 0 | 0.0% |
| 45 to 59 Minutes | 115 | 14.7% |
| 60 to 89 Minutes | 18 | 2.3% |
| 90 or more Minutes | 30 | 3.8% |
Commute Time by Sex in Powder River County
The most common commute times in Powder River County are 5 to 9 minutes (179 commuters, 38.7%) for males and 45 to 59 minutes (93 commuters, 29.3%) for females.
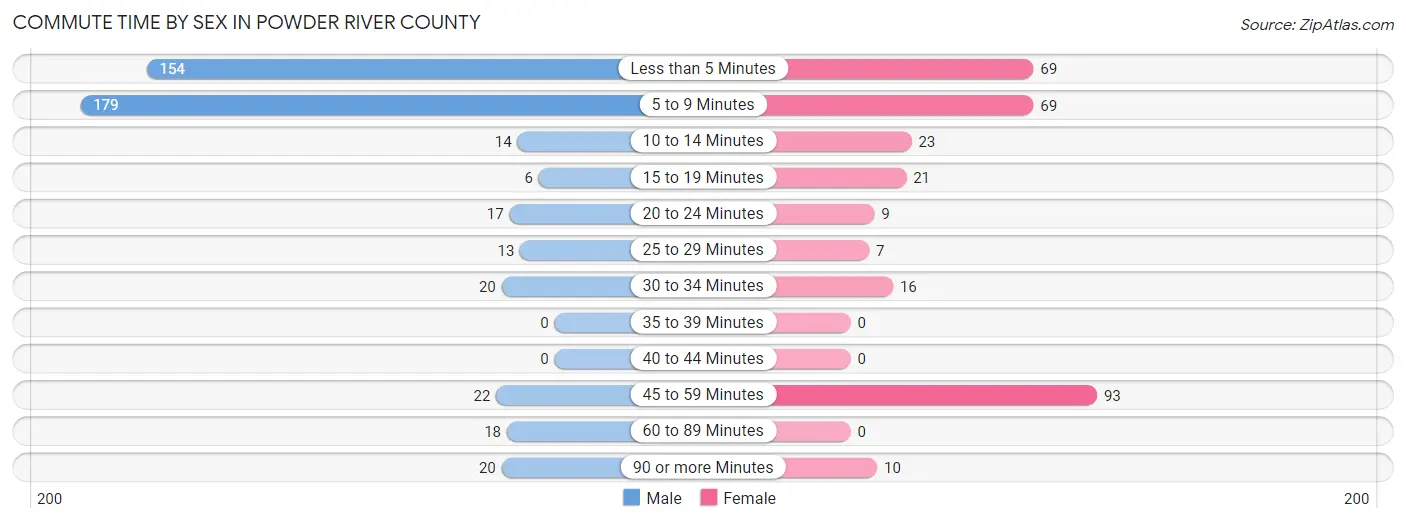
| Commute Time | Male | Female |
| Less than 5 Minutes | 154 (33.3%) | 69 (21.8%) |
| 5 to 9 Minutes | 179 (38.7%) | 69 (21.8%) |
| 10 to 14 Minutes | 14 (3.0%) | 23 (7.3%) |
| 15 to 19 Minutes | 6 (1.3%) | 21 (6.6%) |
| 20 to 24 Minutes | 17 (3.7%) | 9 (2.8%) |
| 25 to 29 Minutes | 13 (2.8%) | 7 (2.2%) |
| 30 to 34 Minutes | 20 (4.3%) | 16 (5.1%) |
| 35 to 39 Minutes | 0 (0.0%) | 0 (0.0%) |
| 40 to 44 Minutes | 0 (0.0%) | 0 (0.0%) |
| 45 to 59 Minutes | 22 (4.8%) | 93 (29.3%) |
| 60 to 89 Minutes | 18 (3.9%) | 0 (0.0%) |
| 90 or more Minutes | 20 (4.3%) | 10 (3.2%) |
Time of Departure to Work by Sex in Powder River County
The most frequent times of departure to work in Powder River County are 7:00 AM to 7:29 AM (91, 19.7%) for males and 7:00 AM to 7:29 AM (100, 31.6%) for females.
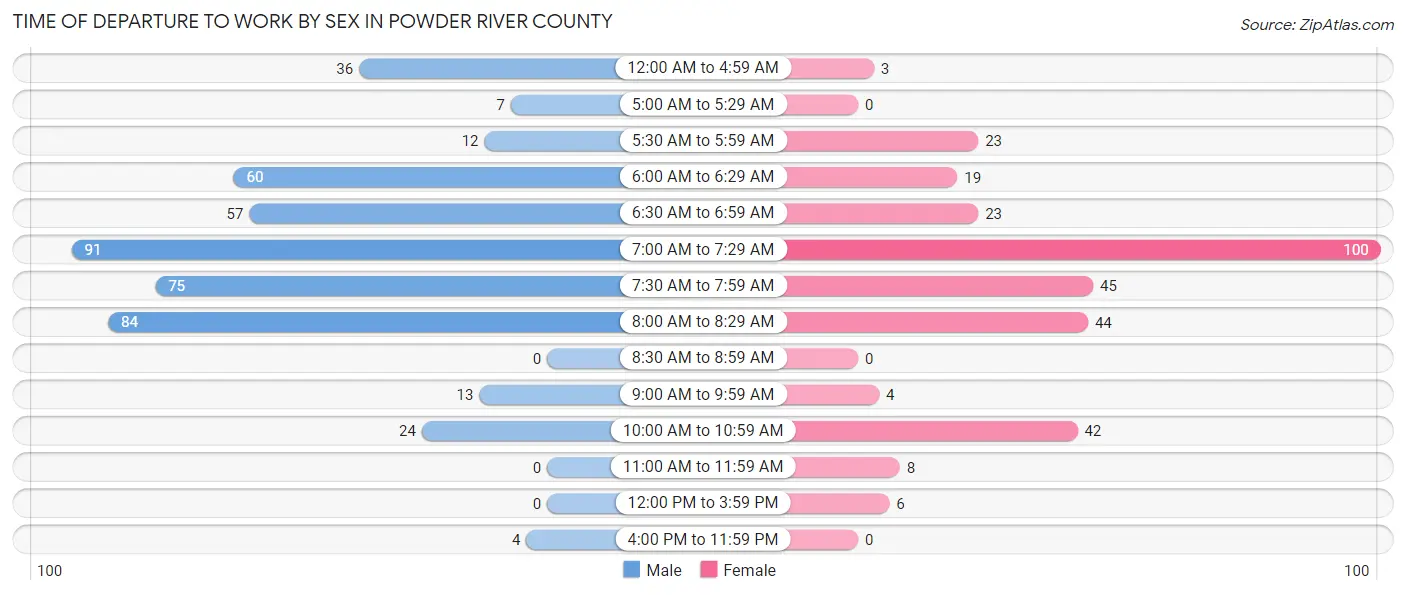
| Time of Departure | Male | Female |
| 12:00 AM to 4:59 AM | 36 (7.8%) | 3 (0.9%) |
| 5:00 AM to 5:29 AM | 7 (1.5%) | 0 (0.0%) |
| 5:30 AM to 5:59 AM | 12 (2.6%) | 23 (7.3%) |
| 6:00 AM to 6:29 AM | 60 (13.0%) | 19 (6.0%) |
| 6:30 AM to 6:59 AM | 57 (12.3%) | 23 (7.3%) |
| 7:00 AM to 7:29 AM | 91 (19.7%) | 100 (31.6%) |
| 7:30 AM to 7:59 AM | 75 (16.2%) | 45 (14.2%) |
| 8:00 AM to 8:29 AM | 84 (18.1%) | 44 (13.9%) |
| 8:30 AM to 8:59 AM | 0 (0.0%) | 0 (0.0%) |
| 9:00 AM to 9:59 AM | 13 (2.8%) | 4 (1.3%) |
| 10:00 AM to 10:59 AM | 24 (5.2%) | 42 (13.3%) |
| 11:00 AM to 11:59 AM | 0 (0.0%) | 8 (2.5%) |
| 12:00 PM to 3:59 PM | 0 (0.0%) | 6 (1.9%) |
| 4:00 PM to 11:59 PM | 4 (0.9%) | 0 (0.0%) |
| Total | 463 (100.0%) | 317 (100.0%) |
Housing Occupancy in Powder River County
Occupancy by Ownership in Powder River County
Of the total 746 dwellings in Powder River County, owner-occupied units account for 588 (78.8%), while renter-occupied units make up 158 (21.2%).
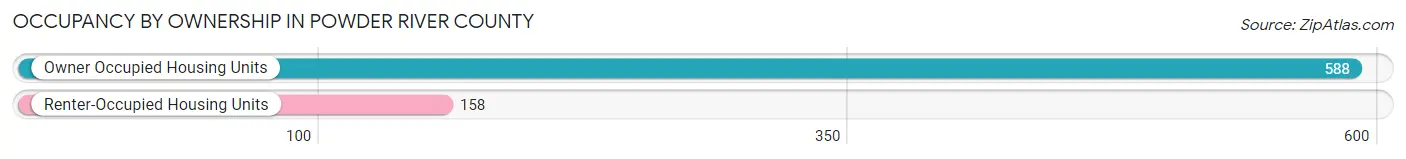
| Occupancy | # Housing Units | % Housing Units |
| Owner Occupied Housing Units | 588 | 78.8% |
| Renter-Occupied Housing Units | 158 | 21.2% |
| Total Occupied Housing Units | 746 | 100.0% |
Occupancy by Household Size in Powder River County
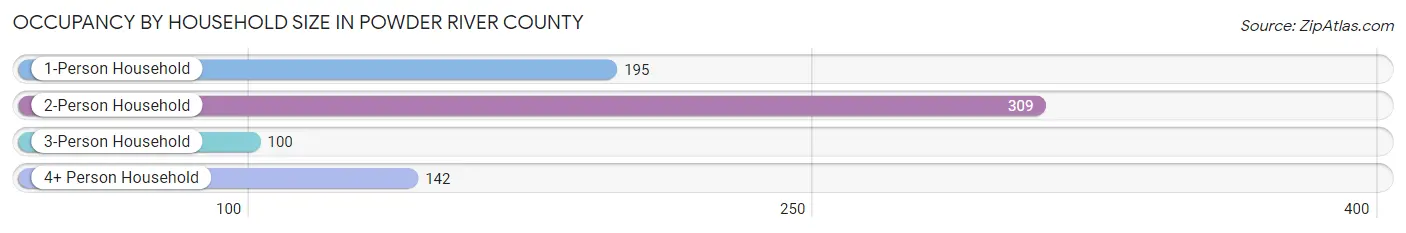
| Household Size | # Housing Units | % Housing Units |
| 1-Person Household | 195 | 26.1% |
| 2-Person Household | 309 | 41.4% |
| 3-Person Household | 100 | 13.4% |
| 4+ Person Household | 142 | 19.0% |
| Total Housing Units | 746 | 100.0% |
Occupancy by Ownership by Household Size in Powder River County
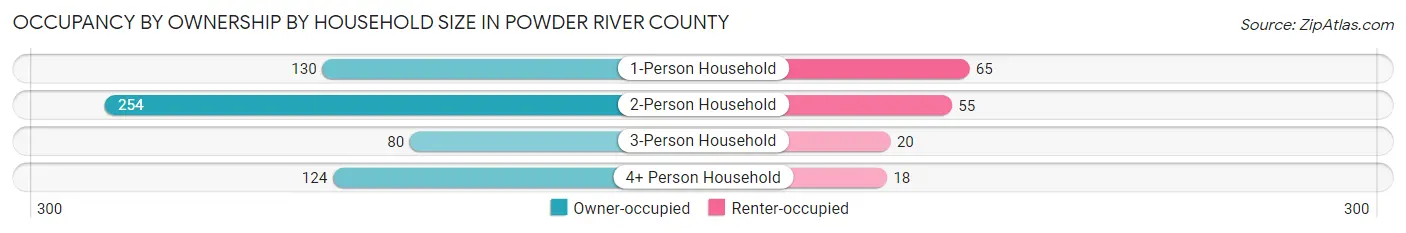
| Household Size | Owner-occupied | Renter-occupied |
| 1-Person Household | 130 (66.7%) | 65 (33.3%) |
| 2-Person Household | 254 (82.2%) | 55 (17.8%) |
| 3-Person Household | 80 (80.0%) | 20 (20.0%) |
| 4+ Person Household | 124 (87.3%) | 18 (12.7%) |
| Total Housing Units | 588 (78.8%) | 158 (21.2%) |
Occupancy by Educational Attainment in Powder River County
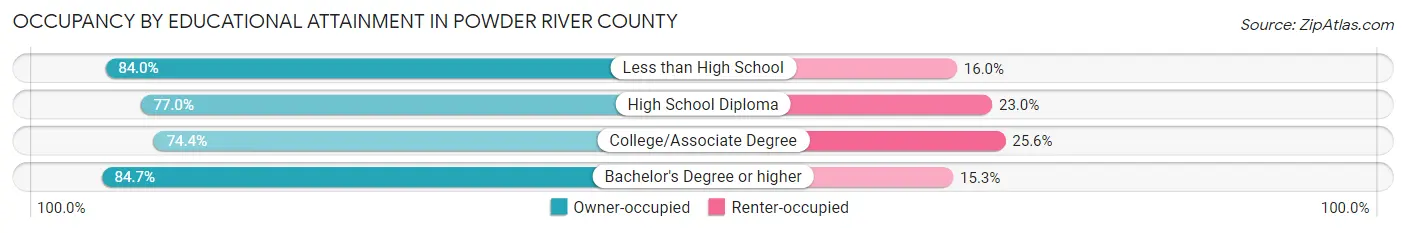
| Household Size | Owner-occupied | Renter-occupied |
| Less than High School | 63 (84.0%) | 12 (16.0%) |
| High School Diploma | 181 (77.0%) | 54 (23.0%) |
| College/Associate Degree | 183 (74.4%) | 63 (25.6%) |
| Bachelor's Degree or higher | 161 (84.7%) | 29 (15.3%) |
Occupancy by Age of Householder in Powder River County
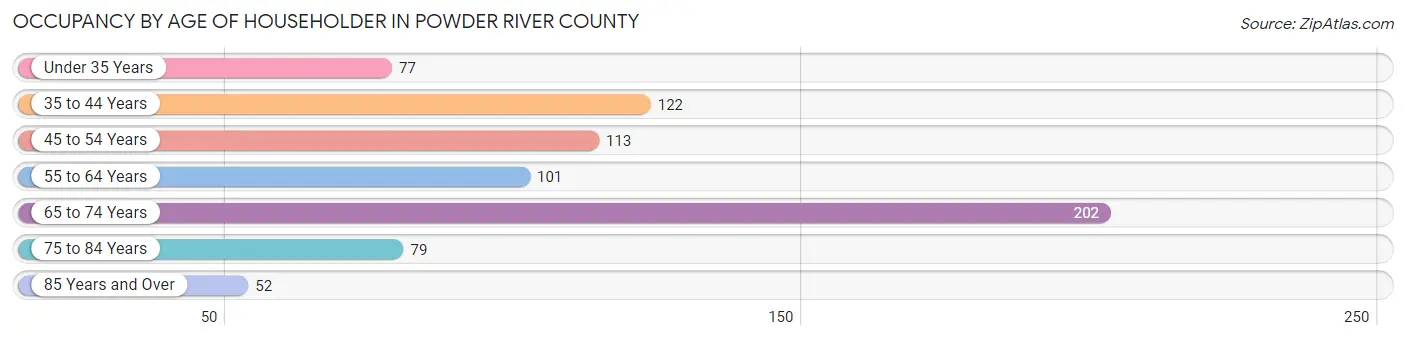
| Age Bracket | # Households | % Households |
| Under 35 Years | 77 | 10.3% |
| 35 to 44 Years | 122 | 16.4% |
| 45 to 54 Years | 113 | 15.1% |
| 55 to 64 Years | 101 | 13.5% |
| 65 to 74 Years | 202 | 27.1% |
| 75 to 84 Years | 79 | 10.6% |
| 85 Years and Over | 52 | 7.0% |
| Total | 746 | 100.0% |
Housing Finances in Powder River County
Median Income by Occupancy in Powder River County
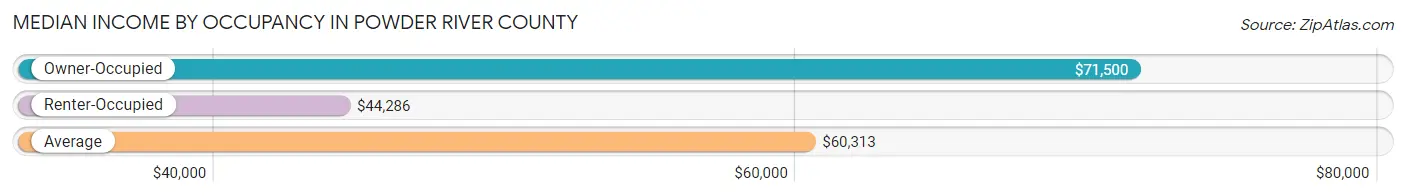
| Occupancy Type | # Households | Median Income |
| Owner-Occupied | 588 (78.8%) | $71,500 |
| Renter-Occupied | 158 (21.2%) | $44,286 |
| Average | 746 (100.0%) | $60,313 |
Occupancy by Householder Income Bracket in Powder River County
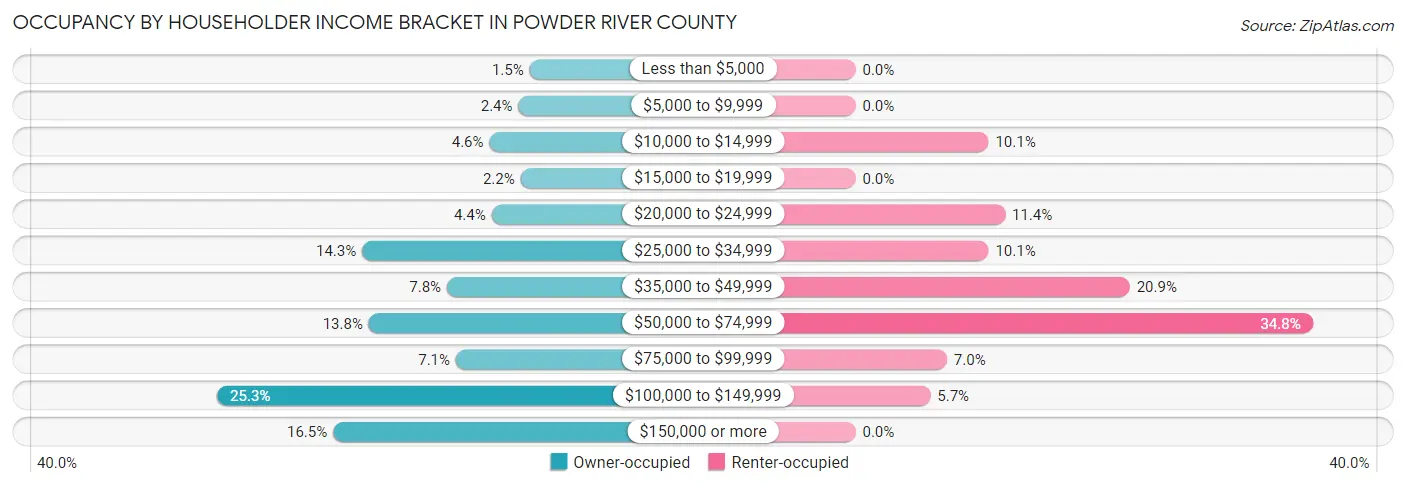
| Income Bracket | Owner-occupied | Renter-occupied |
| Less than $5,000 | 9 (1.5%) | 0 (0.0%) |
| $5,000 to $9,999 | 14 (2.4%) | 0 (0.0%) |
| $10,000 to $14,999 | 27 (4.6%) | 16 (10.1%) |
| $15,000 to $19,999 | 13 (2.2%) | 0 (0.0%) |
| $20,000 to $24,999 | 26 (4.4%) | 18 (11.4%) |
| $25,000 to $34,999 | 84 (14.3%) | 16 (10.1%) |
| $35,000 to $49,999 | 46 (7.8%) | 33 (20.9%) |
| $50,000 to $74,999 | 81 (13.8%) | 55 (34.8%) |
| $75,000 to $99,999 | 42 (7.1%) | 11 (7.0%) |
| $100,000 to $149,999 | 149 (25.3%) | 9 (5.7%) |
| $150,000 or more | 97 (16.5%) | 0 (0.0%) |
| Total | 588 (100.0%) | 158 (100.0%) |
Monthly Housing Cost Tiers in Powder River County

| Monthly Cost | Owner-occupied | Renter-occupied |
| Less than $300 | 53 (9.0%) | 0 (0.0%) |
| $300 to $499 | 158 (26.9%) | 10 (6.3%) |
| $500 to $799 | 164 (27.9%) | 26 (16.5%) |
| $800 to $999 | 66 (11.2%) | 11 (7.0%) |
| $1,000 to $1,499 | 62 (10.5%) | 10 (6.3%) |
| $1,500 to $1,999 | 52 (8.8%) | 3 (1.9%) |
| $2,000 to $2,499 | 7 (1.2%) | 0 (0.0%) |
| $2,500 to $2,999 | 11 (1.9%) | 0 (0.0%) |
| $3,000 or more | 15 (2.5%) | 0 (0.0%) |
| Total | 588 (100.0%) | 158 (100.0%) |
Physical Housing Characteristics in Powder River County
Housing Structures in Powder River County
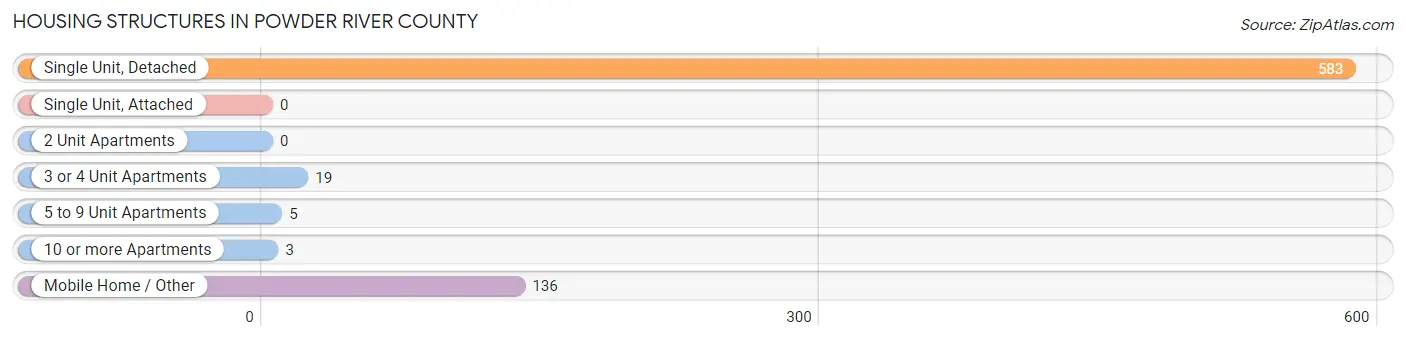
| Structure Type | # Housing Units | % Housing Units |
| Single Unit, Detached | 583 | 78.1% |
| Single Unit, Attached | 0 | 0.0% |
| 2 Unit Apartments | 0 | 0.0% |
| 3 or 4 Unit Apartments | 19 | 2.5% |
| 5 to 9 Unit Apartments | 5 | 0.7% |
| 10 or more Apartments | 3 | 0.4% |
| Mobile Home / Other | 136 | 18.2% |
| Total | 746 | 100.0% |
Housing Structures by Occupancy in Powder River County
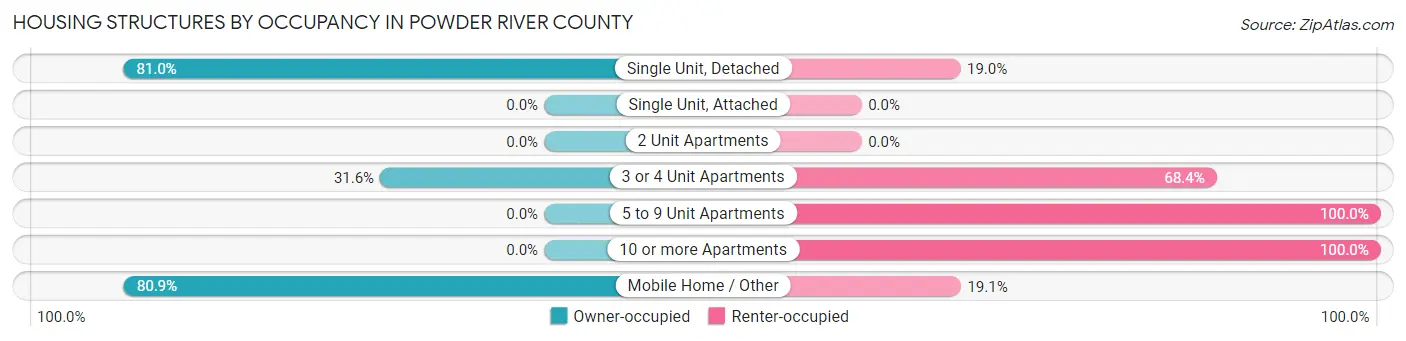
| Structure Type | Owner-occupied | Renter-occupied |
| Single Unit, Detached | 472 (81.0%) | 111 (19.0%) |
| Single Unit, Attached | 0 (0.0%) | 0 (0.0%) |
| 2 Unit Apartments | 0 (0.0%) | 0 (0.0%) |
| 3 or 4 Unit Apartments | 6 (31.6%) | 13 (68.4%) |
| 5 to 9 Unit Apartments | 0 (0.0%) | 5 (100.0%) |
| 10 or more Apartments | 0 (0.0%) | 3 (100.0%) |
| Mobile Home / Other | 110 (80.9%) | 26 (19.1%) |
| Total | 588 (78.8%) | 158 (21.2%) |
Housing Structures by Number of Rooms in Powder River County
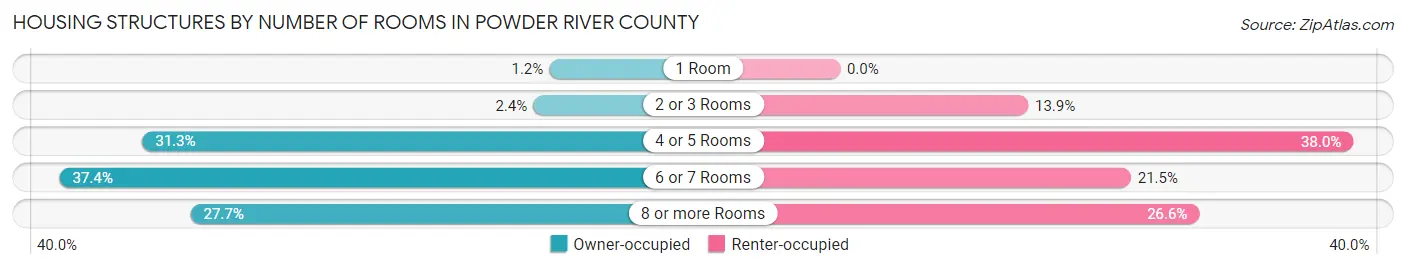
| Number of Rooms | Owner-occupied | Renter-occupied |
| 1 Room | 7 (1.2%) | 0 (0.0%) |
| 2 or 3 Rooms | 14 (2.4%) | 22 (13.9%) |
| 4 or 5 Rooms | 184 (31.3%) | 60 (38.0%) |
| 6 or 7 Rooms | 220 (37.4%) | 34 (21.5%) |
| 8 or more Rooms | 163 (27.7%) | 42 (26.6%) |
| Total | 588 (100.0%) | 158 (100.0%) |
Housing Structure by Heating Type in Powder River County
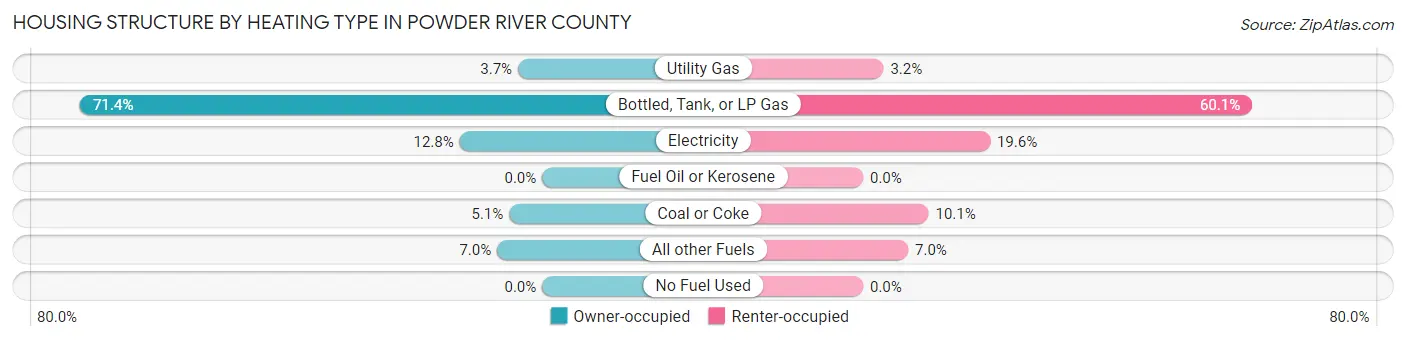
| Heating Type | Owner-occupied | Renter-occupied |
| Utility Gas | 22 (3.7%) | 5 (3.2%) |
| Bottled, Tank, or LP Gas | 420 (71.4%) | 95 (60.1%) |
| Electricity | 75 (12.8%) | 31 (19.6%) |
| Fuel Oil or Kerosene | 0 (0.0%) | 0 (0.0%) |
| Coal or Coke | 30 (5.1%) | 16 (10.1%) |
| All other Fuels | 41 (7.0%) | 11 (7.0%) |
| No Fuel Used | 0 (0.0%) | 0 (0.0%) |
| Total | 588 (100.0%) | 158 (100.0%) |
Household Vehicle Usage in Powder River County
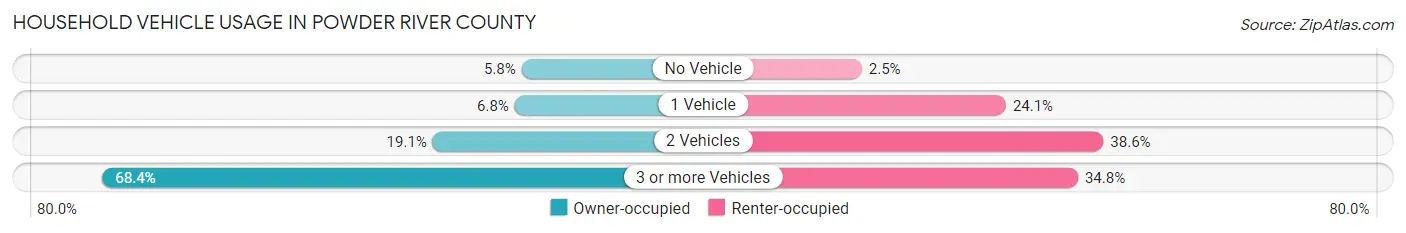
| Vehicles per Household | Owner-occupied | Renter-occupied |
| No Vehicle | 34 (5.8%) | 4 (2.5%) |
| 1 Vehicle | 40 (6.8%) | 38 (24.0%) |
| 2 Vehicles | 112 (19.1%) | 61 (38.6%) |
| 3 or more Vehicles | 402 (68.4%) | 55 (34.8%) |
| Total | 588 (100.0%) | 158 (100.0%) |
Real Estate & Mortgages in Powder River County
Real Estate and Mortgage Overview in Powder River County
| Characteristic | Without Mortgage | With Mortgage |
| Housing Units | 409 | 179 |
| Median Property Value | $149,400 | $212,000 |
| Median Household Income | $64,375 | $46 |
| Monthly Housing Costs | $494 | $15 |
| Real Estate Taxes | $1,209 | $3 |
Property Value by Mortgage Status in Powder River County
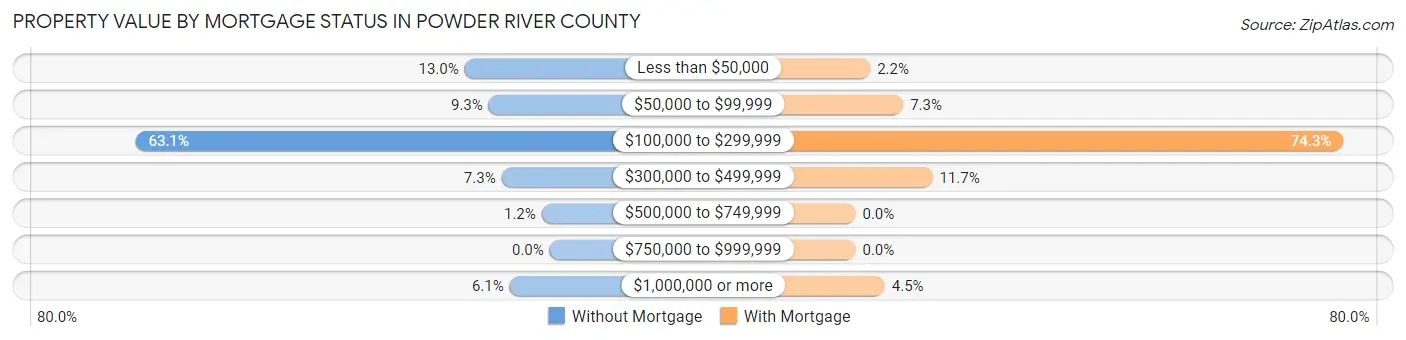
| Property Value | Without Mortgage | With Mortgage |
| Less than $50,000 | 53 (13.0%) | 4 (2.2%) |
| $50,000 to $99,999 | 38 (9.3%) | 13 (7.3%) |
| $100,000 to $299,999 | 258 (63.1%) | 133 (74.3%) |
| $300,000 to $499,999 | 30 (7.3%) | 21 (11.7%) |
| $500,000 to $749,999 | 5 (1.2%) | 0 (0.0%) |
| $750,000 to $999,999 | 0 (0.0%) | 0 (0.0%) |
| $1,000,000 or more | 25 (6.1%) | 8 (4.5%) |
| Total | 409 (100.0%) | 179 (100.0%) |
Household Income by Mortgage Status in Powder River County
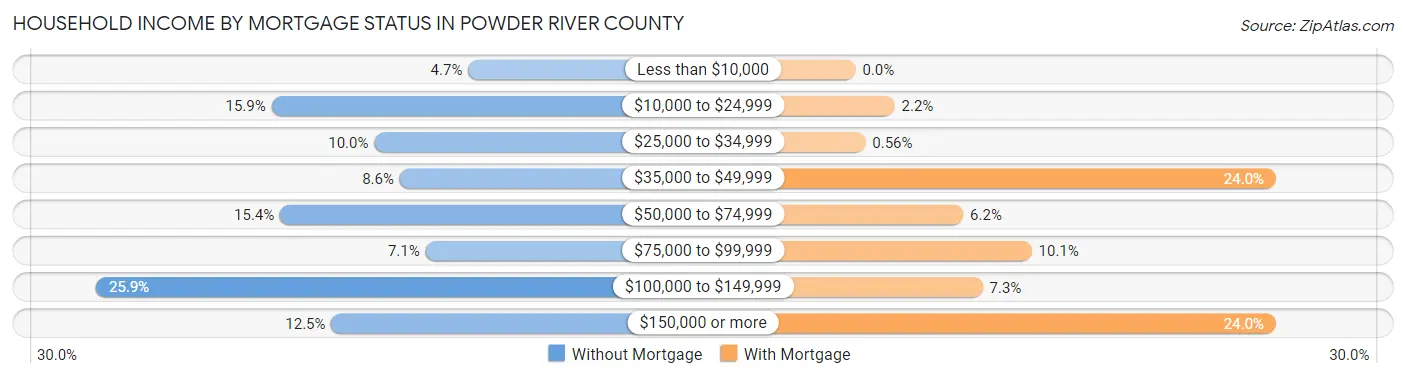
| Household Income | Without Mortgage | With Mortgage |
| Less than $10,000 | 19 (4.6%) | 0 (0.0%) |
| $10,000 to $24,999 | 65 (15.9%) | 4 (2.2%) |
| $25,000 to $34,999 | 41 (10.0%) | 1 (0.6%) |
| $35,000 to $49,999 | 35 (8.6%) | 43 (24.0%) |
| $50,000 to $74,999 | 63 (15.4%) | 11 (6.1%) |
| $75,000 to $99,999 | 29 (7.1%) | 18 (10.1%) |
| $100,000 to $149,999 | 106 (25.9%) | 13 (7.3%) |
| $150,000 or more | 51 (12.5%) | 43 (24.0%) |
| Total | 409 (100.0%) | 179 (100.0%) |
Property Value to Household Income Ratio in Powder River County
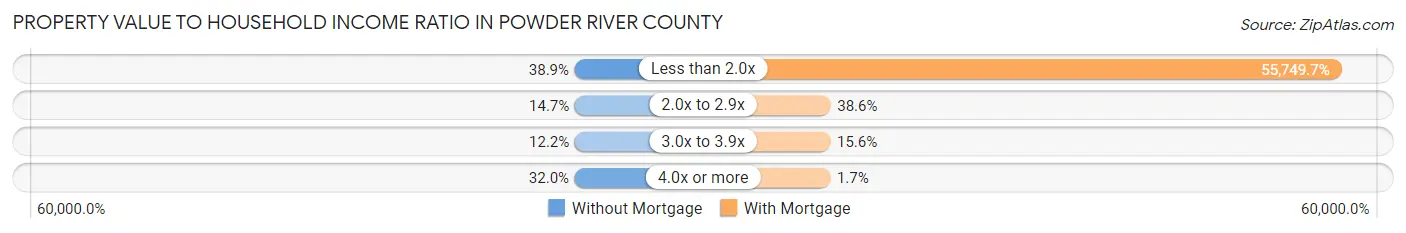
| Value-to-Income Ratio | Without Mortgage | With Mortgage |
| Less than 2.0x | 159 (38.9%) | 99,792 (55,749.7%) |
| 2.0x to 2.9x | 60 (14.7%) | 69 (38.6%) |
| 3.0x to 3.9x | 50 (12.2%) | 28 (15.6%) |
| 4.0x or more | 131 (32.0%) | 3 (1.7%) |
| Total | 409 (100.0%) | 179 (100.0%) |
Real Estate Taxes by Mortgage Status in Powder River County
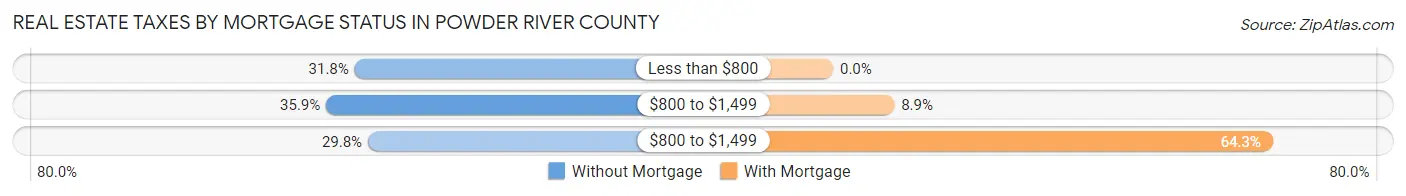
| Property Taxes | Without Mortgage | With Mortgage |
| Less than $800 | 130 (31.8%) | 0 (0.0%) |
| $800 to $1,499 | 147 (35.9%) | 16 (8.9%) |
| $800 to $1,499 | 122 (29.8%) | 115 (64.2%) |
| Total | 409 (100.0%) | 179 (100.0%) |
Health & Disability in Powder River County
Health Insurance Coverage by Age in Powder River County
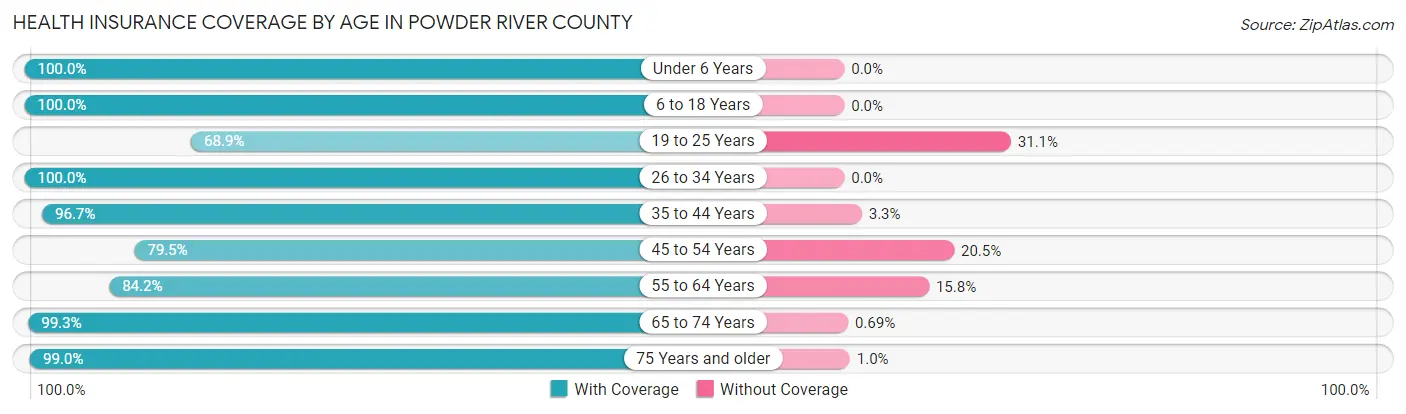
| Age Bracket | With Coverage | Without Coverage |
| Under 6 Years | 115 (100.0%) | 0 (0.0%) |
| 6 to 18 Years | 189 (100.0%) | 0 (0.0%) |
| 19 to 25 Years | 91 (68.9%) | 41 (31.1%) |
| 26 to 34 Years | 166 (100.0%) | 0 (0.0%) |
| 35 to 44 Years | 178 (96.7%) | 6 (3.3%) |
| 45 to 54 Years | 171 (79.5%) | 44 (20.5%) |
| 55 to 64 Years | 208 (84.2%) | 39 (15.8%) |
| 65 to 74 Years | 289 (99.3%) | 2 (0.7%) |
| 75 Years and older | 192 (99.0%) | 2 (1.0%) |
| Total | 1,599 (92.3%) | 134 (7.7%) |
Health Insurance Coverage by Citizenship Status in Powder River County
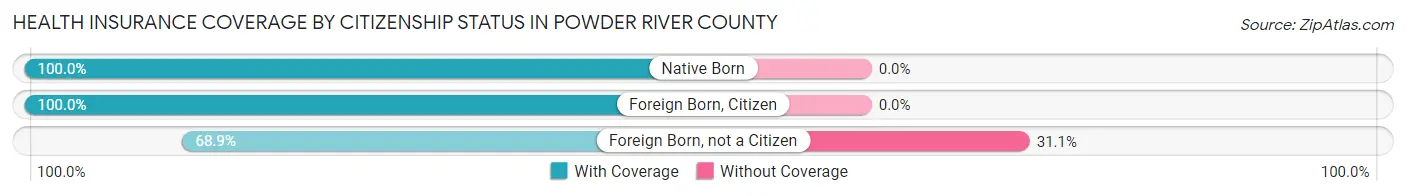
| Citizenship Status | With Coverage | Without Coverage |
| Native Born | 115 (100.0%) | 0 (0.0%) |
| Foreign Born, Citizen | 189 (100.0%) | 0 (0.0%) |
| Foreign Born, not a Citizen | 91 (68.9%) | 41 (31.1%) |
Health Insurance Coverage by Household Income in Powder River County
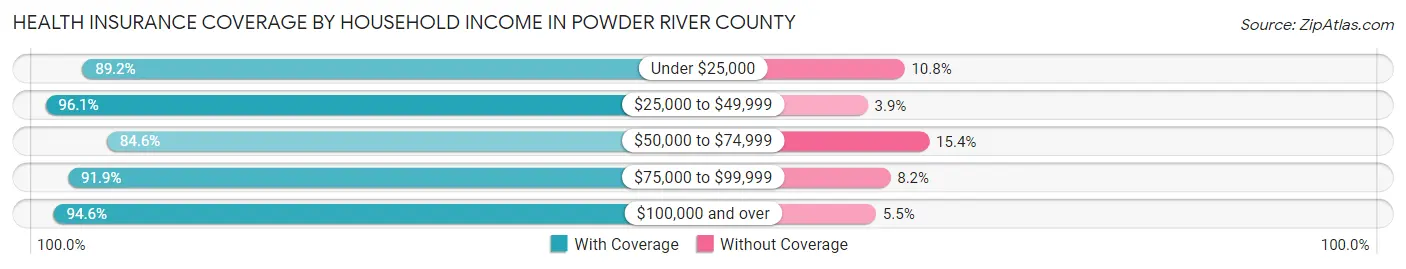
| Household Income | With Coverage | Without Coverage |
| Under $25,000 | 165 (89.2%) | 20 (10.8%) |
| $25,000 to $49,999 | 346 (96.1%) | 14 (3.9%) |
| $50,000 to $74,999 | 274 (84.6%) | 50 (15.4%) |
| $75,000 to $99,999 | 124 (91.8%) | 11 (8.2%) |
| $100,000 and over | 677 (94.6%) | 39 (5.4%) |
Public vs Private Health Insurance Coverage by Age in Powder River County
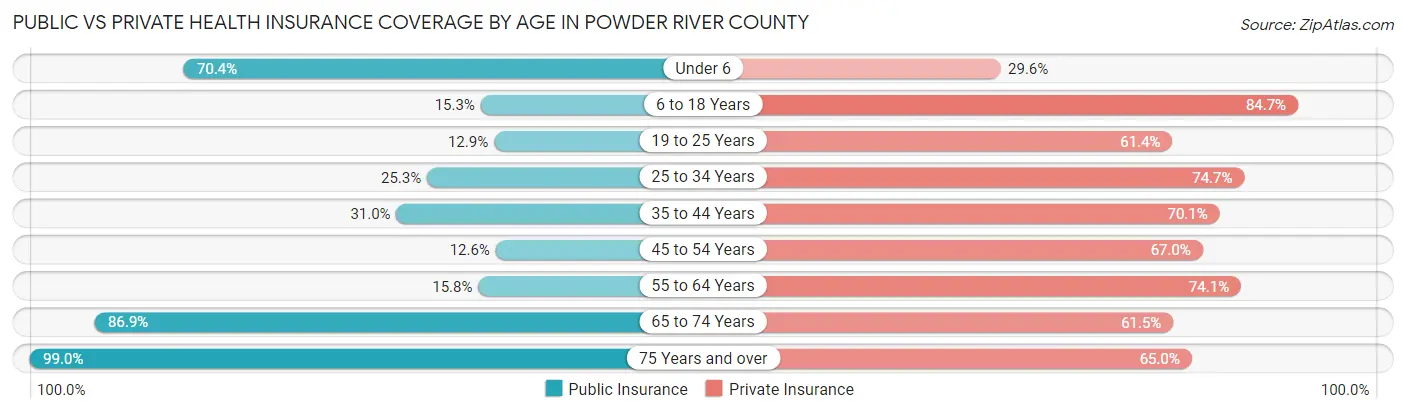
| Age Bracket | Public Insurance | Private Insurance |
| Under 6 | 81 (70.4%) | 34 (29.6%) |
| 6 to 18 Years | 29 (15.3%) | 160 (84.7%) |
| 19 to 25 Years | 17 (12.9%) | 81 (61.4%) |
| 25 to 34 Years | 42 (25.3%) | 124 (74.7%) |
| 35 to 44 Years | 57 (31.0%) | 129 (70.1%) |
| 45 to 54 Years | 27 (12.6%) | 144 (67.0%) |
| 55 to 64 Years | 39 (15.8%) | 183 (74.1%) |
| 65 to 74 Years | 253 (86.9%) | 179 (61.5%) |
| 75 Years and over | 192 (99.0%) | 126 (64.9%) |
| Total | 737 (42.5%) | 1,160 (66.9%) |
Disability Status by Sex by Age in Powder River County
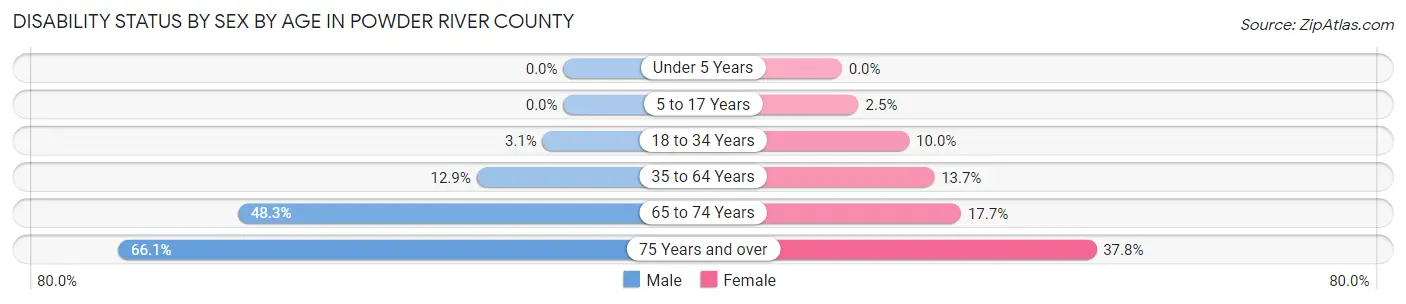
| Age Bracket | Male | Female |
| Under 5 Years | 0 (0.0%) | 0 (0.0%) |
| 5 to 17 Years | 0 (0.0%) | 3 (2.5%) |
| 18 to 34 Years | 5 (3.1%) | 14 (10.0%) |
| 35 to 64 Years | 41 (12.9%) | 45 (13.7%) |
| 65 to 74 Years | 86 (48.3%) | 20 (17.7%) |
| 75 Years and over | 39 (66.1%) | 51 (37.8%) |
Disability Class by Sex by Age in Powder River County
Disability Class: Hearing Difficulty
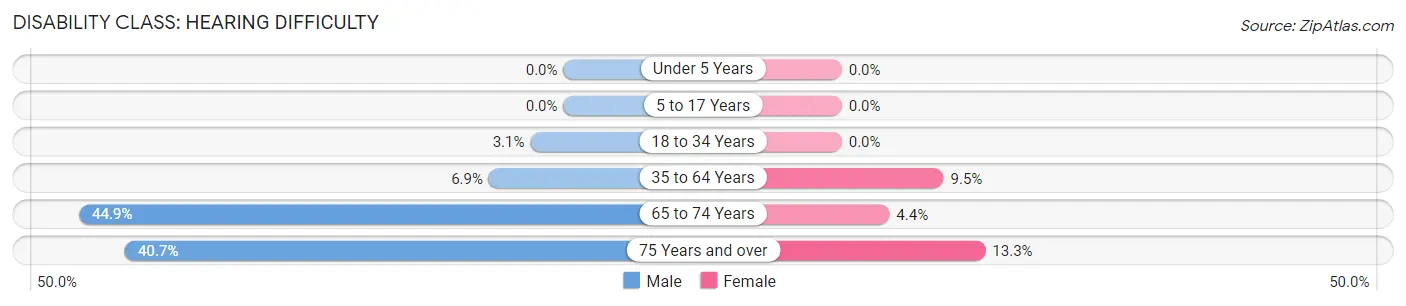
| Age Bracket | Male | Female |
| Under 5 Years | 0 (0.0%) | 0 (0.0%) |
| 5 to 17 Years | 0 (0.0%) | 0 (0.0%) |
| 18 to 34 Years | 5 (3.1%) | 0 (0.0%) |
| 35 to 64 Years | 22 (6.9%) | 31 (9.5%) |
| 65 to 74 Years | 80 (44.9%) | 5 (4.4%) |
| 75 Years and over | 24 (40.7%) | 18 (13.3%) |
Disability Class: Vision Difficulty
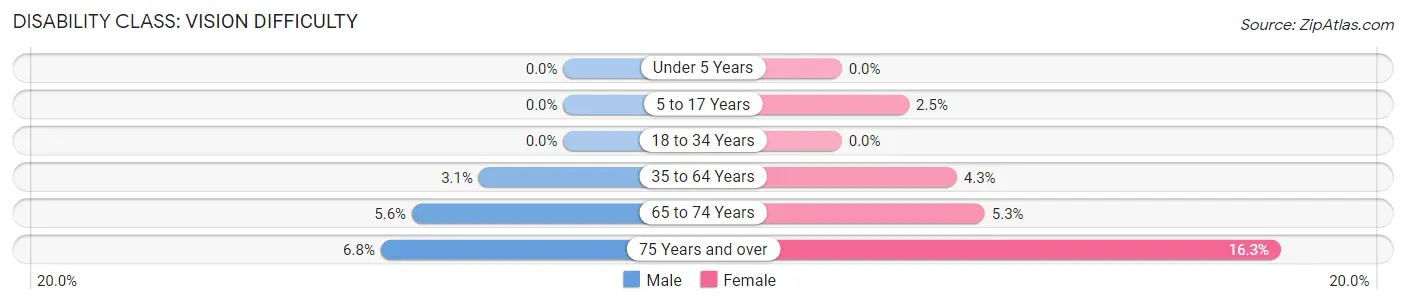
| Age Bracket | Male | Female |
| Under 5 Years | 0 (0.0%) | 0 (0.0%) |
| 5 to 17 Years | 0 (0.0%) | 3 (2.5%) |
| 18 to 34 Years | 0 (0.0%) | 0 (0.0%) |
| 35 to 64 Years | 10 (3.1%) | 14 (4.3%) |
| 65 to 74 Years | 10 (5.6%) | 6 (5.3%) |
| 75 Years and over | 4 (6.8%) | 22 (16.3%) |
Disability Class: Cognitive Difficulty
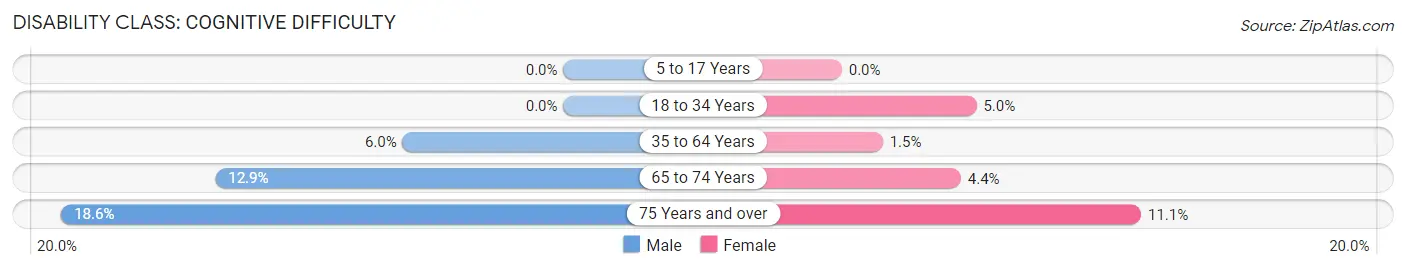
| Age Bracket | Male | Female |
| 5 to 17 Years | 0 (0.0%) | 0 (0.0%) |
| 18 to 34 Years | 0 (0.0%) | 7 (5.0%) |
| 35 to 64 Years | 19 (6.0%) | 5 (1.5%) |
| 65 to 74 Years | 23 (12.9%) | 5 (4.4%) |
| 75 Years and over | 11 (18.6%) | 15 (11.1%) |
Disability Class: Ambulatory Difficulty
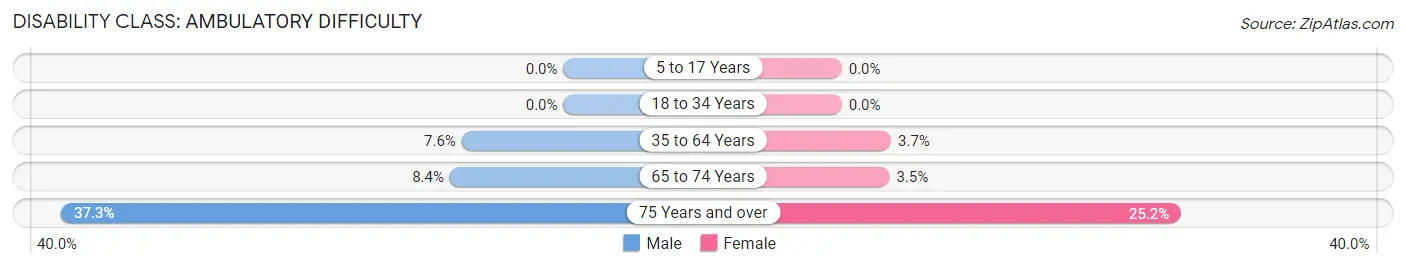
| Age Bracket | Male | Female |
| 5 to 17 Years | 0 (0.0%) | 0 (0.0%) |
| 18 to 34 Years | 0 (0.0%) | 0 (0.0%) |
| 35 to 64 Years | 24 (7.5%) | 12 (3.7%) |
| 65 to 74 Years | 15 (8.4%) | 4 (3.5%) |
| 75 Years and over | 22 (37.3%) | 34 (25.2%) |
Disability Class: Self-Care Difficulty
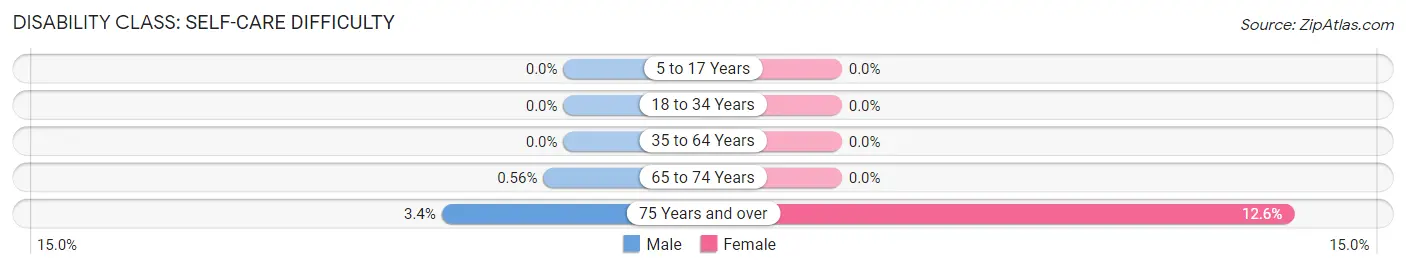
| Age Bracket | Male | Female |
| 5 to 17 Years | 0 (0.0%) | 0 (0.0%) |
| 18 to 34 Years | 0 (0.0%) | 0 (0.0%) |
| 35 to 64 Years | 0 (0.0%) | 0 (0.0%) |
| 65 to 74 Years | 1 (0.6%) | 0 (0.0%) |
| 75 Years and over | 2 (3.4%) | 17 (12.6%) |
Technology Access in Powder River County
Computing Device Access in Powder River County
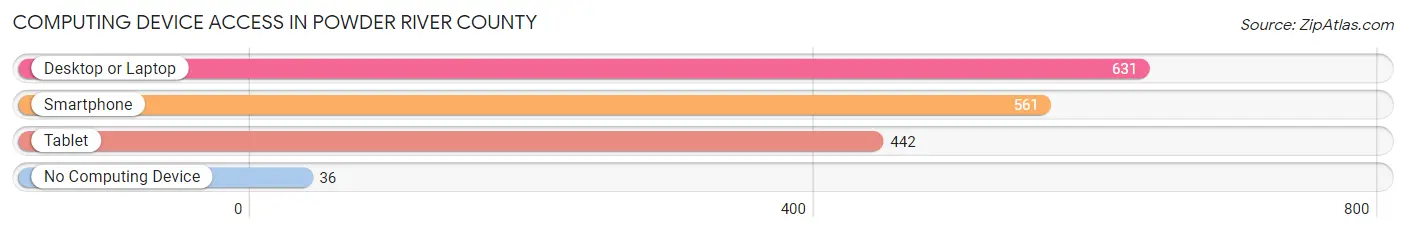
| Device Type | # Households | % Households |
| Desktop or Laptop | 631 | 84.6% |
| Smartphone | 561 | 75.2% |
| Tablet | 442 | 59.3% |
| No Computing Device | 36 | 4.8% |
| Total | 746 | 100.0% |
Internet Access in Powder River County
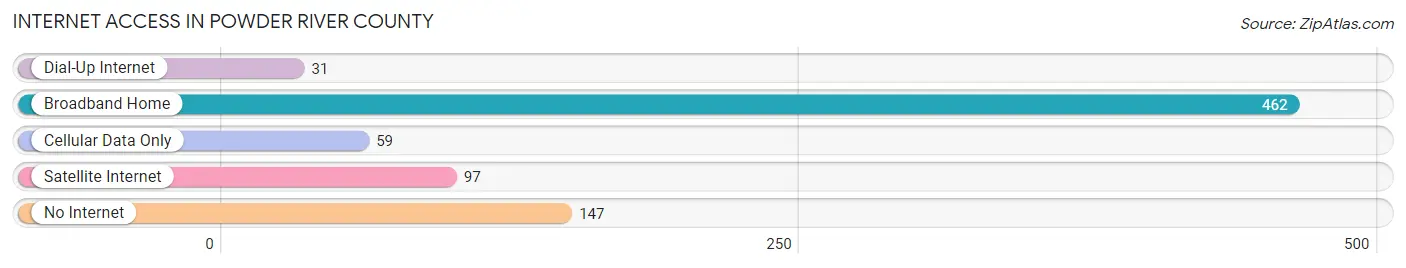
| Internet Type | # Households | % Households |
| Dial-Up Internet | 31 | 4.2% |
| Broadband Home | 462 | 61.9% |
| Cellular Data Only | 59 | 7.9% |
| Satellite Internet | 97 | 13.0% |
| No Internet | 147 | 19.7% |
| Total | 746 | 100.0% |
Powder River County Summary
Powder River County is located in the southeastern corner of Montana, and is bordered by Wyoming to the south and east, and Musselshell County to the north and west. The county seat is Broadus, and the county is named after the Powder River, which flows through the county. The county has a total area of 1,845 square miles, of which 1,843 square miles is land and 2 square miles is water.
History
Powder River County was established in 1919, and was named after the Powder River, which flows through the county. The county was originally part of Custer County, and was created from parts of Custer, Rosebud, and Yellowstone counties. The county was created to provide better access to the resources of the area, and to provide better government services to the residents.
The first settlers in the area were ranchers, who began to arrive in the late 1800s. The first town in the county was Broadus, which was established in 1887. The town was named after the Broadus family, who were the first settlers in the area.
Geography
Powder River County is located in the southeastern corner of Montana, and is bordered by Wyoming to the south and east, and Musselshell County to the north and west. The county has a total area of 1,845 square miles, of which 1,843 square miles is land and 2 square miles is water. The county is mostly flat, with rolling hills in the east and south. The Powder River flows through the county, and is the main source of water for the area.
The county is home to several wildlife refuges, including the Powder River Wildlife Refuge, the Redwater Wildlife Refuge, and the Tongue River Wildlife Refuge. The county is also home to several state parks, including the Tongue River State Park, the Redwater State Park, and the Powder River State Park.
Economy
The economy of Powder River County is largely based on agriculture and ranching. The county is home to several large ranches, and the county is also home to several small farms. The county is also home to several oil and gas fields, and the county is home to several coal mines.
The county is also home to several small businesses, including restaurants, retail stores, and other services. The county is also home to several tourist attractions, including the Tongue River State Park, the Redwater State Park, and the Powder River State Park.
Demographics
As of the 2010 census, there were 2,890 people, 1,093 households, and 745 families living in the county. The population density was 1.6 people per square mile. The racial makeup of the county was 95.3% White, 0.2% African American, 0.7% Native American, 0.2% Asian, 0.1% Pacific Islander, 1.7% from other races, and 1.8% from two or more races. Hispanic or Latino of any race were 4.2% of the population.
The median income for a household in the county was $35,938, and the median income for a family was $41,944. The per capita income for the county was $17,845. About 14.2% of families and 17.7% of the population were below the poverty line, including 22.2% of those under age 18 and 11.2% of those age 65 or over.
Common Questions
What is the Total Population of Powder River County?
Total Population of Powder River County is 1,773.
What is the Total Male Population of Powder River County?
Total Male Population of Powder River County is 876.
What is the Total Female Population of Powder River County?
Total Female Population of Powder River County is 897.
What is the Ratio of Males per 100 Females in Powder River County?
There are 97.66 Males per 100 Females in Powder River County.
What is the Ratio of Females per 100 Males in Powder River County?
There are 102.40 Females per 100 Males in Powder River County.
What is the Median Population Age in Powder River County?
Median Population Age in Powder River County is 49.9 Years.
What is the Average Family Size in Powder River County
Average Family Size in Powder River County is 2.7 People.
What is the Average Household Size in Powder River County
Average Household Size in Powder River County is 2.3 People.
What is Per Capita Income in Powder River County?
Per Capita income in Powder River County is $38,588.
What is the Median Family Income in Powder River County?
Median Family Income in Powder River County is $79,000.
What is the Median Household income in Powder River County?
Median Household Income in Powder River County is $60,313.
What is Income or Wage Gap in Powder River County?
Income or Wage Gap in Powder River County is 16.8%.
Women in Powder River County earn 83.2 cents for every dollar earned by a man.
What is Inequality or Gini Index in Powder River County?
Inequality or Gini Index in Powder River County is 0.47.
How Large is the Labor Force in Powder River County?
There are 918 People in the Labor Forcein in Powder River County.
What is the Percentage of People in the Labor Force in Powder River County?
61.3% of People are in the Labor Force in Powder River County.
What is the Unemployment Rate in Powder River County?
Unemployment Rate in Powder River County is 1.0%.