Pondera County, MT
Pondera County Map

Pondera County Overview
5,987
TOTAL POPULATION
3,013
MALE POPULATION
2,974
FEMALE POPULATION
101.31
MALES / 100 FEMALES
98.71
FEMALES / 100 MALES
41.6
MEDIAN AGE
3.2
AVG FAMILY SIZE
2.7
AVG HOUSEHOLD SIZE
$30,424
PER CAPITA INCOME
$74,806
AVG FAMILY INCOME
$59,861
AVG HOUSEHOLD INCOME
23.4%
WAGE / INCOME GAP [ % ]
76.6¢/ $1
WAGE / INCOME GAP [ $ ]
$15,463
FAMILY INCOME DEFICIT
0.44
INEQUALITY / GINI INDEX
2,825
LABOR FORCE [ PEOPLE ]
59.9%
PERCENT IN LABOR FORCE
6.4%
UNEMPLOYMENT RATE
Pondera County Area Codes
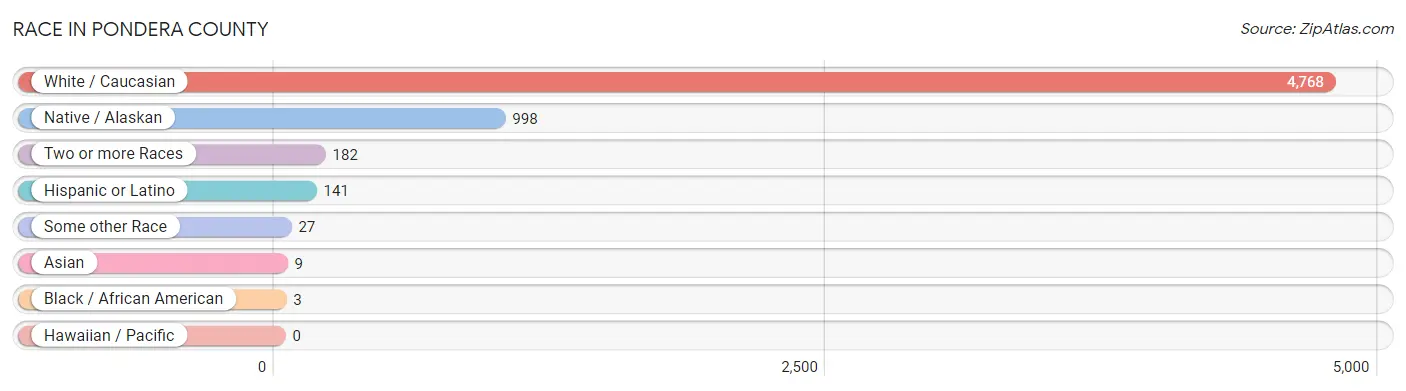
Race in Pondera County
The most populous races in Pondera County are White / Caucasian (4,768 | 79.6%), Native / Alaskan (998 | 16.7%), and Two or more Races (182 | 3.0%).
| Race | # Population | % Population |
| Asian | 9 | 0.2% |
| Black / African American | 3 | 0.1% |
| Hawaiian / Pacific | 0 | 0.0% |
| Hispanic or Latino | 141 | 2.4% |
| Native / Alaskan | 998 | 16.7% |
| White / Caucasian | 4,768 | 79.6% |
| Two or more Races | 182 | 3.0% |
| Some other Race | 27 | 0.4% |
| Total | 5,987 | 100.0% |
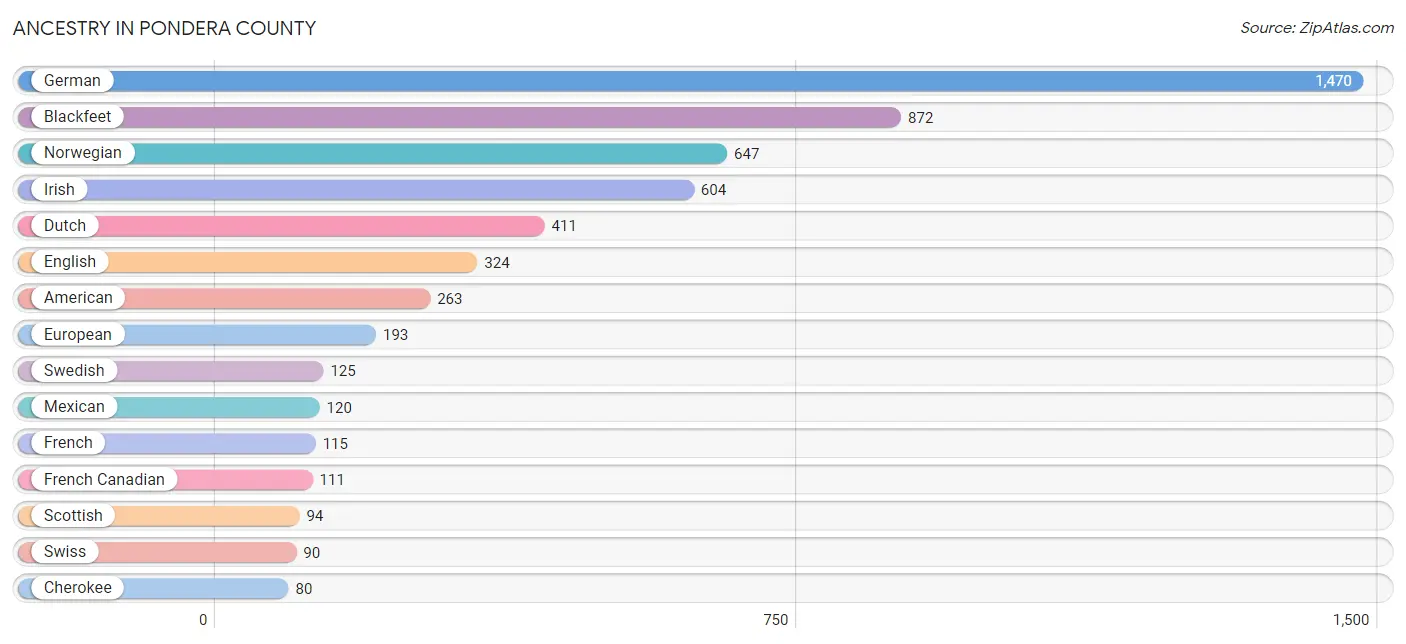
Ancestry in Pondera County
The most populous ancestries reported in Pondera County are German (1,470 | 24.5%), Blackfeet (872 | 14.6%), Norwegian (647 | 10.8%), Irish (604 | 10.1%), and Dutch (411 | 6.9%), together accounting for 66.9% of all Pondera County residents.
| Ancestry | # Population | % Population |
| American | 263 | 4.4% |
| Apache | 58 | 1.0% |
| Arapaho | 6 | 0.1% |
| Austrian | 47 | 0.8% |
| Belgian | 74 | 1.2% |
| Bhutanese | 4 | 0.1% |
| Blackfeet | 872 | 14.6% |
| British | 4 | 0.1% |
| Canadian | 73 | 1.2% |
| Central American | 21 | 0.4% |
| Cherokee | 80 | 1.3% |
| Chippewa | 48 | 0.8% |
| Cree | 48 | 0.8% |
| Crow | 7 | 0.1% |
| Czech | 28 | 0.5% |
| Danish | 24 | 0.4% |
| Dutch | 411 | 6.9% |
| Eastern European | 9 | 0.2% |
| English | 324 | 5.4% |
| European | 193 | 3.2% |
| Finnish | 11 | 0.2% |
| French | 115 | 1.9% |
| French American Indian | 8 | 0.1% |
| French Canadian | 111 | 1.8% |
| German | 1,470 | 24.5% |
| Greek | 5 | 0.1% |
| Guatemalan | 7 | 0.1% |
| Irish | 604 | 10.1% |
| Italian | 65 | 1.1% |
| Japanese | 5 | 0.1% |
| Lithuanian | 7 | 0.1% |
| Luxembourger | 12 | 0.2% |
| Mexican | 120 | 2.0% |
| Northern European | 18 | 0.3% |
| Norwegian | 647 | 10.8% |
| Pennsylvania German | 69 | 1.1% |
| Polish | 43 | 0.7% |
| Romanian | 2 | 0.0% |
| Russian | 23 | 0.4% |
| Salvadoran | 14 | 0.2% |
| Samoan | 6 | 0.1% |
| Scandinavian | 67 | 1.1% |
| Scotch-Irish | 39 | 0.6% |
| Scottish | 94 | 1.6% |
| Sioux | 36 | 0.6% |
| Slavic | 4 | 0.1% |
| Slovene | 4 | 0.1% |
| Swedish | 125 | 2.1% |
| Swiss | 90 | 1.5% |
| Ukrainian | 4 | 0.1% |
| Welsh | 27 | 0.4% | View All 51 Rows |
Immigrants in Pondera County
The most numerous immigrant groups reported in Pondera County came from Canada (66 | 1.1%), Central America (34 | 0.6%), Latin America (34 | 0.6%), Mexico (21 | 0.4%), and Guatemala (7 | 0.1%), together accounting for 2.7% of all Pondera County residents.

| Immigration Origin | # Population | % Population |
| Asia | 5 | 0.1% |
| Cambodia | 5 | 0.1% |
| Canada | 66 | 1.1% |
| Central America | 34 | 0.6% |
| El Salvador | 6 | 0.1% |
| Europe | 6 | 0.1% |
| Germany | 2 | 0.0% |
| Guatemala | 7 | 0.1% |
| Latin America | 34 | 0.6% |
| Mexico | 21 | 0.4% |
| Netherlands | 4 | 0.1% |
| South Eastern Asia | 5 | 0.1% |
| Western Europe | 6 | 0.1% | View All 13 Rows |
Sex and Age in Pondera County
Sex and Age in Pondera County
The most populous age groups in Pondera County are 60 to 64 Years (261 | 8.7%) for men and 60 to 64 Years (258 | 8.7%) for women.

| Age Bracket | Male | Female |
| Under 5 Years | 188 (6.2%) | 205 (6.9%) |
| 5 to 9 Years | 212 (7.0%) | 171 (5.8%) |
| 10 to 14 Years | 193 (6.4%) | 200 (6.7%) |
| 15 to 19 Years | 243 (8.1%) | 180 (6.0%) |
| 20 to 24 Years | 129 (4.3%) | 147 (4.9%) |
| 25 to 29 Years | 145 (4.8%) | 149 (5.0%) |
| 30 to 34 Years | 171 (5.7%) | 181 (6.1%) |
| 35 to 39 Years | 171 (5.7%) | 185 (6.2%) |
| 40 to 44 Years | 194 (6.4%) | 126 (4.2%) |
| 45 to 49 Years | 146 (4.9%) | 137 (4.6%) |
| 50 to 54 Years | 158 (5.2%) | 166 (5.6%) |
| 55 to 59 Years | 198 (6.6%) | 206 (6.9%) |
| 60 to 64 Years | 261 (8.7%) | 258 (8.7%) |
| 65 to 69 Years | 224 (7.4%) | 192 (6.5%) |
| 70 to 74 Years | 132 (4.4%) | 150 (5.0%) |
| 75 to 79 Years | 154 (5.1%) | 108 (3.6%) |
| 80 to 84 Years | 57 (1.9%) | 86 (2.9%) |
| 85 Years and over | 37 (1.2%) | 127 (4.3%) |
| Total | 3,013 (100.0%) | 2,974 (100.0%) |
Families and Households in Pondera County
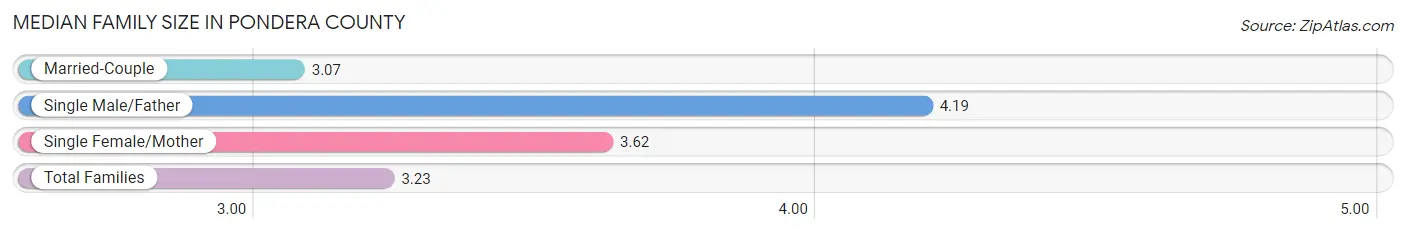
Median Family Size in Pondera County
The median family size in Pondera County is 3.23 persons per family, with single male/father families (122 | 8.4%) accounting for the largest median family size of 4.19 persons per family. On the other hand, married-couple families (1,159 | 79.4%) represent the smallest median family size with 3.07 persons per family.
| Family Type | # Families | Family Size |
| Married-Couple | 1,159 (79.4%) | 3.07 |
| Single Male/Father | 122 (8.4%) | 4.19 |
| Single Female/Mother | 178 (12.2%) | 3.62 |
| Total Families | 1,459 (100.0%) | 3.23 |
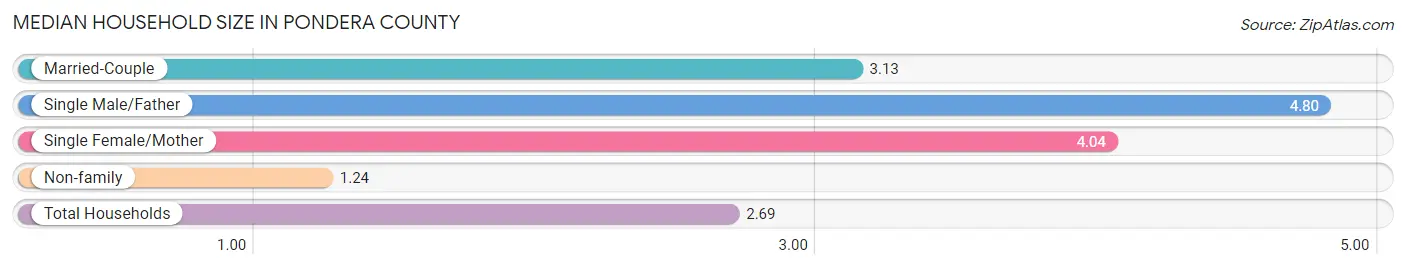
Median Household Size in Pondera County
The median household size in Pondera County is 2.69 persons per household, with single male/father households (122 | 5.7%) accounting for the largest median household size of 4.8 persons per household. non-family households (694 | 32.2%) represent the smallest median household size with 1.24 persons per household.
| Household Type | # Households | Household Size |
| Married-Couple | 1,159 (53.8%) | 3.13 |
| Single Male/Father | 122 (5.7%) | 4.80 |
| Single Female/Mother | 178 (8.3%) | 4.04 |
| Non-family | 694 (32.2%) | 1.24 |
| Total Households | 2,153 (100.0%) | 2.69 |
Household Size by Marriage Status in Pondera County
Out of a total of 2,153 households in Pondera County, 1,459 (67.8%) are family households, while 694 (32.2%) are nonfamily households. The most numerous type of family households are 2-person households, comprising 788, and the most common type of nonfamily households are 1-person households, comprising 582.
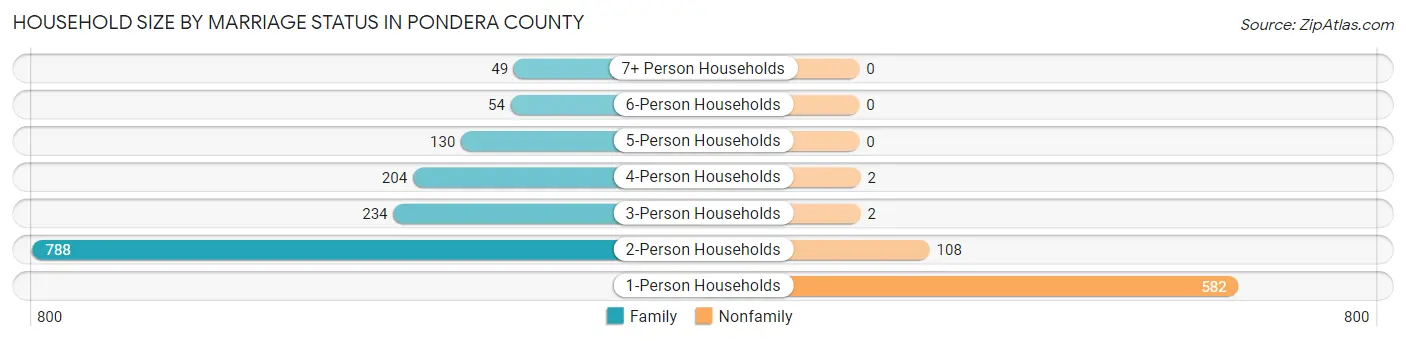
| Household Size | Family Households | Nonfamily Households |
| 1-Person Households | - | 582 (27.0%) |
| 2-Person Households | 788 (36.6%) | 108 (5.0%) |
| 3-Person Households | 234 (10.9%) | 2 (0.1%) |
| 4-Person Households | 204 (9.5%) | 2 (0.1%) |
| 5-Person Households | 130 (6.0%) | 0 (0.0%) |
| 6-Person Households | 54 (2.5%) | 0 (0.0%) |
| 7+ Person Households | 49 (2.3%) | 0 (0.0%) |
| Total | 1,459 (67.8%) | 694 (32.2%) |
Female Fertility in Pondera County
Fertility by Age in Pondera County
Average fertility rate in Pondera County is 71.0 births per 1,000 women. Women in the age bracket of 20 to 34 years have the highest fertility rate with 168.0 births per 1,000 women. Women in the age bracket of 20 to 34 years acount for 100.0% of all women with births.
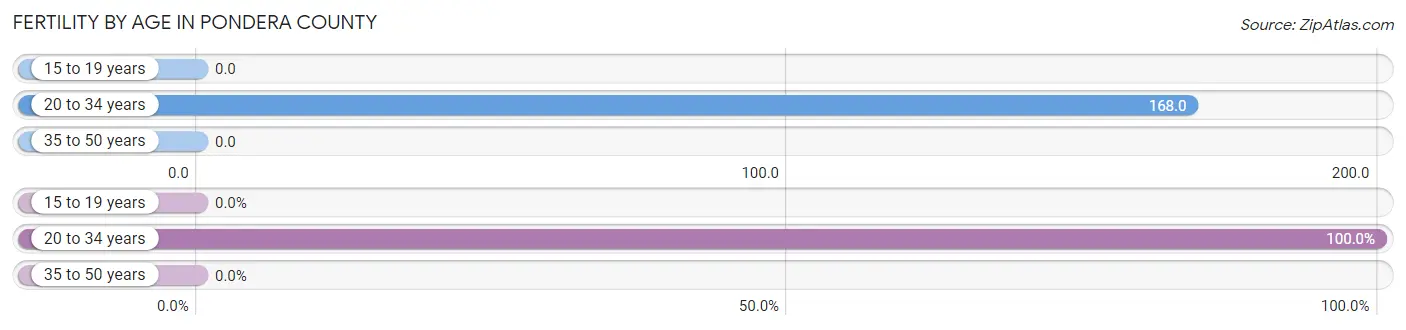
| Age Bracket | Women with Births | Births / 1,000 Women |
| 15 to 19 years | 0 (0.0%) | 0.0 |
| 20 to 34 years | 80 (100.0%) | 168.0 |
| 35 to 50 years | 0 (0.0%) | 0.0 |
| Total | 80 (100.0%) | 71.0 |
Fertility by Age by Marriage Status in Pondera County
82.5% of women with births (80) in Pondera County are married. The highest percentage of unmarried women with births falls into 20 to 34 years age bracket with 17.5% of them unmarried at the time of birth, while the lowest percentage of unmarried women with births belong to 20 to 34 years age bracket with 17.5% of them unmarried.
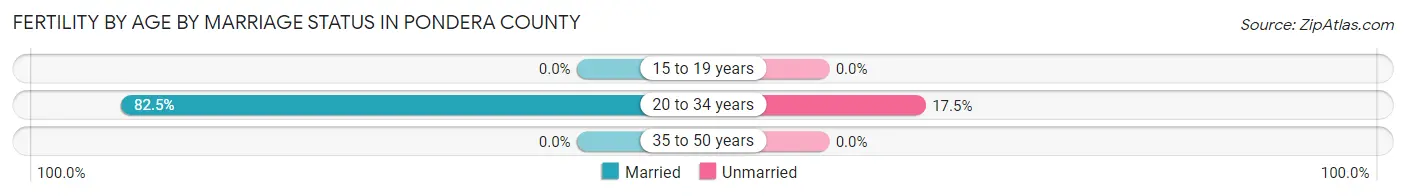
| Age Bracket | Married | Unmarried |
| 15 to 19 years | 0 (0.0%) | 0 (0.0%) |
| 20 to 34 years | 66 (82.5%) | 14 (17.5%) |
| 35 to 50 years | 0 (0.0%) | 0 (0.0%) |
| Total | 66 (82.5%) | 14 (17.5%) |
Fertility by Education in Pondera County

| Educational Attainment | Women with Births | Births / 1,000 Women |
| Less than High School | 8 (10.0%) | 29.0 |
| High School Diploma | 8 (10.0%) | 28.0 |
| College or Associate's Degree | 55 (68.8%) | 145.0 |
| Bachelor's Degree | 9 (11.3%) | 57.0 |
| Graduate Degree | 0 (0.0%) | 0.0 |
| Total | 80 (100.0%) | 71.0 |
Fertility by Education by Marriage Status in Pondera County
17.5% of women with births in Pondera County are unmarried. Women with the educational attainment of high school diploma are most likely to be married with 100.0% of them married at childbirth, while women with the educational attainment of less than high school are least likely to be married with 100.0% of them unmarried at childbirth.

| Educational Attainment | Married | Unmarried |
| Less than High School | 0 (0.0%) | 8 (100.0%) |
| High School Diploma | 8 (100.0%) | 0 (0.0%) |
| College or Associate's Degree | 49 (89.1%) | 6 (10.9%) |
| Bachelor's Degree | 9 (100.0%) | 0 (0.0%) |
| Graduate Degree | 0 (0.0%) | 0 (0.0%) |
| Total | 66 (82.5%) | 14 (17.5%) |
Income in Pondera County
Income Overview in Pondera County
Per Capita Income in Pondera County is $30,424, while median incomes of families and households are $74,806 and $59,861 respectively.
| Characteristic | Number | Measure |
| Per Capita Income | 5,987 | $30,424 |
| Median Family Income | 1,459 | $74,806 |
| Mean Family Income | 1,459 | $89,175 |
| Median Household Income | 2,153 | $59,861 |
| Mean Household Income | 2,153 | $79,051 |
| Income Deficit | 1,459 | $15,463 |
| Wage / Income Gap (%) | 5,987 | 23.36% |
| Wage / Income Gap ($) | 5,987 | 76.64¢ per $1 |
| Gini / Inequality Index | 5,987 | 0.44 |
Earnings by Sex in Pondera County
Average Earnings in Pondera County are $29,665, $34,321 for men and $26,302 for women, a difference of 23.4%.
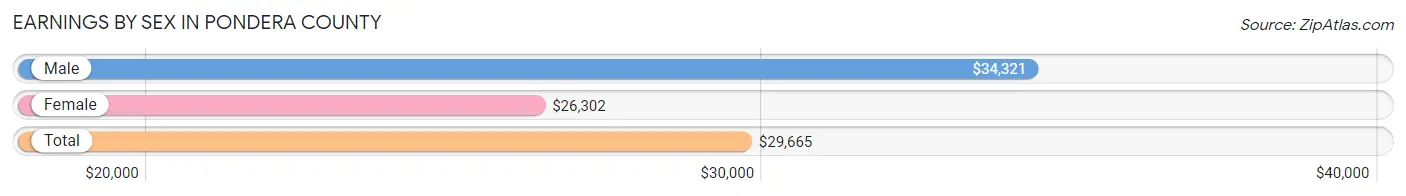
| Sex | Number | Average Earnings |
| Male | 1,625 (54.0%) | $34,321 |
| Female | 1,386 (46.0%) | $26,302 |
| Total | 3,011 (100.0%) | $29,665 |
Earnings by Sex by Income Bracket in Pondera County
The most common earnings brackets in Pondera County are $100,000+ for men (177 | 10.9%) and $5,000 to $7,499 for women (146 | 10.5%).

| Income | Male | Female |
| $2,499 or less | 123 (7.6%) | 132 (9.5%) |
| $2,500 to $4,999 | 51 (3.1%) | 70 (5.1%) |
| $5,000 to $7,499 | 82 (5.1%) | 146 (10.5%) |
| $7,500 to $9,999 | 46 (2.8%) | 54 (3.9%) |
| $10,000 to $12,499 | 55 (3.4%) | 73 (5.3%) |
| $12,500 to $14,999 | 132 (8.1%) | 22 (1.6%) |
| $15,000 to $17,499 | 22 (1.3%) | 28 (2.0%) |
| $17,500 to $19,999 | 73 (4.5%) | 49 (3.5%) |
| $20,000 to $22,499 | 35 (2.1%) | 45 (3.3%) |
| $22,500 to $24,999 | 20 (1.2%) | 49 (3.5%) |
| $25,000 to $29,999 | 120 (7.4%) | 95 (6.9%) |
| $30,000 to $34,999 | 63 (3.9%) | 141 (10.2%) |
| $35,000 to $39,999 | 60 (3.7%) | 84 (6.1%) |
| $40,000 to $44,999 | 37 (2.3%) | 77 (5.6%) |
| $45,000 to $49,999 | 115 (7.1%) | 83 (6.0%) |
| $50,000 to $54,999 | 60 (3.7%) | 30 (2.2%) |
| $55,000 to $64,999 | 97 (6.0%) | 69 (5.0%) |
| $65,000 to $74,999 | 127 (7.8%) | 55 (4.0%) |
| $75,000 to $99,999 | 130 (8.0%) | 59 (4.3%) |
| $100,000+ | 177 (10.9%) | 25 (1.8%) |
| Total | 1,625 (100.0%) | 1,386 (100.0%) |
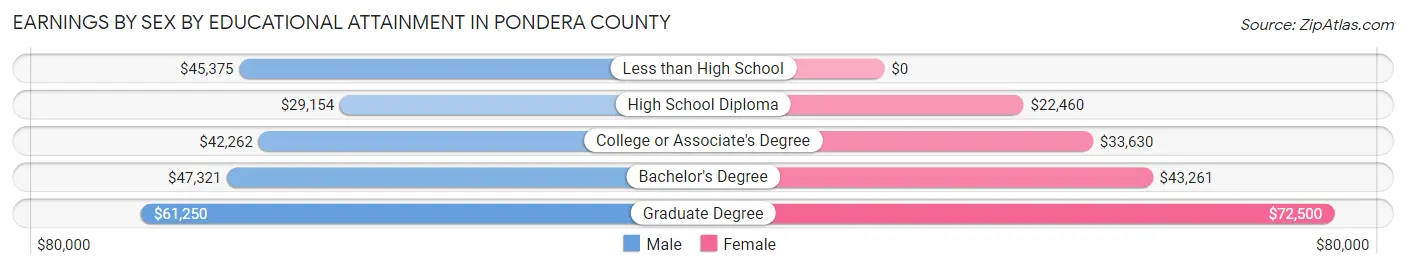
Earnings by Sex by Educational Attainment in Pondera County
Average earnings in Pondera County are $41,050 for men and $30,849 for women, a difference of 24.8%. Men with an educational attainment of graduate degree enjoy the highest average annual earnings of $61,250, while those with high school diploma education earn the least with $29,154. Women with an educational attainment of graduate degree earn the most with the average annual earnings of $72,500, while those with high school diploma education have the smallest earnings of $22,460.
| Educational Attainment | Male Income | Female Income |
| Less than High School | $45,375 | $0 |
| High School Diploma | $29,154 | $22,460 |
| College or Associate's Degree | $42,262 | $33,630 |
| Bachelor's Degree | $47,321 | $43,261 |
| Graduate Degree | $61,250 | $72,500 |
| Total | $41,050 | $30,849 |
Family Income in Pondera County
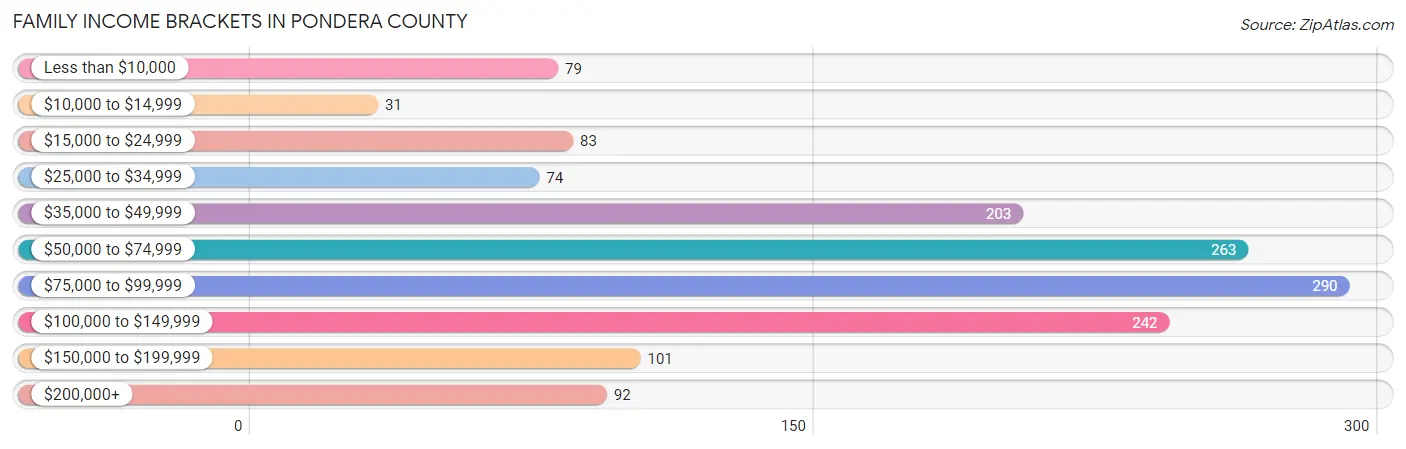
Family Income Brackets in Pondera County
According to the Pondera County family income data, there are 290 families falling into the $75,000 to $99,999 income range, which is the most common income bracket and makes up 19.9% of all families. Conversely, the $10,000 to $14,999 income bracket is the least frequent group with only 31 families (2.1%) belonging to this category.
| Income Bracket | # Families | % Families |
| Less than $10,000 | 79 | 5.4% |
| $10,000 to $14,999 | 31 | 2.1% |
| $15,000 to $24,999 | 83 | 5.7% |
| $25,000 to $34,999 | 74 | 5.1% |
| $35,000 to $49,999 | 203 | 13.9% |
| $50,000 to $74,999 | 263 | 18.0% |
| $75,000 to $99,999 | 290 | 19.9% |
| $100,000 to $149,999 | 242 | 16.6% |
| $150,000 to $199,999 | 101 | 6.9% |
| $200,000+ | 92 | 6.3% |
Family Income by Famaliy Size in Pondera County
4-person families (185 | 12.7%) account for the highest median family income in Pondera County with $86,384 per family, while 2-person families (876 | 60.0%) have the highest median income of $38,840 per family member.

| Income Bracket | # Families | Median Income |
| 2-Person Families | 876 (60.0%) | $77,679 |
| 3-Person Families | 189 (13.0%) | $43,393 |
| 4-Person Families | 185 (12.7%) | $86,384 |
| 5-Person Families | 119 (8.2%) | $76,250 |
| 6-Person Families | 51 (3.5%) | $46,354 |
| 7+ Person Families | 39 (2.7%) | $0 |
| Total | 1,459 (100.0%) | $74,806 |
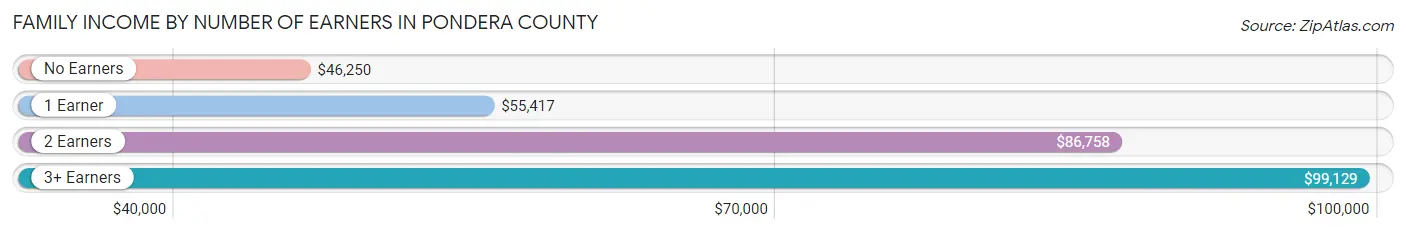
Family Income by Number of Earners in Pondera County
The median family income in Pondera County is $74,806, with families comprising 3+ earners (109) having the highest median family income of $99,129, while families with no earners (236) have the lowest median family income of $46,250, accounting for 7.5% and 16.2% of families, respectively.
| Number of Earners | # Families | Median Income |
| No Earners | 236 (16.2%) | $46,250 |
| 1 Earner | 483 (33.1%) | $55,417 |
| 2 Earners | 631 (43.2%) | $86,758 |
| 3+ Earners | 109 (7.5%) | $99,129 |
| Total | 1,459 (100.0%) | $74,806 |
Household Income in Pondera County
Household Income Brackets in Pondera County
With 347 households falling in the category, the $35,000 to $49,999 income range is the most frequent in Pondera County, accounting for 16.1% of all households. In contrast, only 56 households (2.6%) fall into the $10,000 to $14,999 income bracket, making it the least populous group.

| Income Bracket | # Households | % Households |
| Less than $10,000 | 108 | 5.0% |
| $10,000 to $14,999 | 56 | 2.6% |
| $15,000 to $24,999 | 226 | 10.5% |
| $25,000 to $34,999 | 211 | 9.8% |
| $35,000 to $49,999 | 347 | 16.1% |
| $50,000 to $74,999 | 340 | 15.8% |
| $75,000 to $99,999 | 316 | 14.7% |
| $100,000 to $149,999 | 289 | 13.4% |
| $150,000 to $199,999 | 159 | 7.4% |
| $200,000+ | 105 | 4.9% |
Household Income by Householder Age in Pondera County
The median household income in Pondera County is $59,861, with the highest median household income of $85,175 found in the 45 to 64 years age bracket for the primary householder. A total of 771 households (35.8%) fall into this category. Meanwhile, the 15 to 24 years age bracket for the primary householder has the lowest median household income of $22,179, with 73 households (3.4%) in this group.

| Income Bracket | # Households | Median Income |
| 15 to 24 Years | 73 (3.4%) | $22,179 |
| 25 to 44 Years | 512 (23.8%) | $60,259 |
| 45 to 64 Years | 771 (35.8%) | $85,175 |
| 65+ Years | 797 (37.0%) | $46,370 |
| Total | 2,153 (100.0%) | $59,861 |
Poverty in Pondera County
Income Below Poverty by Sex and Age in Pondera County
With 19.6% poverty level for males and 23.6% for females among the residents of Pondera County, 5 year old males and 18 to 24 year old females are the most vulnerable to poverty, with 25 males (59.5%) and 113 females (50.4%) in their respective age groups living below the poverty level.

| Age Bracket | Male | Female |
| Under 5 Years | 48 (26.7%) | 78 (39.8%) |
| 5 Years | 25 (59.5%) | 14 (22.6%) |
| 6 to 11 Years | 72 (30.2%) | 50 (26.5%) |
| 12 to 14 Years | 45 (36.6%) | 40 (34.5%) |
| 15 Years | 13 (23.6%) | 16 (34.0%) |
| 16 and 17 Years | 14 (19.2%) | 11 (19.6%) |
| 18 to 24 Years | 87 (35.8%) | 113 (50.4%) |
| 25 to 34 Years | 59 (18.9%) | 143 (43.3%) |
| 35 to 44 Years | 92 (25.6%) | 70 (22.5%) |
| 45 to 54 Years | 36 (11.9%) | 47 (15.5%) |
| 55 to 64 Years | 55 (12.0%) | 63 (13.6%) |
| 65 to 74 Years | 19 (5.4%) | 15 (4.4%) |
| 75 Years and over | 17 (7.3%) | 30 (10.8%) |
| Total | 582 (19.6%) | 690 (23.6%) |
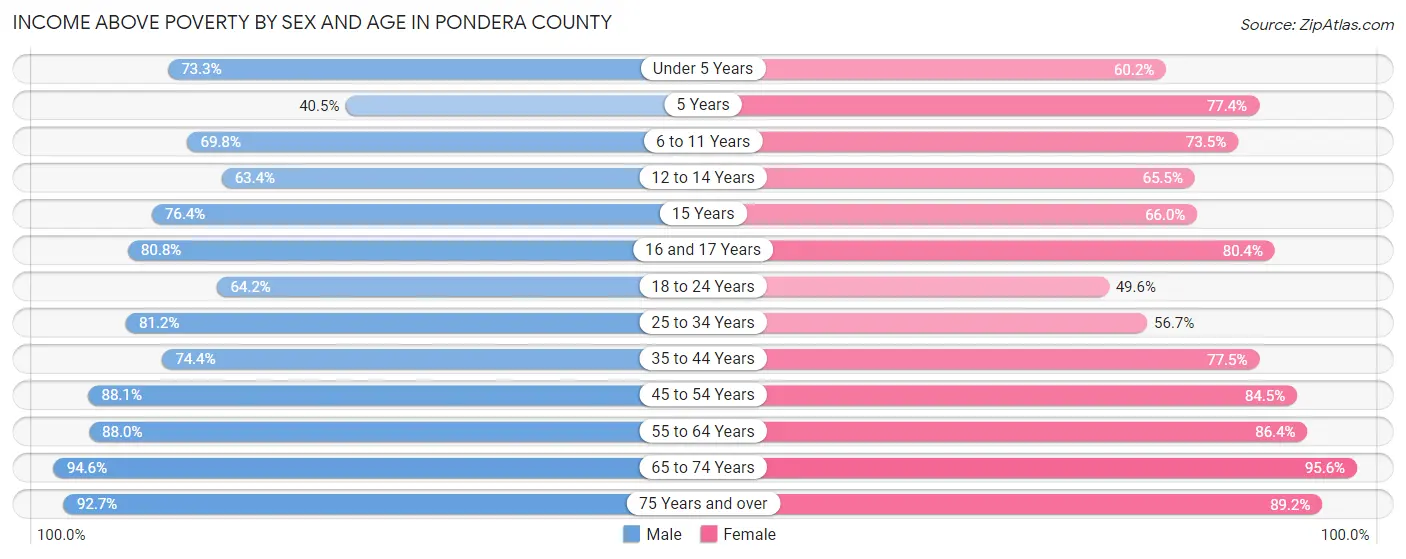
Income Above Poverty by Sex and Age in Pondera County
According to the poverty statistics in Pondera County, males aged 65 to 74 years and females aged 65 to 74 years are the age groups that are most secure financially, with 94.6% of males and 95.6% of females in these age groups living above the poverty line.
| Age Bracket | Male | Female |
| Under 5 Years | 132 (73.3%) | 118 (60.2%) |
| 5 Years | 17 (40.5%) | 48 (77.4%) |
| 6 to 11 Years | 166 (69.8%) | 139 (73.5%) |
| 12 to 14 Years | 78 (63.4%) | 76 (65.5%) |
| 15 Years | 42 (76.4%) | 31 (66.0%) |
| 16 and 17 Years | 59 (80.8%) | 45 (80.4%) |
| 18 to 24 Years | 156 (64.2%) | 111 (49.5%) |
| 25 to 34 Years | 254 (81.1%) | 187 (56.7%) |
| 35 to 44 Years | 268 (74.4%) | 241 (77.5%) |
| 45 to 54 Years | 267 (88.1%) | 256 (84.5%) |
| 55 to 64 Years | 404 (88.0%) | 401 (86.4%) |
| 65 to 74 Years | 331 (94.6%) | 327 (95.6%) |
| 75 Years and over | 216 (92.7%) | 247 (89.2%) |
| Total | 2,390 (80.4%) | 2,227 (76.3%) |
Income Below Poverty Among Married-Couple Families in Pondera County
The poverty statistics for married-couple families in Pondera County show that 6.6% or 77 of the total 1,159 families live below the poverty line. Families with 5 or more children have the highest poverty rate of 69.7%, comprising of 23 families. On the other hand, families with no children have the lowest poverty rate of 2.4%, which includes 18 families.

| Children | Above Poverty | Below Poverty |
| No Children | 730 (97.6%) | 18 (2.4%) |
| 1 or 2 Children | 236 (92.9%) | 18 (7.1%) |
| 3 or 4 Children | 106 (85.5%) | 18 (14.5%) |
| 5 or more Children | 10 (30.3%) | 23 (69.7%) |
| Total | 1,082 (93.4%) | 77 (6.6%) |
Income Below Poverty Among Single-Parent Households in Pondera County
According to the poverty data in Pondera County, 26.2% or 32 single-father households and 44.4% or 79 single-mother households are living below the poverty line. Among single-father households, those with 3 or 4 children have the highest poverty rate, with 15 households (100.0%) experiencing poverty. Likewise, among single-mother households, those with 3 or 4 children have the highest poverty rate, with 6 households (100.0%) falling below the poverty line.

| Children | Single Father | Single Mother |
| No Children | 4 (10.8%) | 18 (22.8%) |
| 1 or 2 Children | 13 (19.1%) | 54 (58.7%) |
| 3 or 4 Children | 15 (100.0%) | 6 (100.0%) |
| 5 or more Children | 0 (0.0%) | 1 (100.0%) |
| Total | 32 (26.2%) | 79 (44.4%) |
Income Below Poverty Among Married-Couple vs Single-Parent Households in Pondera County
The poverty data for Pondera County shows that 77 of the married-couple family households (6.6%) and 111 of the single-parent households (37.0%) are living below the poverty level. Within the married-couple family households, those with 5 or more children have the highest poverty rate, with 23 households (69.7%) falling below the poverty line. Among the single-parent households, those with 3 or 4 children have the highest poverty rate, with 21 household (100.0%) living below poverty.

| Children | Married-Couple Families | Single-Parent Households |
| No Children | 18 (2.4%) | 22 (19.0%) |
| 1 or 2 Children | 18 (7.1%) | 67 (41.9%) |
| 3 or 4 Children | 18 (14.5%) | 21 (100.0%) |
| 5 or more Children | 23 (69.7%) | 1 (33.3%) |
| Total | 77 (6.6%) | 111 (37.0%) |
Employment Characteristics in Pondera County
Employment by Class of Employer in Pondera County
Among the 2,570 employed individuals in Pondera County, private company employees (1,245 | 48.4%), local government employees (350 | 13.6%), and self-employed (not incorporated) (295 | 11.5%) make up the most common classes of employment.
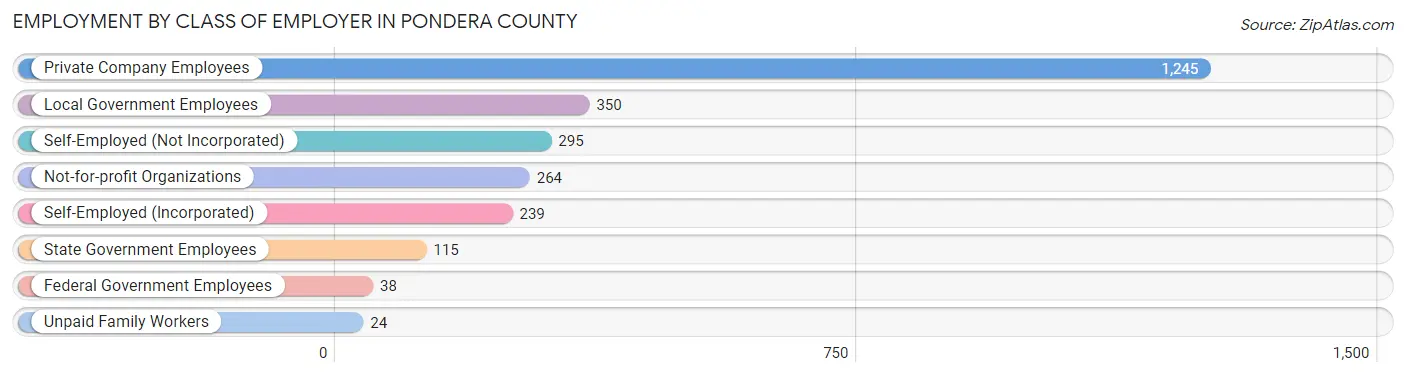
| Employer Class | # Employees | % Employees |
| Private Company Employees | 1,245 | 48.4% |
| Self-Employed (Incorporated) | 239 | 9.3% |
| Self-Employed (Not Incorporated) | 295 | 11.5% |
| Not-for-profit Organizations | 264 | 10.3% |
| Local Government Employees | 350 | 13.6% |
| State Government Employees | 115 | 4.5% |
| Federal Government Employees | 38 | 1.5% |
| Unpaid Family Workers | 24 | 0.9% |
| Total | 2,570 | 100.0% |
Employment Status by Age in Pondera County
According to the labor force statistics for Pondera County, out of the total population over 16 years of age (4,716), 59.9% or 2,825 individuals are in the labor force, with 6.4% or 181 of them unemployed. The age group with the highest labor force participation rate is 25 to 29 years, with 87.8% or 258 individuals in the labor force. Within the labor force, the 16 to 19 years age range has the highest percentage of unemployed individuals, with 46.8% or 72 of them being unemployed.
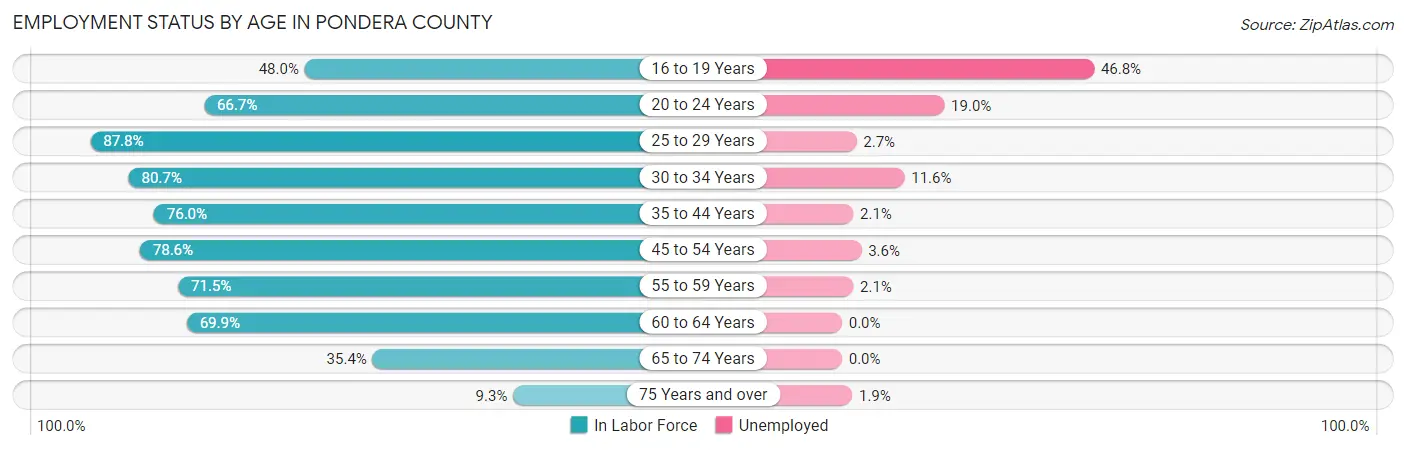
| Age Bracket | In Labor Force | Unemployed |
| 16 to 19 Years | 154 (48.0%) | 72 (46.8%) |
| 20 to 24 Years | 184 (66.7%) | 35 (19.0%) |
| 25 to 29 Years | 258 (87.8%) | 7 (2.7%) |
| 30 to 34 Years | 284 (80.7%) | 33 (11.6%) |
| 35 to 44 Years | 514 (76.0%) | 11 (2.1%) |
| 45 to 54 Years | 477 (78.6%) | 17 (3.6%) |
| 55 to 59 Years | 289 (71.5%) | 6 (2.1%) |
| 60 to 64 Years | 363 (69.9%) | 0 (0.0%) |
| 65 to 74 Years | 247 (35.4%) | 0 (0.0%) |
| 75 Years and over | 53 (9.3%) | 1 (1.9%) |
| Total | 2,825 (59.9%) | 181 (6.4%) |
Employment Status by Educational Attainment in Pondera County
According to labor force statistics for Pondera County, 76.6% of individuals (2,185) out of the total population between 25 and 64 years of age (2,852) are in the labor force, with 3.4% or 74 of them being unemployed. The group with the highest labor force participation rate are those with the educational attainment of bachelor's degree or higher, with 91.1% or 574 individuals in the labor force. Within the labor force, individuals with less than high school education have the highest percentage of unemployment, with 6.3% or 15 of them being unemployed.

| Educational Attainment | In Labor Force | Unemployed |
| Less than High School | 240 (61.2%) | 25 (6.3%) |
| High School Diploma | 517 (68.4%) | 45 (6.0%) |
| College / Associate Degree | 854 (79.5%) | 28 (2.6%) |
| Bachelor's Degree or higher | 574 (91.1%) | 6 (1.0%) |
| Total | 2,185 (76.6%) | 97 (3.4%) |
Employment Occupations by Sex in Pondera County
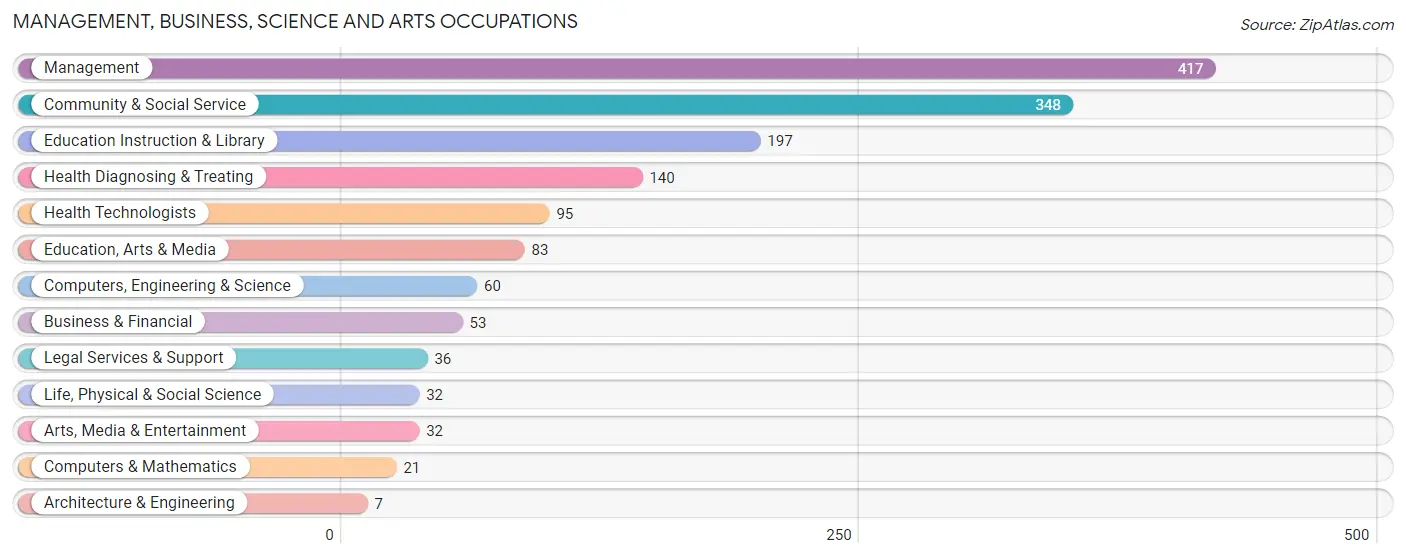
Management, Business, Science and Arts Occupations
The most common Management, Business, Science and Arts occupations in Pondera County are Management (417 | 15.8%), Community & Social Service (348 | 13.2%), Education Instruction & Library (197 | 7.5%), Health Diagnosing & Treating (140 | 5.3%), and Health Technologists (95 | 3.6%).
Management, Business, Science and Arts Occupations by Sex
Within the Management, Business, Science and Arts occupations in Pondera County, the most male-oriented occupations are Life, Physical & Social Science (90.6%), Management (72.9%), and Architecture & Engineering (71.4%), while the most female-oriented occupations are Legal Services & Support (91.7%), Education, Arts & Media (84.3%), and Health Diagnosing & Treating (80.7%).

| Occupation | Male | Female |
| Management | 304 (72.9%) | 113 (27.1%) |
| Business & Financial | 24 (45.3%) | 29 (54.7%) |
| Computers, Engineering & Science | 41 (68.3%) | 19 (31.7%) |
| Computers & Mathematics | 7 (33.3%) | 14 (66.7%) |
| Architecture & Engineering | 5 (71.4%) | 2 (28.6%) |
| Life, Physical & Social Science | 29 (90.6%) | 3 (9.4%) |
| Community & Social Service | 87 (25.0%) | 261 (75.0%) |
| Education, Arts & Media | 13 (15.7%) | 70 (84.3%) |
| Legal Services & Support | 3 (8.3%) | 33 (91.7%) |
| Education Instruction & Library | 55 (27.9%) | 142 (72.1%) |
| Arts, Media & Entertainment | 16 (50.0%) | 16 (50.0%) |
| Health Diagnosing & Treating | 27 (19.3%) | 113 (80.7%) |
| Health Technologists | 27 (28.4%) | 68 (71.6%) |
| Total (Category) | 483 (47.4%) | 535 (52.5%) |
| Total (Overall) | 1,415 (53.6%) | 1,226 (46.4%) |
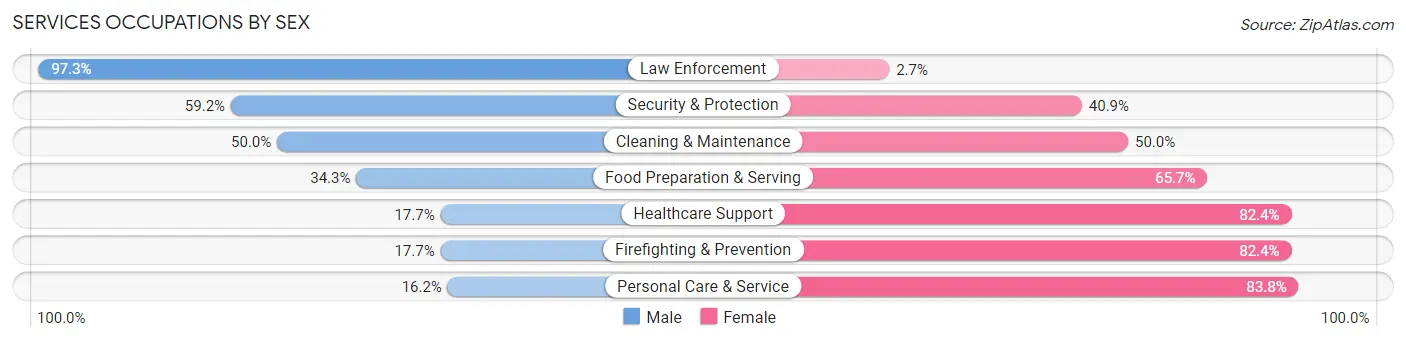
Services Occupations
The most common Services occupations in Pondera County are Food Preparation & Serving (239 | 9.0%), Cleaning & Maintenance (140 | 5.3%), Security & Protection (71 | 2.7%), Healthcare Support (68 | 2.6%), and Law Enforcement (37 | 1.4%).

Services Occupations by Sex
Within the Services occupations in Pondera County, the most male-oriented occupations are Law Enforcement (97.3%), Security & Protection (59.2%), and Cleaning & Maintenance (50.0%), while the most female-oriented occupations are Personal Care & Service (83.8%), Healthcare Support (82.4%), and Firefighting & Prevention (82.4%).
| Occupation | Male | Female |
| Healthcare Support | 12 (17.6%) | 56 (82.4%) |
| Security & Protection | 42 (59.2%) | 29 (40.8%) |
| Firefighting & Prevention | 6 (17.6%) | 28 (82.4%) |
| Law Enforcement | 36 (97.3%) | 1 (2.7%) |
| Food Preparation & Serving | 82 (34.3%) | 157 (65.7%) |
| Cleaning & Maintenance | 70 (50.0%) | 70 (50.0%) |
| Personal Care & Service | 6 (16.2%) | 31 (83.8%) |
| Total (Category) | 212 (38.2%) | 343 (61.8%) |
| Total (Overall) | 1,415 (53.6%) | 1,226 (46.4%) |
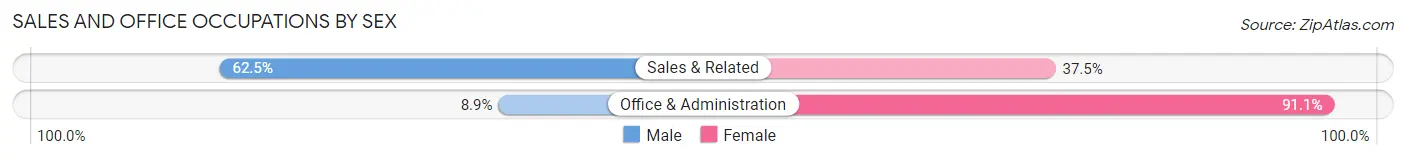
Sales and Office Occupations
The most common Sales and Office occupations in Pondera County are Office & Administration (247 | 9.3%), and Sales & Related (208 | 7.9%).
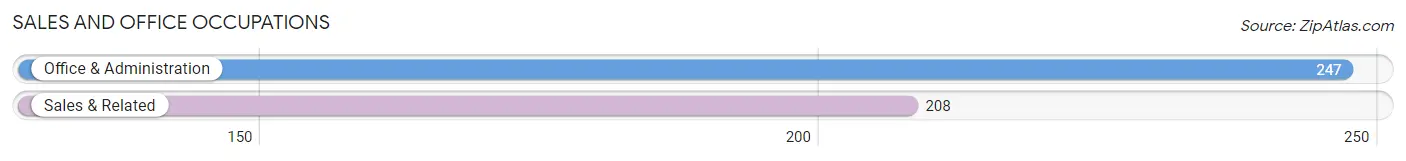
Sales and Office Occupations by Sex
| Occupation | Male | Female |
| Sales & Related | 130 (62.5%) | 78 (37.5%) |
| Office & Administration | 22 (8.9%) | 225 (91.1%) |
| Total (Category) | 152 (33.4%) | 303 (66.6%) |
| Total (Overall) | 1,415 (53.6%) | 1,226 (46.4%) |
Natural Resources, Construction and Maintenance Occupations
The most common Natural Resources, Construction and Maintenance occupations in Pondera County are Construction & Extraction (134 | 5.1%), Farming, Fishing & Forestry (103 | 3.9%), and Installation, Maintenance & Repair (82 | 3.1%).
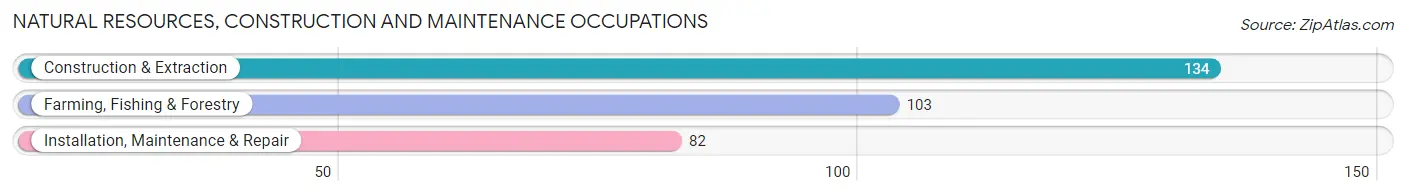
Natural Resources, Construction and Maintenance Occupations by Sex
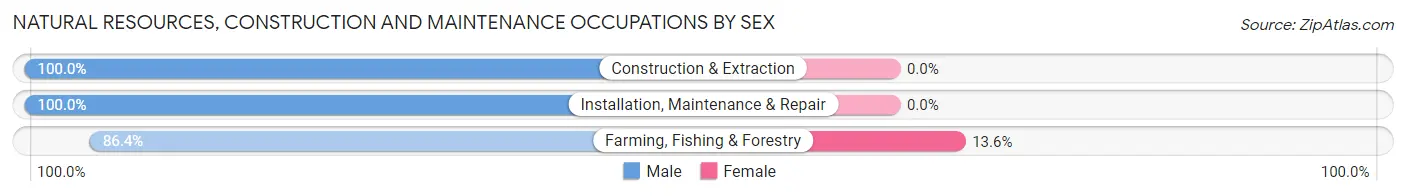
| Occupation | Male | Female |
| Farming, Fishing & Forestry | 89 (86.4%) | 14 (13.6%) |
| Construction & Extraction | 134 (100.0%) | 0 (0.0%) |
| Installation, Maintenance & Repair | 82 (100.0%) | 0 (0.0%) |
| Total (Category) | 305 (95.6%) | 14 (4.4%) |
| Total (Overall) | 1,415 (53.6%) | 1,226 (46.4%) |
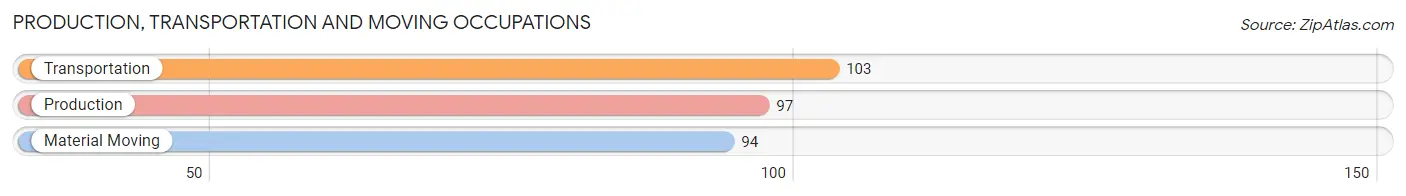
Production, Transportation and Moving Occupations
The most common Production, Transportation and Moving occupations in Pondera County are Transportation (103 | 3.9%), Production (97 | 3.7%), and Material Moving (94 | 3.6%).
Production, Transportation and Moving Occupations by Sex
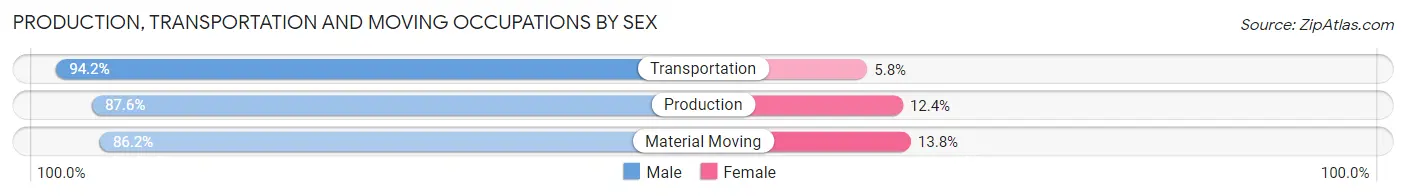
| Occupation | Male | Female |
| Production | 85 (87.6%) | 12 (12.4%) |
| Transportation | 97 (94.2%) | 6 (5.8%) |
| Material Moving | 81 (86.2%) | 13 (13.8%) |
| Total (Category) | 263 (89.5%) | 31 (10.5%) |
| Total (Overall) | 1,415 (53.6%) | 1,226 (46.4%) |
Employment Industries by Sex in Pondera County
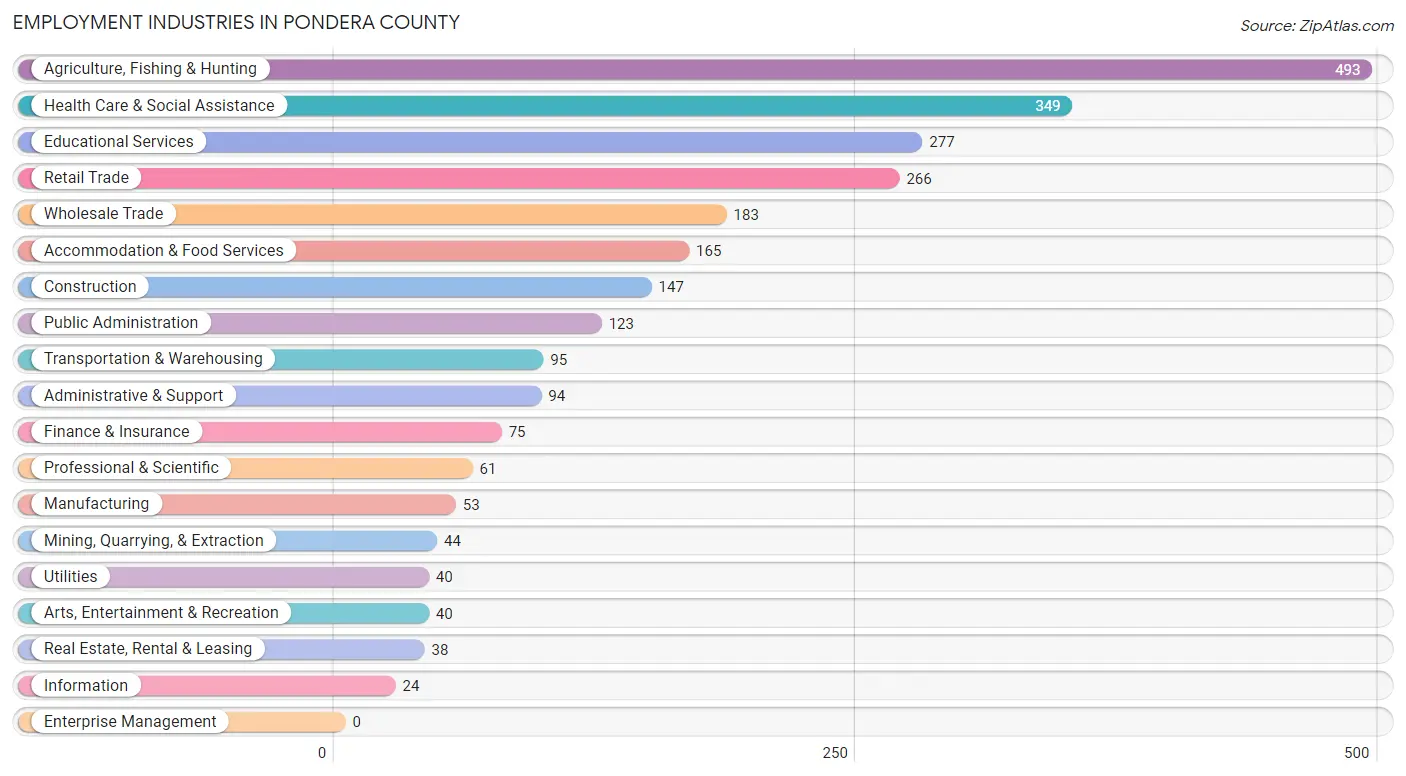
Employment Industries in Pondera County
The major employment industries in Pondera County include Agriculture, Fishing & Hunting (493 | 18.7%), Health Care & Social Assistance (349 | 13.2%), Educational Services (277 | 10.5%), Retail Trade (266 | 10.1%), and Wholesale Trade (183 | 6.9%).
Employment Industries by Sex in Pondera County
The Pondera County industries that see more men than women are Mining, Quarrying, & Extraction (100.0%), Construction (98.6%), and Wholesale Trade (94.0%), whereas the industries that tend to have a higher number of women are Finance & Insurance (82.7%), Health Care & Social Assistance (80.2%), and Educational Services (72.6%).

| Industry | Male | Female |
| Agriculture, Fishing & Hunting | 315 (63.9%) | 178 (36.1%) |
| Mining, Quarrying, & Extraction | 44 (100.0%) | 0 (0.0%) |
| Construction | 145 (98.6%) | 2 (1.4%) |
| Manufacturing | 46 (86.8%) | 7 (13.2%) |
| Wholesale Trade | 172 (94.0%) | 11 (6.0%) |
| Retail Trade | 141 (53.0%) | 125 (47.0%) |
| Transportation & Warehousing | 73 (76.8%) | 22 (23.2%) |
| Utilities | 35 (87.5%) | 5 (12.5%) |
| Information | 8 (33.3%) | 16 (66.7%) |
| Finance & Insurance | 13 (17.3%) | 62 (82.7%) |
| Real Estate, Rental & Leasing | 15 (39.5%) | 23 (60.5%) |
| Professional & Scientific | 17 (27.9%) | 44 (72.1%) |
| Enterprise Management | 0 (0.0%) | 0 (0.0%) |
| Administrative & Support | 78 (83.0%) | 16 (17.0%) |
| Educational Services | 76 (27.4%) | 201 (72.6%) |
| Health Care & Social Assistance | 69 (19.8%) | 280 (80.2%) |
| Arts, Entertainment & Recreation | 12 (30.0%) | 28 (70.0%) |
| Accommodation & Food Services | 70 (42.4%) | 95 (57.6%) |
| Public Administration | 62 (50.4%) | 61 (49.6%) |
| Total | 1,415 (53.6%) | 1,226 (46.4%) |
Education in Pondera County
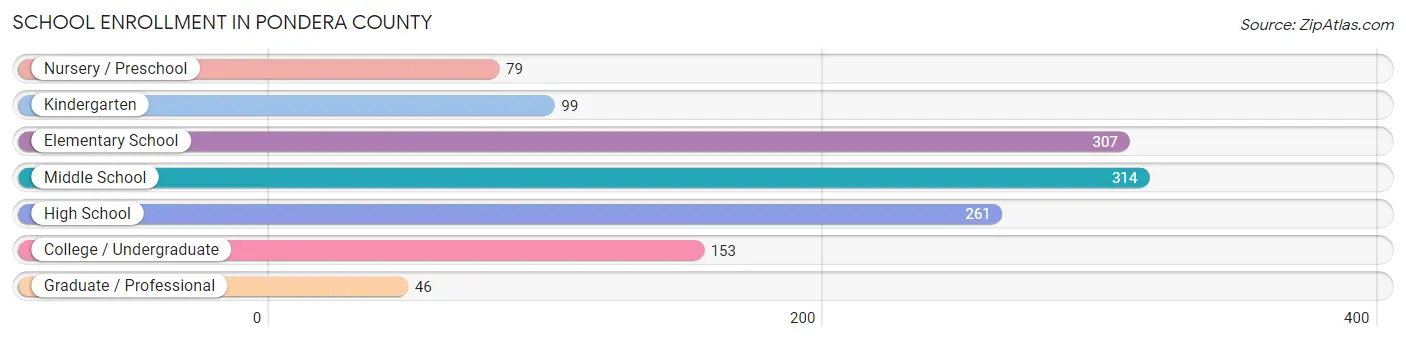
School Enrollment in Pondera County
The most common levels of schooling among the 1,259 students in Pondera County are middle school (314 | 24.9%), elementary school (307 | 24.4%), and high school (261 | 20.7%).
| School Level | # Students | % Students |
| Nursery / Preschool | 79 | 6.3% |
| Kindergarten | 99 | 7.9% |
| Elementary School | 307 | 24.4% |
| Middle School | 314 | 24.9% |
| High School | 261 | 20.7% |
| College / Undergraduate | 153 | 12.1% |
| Graduate / Professional | 46 | 3.6% |
| Total | 1,259 | 100.0% |
School Enrollment by Age by Funding Source in Pondera County
Out of a total of 1,259 students who are enrolled in schools in Pondera County, 71 (5.6%) attend a private institution, while the remaining 1,188 (94.4%) are enrolled in public schools. The age group of 3 to 4 year olds has the highest likelihood of being enrolled in private schools, with 16 (38.1% in the age bracket) enrolled. Conversely, the age group of 15 to 17 year olds has the lowest likelihood of being enrolled in a private school, with 195 (100.0% in the age bracket) attending a public institution.

| Age Bracket | Public School | Private School |
| 3 to 4 Year Olds | 26 (61.9%) | 16 (38.1%) |
| 5 to 9 Year Old | 337 (92.6%) | 27 (7.4%) |
| 10 to 14 Year Olds | 371 (95.6%) | 17 (4.4%) |
| 15 to 17 Year Olds | 195 (100.0%) | 0 (0.0%) |
| 18 to 19 Year Olds | 99 (100.0%) | 0 (0.0%) |
| 20 to 24 Year Olds | 90 (100.0%) | 0 (0.0%) |
| 25 to 34 Year Olds | 17 (100.0%) | 0 (0.0%) |
| 35 Years and over | 53 (82.8%) | 11 (17.2%) |
| Total | 1,188 (94.4%) | 71 (5.6%) |
Educational Attainment by Field of Study in Pondera County
Education (269 | 26.6%), bio, nature & agricultural (139 | 13.7%), science & technology (110 | 10.9%), business (108 | 10.7%), and arts & humanities (92 | 9.1%) are the most common fields of study among 1,013 individuals in Pondera County who have obtained a bachelor's degree or higher.
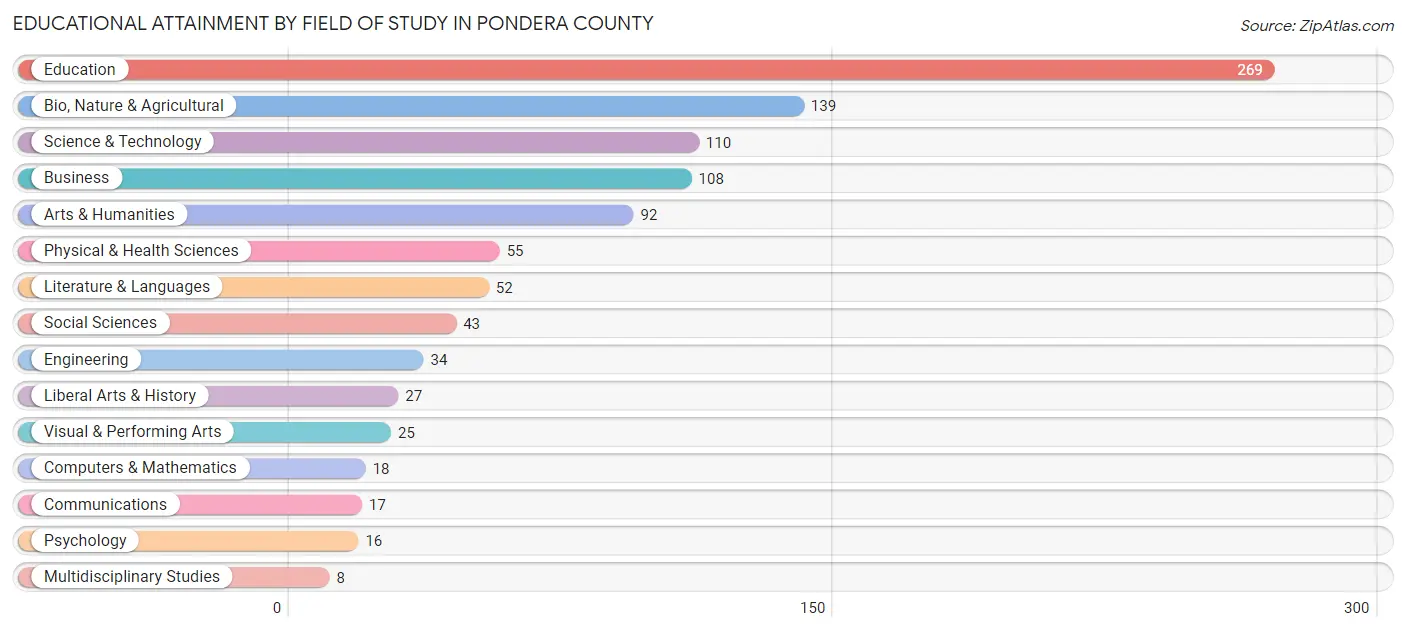
| Field of Study | # Graduates | % Graduates |
| Computers & Mathematics | 18 | 1.8% |
| Bio, Nature & Agricultural | 139 | 13.7% |
| Physical & Health Sciences | 55 | 5.4% |
| Psychology | 16 | 1.6% |
| Social Sciences | 43 | 4.2% |
| Engineering | 34 | 3.4% |
| Multidisciplinary Studies | 8 | 0.8% |
| Science & Technology | 110 | 10.9% |
| Business | 108 | 10.7% |
| Education | 269 | 26.6% |
| Literature & Languages | 52 | 5.1% |
| Liberal Arts & History | 27 | 2.7% |
| Visual & Performing Arts | 25 | 2.5% |
| Communications | 17 | 1.7% |
| Arts & Humanities | 92 | 9.1% |
| Total | 1,013 | 100.0% |
Transportation & Commute in Pondera County
Vehicle Availability by Sex in Pondera County
The most prevalent vehicle ownership categories in Pondera County are males with 3 vehicles (414, accounting for 30.5%) and females with 3 vehicles (345, making up 36.5%).
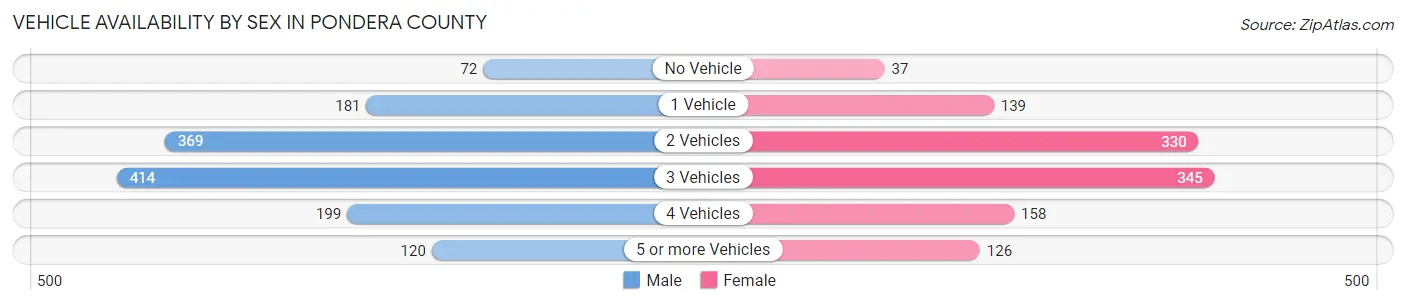
| Vehicles Available | Male | Female |
| No Vehicle | 72 (5.3%) | 37 (3.3%) |
| 1 Vehicle | 181 (13.4%) | 139 (12.2%) |
| 2 Vehicles | 369 (27.2%) | 330 (29.1%) |
| 3 Vehicles | 414 (30.5%) | 345 (30.4%) |
| 4 Vehicles | 199 (14.7%) | 158 (13.9%) |
| 5 or more Vehicles | 120 (8.9%) | 126 (11.1%) |
| Total | 1,355 (100.0%) | 1,135 (100.0%) |
Commute Time in Pondera County
The most frequently occuring commute durations in Pondera County are 5 to 9 minutes (792 commuters, 33.2%), less than 5 minutes (390 commuters, 16.3%), and 10 to 14 minutes (288 commuters, 12.1%).

| Commute Time | # Commuters | % Commuters |
| Less than 5 Minutes | 390 | 16.3% |
| 5 to 9 Minutes | 792 | 33.2% |
| 10 to 14 Minutes | 288 | 12.1% |
| 15 to 19 Minutes | 154 | 6.5% |
| 20 to 24 Minutes | 177 | 7.4% |
| 25 to 29 Minutes | 69 | 2.9% |
| 30 to 34 Minutes | 185 | 7.7% |
| 35 to 39 Minutes | 57 | 2.4% |
| 40 to 44 Minutes | 79 | 3.3% |
| 45 to 59 Minutes | 53 | 2.2% |
| 60 to 89 Minutes | 113 | 4.7% |
| 90 or more Minutes | 30 | 1.3% |
Commute Time by Sex in Pondera County
The most common commute times in Pondera County are 5 to 9 minutes (382 commuters, 30.2%) for males and 5 to 9 minutes (410 commuters, 36.5%) for females.

| Commute Time | Male | Female |
| Less than 5 Minutes | 234 (18.5%) | 156 (13.9%) |
| 5 to 9 Minutes | 382 (30.2%) | 410 (36.5%) |
| 10 to 14 Minutes | 112 (8.8%) | 176 (15.7%) |
| 15 to 19 Minutes | 110 (8.7%) | 44 (3.9%) |
| 20 to 24 Minutes | 109 (8.6%) | 68 (6.1%) |
| 25 to 29 Minutes | 37 (2.9%) | 32 (2.9%) |
| 30 to 34 Minutes | 104 (8.2%) | 81 (7.2%) |
| 35 to 39 Minutes | 18 (1.4%) | 39 (3.5%) |
| 40 to 44 Minutes | 47 (3.7%) | 32 (2.9%) |
| 45 to 59 Minutes | 31 (2.5%) | 22 (2.0%) |
| 60 to 89 Minutes | 67 (5.3%) | 46 (4.1%) |
| 90 or more Minutes | 14 (1.1%) | 16 (1.4%) |
Time of Departure to Work by Sex in Pondera County
The most frequent times of departure to work in Pondera County are 8:00 AM to 8:29 AM (285, 22.5%) for males and 7:00 AM to 7:29 AM (250, 22.3%) for females.

| Time of Departure | Male | Female |
| 12:00 AM to 4:59 AM | 17 (1.3%) | 45 (4.0%) |
| 5:00 AM to 5:29 AM | 64 (5.1%) | 0 (0.0%) |
| 5:30 AM to 5:59 AM | 29 (2.3%) | 11 (1.0%) |
| 6:00 AM to 6:29 AM | 115 (9.1%) | 44 (3.9%) |
| 6:30 AM to 6:59 AM | 110 (8.7%) | 55 (4.9%) |
| 7:00 AM to 7:29 AM | 255 (20.2%) | 250 (22.3%) |
| 7:30 AM to 7:59 AM | 174 (13.8%) | 242 (21.6%) |
| 8:00 AM to 8:29 AM | 285 (22.5%) | 222 (19.8%) |
| 8:30 AM to 8:59 AM | 26 (2.1%) | 66 (5.9%) |
| 9:00 AM to 9:59 AM | 28 (2.2%) | 37 (3.3%) |
| 10:00 AM to 10:59 AM | 0 (0.0%) | 42 (3.7%) |
| 11:00 AM to 11:59 AM | 6 (0.5%) | 0 (0.0%) |
| 12:00 PM to 3:59 PM | 84 (6.6%) | 74 (6.6%) |
| 4:00 PM to 11:59 PM | 72 (5.7%) | 34 (3.0%) |
| Total | 1,265 (100.0%) | 1,122 (100.0%) |
Housing Occupancy in Pondera County
Occupancy by Ownership in Pondera County
Of the total 2,153 dwellings in Pondera County, owner-occupied units account for 1,436 (66.7%), while renter-occupied units make up 717 (33.3%).
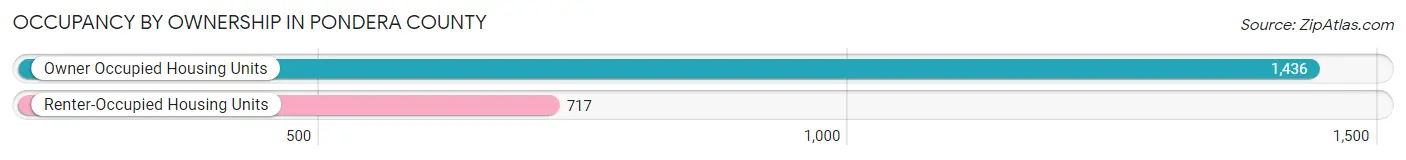
| Occupancy | # Housing Units | % Housing Units |
| Owner Occupied Housing Units | 1,436 | 66.7% |
| Renter-Occupied Housing Units | 717 | 33.3% |
| Total Occupied Housing Units | 2,153 | 100.0% |
Occupancy by Household Size in Pondera County

| Household Size | # Housing Units | % Housing Units |
| 1-Person Household | 582 | 27.0% |
| 2-Person Household | 896 | 41.6% |
| 3-Person Household | 236 | 11.0% |
| 4+ Person Household | 439 | 20.4% |
| Total Housing Units | 2,153 | 100.0% |
Occupancy by Ownership by Household Size in Pondera County
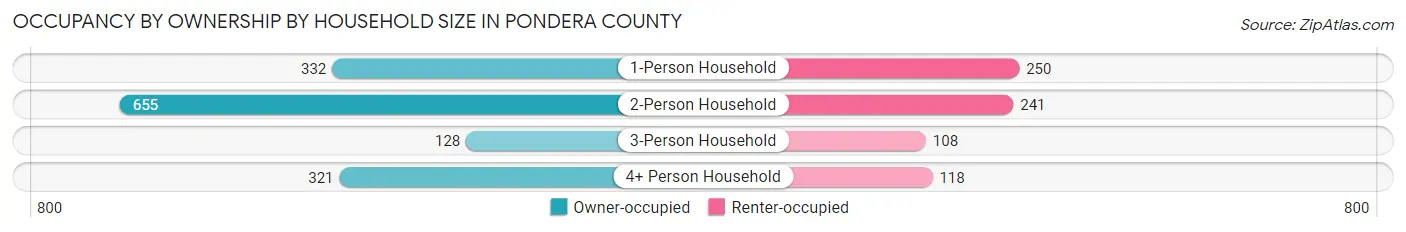
| Household Size | Owner-occupied | Renter-occupied |
| 1-Person Household | 332 (57.0%) | 250 (43.0%) |
| 2-Person Household | 655 (73.1%) | 241 (26.9%) |
| 3-Person Household | 128 (54.2%) | 108 (45.8%) |
| 4+ Person Household | 321 (73.1%) | 118 (26.9%) |
| Total Housing Units | 1,436 (66.7%) | 717 (33.3%) |
Occupancy by Educational Attainment in Pondera County
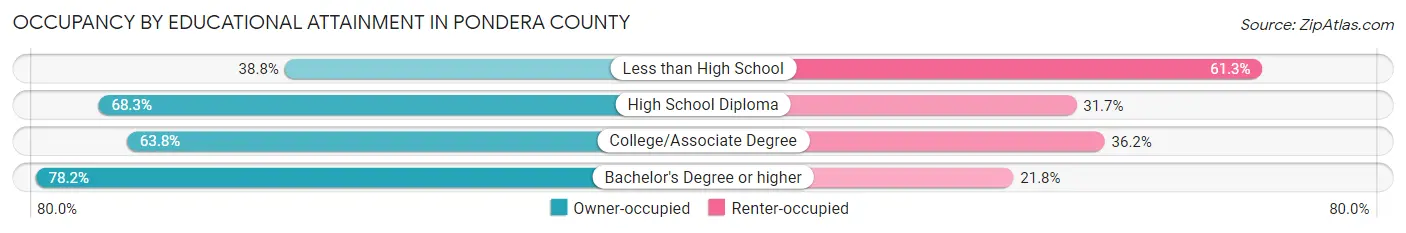
| Household Size | Owner-occupied | Renter-occupied |
| Less than High School | 62 (38.8%) | 98 (61.3%) |
| High School Diploma | 413 (68.3%) | 192 (31.7%) |
| College/Associate Degree | 551 (63.8%) | 313 (36.2%) |
| Bachelor's Degree or higher | 410 (78.2%) | 114 (21.8%) |
Occupancy by Age of Householder in Pondera County

| Age Bracket | # Households | % Households |
| Under 35 Years | 297 | 13.8% |
| 35 to 44 Years | 288 | 13.4% |
| 45 to 54 Years | 275 | 12.8% |
| 55 to 64 Years | 496 | 23.0% |
| 65 to 74 Years | 413 | 19.2% |
| 75 to 84 Years | 294 | 13.7% |
| 85 Years and Over | 90 | 4.2% |
| Total | 2,153 | 100.0% |
Housing Finances in Pondera County
Median Income by Occupancy in Pondera County

| Occupancy Type | # Households | Median Income |
| Owner-Occupied | 1,436 (66.7%) | $70,556 |
| Renter-Occupied | 717 (33.3%) | $44,625 |
| Average | 2,153 (100.0%) | $59,861 |
Occupancy by Householder Income Bracket in Pondera County
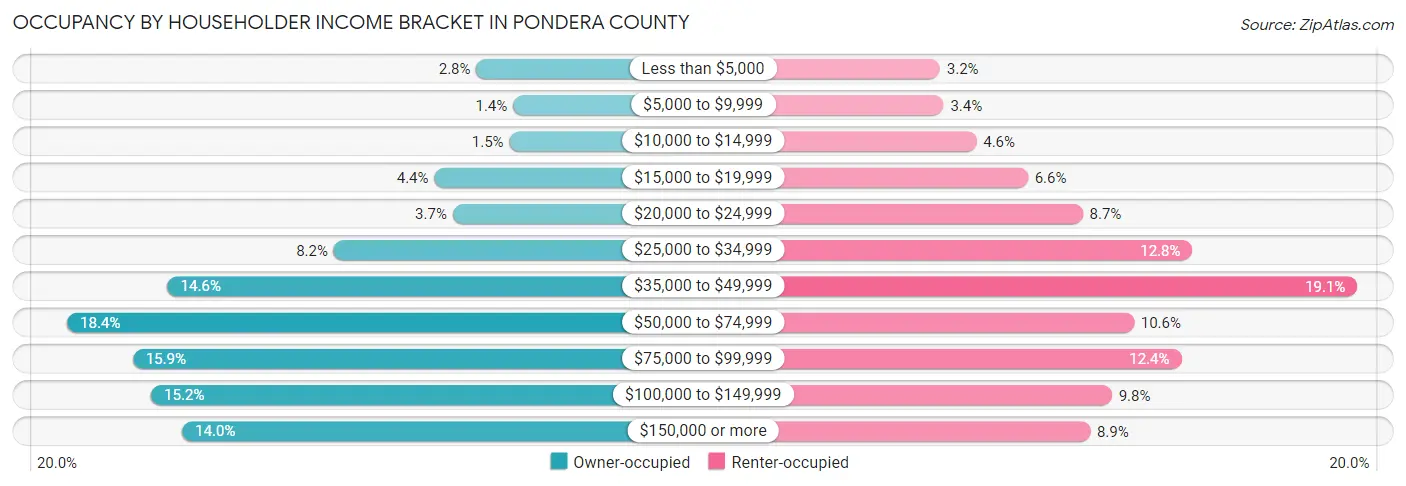
| Income Bracket | Owner-occupied | Renter-occupied |
| Less than $5,000 | 40 (2.8%) | 23 (3.2%) |
| $5,000 to $9,999 | 20 (1.4%) | 24 (3.4%) |
| $10,000 to $14,999 | 22 (1.5%) | 33 (4.6%) |
| $15,000 to $19,999 | 63 (4.4%) | 47 (6.6%) |
| $20,000 to $24,999 | 53 (3.7%) | 62 (8.6%) |
| $25,000 to $34,999 | 118 (8.2%) | 92 (12.8%) |
| $35,000 to $49,999 | 209 (14.5%) | 137 (19.1%) |
| $50,000 to $74,999 | 264 (18.4%) | 76 (10.6%) |
| $75,000 to $99,999 | 228 (15.9%) | 89 (12.4%) |
| $100,000 to $149,999 | 218 (15.2%) | 70 (9.8%) |
| $150,000 or more | 201 (14.0%) | 64 (8.9%) |
| Total | 1,436 (100.0%) | 717 (100.0%) |
Monthly Housing Cost Tiers in Pondera County

| Monthly Cost | Owner-occupied | Renter-occupied |
| Less than $300 | 123 (8.6%) | 12 (1.7%) |
| $300 to $499 | 347 (24.2%) | 82 (11.4%) |
| $500 to $799 | 409 (28.5%) | 176 (24.5%) |
| $800 to $999 | 152 (10.6%) | 134 (18.7%) |
| $1,000 to $1,499 | 187 (13.0%) | 90 (12.6%) |
| $1,500 to $1,999 | 121 (8.4%) | 21 (2.9%) |
| $2,000 to $2,499 | 20 (1.4%) | 0 (0.0%) |
| $2,500 to $2,999 | 24 (1.7%) | 0 (0.0%) |
| $3,000 or more | 53 (3.7%) | 0 (0.0%) |
| Total | 1,436 (100.0%) | 717 (100.0%) |
Physical Housing Characteristics in Pondera County
Housing Structures in Pondera County

| Structure Type | # Housing Units | % Housing Units |
| Single Unit, Detached | 1,717 | 79.7% |
| Single Unit, Attached | 34 | 1.6% |
| 2 Unit Apartments | 73 | 3.4% |
| 3 or 4 Unit Apartments | 23 | 1.1% |
| 5 to 9 Unit Apartments | 53 | 2.5% |
| 10 or more Apartments | 65 | 3.0% |
| Mobile Home / Other | 188 | 8.7% |
| Total | 2,153 | 100.0% |
Housing Structures by Occupancy in Pondera County

| Structure Type | Owner-occupied | Renter-occupied |
| Single Unit, Detached | 1,276 (74.3%) | 441 (25.7%) |
| Single Unit, Attached | 3 (8.8%) | 31 (91.2%) |
| 2 Unit Apartments | 6 (8.2%) | 67 (91.8%) |
| 3 or 4 Unit Apartments | 6 (26.1%) | 17 (73.9%) |
| 5 to 9 Unit Apartments | 10 (18.9%) | 43 (81.1%) |
| 10 or more Apartments | 0 (0.0%) | 65 (100.0%) |
| Mobile Home / Other | 135 (71.8%) | 53 (28.2%) |
| Total | 1,436 (66.7%) | 717 (33.3%) |
Housing Structures by Number of Rooms in Pondera County
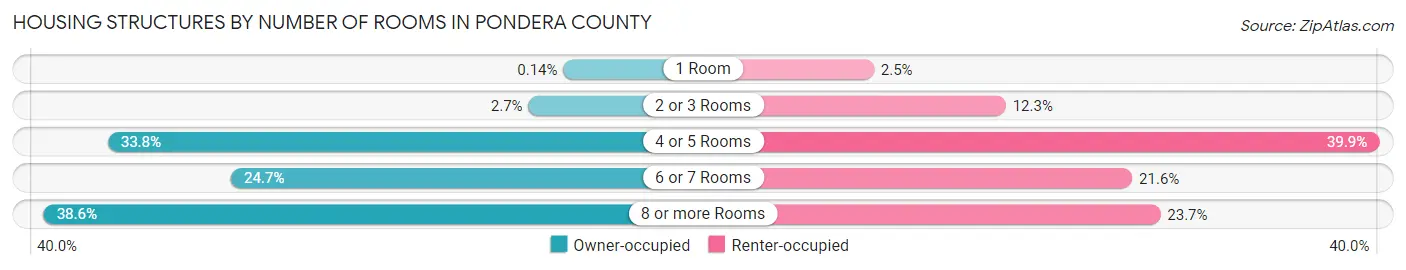
| Number of Rooms | Owner-occupied | Renter-occupied |
| 1 Room | 2 (0.1%) | 18 (2.5%) |
| 2 or 3 Rooms | 39 (2.7%) | 88 (12.3%) |
| 4 or 5 Rooms | 486 (33.8%) | 286 (39.9%) |
| 6 or 7 Rooms | 355 (24.7%) | 155 (21.6%) |
| 8 or more Rooms | 554 (38.6%) | 170 (23.7%) |
| Total | 1,436 (100.0%) | 717 (100.0%) |
Housing Structure by Heating Type in Pondera County

| Heating Type | Owner-occupied | Renter-occupied |
| Utility Gas | 864 (60.2%) | 316 (44.1%) |
| Bottled, Tank, or LP Gas | 326 (22.7%) | 126 (17.6%) |
| Electricity | 174 (12.1%) | 248 (34.6%) |
| Fuel Oil or Kerosene | 11 (0.8%) | 1 (0.1%) |
| Coal or Coke | 0 (0.0%) | 0 (0.0%) |
| All other Fuels | 61 (4.3%) | 24 (3.4%) |
| No Fuel Used | 0 (0.0%) | 2 (0.3%) |
| Total | 1,436 (100.0%) | 717 (100.0%) |
Household Vehicle Usage in Pondera County

| Vehicles per Household | Owner-occupied | Renter-occupied |
| No Vehicle | 50 (3.5%) | 74 (10.3%) |
| 1 Vehicle | 205 (14.3%) | 295 (41.1%) |
| 2 Vehicles | 494 (34.4%) | 172 (24.0%) |
| 3 or more Vehicles | 687 (47.8%) | 176 (24.5%) |
| Total | 1,436 (100.0%) | 717 (100.0%) |
Real Estate & Mortgages in Pondera County
Real Estate and Mortgage Overview in Pondera County
| Characteristic | Without Mortgage | With Mortgage |
| Housing Units | 864 | 572 |
| Median Property Value | $180,000 | $161,800 |
| Median Household Income | $68,289 | $61 |
| Monthly Housing Costs | $499 | $53 |
| Real Estate Taxes | $1,761 | $16 |
Property Value by Mortgage Status in Pondera County

| Property Value | Without Mortgage | With Mortgage |
| Less than $50,000 | 108 (12.5%) | 30 (5.2%) |
| $50,000 to $99,999 | 129 (14.9%) | 118 (20.6%) |
| $100,000 to $299,999 | 384 (44.4%) | 294 (51.4%) |
| $300,000 to $499,999 | 148 (17.1%) | 74 (12.9%) |
| $500,000 to $749,999 | 60 (6.9%) | 43 (7.5%) |
| $750,000 to $999,999 | 20 (2.3%) | 3 (0.5%) |
| $1,000,000 or more | 15 (1.7%) | 10 (1.8%) |
| Total | 864 (100.0%) | 572 (100.0%) |
Household Income by Mortgage Status in Pondera County

| Household Income | Without Mortgage | With Mortgage |
| Less than $10,000 | 39 (4.5%) | 18 (3.2%) |
| $10,000 to $24,999 | 98 (11.3%) | 21 (3.7%) |
| $25,000 to $34,999 | 82 (9.5%) | 40 (7.0%) |
| $35,000 to $49,999 | 126 (14.6%) | 36 (6.3%) |
| $50,000 to $74,999 | 154 (17.8%) | 83 (14.5%) |
| $75,000 to $99,999 | 113 (13.1%) | 110 (19.2%) |
| $100,000 to $149,999 | 112 (13.0%) | 115 (20.1%) |
| $150,000 or more | 140 (16.2%) | 106 (18.5%) |
| Total | 864 (100.0%) | 572 (100.0%) |
Property Value to Household Income Ratio in Pondera County

| Value-to-Income Ratio | Without Mortgage | With Mortgage |
| Less than 2.0x | 380 (44.0%) | 72,500 (12,674.8%) |
| 2.0x to 2.9x | 111 (12.9%) | 251 (43.9%) |
| 3.0x to 3.9x | 85 (9.8%) | 93 (16.3%) |
| 4.0x or more | 282 (32.6%) | 71 (12.4%) |
| Total | 864 (100.0%) | 572 (100.0%) |
Real Estate Taxes by Mortgage Status in Pondera County
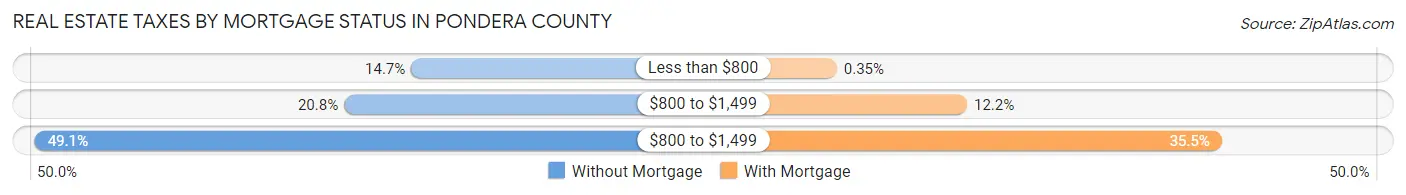
| Property Taxes | Without Mortgage | With Mortgage |
| Less than $800 | 127 (14.7%) | 2 (0.4%) |
| $800 to $1,499 | 180 (20.8%) | 70 (12.2%) |
| $800 to $1,499 | 424 (49.1%) | 203 (35.5%) |
| Total | 864 (100.0%) | 572 (100.0%) |
Health & Disability in Pondera County
Health Insurance Coverage by Age in Pondera County
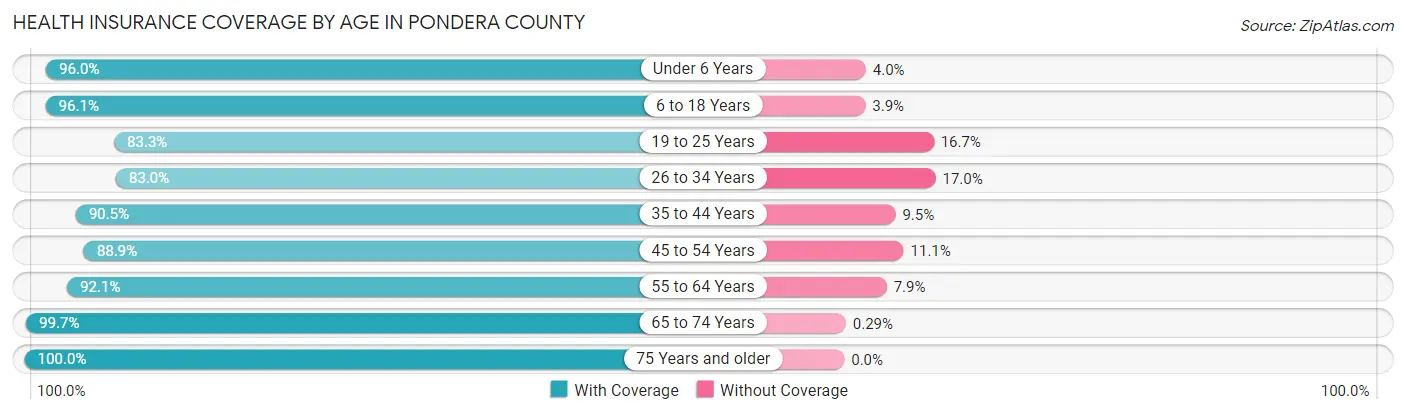
| Age Bracket | With Coverage | Without Coverage |
| Under 6 Years | 477 (96.0%) | 20 (4.0%) |
| 6 to 18 Years | 954 (96.1%) | 39 (3.9%) |
| 19 to 25 Years | 375 (83.3%) | 75 (16.7%) |
| 26 to 34 Years | 473 (83.0%) | 97 (17.0%) |
| 35 to 44 Years | 607 (90.5%) | 64 (9.5%) |
| 45 to 54 Years | 539 (88.9%) | 67 (11.1%) |
| 55 to 64 Years | 850 (92.1%) | 73 (7.9%) |
| 65 to 74 Years | 690 (99.7%) | 2 (0.3%) |
| 75 Years and older | 510 (100.0%) | 0 (0.0%) |
| Total | 5,475 (92.6%) | 437 (7.4%) |
Health Insurance Coverage by Citizenship Status in Pondera County
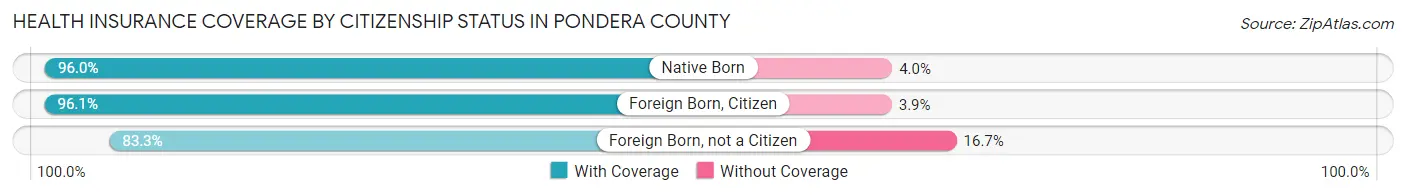
| Citizenship Status | With Coverage | Without Coverage |
| Native Born | 477 (96.0%) | 20 (4.0%) |
| Foreign Born, Citizen | 954 (96.1%) | 39 (3.9%) |
| Foreign Born, not a Citizen | 375 (83.3%) | 75 (16.7%) |
Health Insurance Coverage by Household Income in Pondera County
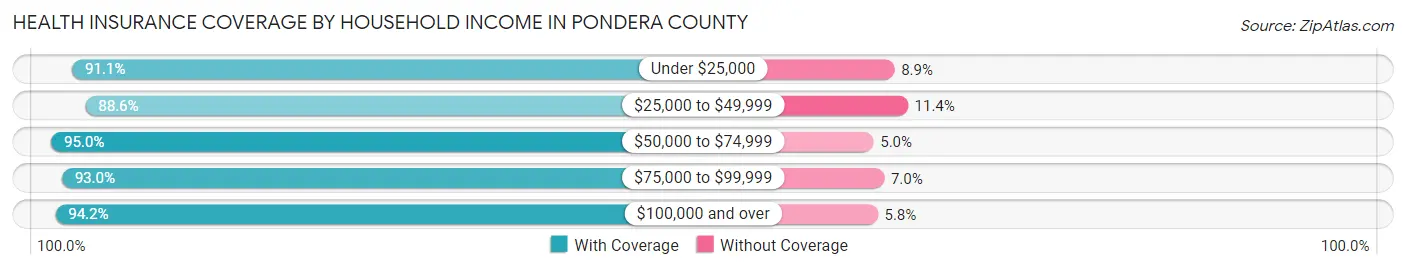
| Household Income | With Coverage | Without Coverage |
| Under $25,000 | 922 (91.1%) | 90 (8.9%) |
| $25,000 to $49,999 | 1,105 (88.6%) | 142 (11.4%) |
| $50,000 to $74,999 | 1,034 (95.0%) | 54 (5.0%) |
| $75,000 to $99,999 | 815 (93.0%) | 61 (7.0%) |
| $100,000 and over | 1,473 (94.2%) | 90 (5.8%) |
Public vs Private Health Insurance Coverage by Age in Pondera County
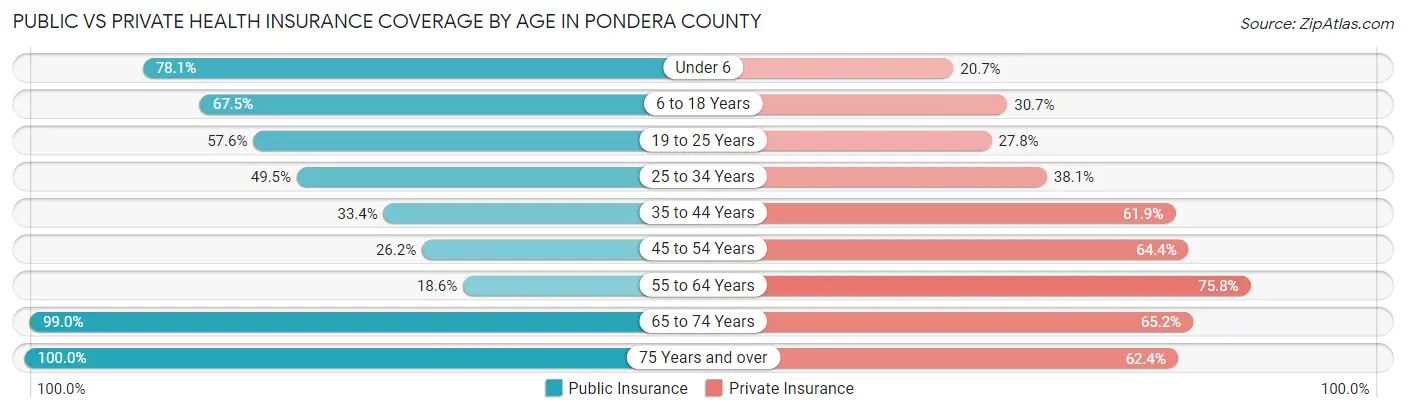
| Age Bracket | Public Insurance | Private Insurance |
| Under 6 | 388 (78.1%) | 103 (20.7%) |
| 6 to 18 Years | 670 (67.5%) | 305 (30.7%) |
| 19 to 25 Years | 259 (57.6%) | 125 (27.8%) |
| 25 to 34 Years | 282 (49.5%) | 217 (38.1%) |
| 35 to 44 Years | 224 (33.4%) | 415 (61.9%) |
| 45 to 54 Years | 159 (26.2%) | 390 (64.4%) |
| 55 to 64 Years | 172 (18.6%) | 700 (75.8%) |
| 65 to 74 Years | 685 (99.0%) | 451 (65.2%) |
| 75 Years and over | 510 (100.0%) | 318 (62.4%) |
| Total | 3,349 (56.7%) | 3,024 (51.1%) |
Disability Status by Sex by Age in Pondera County
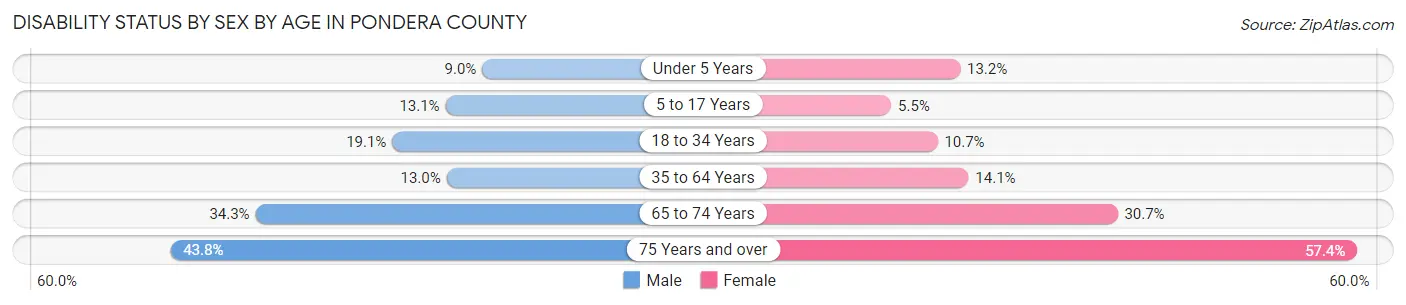
| Age Bracket | Male | Female |
| Under 5 Years | 17 (9.0%) | 27 (13.2%) |
| 5 to 17 Years | 70 (13.1%) | 26 (5.5%) |
| 18 to 34 Years | 106 (19.1%) | 59 (10.6%) |
| 35 to 64 Years | 146 (13.0%) | 152 (14.1%) |
| 65 to 74 Years | 120 (34.3%) | 105 (30.7%) |
| 75 Years and over | 102 (43.8%) | 159 (57.4%) |
Disability Class by Sex by Age in Pondera County
Disability Class: Hearing Difficulty
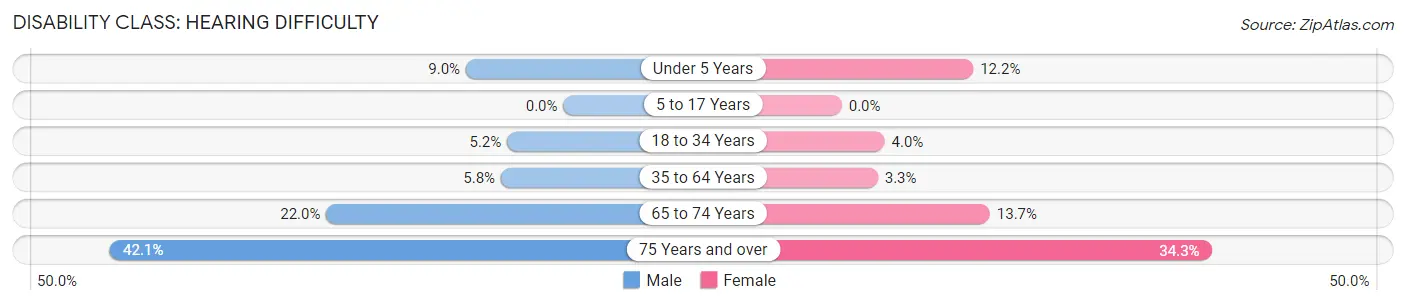
| Age Bracket | Male | Female |
| Under 5 Years | 17 (9.0%) | 25 (12.2%) |
| 5 to 17 Years | 0 (0.0%) | 0 (0.0%) |
| 18 to 34 Years | 29 (5.2%) | 22 (4.0%) |
| 35 to 64 Years | 65 (5.8%) | 36 (3.3%) |
| 65 to 74 Years | 77 (22.0%) | 47 (13.7%) |
| 75 Years and over | 98 (42.1%) | 95 (34.3%) |
Disability Class: Vision Difficulty
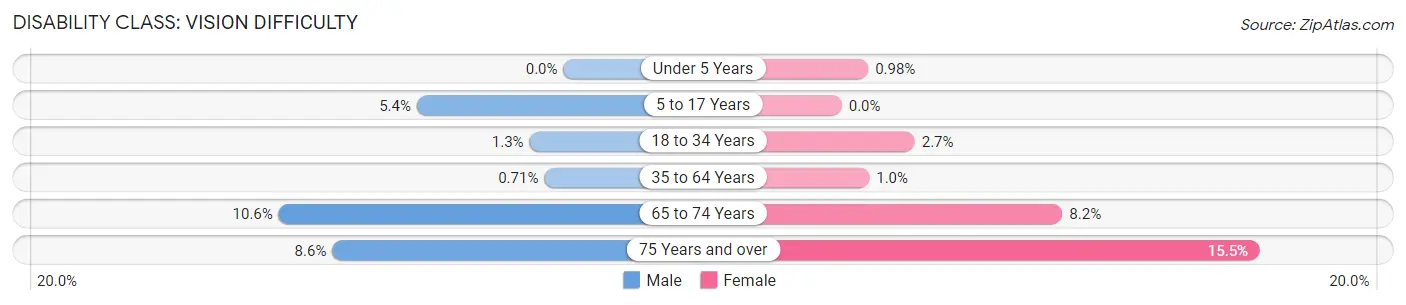
| Age Bracket | Male | Female |
| Under 5 Years | 0 (0.0%) | 2 (1.0%) |
| 5 to 17 Years | 29 (5.4%) | 0 (0.0%) |
| 18 to 34 Years | 7 (1.3%) | 15 (2.7%) |
| 35 to 64 Years | 8 (0.7%) | 11 (1.0%) |
| 65 to 74 Years | 37 (10.6%) | 28 (8.2%) |
| 75 Years and over | 20 (8.6%) | 43 (15.5%) |
Disability Class: Cognitive Difficulty
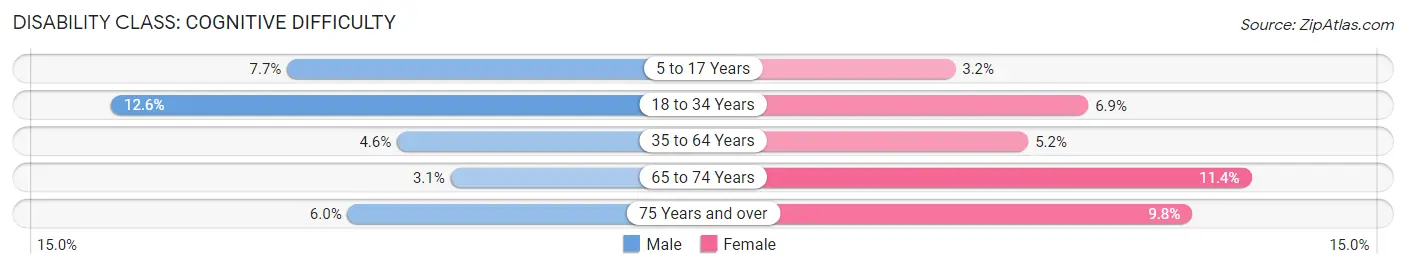
| Age Bracket | Male | Female |
| 5 to 17 Years | 41 (7.7%) | 15 (3.2%) |
| 18 to 34 Years | 70 (12.6%) | 38 (6.9%) |
| 35 to 64 Years | 52 (4.6%) | 56 (5.2%) |
| 65 to 74 Years | 11 (3.1%) | 39 (11.4%) |
| 75 Years and over | 14 (6.0%) | 27 (9.8%) |
Disability Class: Ambulatory Difficulty
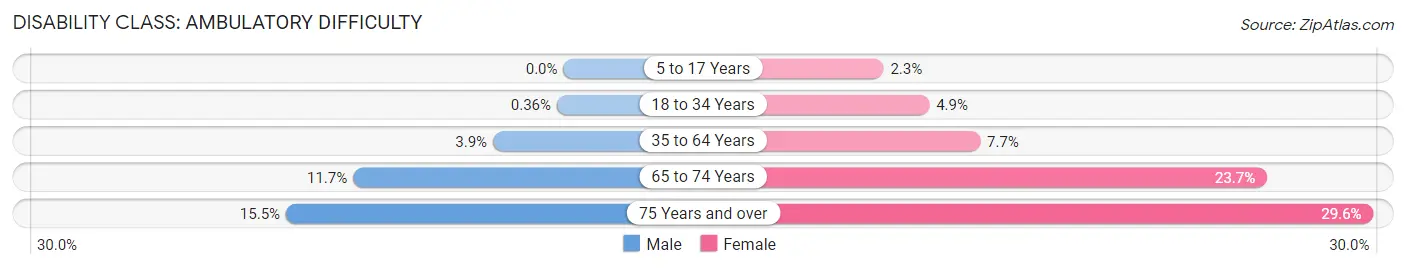
| Age Bracket | Male | Female |
| 5 to 17 Years | 0 (0.0%) | 11 (2.3%) |
| 18 to 34 Years | 2 (0.4%) | 27 (4.9%) |
| 35 to 64 Years | 44 (3.9%) | 83 (7.7%) |
| 65 to 74 Years | 41 (11.7%) | 81 (23.7%) |
| 75 Years and over | 36 (15.4%) | 82 (29.6%) |
Disability Class: Self-Care Difficulty

| Age Bracket | Male | Female |
| 5 to 17 Years | 8 (1.5%) | 0 (0.0%) |
| 18 to 34 Years | 0 (0.0%) | 27 (4.9%) |
| 35 to 64 Years | 9 (0.8%) | 30 (2.8%) |
| 65 to 74 Years | 4 (1.1%) | 7 (2.1%) |
| 75 Years and over | 4 (1.7%) | 21 (7.6%) |
Technology Access in Pondera County
Computing Device Access in Pondera County
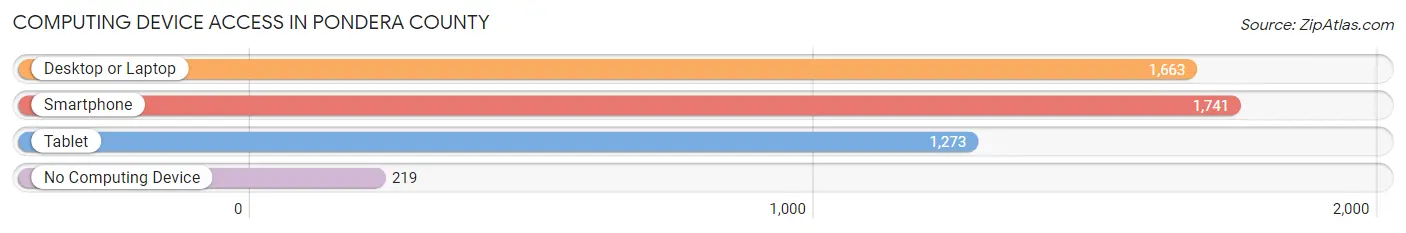
| Device Type | # Households | % Households |
| Desktop or Laptop | 1,663 | 77.2% |
| Smartphone | 1,741 | 80.9% |
| Tablet | 1,273 | 59.1% |
| No Computing Device | 219 | 10.2% |
| Total | 2,153 | 100.0% |
Internet Access in Pondera County
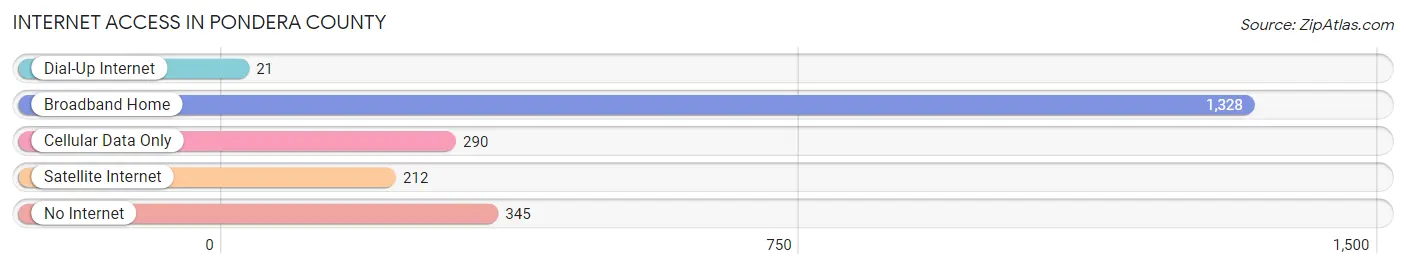
| Internet Type | # Households | % Households |
| Dial-Up Internet | 21 | 1.0% |
| Broadband Home | 1,328 | 61.7% |
| Cellular Data Only | 290 | 13.5% |
| Satellite Internet | 212 | 9.9% |
| No Internet | 345 | 16.0% |
| Total | 2,153 | 100.0% |
Pondera County Summary
Pondera County is located in the north-central region of Montana, and is bordered by Glacier, Teton, Chouteau, and Cascade Counties. The county seat is Conrad, and the largest city is Valier. The county was established in 1919 and named after the Pondera River, which is a tributary of the Marias River.
Geography
Pondera County covers an area of 1,845 square miles, making it the fourth largest county in Montana. The county is located in the Rocky Mountain Front Range, and is characterized by rolling hills, grasslands, and river valleys. The highest point in the county is Mount Stimson, which has an elevation of 9,844 feet. The county is home to several rivers, including the Marias, Teton, and Two Medicine Rivers.
The climate of Pondera County is semi-arid, with cold winters and hot summers. The average annual precipitation is 13.5 inches, and the average annual snowfall is 28.5 inches.
Economy
Agriculture is the primary economic activity in Pondera County. The county is home to several large farms, and the main crops grown are wheat, barley, and hay. Livestock production is also important, and the county is home to several large cattle ranches.
Oil and gas production is also an important part of the economy. The county is home to several oil and gas fields, and the production of these resources has been increasing in recent years.
Demographics
As of the 2010 census, the population of Pondera County was 9,153. The population is predominantly white (94.3%), with small percentages of Native American (2.2%), Hispanic (1.7%), and Asian (0.7%) populations. The median household income is $45,813, and the median home value is $133,400.
The largest city in the county is Valier, with a population of 1,068. Other cities include Conrad (population 890), Dupuyer (population 545), and Brady (population 463).
Conclusion
Pondera County is a rural county located in the north-central region of Montana. The county is characterized by rolling hills, grasslands, and river valleys, and is home to several large farms and ranches. Oil and gas production is also an important part of the economy. The population of the county is predominantly white, and the median household income is $45,813.
Common Questions
What is the Total Population of Pondera County?
Total Population of Pondera County is 5,987.
What is the Total Male Population of Pondera County?
Total Male Population of Pondera County is 3,013.
What is the Total Female Population of Pondera County?
Total Female Population of Pondera County is 2,974.
What is the Ratio of Males per 100 Females in Pondera County?
There are 101.31 Males per 100 Females in Pondera County.
What is the Ratio of Females per 100 Males in Pondera County?
There are 98.71 Females per 100 Males in Pondera County.
What is the Median Population Age in Pondera County?
Median Population Age in Pondera County is 41.6 Years.
What is the Average Family Size in Pondera County
Average Family Size in Pondera County is 3.2 People.
What is the Average Household Size in Pondera County
Average Household Size in Pondera County is 2.7 People.
What is Per Capita Income in Pondera County?
Per Capita income in Pondera County is $30,424.
What is the Median Family Income in Pondera County?
Median Family Income in Pondera County is $74,806.
What is the Median Household income in Pondera County?
Median Household Income in Pondera County is $59,861.
What is Income or Wage Gap in Pondera County?
Income or Wage Gap in Pondera County is 23.4%.
Women in Pondera County earn 76.6 cents for every dollar earned by a man.
What is Family Income Deficit in Pondera County?
Family Income Deficit in Pondera County is $15,463.
Families that are below poverty line in Pondera County earn $15,463 less on average than the poverty threshold level.
What is Inequality or Gini Index in Pondera County?
Inequality or Gini Index in Pondera County is 0.44.
How Large is the Labor Force in Pondera County?
There are 2,825 People in the Labor Forcein in Pondera County.
What is the Percentage of People in the Labor Force in Pondera County?
59.9% of People are in the Labor Force in Pondera County.
What is the Unemployment Rate in Pondera County?
Unemployment Rate in Pondera County is 6.4%.