Phillips County, MT
Phillips County Map

Phillips County Overview
4,233
TOTAL POPULATION
2,247
MALE POPULATION
1,986
FEMALE POPULATION
113.14
MALES / 100 FEMALES
88.38
FEMALES / 100 MALES
45.9
MEDIAN AGE
2.9
AVG FAMILY SIZE
2.4
AVG HOUSEHOLD SIZE
$32,450
PER CAPITA INCOME
$73,692
AVG FAMILY INCOME
$61,250
AVG HOUSEHOLD INCOME
32.2%
WAGE / INCOME GAP [ % ]
67.8¢/ $1
WAGE / INCOME GAP [ $ ]
0.40
INEQUALITY / GINI INDEX
1,997
LABOR FORCE [ PEOPLE ]
60.4%
PERCENT IN LABOR FORCE
3.4%
UNEMPLOYMENT RATE
Phillips County Area Codes
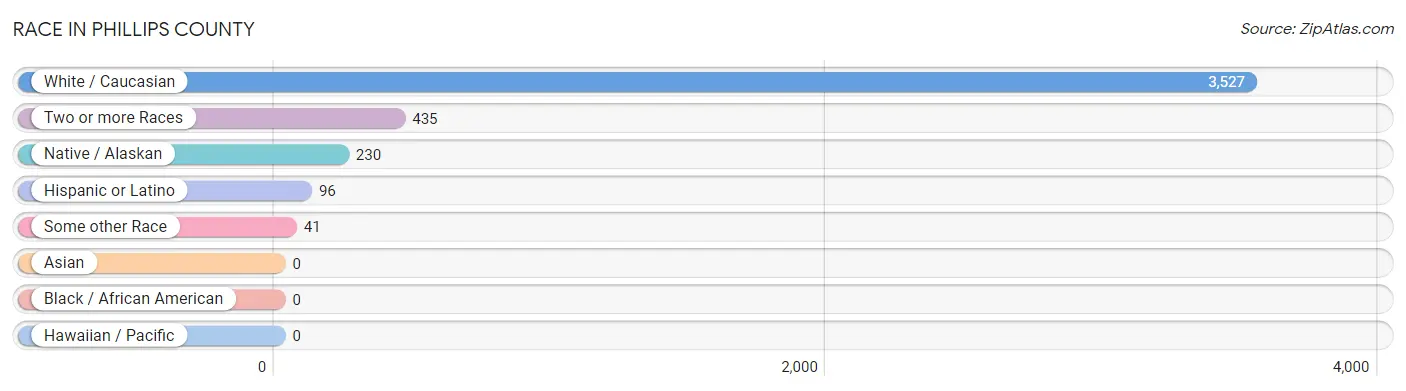
Race in Phillips County
The most populous races in Phillips County are White / Caucasian (3,527 | 83.3%), Two or more Races (435 | 10.3%), and Native / Alaskan (230 | 5.4%).
| Race | # Population | % Population |
| Asian | 0 | 0.0% |
| Black / African American | 0 | 0.0% |
| Hawaiian / Pacific | 0 | 0.0% |
| Hispanic or Latino | 96 | 2.3% |
| Native / Alaskan | 230 | 5.4% |
| White / Caucasian | 3,527 | 83.3% |
| Two or more Races | 435 | 10.3% |
| Some other Race | 41 | 1.0% |
| Total | 4,233 | 100.0% |
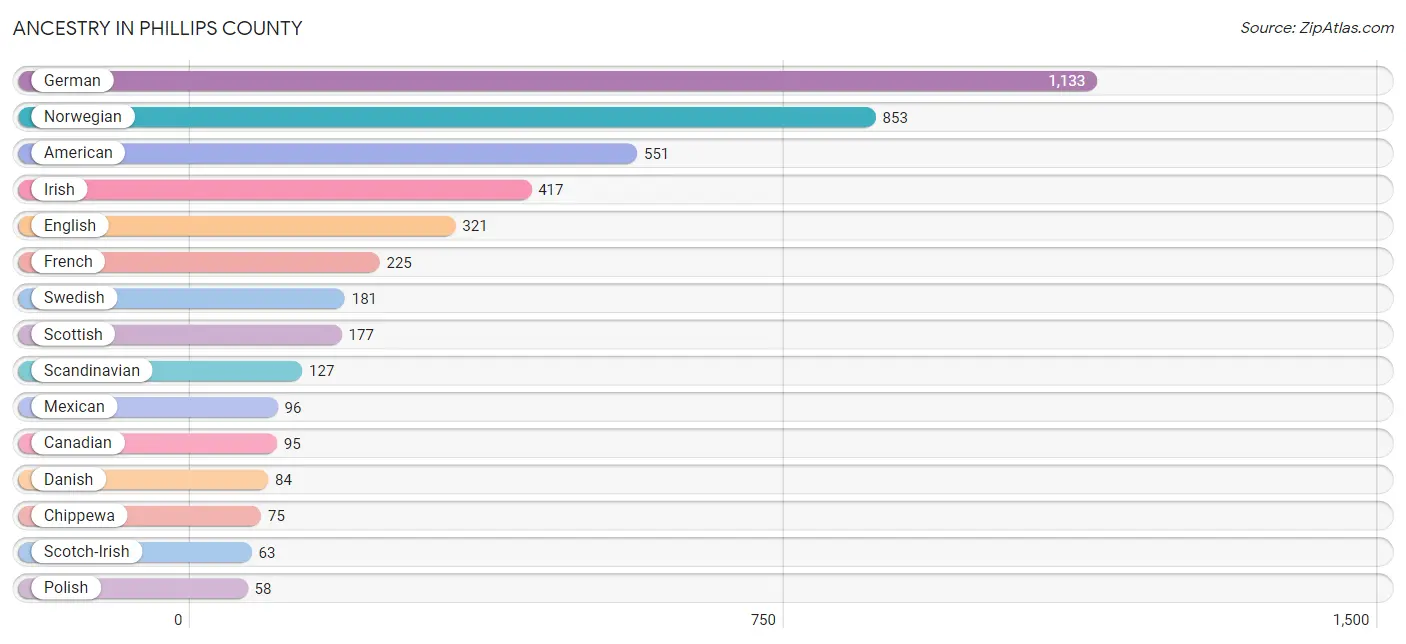
Ancestry in Phillips County
The most populous ancestries reported in Phillips County are German (1,133 | 26.8%), Norwegian (853 | 20.2%), American (551 | 13.0%), Irish (417 | 9.9%), and English (321 | 7.6%), together accounting for 77.4% of all Phillips County residents.
| Ancestry | # Population | % Population |
| American | 551 | 13.0% |
| Armenian | 2 | 0.1% |
| Austrian | 1 | 0.0% |
| Belgian | 9 | 0.2% |
| Blackfeet | 3 | 0.1% |
| British | 3 | 0.1% |
| Canadian | 95 | 2.2% |
| Cherokee | 54 | 1.3% |
| Chippewa | 75 | 1.8% |
| Choctaw | 2 | 0.1% |
| Comanche | 8 | 0.2% |
| Cree | 8 | 0.2% |
| Czech | 38 | 0.9% |
| Danish | 84 | 2.0% |
| Dutch | 56 | 1.3% |
| English | 321 | 7.6% |
| European | 11 | 0.3% |
| Finnish | 26 | 0.6% |
| French | 225 | 5.3% |
| French Canadian | 22 | 0.5% |
| German | 1,133 | 26.8% |
| Irish | 417 | 9.9% |
| Italian | 40 | 0.9% |
| Mexican | 96 | 2.3% |
| Norwegian | 853 | 20.2% |
| Paiute | 2 | 0.1% |
| Pennsylvania German | 35 | 0.8% |
| Polish | 58 | 1.4% |
| Puget Sound Salish | 9 | 0.2% |
| Russian | 24 | 0.6% |
| Scandinavian | 127 | 3.0% |
| Scotch-Irish | 63 | 1.5% |
| Scottish | 177 | 4.2% |
| Swedish | 181 | 4.3% |
| Swiss | 39 | 0.9% |
| Ukrainian | 23 | 0.5% |
| Welsh | 1 | 0.0% | View All 37 Rows |
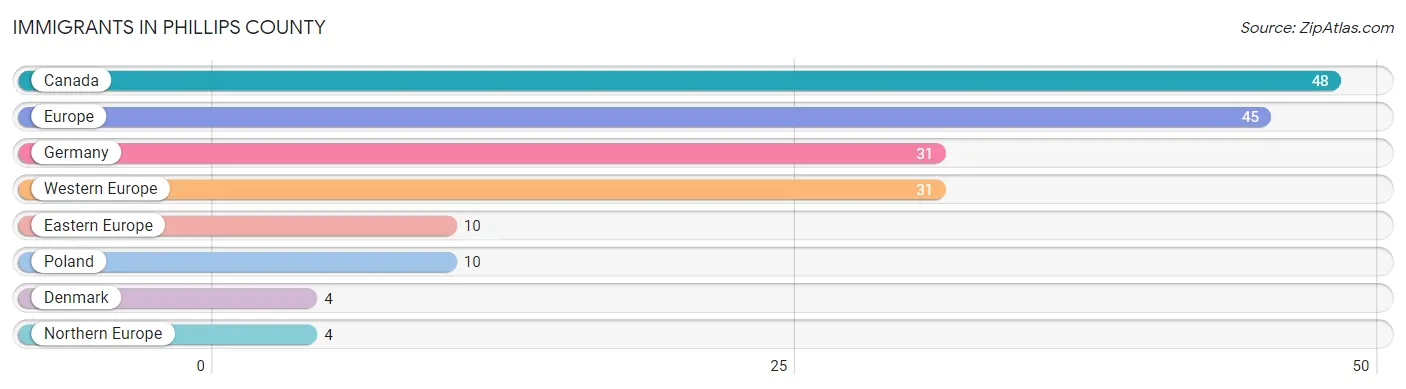
Immigrants in Phillips County
The most numerous immigrant groups reported in Phillips County came from Canada (48 | 1.1%), Europe (45 | 1.1%), Germany (31 | 0.7%), Western Europe (31 | 0.7%), and Eastern Europe (10 | 0.2%), together accounting for 3.9% of all Phillips County residents.
| Immigration Origin | # Population | % Population |
| Canada | 48 | 1.1% |
| Denmark | 4 | 0.1% |
| Eastern Europe | 10 | 0.2% |
| Europe | 45 | 1.1% |
| Germany | 31 | 0.7% |
| Northern Europe | 4 | 0.1% |
| Poland | 10 | 0.2% |
| Western Europe | 31 | 0.7% | View All 8 Rows |
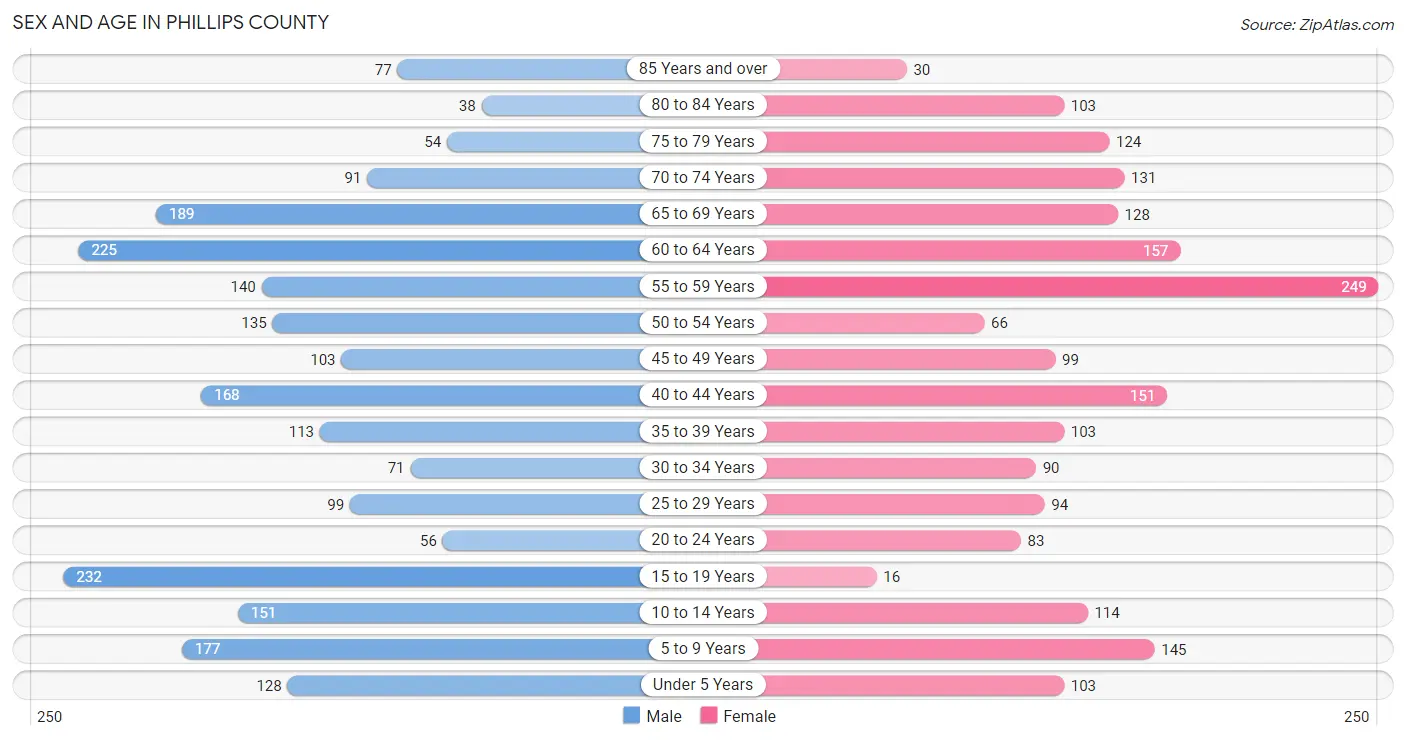
Sex and Age in Phillips County
Sex and Age in Phillips County
The most populous age groups in Phillips County are 15 to 19 Years (232 | 10.3%) for men and 55 to 59 Years (249 | 12.5%) for women.
| Age Bracket | Male | Female |
| Under 5 Years | 128 (5.7%) | 103 (5.2%) |
| 5 to 9 Years | 177 (7.9%) | 145 (7.3%) |
| 10 to 14 Years | 151 (6.7%) | 114 (5.7%) |
| 15 to 19 Years | 232 (10.3%) | 16 (0.8%) |
| 20 to 24 Years | 56 (2.5%) | 83 (4.2%) |
| 25 to 29 Years | 99 (4.4%) | 94 (4.7%) |
| 30 to 34 Years | 71 (3.2%) | 90 (4.5%) |
| 35 to 39 Years | 113 (5.0%) | 103 (5.2%) |
| 40 to 44 Years | 168 (7.5%) | 151 (7.6%) |
| 45 to 49 Years | 103 (4.6%) | 99 (5.0%) |
| 50 to 54 Years | 135 (6.0%) | 66 (3.3%) |
| 55 to 59 Years | 140 (6.2%) | 249 (12.5%) |
| 60 to 64 Years | 225 (10.0%) | 157 (7.9%) |
| 65 to 69 Years | 189 (8.4%) | 128 (6.5%) |
| 70 to 74 Years | 91 (4.1%) | 131 (6.6%) |
| 75 to 79 Years | 54 (2.4%) | 124 (6.2%) |
| 80 to 84 Years | 38 (1.7%) | 103 (5.2%) |
| 85 Years and over | 77 (3.4%) | 30 (1.5%) |
| Total | 2,247 (100.0%) | 1,986 (100.0%) |
Families and Households in Phillips County
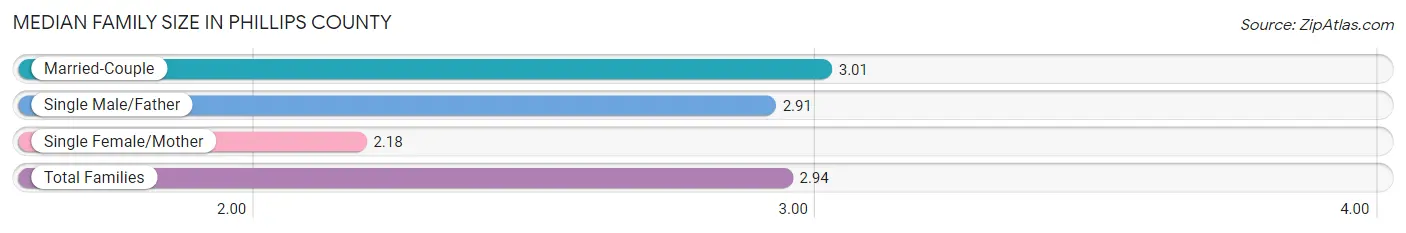
Median Family Size in Phillips County
The median family size in Phillips County is 2.94 persons per family, with married-couple families (967 | 82.5%) accounting for the largest median family size of 3.01 persons per family. On the other hand, single female/mother families (85 | 7.2%) represent the smallest median family size with 2.18 persons per family.
| Family Type | # Families | Family Size |
| Married-Couple | 967 (82.5%) | 3.01 |
| Single Male/Father | 120 (10.2%) | 2.91 |
| Single Female/Mother | 85 (7.2%) | 2.18 |
| Total Families | 1,172 (100.0%) | 2.94 |
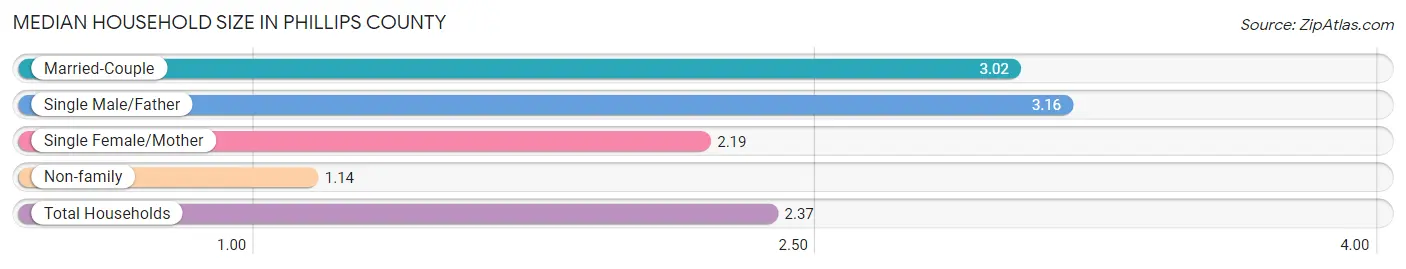
Median Household Size in Phillips County
The median household size in Phillips County is 2.37 persons per household, with single male/father households (120 | 6.9%) accounting for the largest median household size of 3.16 persons per household. non-family households (577 | 33.0%) represent the smallest median household size with 1.14 persons per household.
| Household Type | # Households | Household Size |
| Married-Couple | 967 (55.3%) | 3.02 |
| Single Male/Father | 120 (6.9%) | 3.16 |
| Single Female/Mother | 85 (4.9%) | 2.19 |
| Non-family | 577 (33.0%) | 1.14 |
| Total Households | 1,749 (100.0%) | 2.37 |
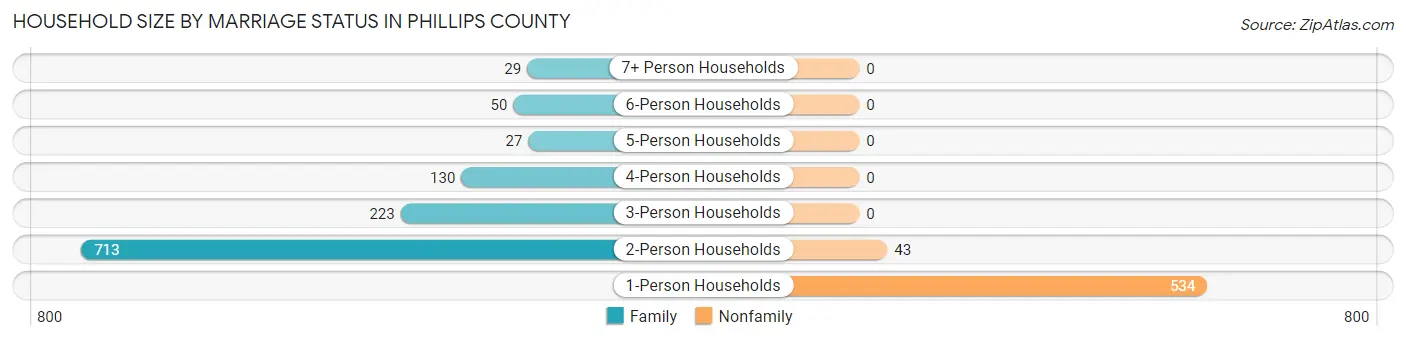
Household Size by Marriage Status in Phillips County
Out of a total of 1,749 households in Phillips County, 1,172 (67.0%) are family households, while 577 (33.0%) are nonfamily households. The most numerous type of family households are 2-person households, comprising 713, and the most common type of nonfamily households are 1-person households, comprising 534.
| Household Size | Family Households | Nonfamily Households |
| 1-Person Households | - | 534 (30.5%) |
| 2-Person Households | 713 (40.8%) | 43 (2.5%) |
| 3-Person Households | 223 (12.8%) | 0 (0.0%) |
| 4-Person Households | 130 (7.4%) | 0 (0.0%) |
| 5-Person Households | 27 (1.5%) | 0 (0.0%) |
| 6-Person Households | 50 (2.9%) | 0 (0.0%) |
| 7+ Person Households | 29 (1.7%) | 0 (0.0%) |
| Total | 1,172 (67.0%) | 577 (33.0%) |
Female Fertility in Phillips County
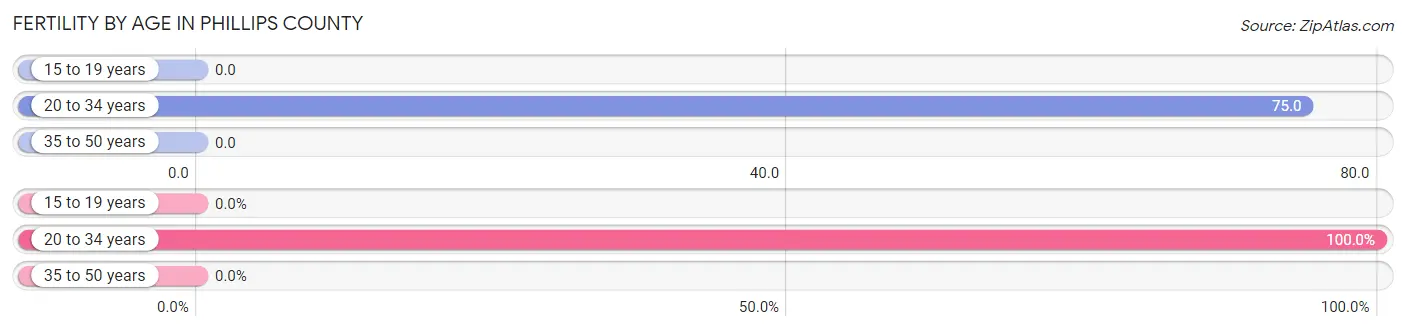
Fertility by Age in Phillips County
Average fertility rate in Phillips County is 31.0 births per 1,000 women. Women in the age bracket of 20 to 34 years have the highest fertility rate with 75.0 births per 1,000 women. Women in the age bracket of 20 to 34 years acount for 100.0% of all women with births.
| Age Bracket | Women with Births | Births / 1,000 Women |
| 15 to 19 years | 0 (0.0%) | 0.0 |
| 20 to 34 years | 20 (100.0%) | 75.0 |
| 35 to 50 years | 0 (0.0%) | 0.0 |
| Total | 20 (100.0%) | 31.0 |
Fertility by Age by Marriage Status in Phillips County
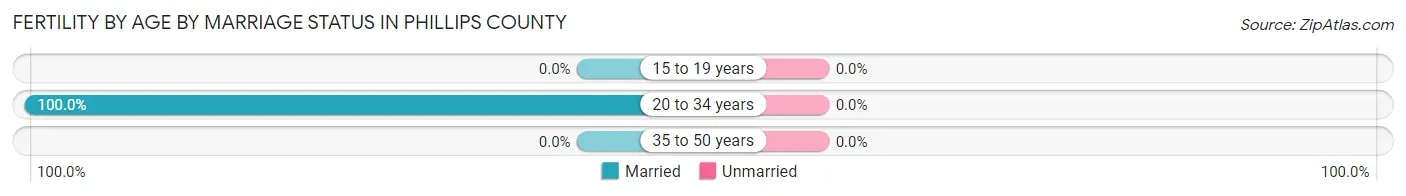
| Age Bracket | Married | Unmarried |
| 15 to 19 years | 0 (0.0%) | 0 (0.0%) |
| 20 to 34 years | 20 (100.0%) | 0 (0.0%) |
| 35 to 50 years | 0 (0.0%) | 0 (0.0%) |
| Total | 20 (100.0%) | 0 (0.0%) |
Fertility by Education in Phillips County
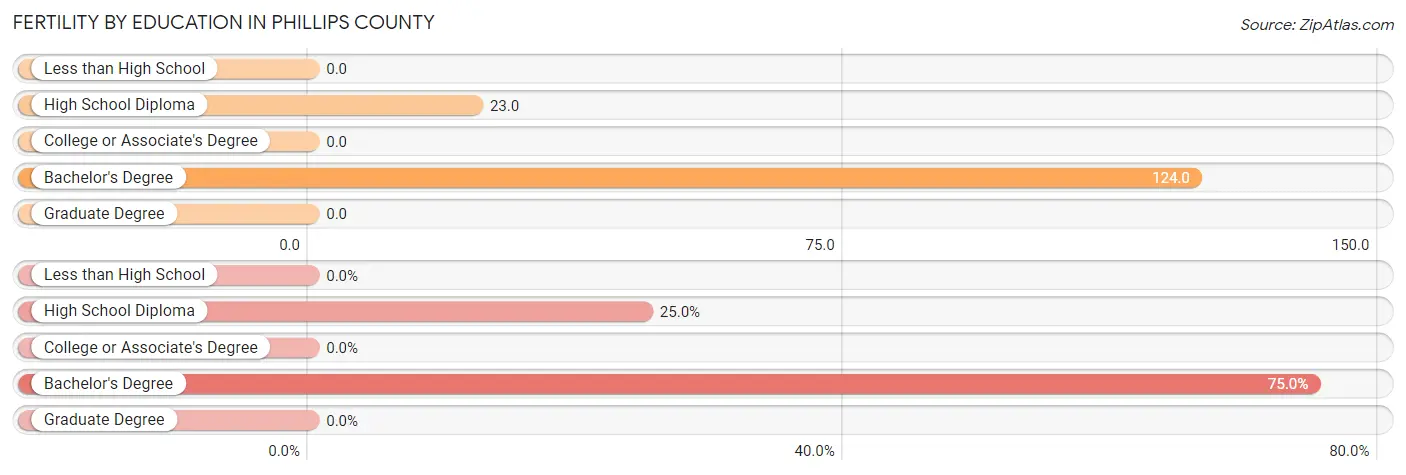
| Educational Attainment | Women with Births | Births / 1,000 Women |
| Less than High School | 0 (0.0%) | 0.0 |
| High School Diploma | 5 (25.0%) | 23.0 |
| College or Associate's Degree | 0 (0.0%) | 0.0 |
| Bachelor's Degree | 15 (75.0%) | 124.0 |
| Graduate Degree | 0 (0.0%) | 0.0 |
| Total | 20 (100.0%) | 31.0 |
Fertility by Education by Marriage Status in Phillips County

| Educational Attainment | Married | Unmarried |
| Less than High School | 0 (0.0%) | 0 (0.0%) |
| High School Diploma | 5 (100.0%) | 0 (0.0%) |
| College or Associate's Degree | 0 (0.0%) | 0 (0.0%) |
| Bachelor's Degree | 15 (100.0%) | 0 (0.0%) |
| Graduate Degree | 0 (0.0%) | 0 (0.0%) |
| Total | 20 (100.0%) | 0 (0.0%) |
Income in Phillips County
Income Overview in Phillips County
Per Capita Income in Phillips County is $32,450, while median incomes of families and households are $73,692 and $61,250 respectively.
| Characteristic | Number | Measure |
| Per Capita Income | 4,233 | $32,450 |
| Median Family Income | 1,172 | $73,692 |
| Mean Family Income | 1,172 | $89,500 |
| Median Household Income | 1,749 | $61,250 |
| Mean Household Income | 1,749 | $75,183 |
| Income Deficit | 1,172 | $0 |
| Wage / Income Gap (%) | 4,233 | 32.20% |
| Wage / Income Gap ($) | 4,233 | 67.80¢ per $1 |
| Gini / Inequality Index | 4,233 | 0.40 |
Earnings by Sex in Phillips County
Average Earnings in Phillips County are $38,056, $45,522 for men and $30,864 for women, a difference of 32.2%.
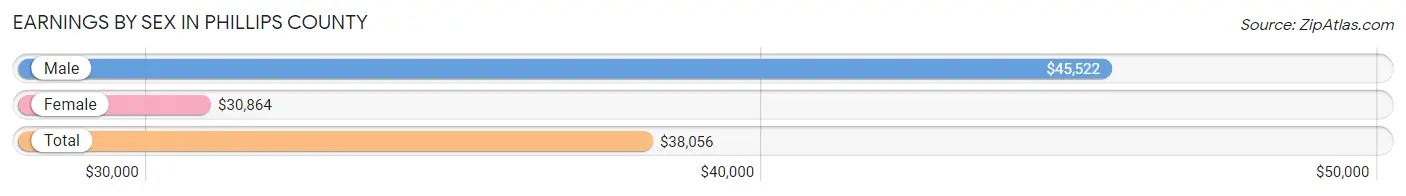
| Sex | Number | Average Earnings |
| Male | 1,228 (56.2%) | $45,522 |
| Female | 958 (43.8%) | $30,864 |
| Total | 2,186 (100.0%) | $38,056 |
Earnings by Sex by Income Bracket in Phillips County
The most common earnings brackets in Phillips County are $45,000 to $49,999 for men (146 | 11.9%) and $25,000 to $29,999 for women (119 | 12.4%).

| Income | Male | Female |
| $2,499 or less | 7 (0.6%) | 47 (4.9%) |
| $2,500 to $4,999 | 11 (0.9%) | 27 (2.8%) |
| $5,000 to $7,499 | 26 (2.1%) | 28 (2.9%) |
| $7,500 to $9,999 | 0 (0.0%) | 25 (2.6%) |
| $10,000 to $12,499 | 26 (2.1%) | 37 (3.9%) |
| $12,500 to $14,999 | 96 (7.8%) | 26 (2.7%) |
| $15,000 to $17,499 | 54 (4.4%) | 55 (5.7%) |
| $17,500 to $19,999 | 6 (0.5%) | 26 (2.7%) |
| $20,000 to $22,499 | 32 (2.6%) | 48 (5.0%) |
| $22,500 to $24,999 | 31 (2.5%) | 22 (2.3%) |
| $25,000 to $29,999 | 78 (6.4%) | 119 (12.4%) |
| $30,000 to $34,999 | 85 (6.9%) | 89 (9.3%) |
| $35,000 to $39,999 | 58 (4.7%) | 76 (7.9%) |
| $40,000 to $44,999 | 76 (6.2%) | 53 (5.5%) |
| $45,000 to $49,999 | 146 (11.9%) | 110 (11.5%) |
| $50,000 to $54,999 | 25 (2.0%) | 21 (2.2%) |
| $55,000 to $64,999 | 113 (9.2%) | 11 (1.1%) |
| $65,000 to $74,999 | 82 (6.7%) | 31 (3.2%) |
| $75,000 to $99,999 | 132 (10.7%) | 56 (5.9%) |
| $100,000+ | 144 (11.7%) | 51 (5.3%) |
| Total | 1,228 (100.0%) | 958 (100.0%) |
Earnings by Sex by Educational Attainment in Phillips County
Average earnings in Phillips County are $46,241 for men and $30,114 for women, a difference of 34.9%. Men with an educational attainment of bachelor's degree enjoy the highest average annual earnings of $56,964, while those with high school diploma education earn the least with $38,750. Women with an educational attainment of bachelor's degree earn the most with the average annual earnings of $39,583, while those with less than high school education have the smallest earnings of $12,717.

| Educational Attainment | Male Income | Female Income |
| Less than High School | $47,150 | $12,717 |
| High School Diploma | $38,750 | $25,474 |
| College or Associate's Degree | $44,183 | $29,850 |
| Bachelor's Degree | $56,964 | $39,583 |
| Graduate Degree | - | - |
| Total | $46,241 | $30,114 |
Family Income in Phillips County
Family Income Brackets in Phillips County
According to the Phillips County family income data, there are 282 families falling into the $100,000 to $149,999 income range, which is the most common income bracket and makes up 24.1% of all families.

| Income Bracket | # Families | % Families |
| Less than $10,000 | 0 | 0.0% |
| $10,000 to $14,999 | 18 | 1.5% |
| $15,000 to $24,999 | 55 | 4.7% |
| $25,000 to $34,999 | 71 | 6.1% |
| $35,000 to $49,999 | 197 | 16.8% |
| $50,000 to $74,999 | 279 | 23.8% |
| $75,000 to $99,999 | 154 | 13.1% |
| $100,000 to $149,999 | 282 | 24.1% |
| $150,000 to $199,999 | 81 | 6.9% |
| $200,000+ | 35 | 3.0% |
Family Income by Famaliy Size in Phillips County
5-person families (27 | 2.3%) account for the highest median family income in Phillips County with $250,001 per family, while 5-person families (27 | 2.3%) have the highest median income of $50,000 per family member.

| Income Bracket | # Families | Median Income |
| 2-Person Families | 735 (62.7%) | $71,533 |
| 3-Person Families | 203 (17.3%) | $72,721 |
| 4-Person Families | 128 (10.9%) | $125,484 |
| 5-Person Families | 27 (2.3%) | $250,001 |
| 6-Person Families | 50 (4.3%) | $123,611 |
| 7+ Person Families | 29 (2.5%) | $46,302 |
| Total | 1,172 (100.0%) | $73,692 |
Family Income by Number of Earners in Phillips County
The median family income in Phillips County is $73,692, with families comprising 3+ earners (32) having the highest median family income of $188,289, while families with no earners (207) have the lowest median family income of $54,063, accounting for 2.7% and 17.7% of families, respectively.

| Number of Earners | # Families | Median Income |
| No Earners | 207 (17.7%) | $54,063 |
| 1 Earner | 316 (27.0%) | $64,107 |
| 2 Earners | 617 (52.6%) | $104,476 |
| 3+ Earners | 32 (2.7%) | $188,289 |
| Total | 1,172 (100.0%) | $73,692 |
Household Income in Phillips County
Household Income Brackets in Phillips County
With 367 households falling in the category, the $50,000 to $74,999 income range is the most frequent in Phillips County, accounting for 21.0% of all households. In contrast, only 49 households (2.8%) fall into the less than $10,000 income bracket, making it the least populous group.
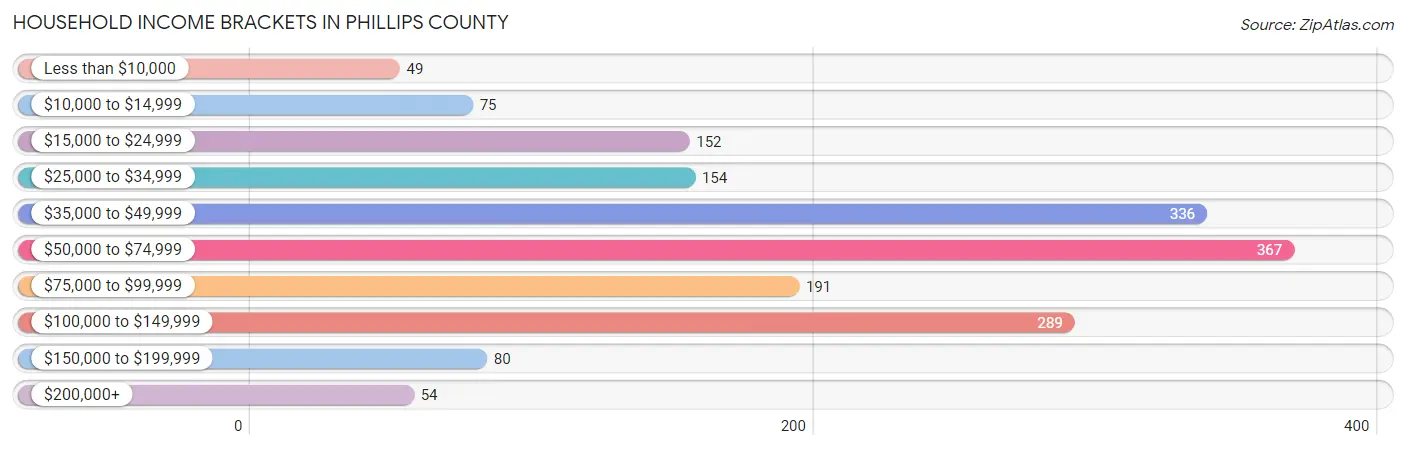
| Income Bracket | # Households | % Households |
| Less than $10,000 | 49 | 2.8% |
| $10,000 to $14,999 | 75 | 4.3% |
| $15,000 to $24,999 | 152 | 8.7% |
| $25,000 to $34,999 | 154 | 8.8% |
| $35,000 to $49,999 | 336 | 19.2% |
| $50,000 to $74,999 | 367 | 21.0% |
| $75,000 to $99,999 | 191 | 10.9% |
| $100,000 to $149,999 | 289 | 16.5% |
| $150,000 to $199,999 | 80 | 4.6% |
| $200,000+ | 54 | 3.1% |
Household Income by Householder Age in Phillips County
The median household income in Phillips County is $61,250, with the highest median household income of $105,202 found in the 15 to 24 years age bracket for the primary householder. A total of 57 households (3.3%) fall into this category. Meanwhile, the 65+ years age bracket for the primary householder has the lowest median household income of $48,316, with 590 households (33.7%) in this group.
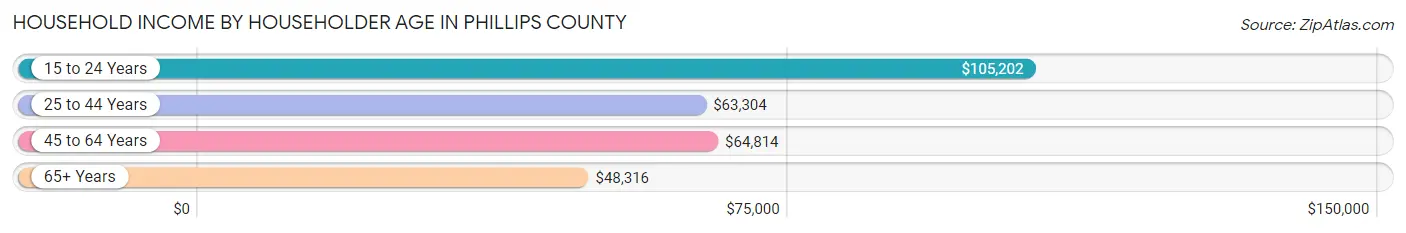
| Income Bracket | # Households | Median Income |
| 15 to 24 Years | 57 (3.3%) | $105,202 |
| 25 to 44 Years | 435 (24.9%) | $63,304 |
| 45 to 64 Years | 667 (38.1%) | $64,814 |
| 65+ Years | 590 (33.7%) | $48,316 |
| Total | 1,749 (100.0%) | $61,250 |
Poverty in Phillips County
Income Below Poverty by Sex and Age in Phillips County
With 6.6% poverty level for males and 7.4% for females among the residents of Phillips County, 18 to 24 year old males and under 5 year old females are the most vulnerable to poverty, with 26 males (20.3%) and 21 females (20.4%) in their respective age groups living below the poverty level.
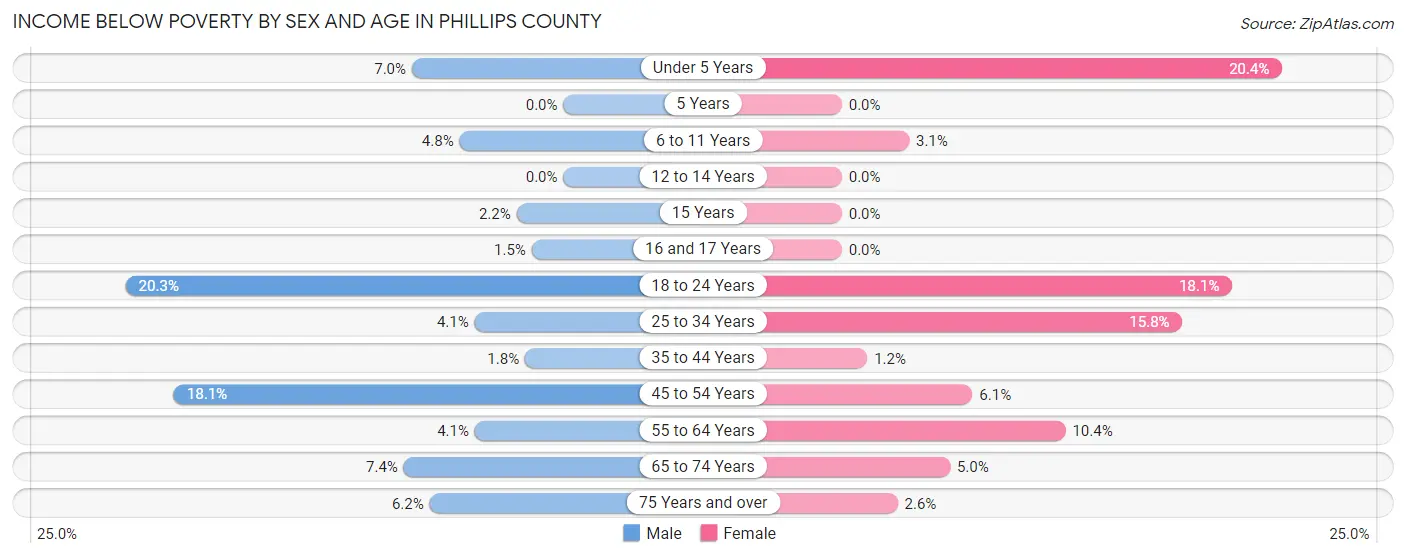
| Age Bracket | Male | Female |
| Under 5 Years | 9 (7.0%) | 21 (20.4%) |
| 5 Years | 0 (0.0%) | 0 (0.0%) |
| 6 to 11 Years | 8 (4.8%) | 6 (3.1%) |
| 12 to 14 Years | 0 (0.0%) | 0 (0.0%) |
| 15 Years | 2 (2.2%) | 0 (0.0%) |
| 16 and 17 Years | 1 (1.5%) | 0 (0.0%) |
| 18 to 24 Years | 26 (20.3%) | 15 (18.1%) |
| 25 to 34 Years | 7 (4.1%) | 29 (15.8%) |
| 35 to 44 Years | 5 (1.8%) | 3 (1.2%) |
| 45 to 54 Years | 43 (18.1%) | 10 (6.1%) |
| 55 to 64 Years | 15 (4.1%) | 41 (10.4%) |
| 65 to 74 Years | 20 (7.4%) | 13 (5.0%) |
| 75 Years and over | 10 (6.2%) | 6 (2.6%) |
| Total | 146 (6.6%) | 144 (7.4%) |
Income Above Poverty by Sex and Age in Phillips County
According to the poverty statistics in Phillips County, males aged 5 years and females aged 5 years are the age groups that are most secure financially, with 100.0% of males and 100.0% of females in these age groups living above the poverty line.

| Age Bracket | Male | Female |
| Under 5 Years | 119 (93.0%) | 82 (79.6%) |
| 5 Years | 48 (100.0%) | 25 (100.0%) |
| 6 to 11 Years | 158 (95.2%) | 186 (96.9%) |
| 12 to 14 Years | 114 (100.0%) | 37 (100.0%) |
| 15 Years | 90 (97.8%) | 16 (100.0%) |
| 16 and 17 Years | 67 (98.5%) | 0 (0.0%) |
| 18 to 24 Years | 102 (79.7%) | 68 (81.9%) |
| 25 to 34 Years | 163 (95.9%) | 155 (84.2%) |
| 35 to 44 Years | 276 (98.2%) | 251 (98.8%) |
| 45 to 54 Years | 195 (81.9%) | 155 (93.9%) |
| 55 to 64 Years | 350 (95.9%) | 354 (89.6%) |
| 65 to 74 Years | 250 (92.6%) | 246 (95.0%) |
| 75 Years and over | 151 (93.8%) | 226 (97.4%) |
| Total | 2,083 (93.4%) | 1,801 (92.6%) |
Income Below Poverty Among Married-Couple Families in Phillips County
The poverty statistics for married-couple families in Phillips County show that 2.4% or 23 of the total 967 families live below the poverty line. Families with 5 or more children have the highest poverty rate of 6.9%, comprising of 2 families. On the other hand, families with 1 or 2 children have the lowest poverty rate of 0.0%, which includes 0 families.

| Children | Above Poverty | Below Poverty |
| No Children | 597 (97.4%) | 16 (2.6%) |
| 1 or 2 Children | 250 (100.0%) | 0 (0.0%) |
| 3 or 4 Children | 70 (93.3%) | 5 (6.7%) |
| 5 or more Children | 27 (93.1%) | 2 (6.9%) |
| Total | 944 (97.6%) | 23 (2.4%) |
Income Below Poverty Among Single-Parent Households in Phillips County
According to the poverty data in Phillips County, 3.3% or 4 single-father households and 3.5% or 3 single-mother households are living below the poverty line. Among single-father households, those with 1 or 2 children have the highest poverty rate, with 3 households (4.0%) experiencing poverty. Likewise, among single-mother households, those with 1 or 2 children have the highest poverty rate, with 2 households (5.4%) falling below the poverty line.
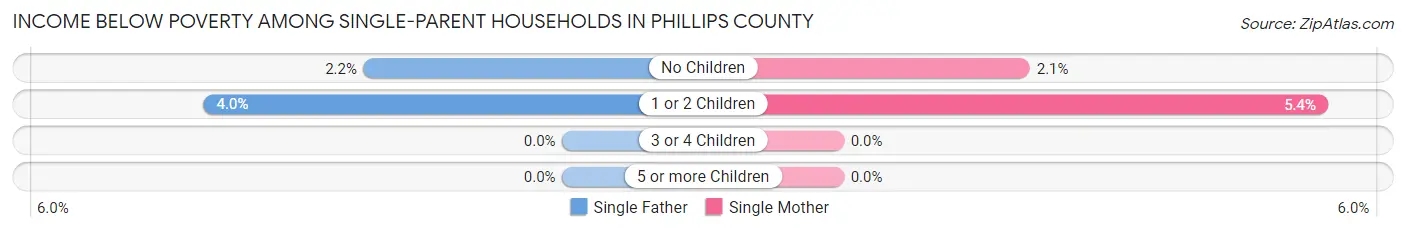
| Children | Single Father | Single Mother |
| No Children | 1 (2.2%) | 1 (2.1%) |
| 1 or 2 Children | 3 (4.0%) | 2 (5.4%) |
| 3 or 4 Children | 0 (0.0%) | 0 (0.0%) |
| 5 or more Children | 0 (0.0%) | 0 (0.0%) |
| Total | 4 (3.3%) | 3 (3.5%) |
Income Below Poverty Among Married-Couple vs Single-Parent Households in Phillips County
The poverty data for Phillips County shows that 23 of the married-couple family households (2.4%) and 7 of the single-parent households (3.4%) are living below the poverty level. Within the married-couple family households, those with 5 or more children have the highest poverty rate, with 2 households (6.9%) falling below the poverty line. Among the single-parent households, those with 1 or 2 children have the highest poverty rate, with 5 household (4.5%) living below poverty.
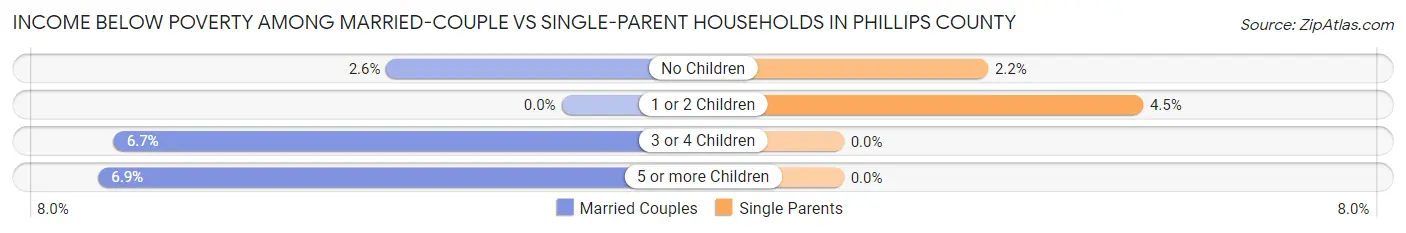
| Children | Married-Couple Families | Single-Parent Households |
| No Children | 16 (2.6%) | 2 (2.1%) |
| 1 or 2 Children | 0 (0.0%) | 5 (4.5%) |
| 3 or 4 Children | 5 (6.7%) | 0 (0.0%) |
| 5 or more Children | 2 (6.9%) | 0 (0.0%) |
| Total | 23 (2.4%) | 7 (3.4%) |
Employment Characteristics in Phillips County
Employment by Class of Employer in Phillips County
Among the 1,866 employed individuals in Phillips County, private company employees (982 | 52.6%), self-employed (not incorporated) (224 | 12.0%), and self-employed (incorporated) (181 | 9.7%) make up the most common classes of employment.

| Employer Class | # Employees | % Employees |
| Private Company Employees | 982 | 52.6% |
| Self-Employed (Incorporated) | 181 | 9.7% |
| Self-Employed (Not Incorporated) | 224 | 12.0% |
| Not-for-profit Organizations | 75 | 4.0% |
| Local Government Employees | 168 | 9.0% |
| State Government Employees | 102 | 5.5% |
| Federal Government Employees | 133 | 7.1% |
| Unpaid Family Workers | 1 | 0.1% |
| Total | 1,866 | 100.0% |
Employment Status by Age in Phillips County
According to the labor force statistics for Phillips County, out of the total population over 16 years of age (3,307), 60.4% or 1,997 individuals are in the labor force, with 3.4% or 68 of them unemployed. The age group with the highest labor force participation rate is 20 to 24 years, with 100.0% or 139 individuals in the labor force. Within the labor force, the 55 to 59 years age range has the highest percentage of unemployed individuals, with 13.4% or 41 of them being unemployed.
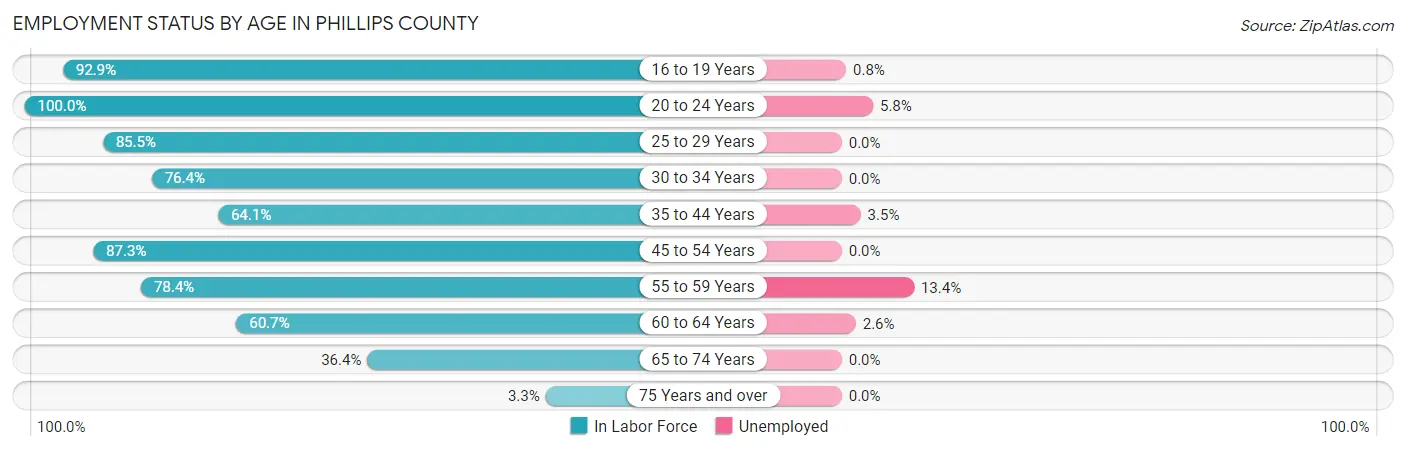
| Age Bracket | In Labor Force | Unemployed |
| 16 to 19 Years | 130 (92.9%) | 1 (0.8%) |
| 20 to 24 Years | 139 (100.0%) | 8 (5.8%) |
| 25 to 29 Years | 165 (85.5%) | 0 (0.0%) |
| 30 to 34 Years | 123 (76.4%) | 0 (0.0%) |
| 35 to 44 Years | 343 (64.1%) | 12 (3.5%) |
| 45 to 54 Years | 352 (87.3%) | 0 (0.0%) |
| 55 to 59 Years | 305 (78.4%) | 41 (13.4%) |
| 60 to 64 Years | 232 (60.7%) | 6 (2.6%) |
| 65 to 74 Years | 196 (36.4%) | 0 (0.0%) |
| 75 Years and over | 14 (3.3%) | 0 (0.0%) |
| Total | 1,997 (60.4%) | 68 (3.4%) |
Employment Status by Educational Attainment in Phillips County
According to labor force statistics for Phillips County, 73.7% of individuals (1,520) out of the total population between 25 and 64 years of age (2,063) are in the labor force, with 3.9% or 59 of them being unemployed. The group with the highest labor force participation rate are those with the educational attainment of bachelor's degree or higher, with 92.1% or 430 individuals in the labor force. Within the labor force, individuals with college / associate degree education have the highest percentage of unemployment, with 10.3% or 59 of them being unemployed.

| Educational Attainment | In Labor Force | Unemployed |
| Less than High School | 51 (83.6%) | 0 (0.0%) |
| High School Diploma | 468 (59.7%) | 0 (0.0%) |
| College / Associate Degree | 571 (76.0%) | 77 (10.3%) |
| Bachelor's Degree or higher | 430 (92.1%) | 0 (0.0%) |
| Total | 1,520 (73.7%) | 80 (3.9%) |
Employment Occupations by Sex in Phillips County
Management, Business, Science and Arts Occupations
The most common Management, Business, Science and Arts occupations in Phillips County are Management (279 | 14.4%), Health Diagnosing & Treating (149 | 7.7%), Community & Social Service (125 | 6.5%), Health Technologists (110 | 5.7%), and Education Instruction & Library (106 | 5.5%).

Management, Business, Science and Arts Occupations by Sex
Within the Management, Business, Science and Arts occupations in Phillips County, the most male-oriented occupations are Computers & Mathematics (100.0%), Education, Arts & Media (100.0%), and Management (68.8%), while the most female-oriented occupations are Life, Physical & Social Science (100.0%), Education Instruction & Library (84.0%), and Health Diagnosing & Treating (80.5%).
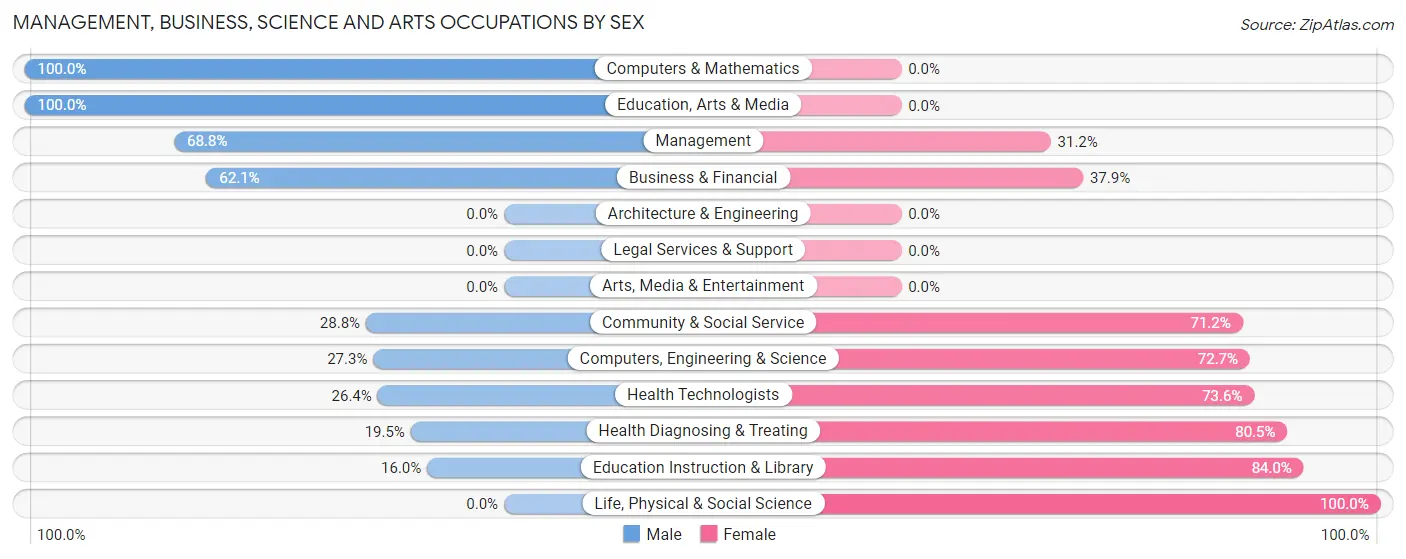
| Occupation | Male | Female |
| Management | 192 (68.8%) | 87 (31.2%) |
| Business & Financial | 18 (62.1%) | 11 (37.9%) |
| Computers, Engineering & Science | 9 (27.3%) | 24 (72.7%) |
| Computers & Mathematics | 9 (100.0%) | 0 (0.0%) |
| Architecture & Engineering | 0 (0.0%) | 0 (0.0%) |
| Life, Physical & Social Science | 0 (0.0%) | 24 (100.0%) |
| Community & Social Service | 36 (28.8%) | 89 (71.2%) |
| Education, Arts & Media | 19 (100.0%) | 0 (0.0%) |
| Legal Services & Support | 0 (0.0%) | 0 (0.0%) |
| Education Instruction & Library | 17 (16.0%) | 89 (84.0%) |
| Arts, Media & Entertainment | 0 (0.0%) | 0 (0.0%) |
| Health Diagnosing & Treating | 29 (19.5%) | 120 (80.5%) |
| Health Technologists | 29 (26.4%) | 81 (73.6%) |
| Total (Category) | 284 (46.2%) | 331 (53.8%) |
| Total (Overall) | 1,109 (57.4%) | 822 (42.6%) |
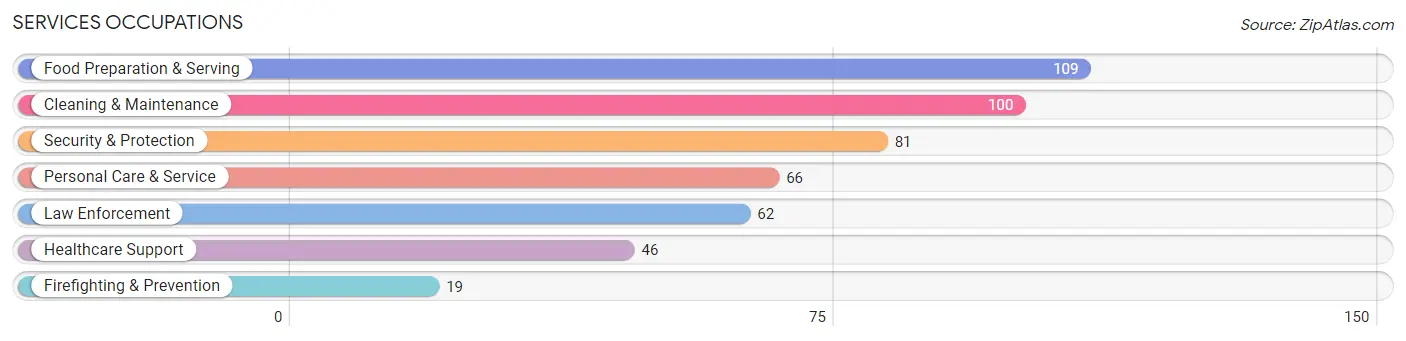
Services Occupations
The most common Services occupations in Phillips County are Food Preparation & Serving (109 | 5.6%), Cleaning & Maintenance (100 | 5.2%), Security & Protection (81 | 4.2%), Personal Care & Service (66 | 3.4%), and Law Enforcement (62 | 3.2%).
Services Occupations by Sex
Within the Services occupations in Phillips County, the most male-oriented occupations are Security & Protection (100.0%), Firefighting & Prevention (100.0%), and Law Enforcement (100.0%), while the most female-oriented occupations are Healthcare Support (100.0%), Food Preparation & Serving (85.3%), and Personal Care & Service (75.8%).
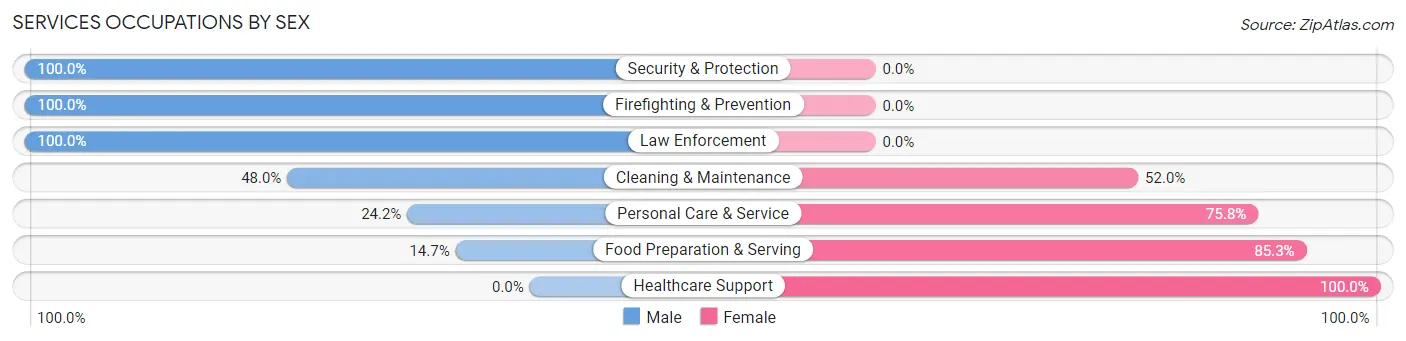
| Occupation | Male | Female |
| Healthcare Support | 0 (0.0%) | 46 (100.0%) |
| Security & Protection | 81 (100.0%) | 0 (0.0%) |
| Firefighting & Prevention | 19 (100.0%) | 0 (0.0%) |
| Law Enforcement | 62 (100.0%) | 0 (0.0%) |
| Food Preparation & Serving | 16 (14.7%) | 93 (85.3%) |
| Cleaning & Maintenance | 48 (48.0%) | 52 (52.0%) |
| Personal Care & Service | 16 (24.2%) | 50 (75.8%) |
| Total (Category) | 161 (40.1%) | 241 (60.0%) |
| Total (Overall) | 1,109 (57.4%) | 822 (42.6%) |
Sales and Office Occupations
The most common Sales and Office occupations in Phillips County are Office & Administration (207 | 10.7%), and Sales & Related (117 | 6.1%).
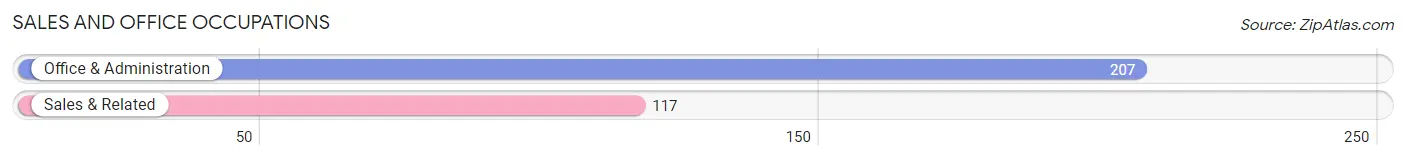
Sales and Office Occupations by Sex

| Occupation | Male | Female |
| Sales & Related | 40 (34.2%) | 77 (65.8%) |
| Office & Administration | 57 (27.5%) | 150 (72.5%) |
| Total (Category) | 97 (29.9%) | 227 (70.1%) |
| Total (Overall) | 1,109 (57.4%) | 822 (42.6%) |
Natural Resources, Construction and Maintenance Occupations
The most common Natural Resources, Construction and Maintenance occupations in Phillips County are Farming, Fishing & Forestry (214 | 11.1%), Construction & Extraction (99 | 5.1%), and Installation, Maintenance & Repair (90 | 4.7%).
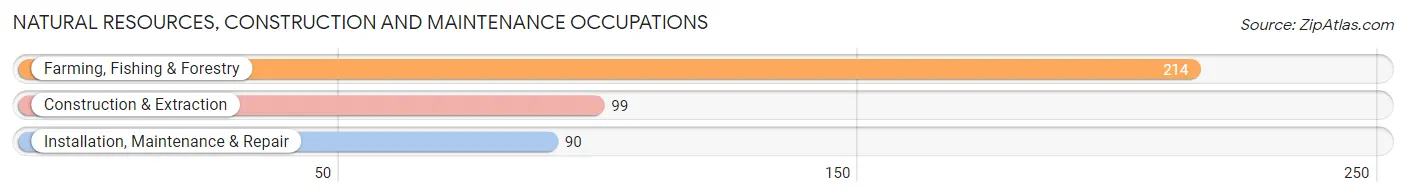
Natural Resources, Construction and Maintenance Occupations by Sex

| Occupation | Male | Female |
| Farming, Fishing & Forestry | 199 (93.0%) | 15 (7.0%) |
| Construction & Extraction | 99 (100.0%) | 0 (0.0%) |
| Installation, Maintenance & Repair | 90 (100.0%) | 0 (0.0%) |
| Total (Category) | 388 (96.3%) | 15 (3.7%) |
| Total (Overall) | 1,109 (57.4%) | 822 (42.6%) |
Production, Transportation and Moving Occupations
The most common Production, Transportation and Moving occupations in Phillips County are Transportation (124 | 6.4%), Material Moving (52 | 2.7%), and Production (11 | 0.6%).
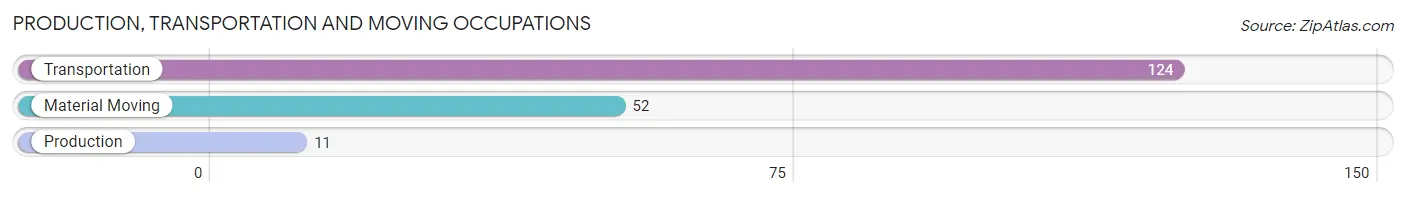
Production, Transportation and Moving Occupations by Sex
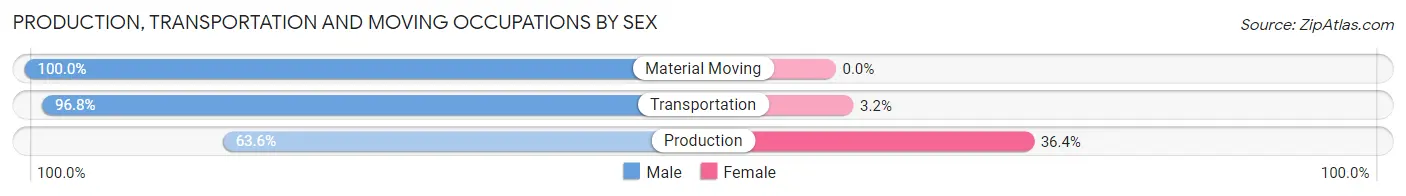
| Occupation | Male | Female |
| Production | 7 (63.6%) | 4 (36.4%) |
| Transportation | 120 (96.8%) | 4 (3.2%) |
| Material Moving | 52 (100.0%) | 0 (0.0%) |
| Total (Category) | 179 (95.7%) | 8 (4.3%) |
| Total (Overall) | 1,109 (57.4%) | 822 (42.6%) |
Employment Industries by Sex in Phillips County
Employment Industries in Phillips County
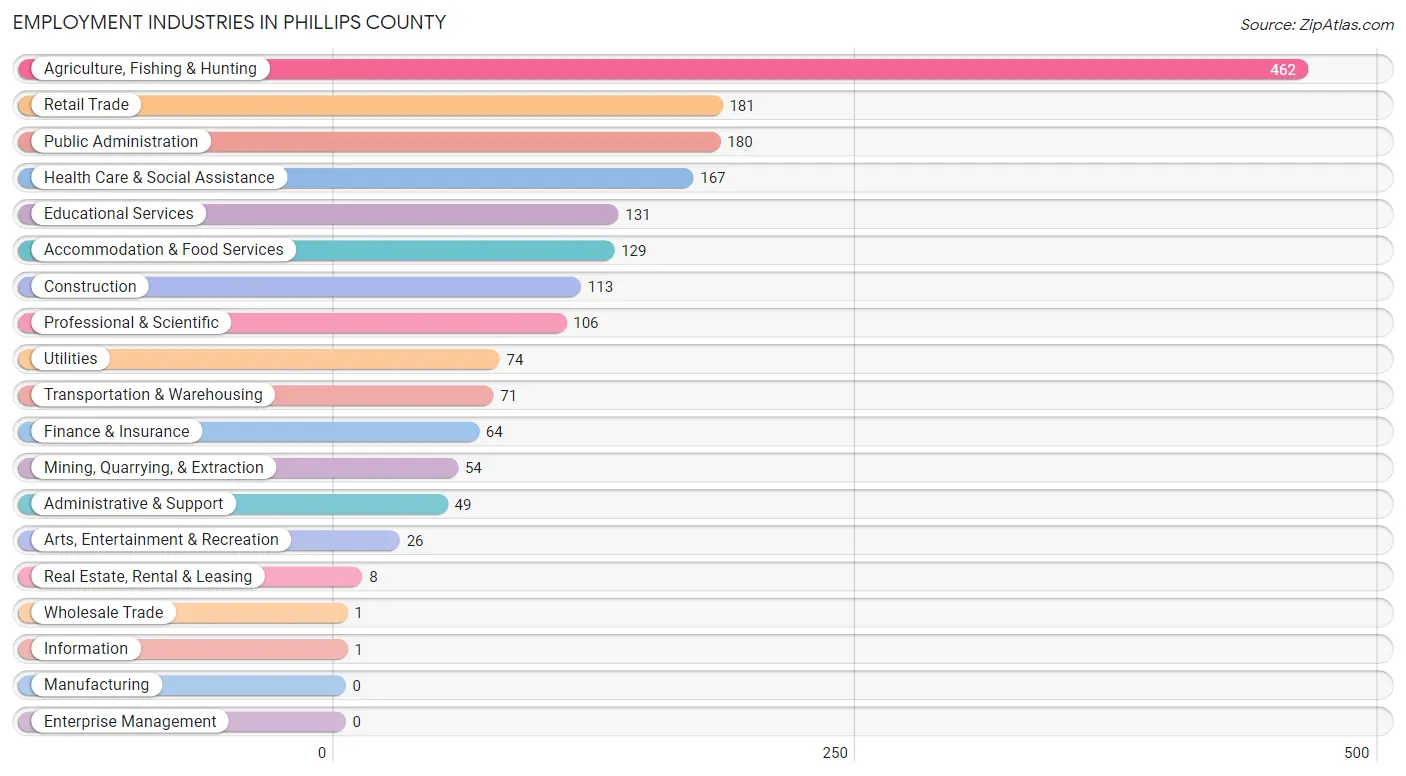
The major employment industries in Phillips County include Agriculture, Fishing & Hunting (462 | 23.9%), Retail Trade (181 | 9.4%), Public Administration (180 | 9.3%), Health Care & Social Assistance (167 | 8.6%), and Educational Services (131 | 6.8%).
Employment Industries by Sex in Phillips County
The Phillips County industries that see more men than women are Mining, Quarrying, & Extraction (100.0%), Construction (100.0%), and Wholesale Trade (100.0%), whereas the industries that tend to have a higher number of women are Information (100.0%), Real Estate, Rental & Leasing (100.0%), and Health Care & Social Assistance (100.0%).

| Industry | Male | Female |
| Agriculture, Fishing & Hunting | 374 (80.9%) | 88 (19.1%) |
| Mining, Quarrying, & Extraction | 54 (100.0%) | 0 (0.0%) |
| Construction | 113 (100.0%) | 0 (0.0%) |
| Manufacturing | 0 (0.0%) | 0 (0.0%) |
| Wholesale Trade | 1 (100.0%) | 0 (0.0%) |
| Retail Trade | 52 (28.7%) | 129 (71.3%) |
| Transportation & Warehousing | 66 (93.0%) | 5 (7.0%) |
| Utilities | 74 (100.0%) | 0 (0.0%) |
| Information | 0 (0.0%) | 1 (100.0%) |
| Finance & Insurance | 37 (57.8%) | 27 (42.2%) |
| Real Estate, Rental & Leasing | 0 (0.0%) | 8 (100.0%) |
| Professional & Scientific | 29 (27.4%) | 77 (72.6%) |
| Enterprise Management | 0 (0.0%) | 0 (0.0%) |
| Administrative & Support | 34 (69.4%) | 15 (30.6%) |
| Educational Services | 19 (14.5%) | 112 (85.5%) |
| Health Care & Social Assistance | 0 (0.0%) | 167 (100.0%) |
| Arts, Entertainment & Recreation | 0 (0.0%) | 26 (100.0%) |
| Accommodation & Food Services | 73 (56.6%) | 56 (43.4%) |
| Public Administration | 100 (55.6%) | 80 (44.4%) |
| Total | 1,109 (57.4%) | 822 (42.6%) |
Education in Phillips County
School Enrollment in Phillips County
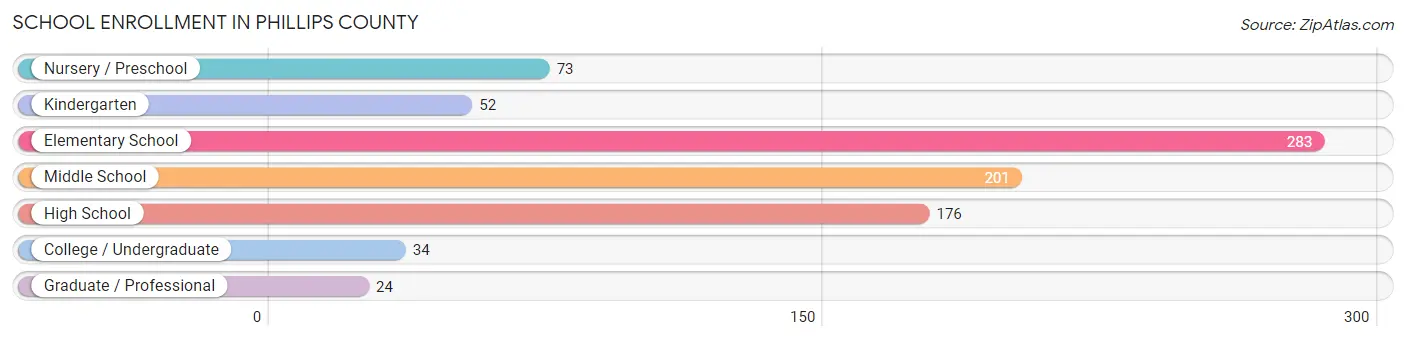
The most common levels of schooling among the 843 students in Phillips County are elementary school (283 | 33.6%), middle school (201 | 23.8%), and high school (176 | 20.9%).
| School Level | # Students | % Students |
| Nursery / Preschool | 73 | 8.7% |
| Kindergarten | 52 | 6.2% |
| Elementary School | 283 | 33.6% |
| Middle School | 201 | 23.8% |
| High School | 176 | 20.9% |
| College / Undergraduate | 34 | 4.0% |
| Graduate / Professional | 24 | 2.9% |
| Total | 843 | 100.0% |
School Enrollment by Age by Funding Source in Phillips County
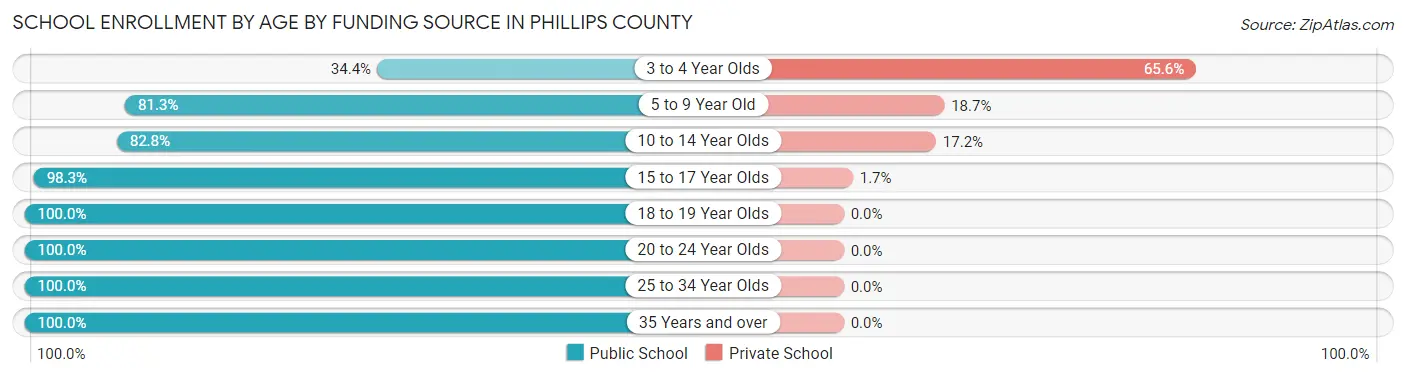
Out of a total of 843 students who are enrolled in schools in Phillips County, 128 (15.2%) attend a private institution, while the remaining 715 (84.8%) are enrolled in public schools. The age group of 3 to 4 year olds has the highest likelihood of being enrolled in private schools, with 21 (65.6% in the age bracket) enrolled. Conversely, the age group of 18 to 19 year olds has the lowest likelihood of being enrolled in a private school, with 3 (100.0% in the age bracket) attending a public institution.
| Age Bracket | Public School | Private School |
| 3 to 4 Year Olds | 11 (34.4%) | 21 (65.6%) |
| 5 to 9 Year Old | 256 (81.3%) | 59 (18.7%) |
| 10 to 14 Year Olds | 217 (82.8%) | 45 (17.2%) |
| 15 to 17 Year Olds | 173 (98.3%) | 3 (1.7%) |
| 18 to 19 Year Olds | 3 (100.0%) | 0 (0.0%) |
| 20 to 24 Year Olds | 4 (100.0%) | 0 (0.0%) |
| 25 to 34 Year Olds | 34 (100.0%) | 0 (0.0%) |
| 35 Years and over | 17 (100.0%) | 0 (0.0%) |
| Total | 715 (84.8%) | 128 (15.2%) |
Educational Attainment by Field of Study in Phillips County
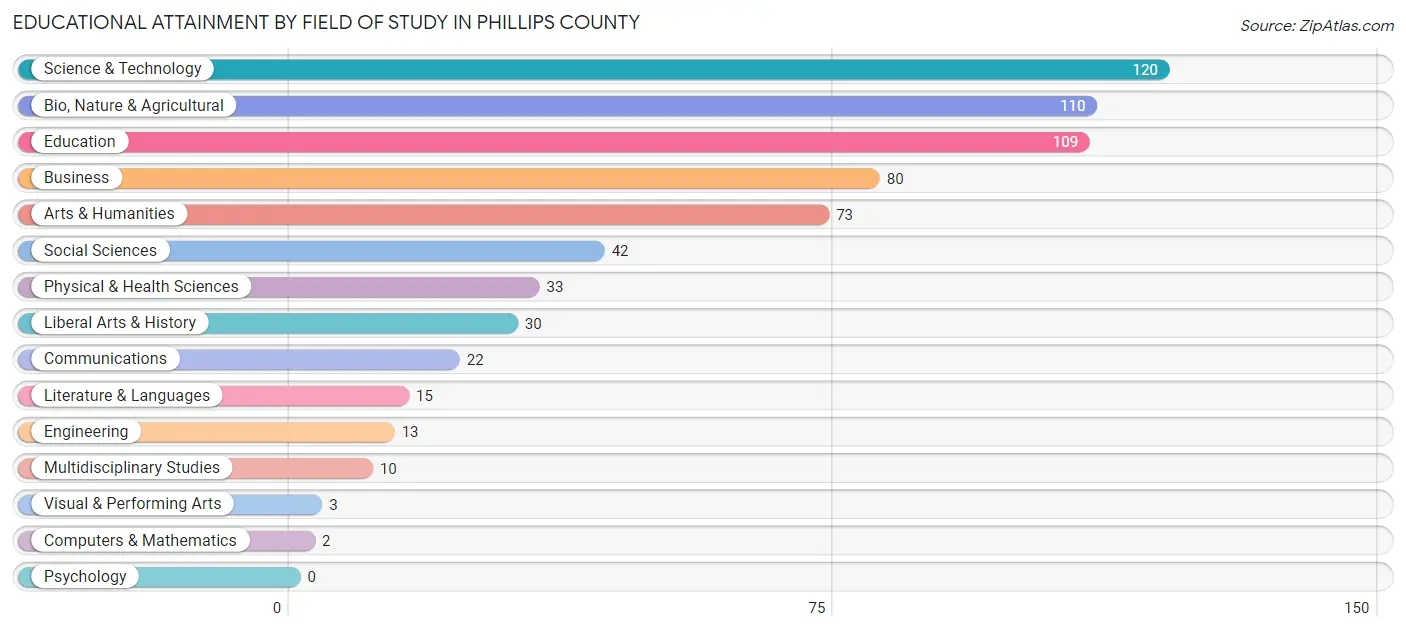
Science & technology (120 | 18.1%), bio, nature & agricultural (110 | 16.6%), education (109 | 16.5%), business (80 | 12.1%), and arts & humanities (73 | 11.0%) are the most common fields of study among 662 individuals in Phillips County who have obtained a bachelor's degree or higher.
| Field of Study | # Graduates | % Graduates |
| Computers & Mathematics | 2 | 0.3% |
| Bio, Nature & Agricultural | 110 | 16.6% |
| Physical & Health Sciences | 33 | 5.0% |
| Psychology | 0 | 0.0% |
| Social Sciences | 42 | 6.3% |
| Engineering | 13 | 2.0% |
| Multidisciplinary Studies | 10 | 1.5% |
| Science & Technology | 120 | 18.1% |
| Business | 80 | 12.1% |
| Education | 109 | 16.5% |
| Literature & Languages | 15 | 2.3% |
| Liberal Arts & History | 30 | 4.5% |
| Visual & Performing Arts | 3 | 0.4% |
| Communications | 22 | 3.3% |
| Arts & Humanities | 73 | 11.0% |
| Total | 662 | 100.0% |
Transportation & Commute in Phillips County
Vehicle Availability by Sex in Phillips County
The most prevalent vehicle ownership categories in Phillips County are males with 3 vehicles (309, accounting for 29.1%) and females with 3 vehicles (220, making up 40.3%).

| Vehicles Available | Male | Female |
| No Vehicle | 0 (0.0%) | 0 (0.0%) |
| 1 Vehicle | 108 (10.2%) | 150 (19.6%) |
| 2 Vehicles | 234 (22.1%) | 194 (25.3%) |
| 3 Vehicles | 309 (29.1%) | 220 (28.7%) |
| 4 Vehicles | 260 (24.5%) | 122 (15.9%) |
| 5 or more Vehicles | 150 (14.1%) | 80 (10.4%) |
| Total | 1,061 (100.0%) | 766 (100.0%) |
Commute Time in Phillips County
The most frequently occuring commute durations in Phillips County are 5 to 9 minutes (544 commuters, 34.6%), less than 5 minutes (350 commuters, 22.3%), and 10 to 14 minutes (245 commuters, 15.6%).

| Commute Time | # Commuters | % Commuters |
| Less than 5 Minutes | 350 | 22.3% |
| 5 to 9 Minutes | 544 | 34.6% |
| 10 to 14 Minutes | 245 | 15.6% |
| 15 to 19 Minutes | 109 | 6.9% |
| 20 to 24 Minutes | 36 | 2.3% |
| 25 to 29 Minutes | 35 | 2.2% |
| 30 to 34 Minutes | 69 | 4.4% |
| 35 to 39 Minutes | 24 | 1.5% |
| 40 to 44 Minutes | 14 | 0.9% |
| 45 to 59 Minutes | 51 | 3.3% |
| 60 to 89 Minutes | 54 | 3.4% |
| 90 or more Minutes | 40 | 2.5% |
Commute Time by Sex in Phillips County
The most common commute times in Phillips County are 5 to 9 minutes (313 commuters, 35.2%) for males and 5 to 9 minutes (231 commuters, 33.9%) for females.
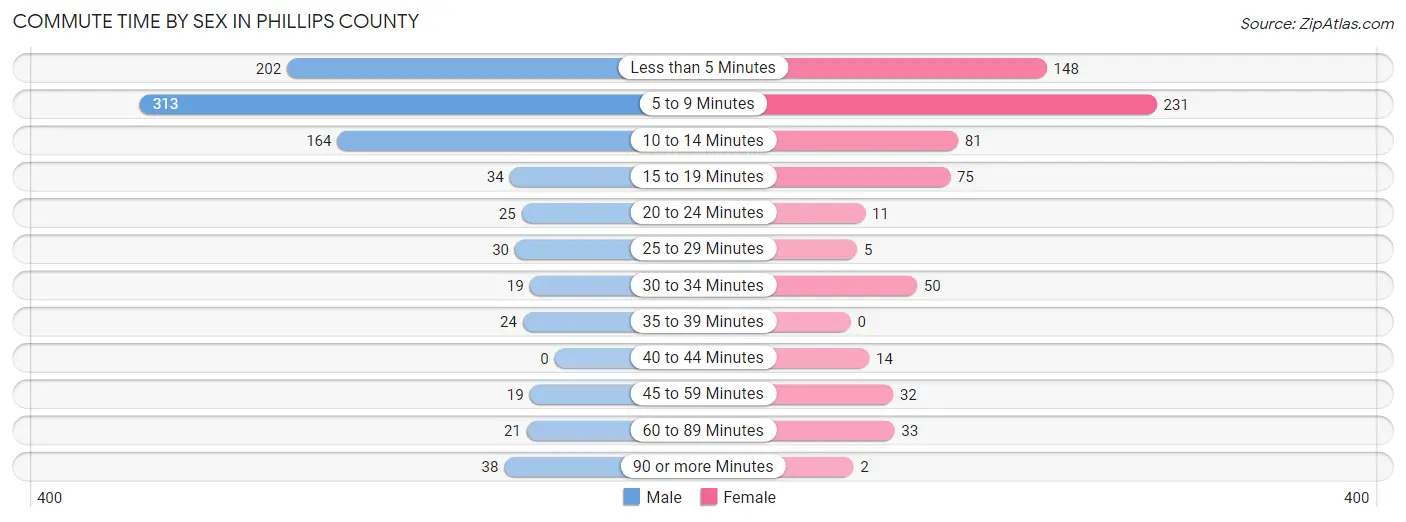
| Commute Time | Male | Female |
| Less than 5 Minutes | 202 (22.7%) | 148 (21.7%) |
| 5 to 9 Minutes | 313 (35.2%) | 231 (33.9%) |
| 10 to 14 Minutes | 164 (18.4%) | 81 (11.9%) |
| 15 to 19 Minutes | 34 (3.8%) | 75 (11.0%) |
| 20 to 24 Minutes | 25 (2.8%) | 11 (1.6%) |
| 25 to 29 Minutes | 30 (3.4%) | 5 (0.7%) |
| 30 to 34 Minutes | 19 (2.1%) | 50 (7.3%) |
| 35 to 39 Minutes | 24 (2.7%) | 0 (0.0%) |
| 40 to 44 Minutes | 0 (0.0%) | 14 (2.1%) |
| 45 to 59 Minutes | 19 (2.1%) | 32 (4.7%) |
| 60 to 89 Minutes | 21 (2.4%) | 33 (4.8%) |
| 90 or more Minutes | 38 (4.3%) | 2 (0.3%) |
Time of Departure to Work by Sex in Phillips County
The most frequent times of departure to work in Phillips County are 7:00 AM to 7:29 AM (223, 25.1%) for males and 7:30 AM to 7:59 AM (238, 34.9%) for females.
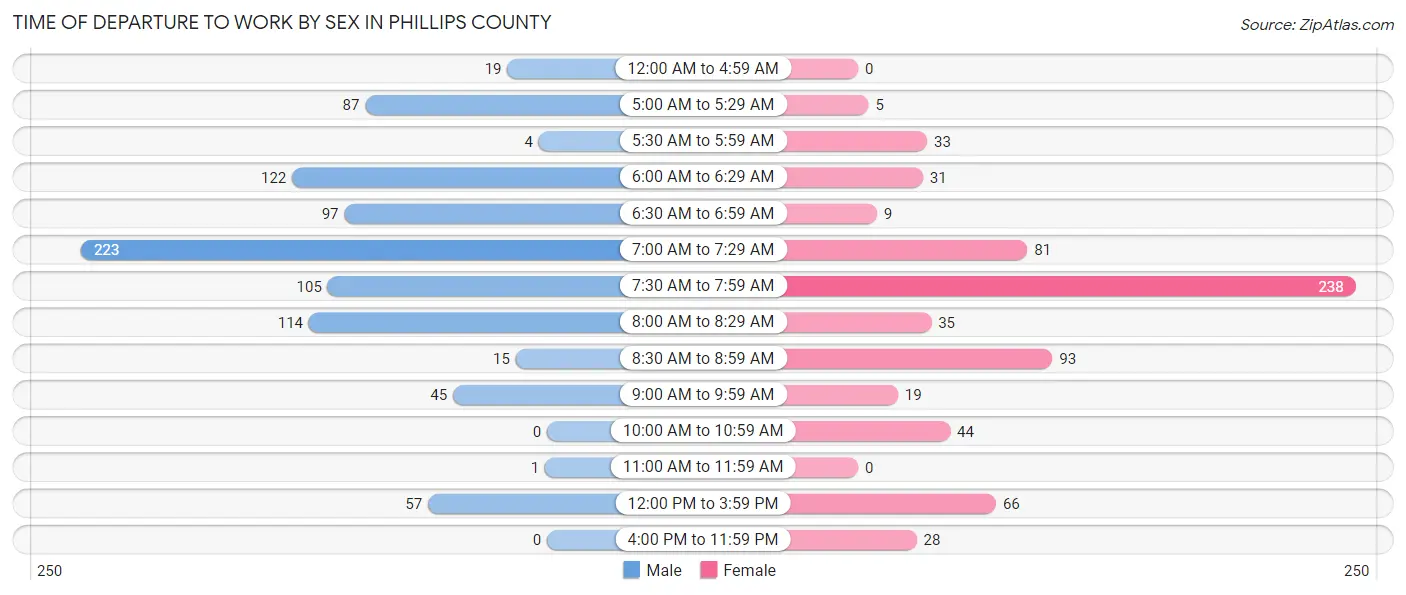
| Time of Departure | Male | Female |
| 12:00 AM to 4:59 AM | 19 (2.1%) | 0 (0.0%) |
| 5:00 AM to 5:29 AM | 87 (9.8%) | 5 (0.7%) |
| 5:30 AM to 5:59 AM | 4 (0.4%) | 33 (4.8%) |
| 6:00 AM to 6:29 AM | 122 (13.7%) | 31 (4.5%) |
| 6:30 AM to 6:59 AM | 97 (10.9%) | 9 (1.3%) |
| 7:00 AM to 7:29 AM | 223 (25.1%) | 81 (11.9%) |
| 7:30 AM to 7:59 AM | 105 (11.8%) | 238 (34.9%) |
| 8:00 AM to 8:29 AM | 114 (12.8%) | 35 (5.1%) |
| 8:30 AM to 8:59 AM | 15 (1.7%) | 93 (13.6%) |
| 9:00 AM to 9:59 AM | 45 (5.1%) | 19 (2.8%) |
| 10:00 AM to 10:59 AM | 0 (0.0%) | 44 (6.5%) |
| 11:00 AM to 11:59 AM | 1 (0.1%) | 0 (0.0%) |
| 12:00 PM to 3:59 PM | 57 (6.4%) | 66 (9.7%) |
| 4:00 PM to 11:59 PM | 0 (0.0%) | 28 (4.1%) |
| Total | 889 (100.0%) | 682 (100.0%) |
Housing Occupancy in Phillips County
Occupancy by Ownership in Phillips County
Of the total 1,749 dwellings in Phillips County, owner-occupied units account for 1,400 (80.0%), while renter-occupied units make up 349 (20.0%).
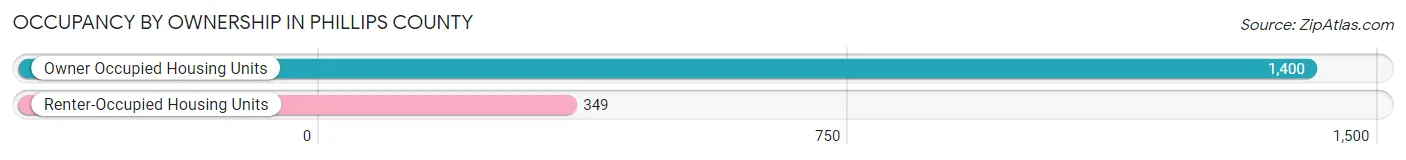
| Occupancy | # Housing Units | % Housing Units |
| Owner Occupied Housing Units | 1,400 | 80.0% |
| Renter-Occupied Housing Units | 349 | 20.0% |
| Total Occupied Housing Units | 1,749 | 100.0% |
Occupancy by Household Size in Phillips County

| Household Size | # Housing Units | % Housing Units |
| 1-Person Household | 534 | 30.5% |
| 2-Person Household | 756 | 43.2% |
| 3-Person Household | 223 | 12.8% |
| 4+ Person Household | 236 | 13.5% |
| Total Housing Units | 1,749 | 100.0% |
Occupancy by Ownership by Household Size in Phillips County
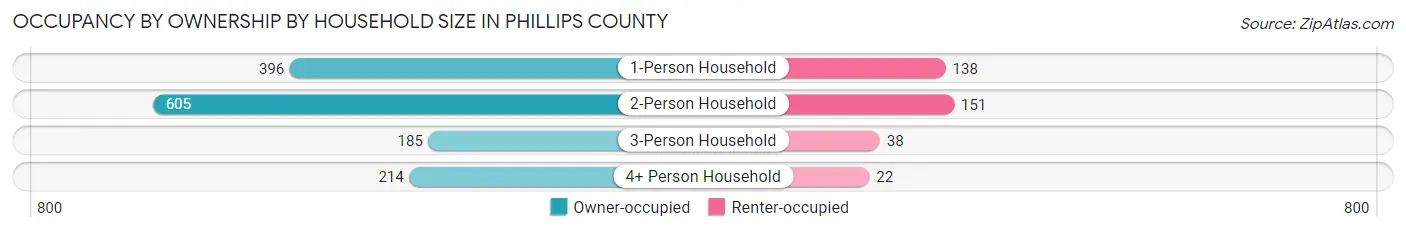
| Household Size | Owner-occupied | Renter-occupied |
| 1-Person Household | 396 (74.2%) | 138 (25.8%) |
| 2-Person Household | 605 (80.0%) | 151 (20.0%) |
| 3-Person Household | 185 (83.0%) | 38 (17.0%) |
| 4+ Person Household | 214 (90.7%) | 22 (9.3%) |
| Total Housing Units | 1,400 (80.0%) | 349 (20.0%) |
Occupancy by Educational Attainment in Phillips County

| Household Size | Owner-occupied | Renter-occupied |
| Less than High School | 59 (68.6%) | 27 (31.4%) |
| High School Diploma | 350 (72.2%) | 135 (27.8%) |
| College/Associate Degree | 715 (89.4%) | 85 (10.6%) |
| Bachelor's Degree or higher | 276 (73.0%) | 102 (27.0%) |
Occupancy by Age of Householder in Phillips County
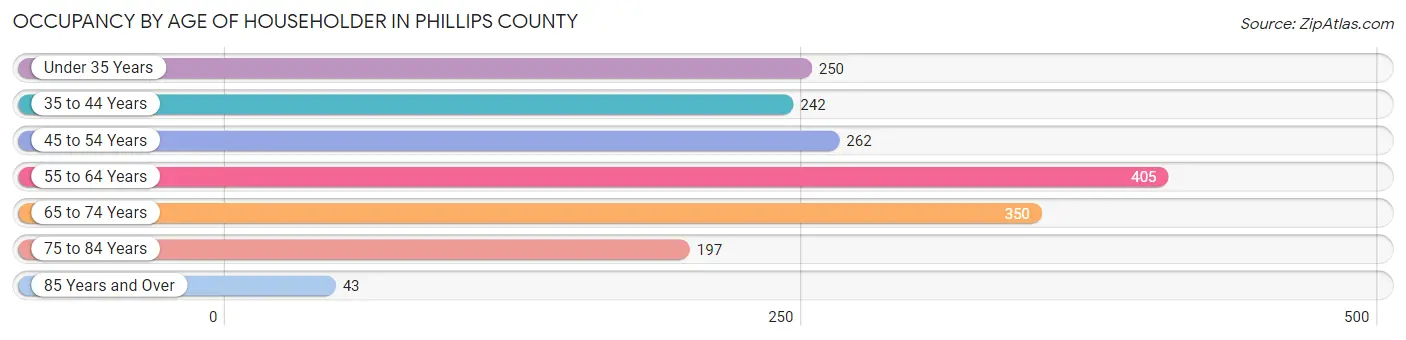
| Age Bracket | # Households | % Households |
| Under 35 Years | 250 | 14.3% |
| 35 to 44 Years | 242 | 13.8% |
| 45 to 54 Years | 262 | 15.0% |
| 55 to 64 Years | 405 | 23.2% |
| 65 to 74 Years | 350 | 20.0% |
| 75 to 84 Years | 197 | 11.3% |
| 85 Years and Over | 43 | 2.5% |
| Total | 1,749 | 100.0% |
Housing Finances in Phillips County
Median Income by Occupancy in Phillips County

| Occupancy Type | # Households | Median Income |
| Owner-Occupied | 1,400 (80.0%) | $63,431 |
| Renter-Occupied | 349 (20.0%) | $55,195 |
| Average | 1,749 (100.0%) | $61,250 |
Occupancy by Householder Income Bracket in Phillips County

| Income Bracket | Owner-occupied | Renter-occupied |
| Less than $5,000 | 23 (1.6%) | 0 (0.0%) |
| $5,000 to $9,999 | 2 (0.1%) | 24 (6.9%) |
| $10,000 to $14,999 | 48 (3.4%) | 28 (8.0%) |
| $15,000 to $19,999 | 73 (5.2%) | 1 (0.3%) |
| $20,000 to $24,999 | 59 (4.2%) | 20 (5.7%) |
| $25,000 to $34,999 | 87 (6.2%) | 67 (19.2%) |
| $35,000 to $49,999 | 306 (21.9%) | 29 (8.3%) |
| $50,000 to $74,999 | 280 (20.0%) | 87 (24.9%) |
| $75,000 to $99,999 | 178 (12.7%) | 13 (3.7%) |
| $100,000 to $149,999 | 273 (19.5%) | 15 (4.3%) |
| $150,000 or more | 71 (5.1%) | 65 (18.6%) |
| Total | 1,400 (100.0%) | 349 (100.0%) |
Monthly Housing Cost Tiers in Phillips County
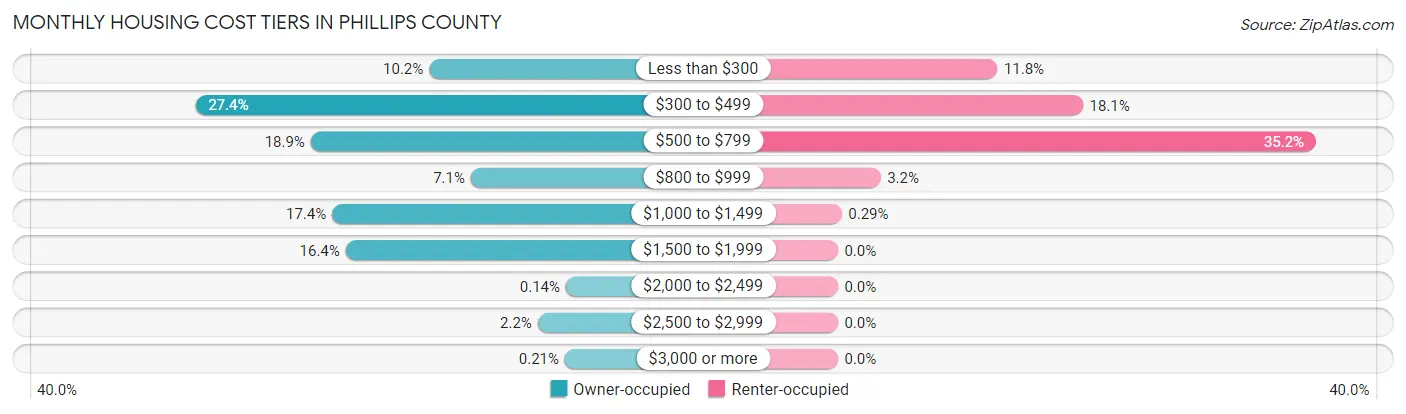
| Monthly Cost | Owner-occupied | Renter-occupied |
| Less than $300 | 143 (10.2%) | 41 (11.7%) |
| $300 to $499 | 384 (27.4%) | 63 (18.0%) |
| $500 to $799 | 265 (18.9%) | 123 (35.2%) |
| $800 to $999 | 100 (7.1%) | 11 (3.2%) |
| $1,000 to $1,499 | 243 (17.4%) | 1 (0.3%) |
| $1,500 to $1,999 | 229 (16.4%) | 0 (0.0%) |
| $2,000 to $2,499 | 2 (0.1%) | 0 (0.0%) |
| $2,500 to $2,999 | 31 (2.2%) | 0 (0.0%) |
| $3,000 or more | 3 (0.2%) | 0 (0.0%) |
| Total | 1,400 (100.0%) | 349 (100.0%) |
Physical Housing Characteristics in Phillips County
Housing Structures in Phillips County

| Structure Type | # Housing Units | % Housing Units |
| Single Unit, Detached | 1,437 | 82.2% |
| Single Unit, Attached | 18 | 1.0% |
| 2 Unit Apartments | 0 | 0.0% |
| 3 or 4 Unit Apartments | 41 | 2.3% |
| 5 to 9 Unit Apartments | 39 | 2.2% |
| 10 or more Apartments | 0 | 0.0% |
| Mobile Home / Other | 214 | 12.2% |
| Total | 1,749 | 100.0% |
Housing Structures by Occupancy in Phillips County
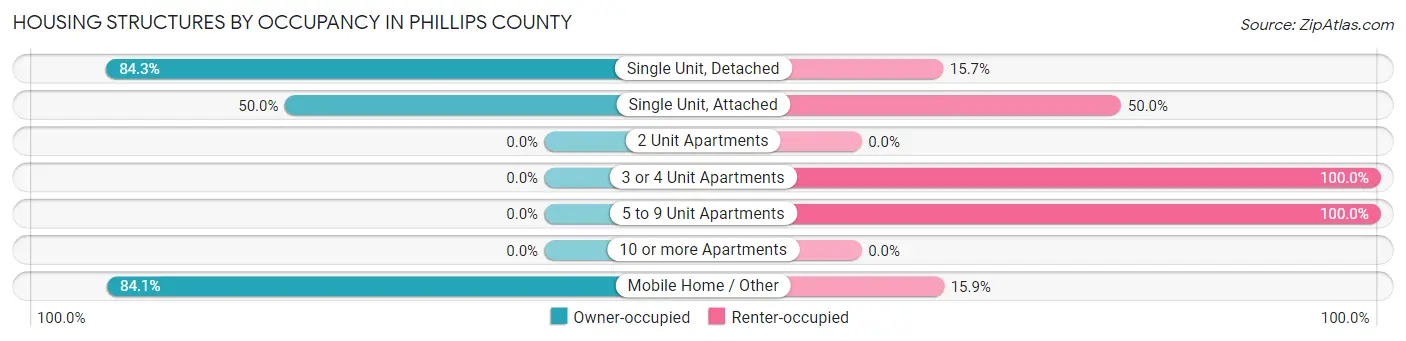
| Structure Type | Owner-occupied | Renter-occupied |
| Single Unit, Detached | 1,211 (84.3%) | 226 (15.7%) |
| Single Unit, Attached | 9 (50.0%) | 9 (50.0%) |
| 2 Unit Apartments | 0 (0.0%) | 0 (0.0%) |
| 3 or 4 Unit Apartments | 0 (0.0%) | 41 (100.0%) |
| 5 to 9 Unit Apartments | 0 (0.0%) | 39 (100.0%) |
| 10 or more Apartments | 0 (0.0%) | 0 (0.0%) |
| Mobile Home / Other | 180 (84.1%) | 34 (15.9%) |
| Total | 1,400 (80.0%) | 349 (20.0%) |
Housing Structures by Number of Rooms in Phillips County
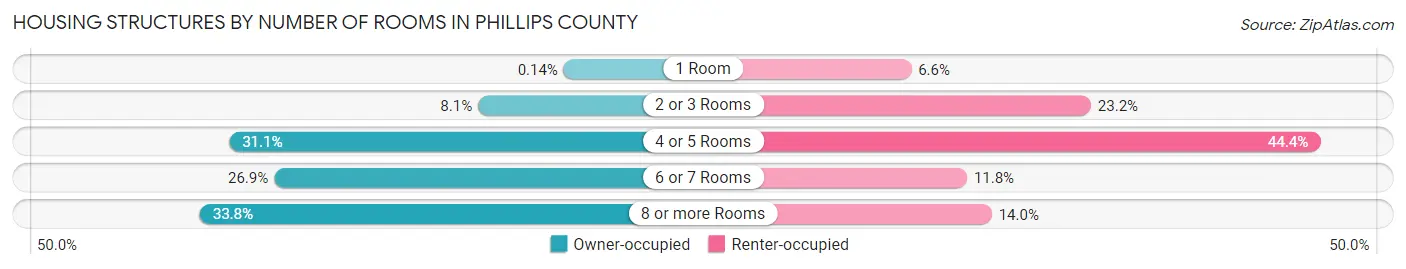
| Number of Rooms | Owner-occupied | Renter-occupied |
| 1 Room | 2 (0.1%) | 23 (6.6%) |
| 2 or 3 Rooms | 113 (8.1%) | 81 (23.2%) |
| 4 or 5 Rooms | 435 (31.1%) | 155 (44.4%) |
| 6 or 7 Rooms | 377 (26.9%) | 41 (11.7%) |
| 8 or more Rooms | 473 (33.8%) | 49 (14.0%) |
| Total | 1,400 (100.0%) | 349 (100.0%) |
Housing Structure by Heating Type in Phillips County

| Heating Type | Owner-occupied | Renter-occupied |
| Utility Gas | 838 (59.9%) | 193 (55.3%) |
| Bottled, Tank, or LP Gas | 349 (24.9%) | 38 (10.9%) |
| Electricity | 122 (8.7%) | 102 (29.2%) |
| Fuel Oil or Kerosene | 68 (4.9%) | 0 (0.0%) |
| Coal or Coke | 0 (0.0%) | 4 (1.1%) |
| All other Fuels | 23 (1.6%) | 12 (3.4%) |
| No Fuel Used | 0 (0.0%) | 0 (0.0%) |
| Total | 1,400 (100.0%) | 349 (100.0%) |
Household Vehicle Usage in Phillips County
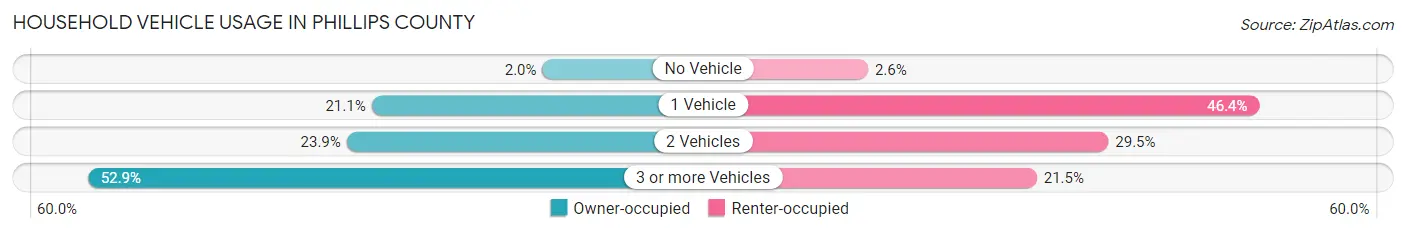
| Vehicles per Household | Owner-occupied | Renter-occupied |
| No Vehicle | 28 (2.0%) | 9 (2.6%) |
| 1 Vehicle | 296 (21.1%) | 162 (46.4%) |
| 2 Vehicles | 335 (23.9%) | 103 (29.5%) |
| 3 or more Vehicles | 741 (52.9%) | 75 (21.5%) |
| Total | 1,400 (100.0%) | 349 (100.0%) |
Real Estate & Mortgages in Phillips County
Real Estate and Mortgage Overview in Phillips County
| Characteristic | Without Mortgage | With Mortgage |
| Housing Units | 806 | 594 |
| Median Property Value | $158,300 | $192,300 |
| Median Household Income | $47,262 | $42 |
| Monthly Housing Costs | $439 | $3 |
| Real Estate Taxes | $1,184 | $3 |
Property Value by Mortgage Status in Phillips County
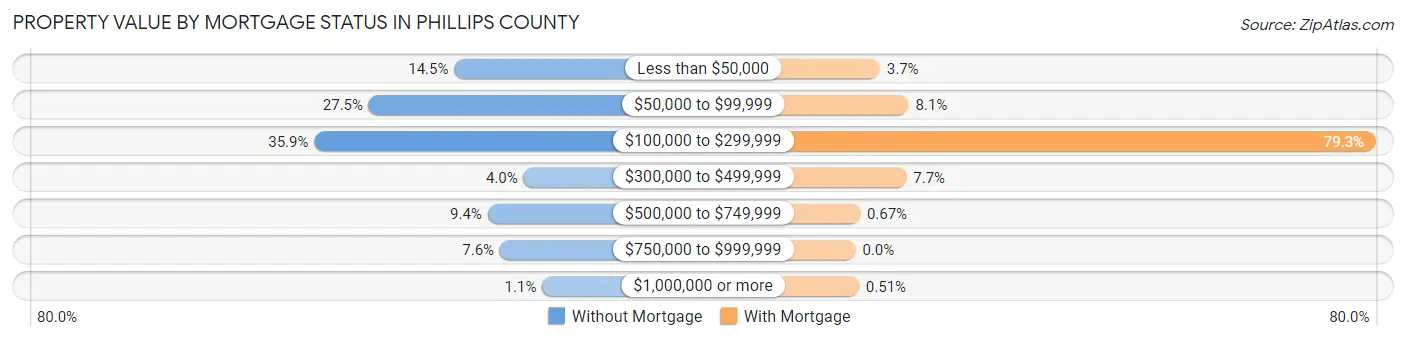
| Property Value | Without Mortgage | With Mortgage |
| Less than $50,000 | 117 (14.5%) | 22 (3.7%) |
| $50,000 to $99,999 | 222 (27.5%) | 48 (8.1%) |
| $100,000 to $299,999 | 289 (35.9%) | 471 (79.3%) |
| $300,000 to $499,999 | 32 (4.0%) | 46 (7.7%) |
| $500,000 to $749,999 | 76 (9.4%) | 4 (0.7%) |
| $750,000 to $999,999 | 61 (7.6%) | 0 (0.0%) |
| $1,000,000 or more | 9 (1.1%) | 3 (0.5%) |
| Total | 806 (100.0%) | 594 (100.0%) |
Household Income by Mortgage Status in Phillips County
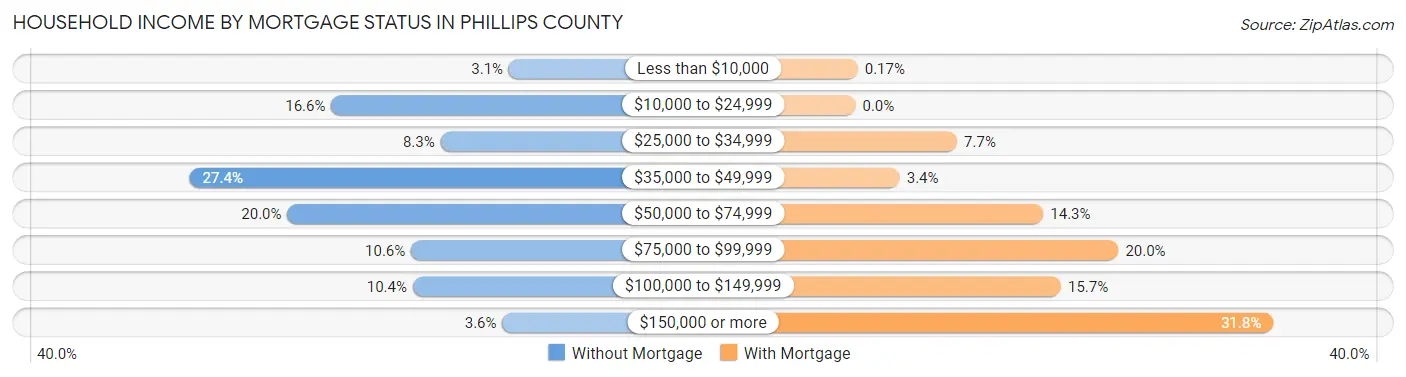
| Household Income | Without Mortgage | With Mortgage |
| Less than $10,000 | 25 (3.1%) | 1 (0.2%) |
| $10,000 to $24,999 | 134 (16.6%) | 0 (0.0%) |
| $25,000 to $34,999 | 67 (8.3%) | 46 (7.7%) |
| $35,000 to $49,999 | 221 (27.4%) | 20 (3.4%) |
| $50,000 to $74,999 | 161 (20.0%) | 85 (14.3%) |
| $75,000 to $99,999 | 85 (10.5%) | 119 (20.0%) |
| $100,000 to $149,999 | 84 (10.4%) | 93 (15.7%) |
| $150,000 or more | 29 (3.6%) | 189 (31.8%) |
| Total | 806 (100.0%) | 594 (100.0%) |
Property Value to Household Income Ratio in Phillips County
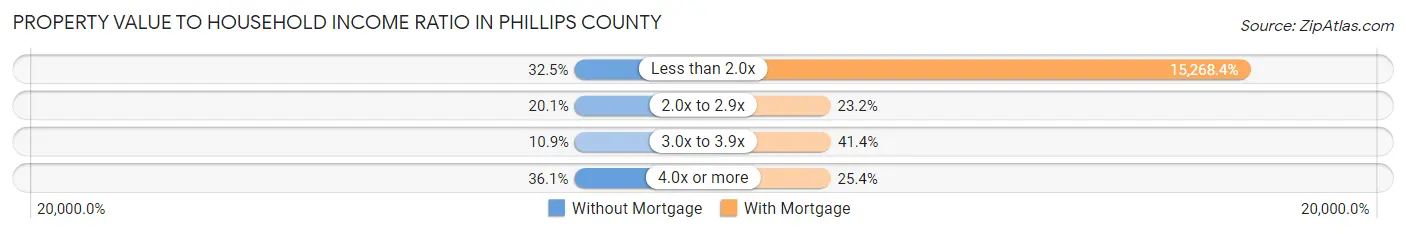
| Value-to-Income Ratio | Without Mortgage | With Mortgage |
| Less than 2.0x | 262 (32.5%) | 90,694 (15,268.4%) |
| 2.0x to 2.9x | 162 (20.1%) | 138 (23.2%) |
| 3.0x to 3.9x | 88 (10.9%) | 246 (41.4%) |
| 4.0x or more | 291 (36.1%) | 151 (25.4%) |
| Total | 806 (100.0%) | 594 (100.0%) |
Real Estate Taxes by Mortgage Status in Phillips County
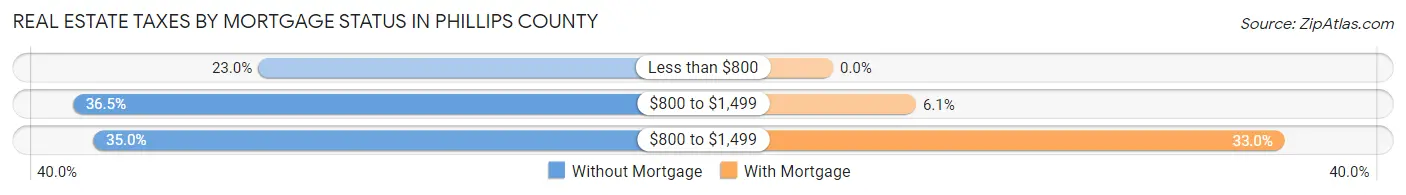
| Property Taxes | Without Mortgage | With Mortgage |
| Less than $800 | 185 (23.0%) | 0 (0.0%) |
| $800 to $1,499 | 294 (36.5%) | 36 (6.1%) |
| $800 to $1,499 | 282 (35.0%) | 196 (33.0%) |
| Total | 806 (100.0%) | 594 (100.0%) |
Health & Disability in Phillips County
Health Insurance Coverage by Age in Phillips County
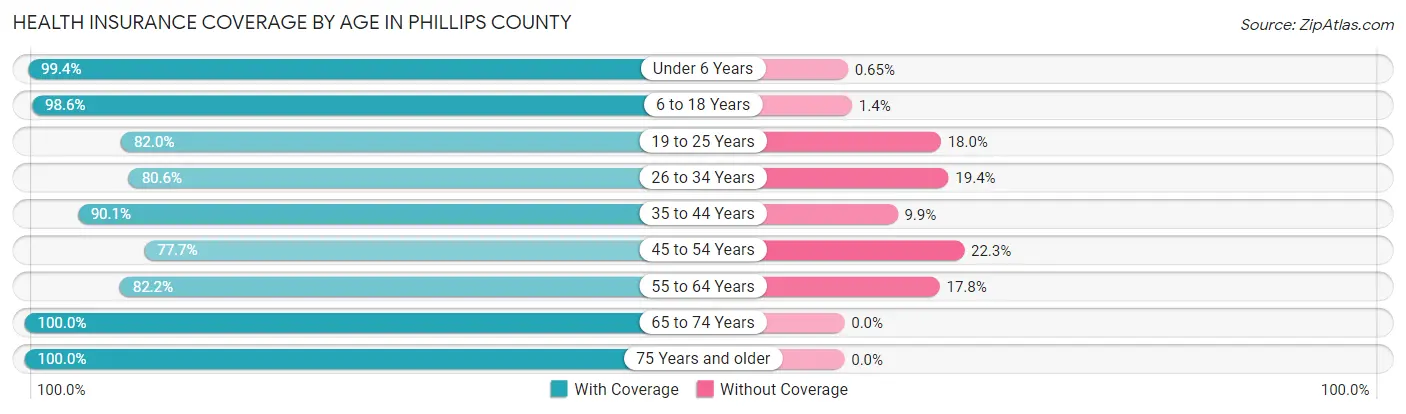
| Age Bracket | With Coverage | Without Coverage |
| Under 6 Years | 307 (99.4%) | 2 (0.6%) |
| 6 to 18 Years | 695 (98.6%) | 10 (1.4%) |
| 19 to 25 Years | 219 (82.0%) | 48 (18.0%) |
| 26 to 34 Years | 224 (80.6%) | 54 (19.4%) |
| 35 to 44 Years | 482 (90.1%) | 53 (9.9%) |
| 45 to 54 Years | 313 (77.7%) | 90 (22.3%) |
| 55 to 64 Years | 625 (82.2%) | 135 (17.8%) |
| 65 to 74 Years | 529 (100.0%) | 0 (0.0%) |
| 75 Years and older | 393 (100.0%) | 0 (0.0%) |
| Total | 3,787 (90.6%) | 392 (9.4%) |
Health Insurance Coverage by Citizenship Status in Phillips County
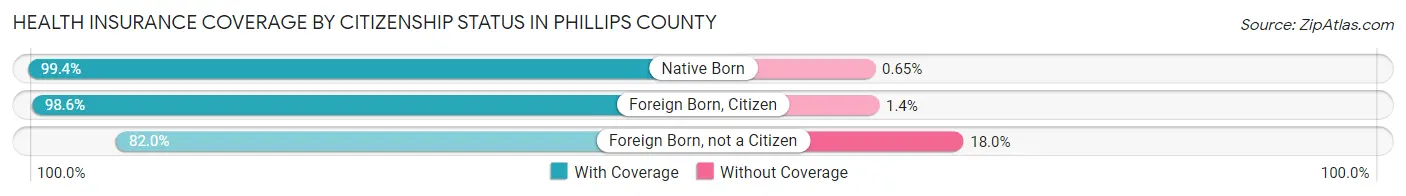
| Citizenship Status | With Coverage | Without Coverage |
| Native Born | 307 (99.4%) | 2 (0.6%) |
| Foreign Born, Citizen | 695 (98.6%) | 10 (1.4%) |
| Foreign Born, not a Citizen | 219 (82.0%) | 48 (18.0%) |
Health Insurance Coverage by Household Income in Phillips County
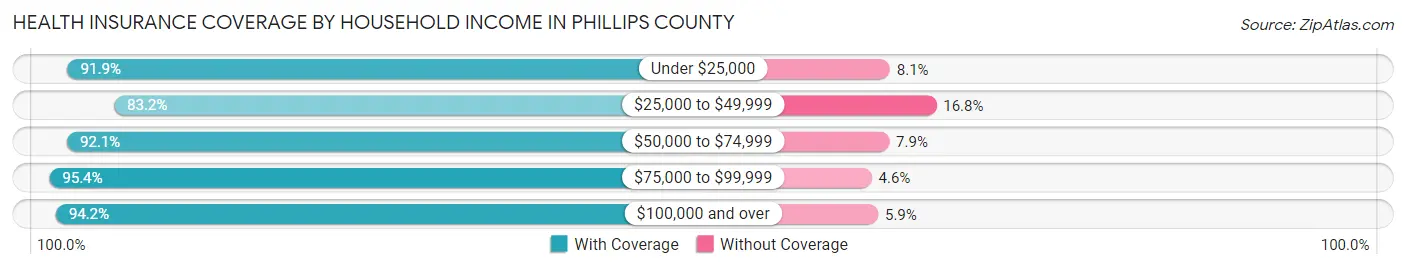
| Household Income | With Coverage | Without Coverage |
| Under $25,000 | 353 (91.9%) | 31 (8.1%) |
| $25,000 to $49,999 | 988 (83.2%) | 199 (16.8%) |
| $50,000 to $74,999 | 777 (92.1%) | 67 (7.9%) |
| $75,000 to $99,999 | 452 (95.4%) | 22 (4.6%) |
| $100,000 and over | 1,175 (94.2%) | 73 (5.9%) |
Public vs Private Health Insurance Coverage by Age in Phillips County
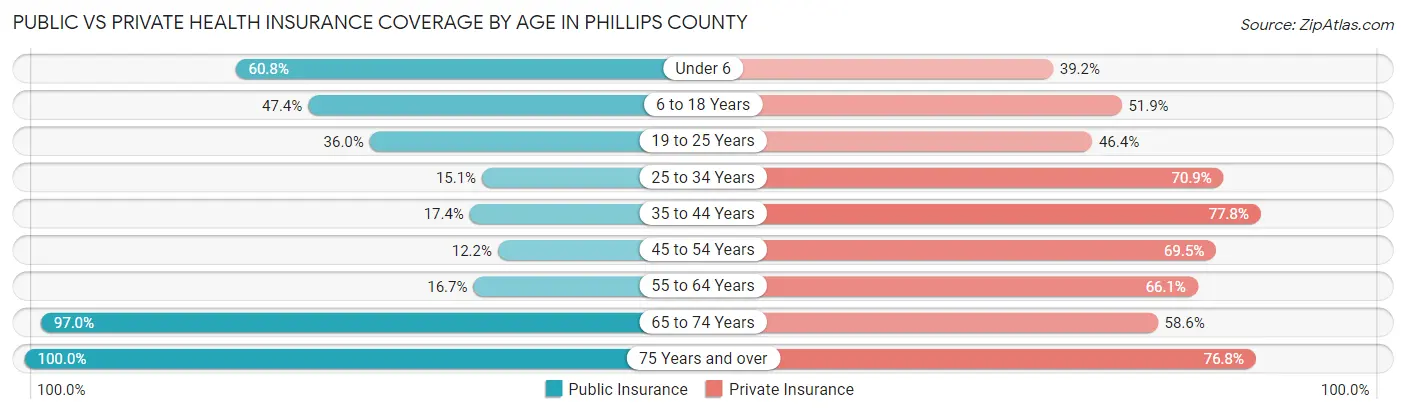
| Age Bracket | Public Insurance | Private Insurance |
| Under 6 | 188 (60.8%) | 121 (39.2%) |
| 6 to 18 Years | 334 (47.4%) | 366 (51.9%) |
| 19 to 25 Years | 96 (36.0%) | 124 (46.4%) |
| 25 to 34 Years | 42 (15.1%) | 197 (70.9%) |
| 35 to 44 Years | 93 (17.4%) | 416 (77.8%) |
| 45 to 54 Years | 49 (12.2%) | 280 (69.5%) |
| 55 to 64 Years | 127 (16.7%) | 502 (66.0%) |
| 65 to 74 Years | 513 (97.0%) | 310 (58.6%) |
| 75 Years and over | 393 (100.0%) | 302 (76.8%) |
| Total | 1,835 (43.9%) | 2,618 (62.6%) |
Disability Status by Sex by Age in Phillips County

| Age Bracket | Male | Female |
| Under 5 Years | 0 (0.0%) | 0 (0.0%) |
| 5 to 17 Years | 3 (0.6%) | 19 (6.9%) |
| 18 to 34 Years | 41 (13.8%) | 4 (1.5%) |
| 35 to 64 Years | 127 (14.4%) | 106 (13.0%) |
| 65 to 74 Years | 89 (33.0%) | 76 (29.3%) |
| 75 Years and over | 86 (53.4%) | 99 (42.7%) |
Disability Class by Sex by Age in Phillips County
Disability Class: Hearing Difficulty
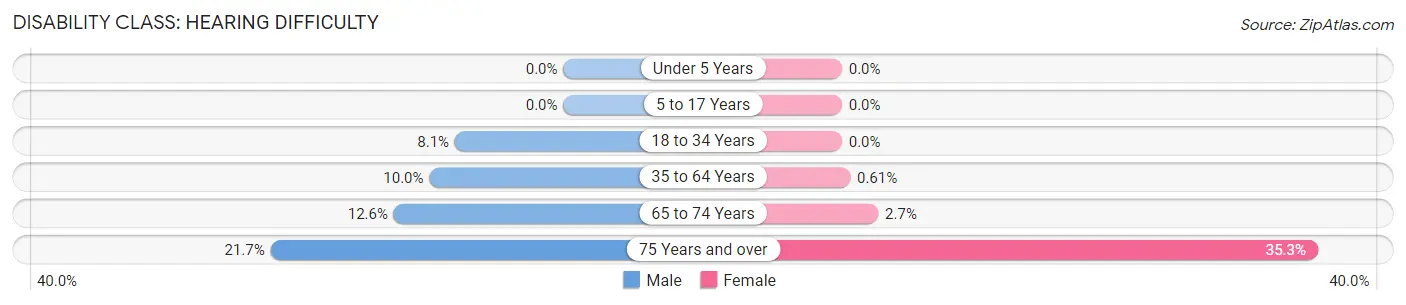
| Age Bracket | Male | Female |
| Under 5 Years | 0 (0.0%) | 0 (0.0%) |
| 5 to 17 Years | 0 (0.0%) | 0 (0.0%) |
| 18 to 34 Years | 24 (8.1%) | 0 (0.0%) |
| 35 to 64 Years | 88 (10.0%) | 5 (0.6%) |
| 65 to 74 Years | 34 (12.6%) | 7 (2.7%) |
| 75 Years and over | 35 (21.7%) | 82 (35.3%) |
Disability Class: Vision Difficulty
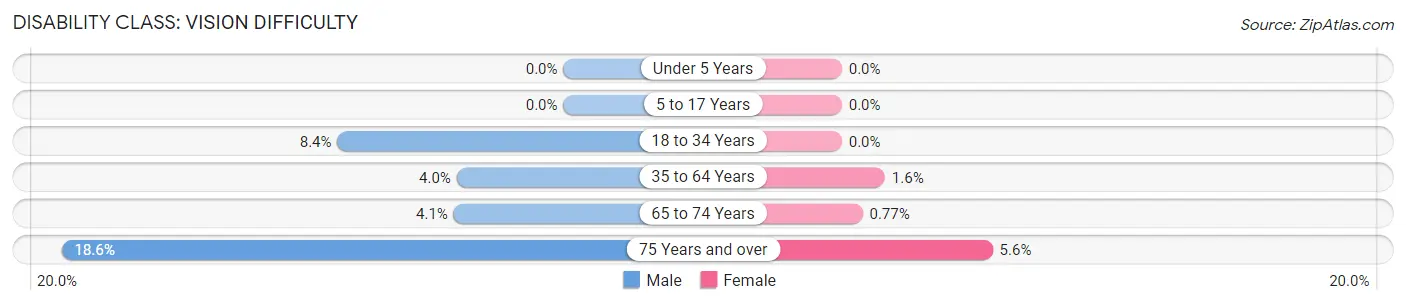
| Age Bracket | Male | Female |
| Under 5 Years | 0 (0.0%) | 0 (0.0%) |
| 5 to 17 Years | 0 (0.0%) | 0 (0.0%) |
| 18 to 34 Years | 25 (8.4%) | 0 (0.0%) |
| 35 to 64 Years | 35 (4.0%) | 13 (1.6%) |
| 65 to 74 Years | 11 (4.1%) | 2 (0.8%) |
| 75 Years and over | 30 (18.6%) | 13 (5.6%) |
Disability Class: Cognitive Difficulty
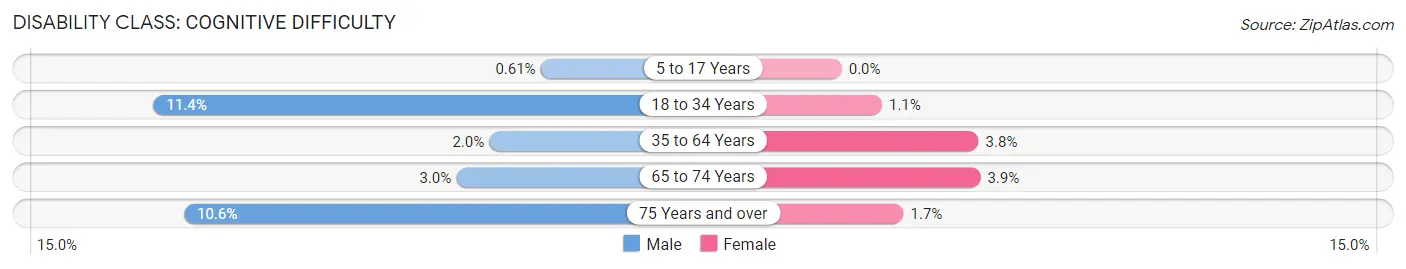
| Age Bracket | Male | Female |
| 5 to 17 Years | 3 (0.6%) | 0 (0.0%) |
| 18 to 34 Years | 34 (11.4%) | 3 (1.1%) |
| 35 to 64 Years | 18 (2.0%) | 31 (3.8%) |
| 65 to 74 Years | 8 (3.0%) | 10 (3.9%) |
| 75 Years and over | 17 (10.6%) | 4 (1.7%) |
Disability Class: Ambulatory Difficulty
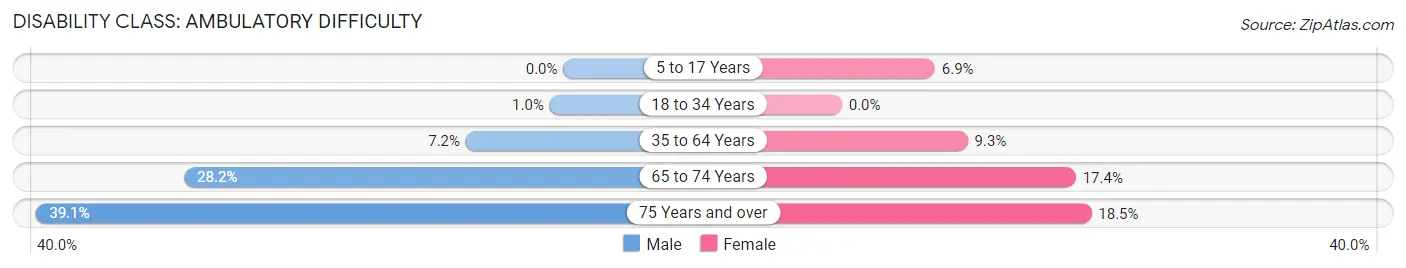
| Age Bracket | Male | Female |
| 5 to 17 Years | 0 (0.0%) | 19 (6.9%) |
| 18 to 34 Years | 3 (1.0%) | 0 (0.0%) |
| 35 to 64 Years | 64 (7.2%) | 76 (9.3%) |
| 65 to 74 Years | 76 (28.1%) | 45 (17.4%) |
| 75 Years and over | 63 (39.1%) | 43 (18.5%) |
Disability Class: Self-Care Difficulty
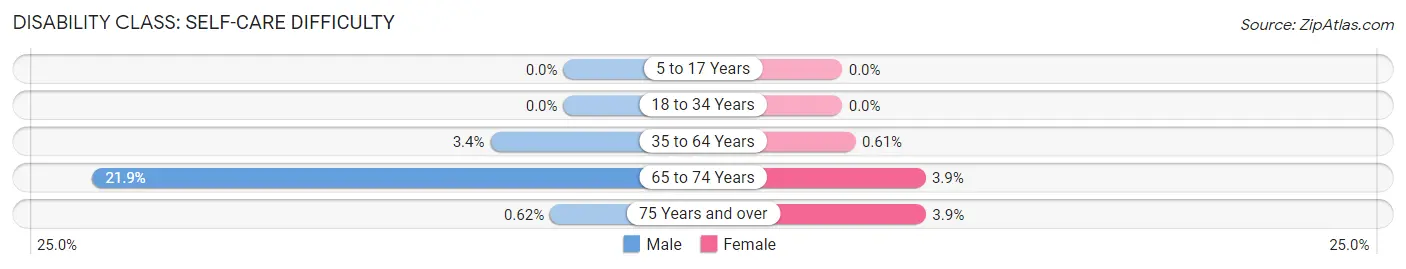
| Age Bracket | Male | Female |
| 5 to 17 Years | 0 (0.0%) | 0 (0.0%) |
| 18 to 34 Years | 0 (0.0%) | 0 (0.0%) |
| 35 to 64 Years | 30 (3.4%) | 5 (0.6%) |
| 65 to 74 Years | 59 (21.8%) | 10 (3.9%) |
| 75 Years and over | 1 (0.6%) | 9 (3.9%) |
Technology Access in Phillips County
Computing Device Access in Phillips County
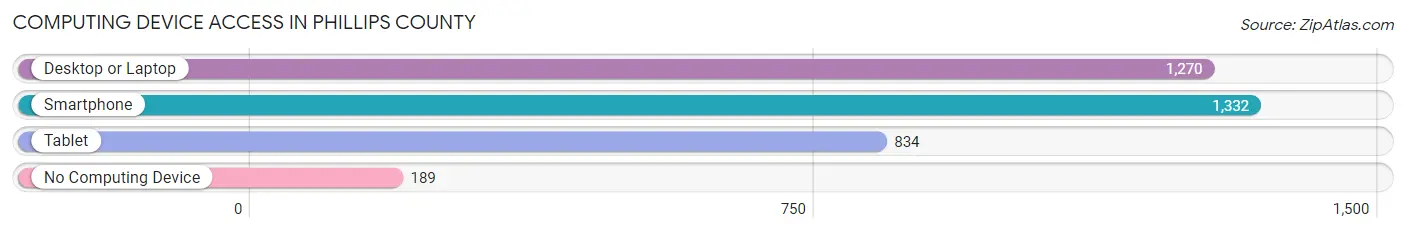
| Device Type | # Households | % Households |
| Desktop or Laptop | 1,270 | 72.6% |
| Smartphone | 1,332 | 76.2% |
| Tablet | 834 | 47.7% |
| No Computing Device | 189 | 10.8% |
| Total | 1,749 | 100.0% |
Internet Access in Phillips County
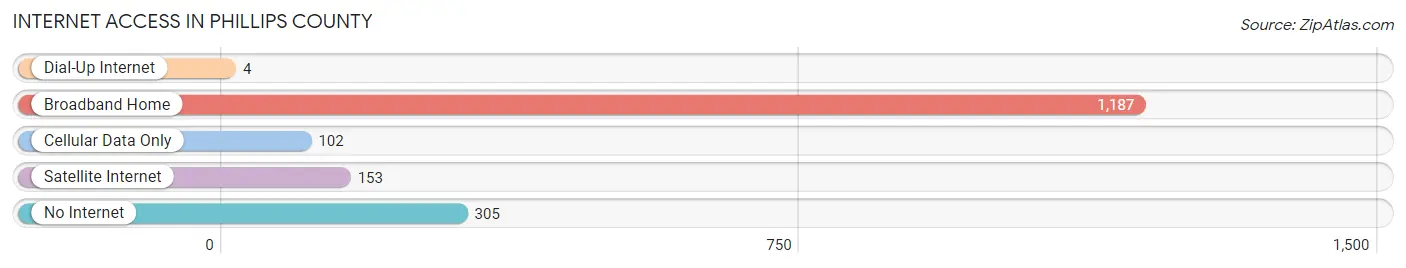
| Internet Type | # Households | % Households |
| Dial-Up Internet | 4 | 0.2% |
| Broadband Home | 1,187 | 67.9% |
| Cellular Data Only | 102 | 5.8% |
| Satellite Internet | 153 | 8.7% |
| No Internet | 305 | 17.4% |
| Total | 1,749 | 100.0% |
Phillips County Summary
Phillips County, Montana is located in the north-central part of the state, and is bordered by Valley, Daniels, Roosevelt, and Sheridan Counties. The county seat is Malta, and the county was named after early settler and rancher, William Phillips. The county has a total area of 2,845 square miles, and is the fourth largest county in Montana.
History
The area that is now Phillips County was first inhabited by the Assiniboine and Sioux Native American tribes. The first white settlers arrived in the area in the late 1800s, and the county was officially established in 1919. The county was named after William Phillips, who was an early settler and rancher in the area.
The county was largely agricultural in the early years, with wheat, barley, and oats being the main crops. Cattle ranching was also popular, and the county was home to several large ranches. The Great Northern Railway was built through the county in the early 1900s, and this helped to spur economic growth.
Geography
Phillips County is located in the north-central part of Montana, and is bordered by Valley, Daniels, Roosevelt, and Sheridan Counties. The county has a total area of 2,845 square miles, and is the fourth largest county in Montana. The terrain is mostly flat, with some rolling hills in the western part of the county. The Milk River runs through the county, and there are several small lakes and reservoirs.
The climate is semi-arid, with cold winters and hot summers. The average annual precipitation is around 12 inches, and the average annual temperature is around 45 degrees Fahrenheit.
Economy
The economy of Phillips County is largely based on agriculture and ranching. Wheat, barley, oats, and hay are the main crops, and cattle ranching is also popular. The county is also home to several oil and gas fields, and there is some mining activity in the area.
The county is home to several small businesses, including restaurants, retail stores, and service providers. The county is also home to several manufacturing companies, including a furniture factory and a food processing plant.
Demographics
As of the 2010 census, the population of Phillips County was 4,743. The population is mostly white (94.3%), with small percentages of Native American (2.2%), Hispanic (1.7%), and African American (0.7%) residents. The median household income is $41,944, and the median age is 44.
The county is home to several small towns, including Malta (the county seat), Dodson, Saco, and Whitewater. The county is also home to several unincorporated communities, including Dodson, Saco, and Whitewater.
Common Questions
What is the Total Population of Phillips County?
Total Population of Phillips County is 4,233.
What is the Total Male Population of Phillips County?
Total Male Population of Phillips County is 2,247.
What is the Total Female Population of Phillips County?
Total Female Population of Phillips County is 1,986.
What is the Ratio of Males per 100 Females in Phillips County?
There are 113.14 Males per 100 Females in Phillips County.
What is the Ratio of Females per 100 Males in Phillips County?
There are 88.38 Females per 100 Males in Phillips County.
What is the Median Population Age in Phillips County?
Median Population Age in Phillips County is 45.9 Years.
What is the Average Family Size in Phillips County
Average Family Size in Phillips County is 2.9 People.
What is the Average Household Size in Phillips County
Average Household Size in Phillips County is 2.4 People.
What is Per Capita Income in Phillips County?
Per Capita income in Phillips County is $32,450.
What is the Median Family Income in Phillips County?
Median Family Income in Phillips County is $73,692.
What is the Median Household income in Phillips County?
Median Household Income in Phillips County is $61,250.
What is Income or Wage Gap in Phillips County?
Income or Wage Gap in Phillips County is 32.2%.
Women in Phillips County earn 67.8 cents for every dollar earned by a man.
What is Inequality or Gini Index in Phillips County?
Inequality or Gini Index in Phillips County is 0.40.
How Large is the Labor Force in Phillips County?
There are 1,997 People in the Labor Forcein in Phillips County.
What is the Percentage of People in the Labor Force in Phillips County?
60.4% of People are in the Labor Force in Phillips County.
What is the Unemployment Rate in Phillips County?
Unemployment Rate in Phillips County is 3.4%.