Musselshell County, MT
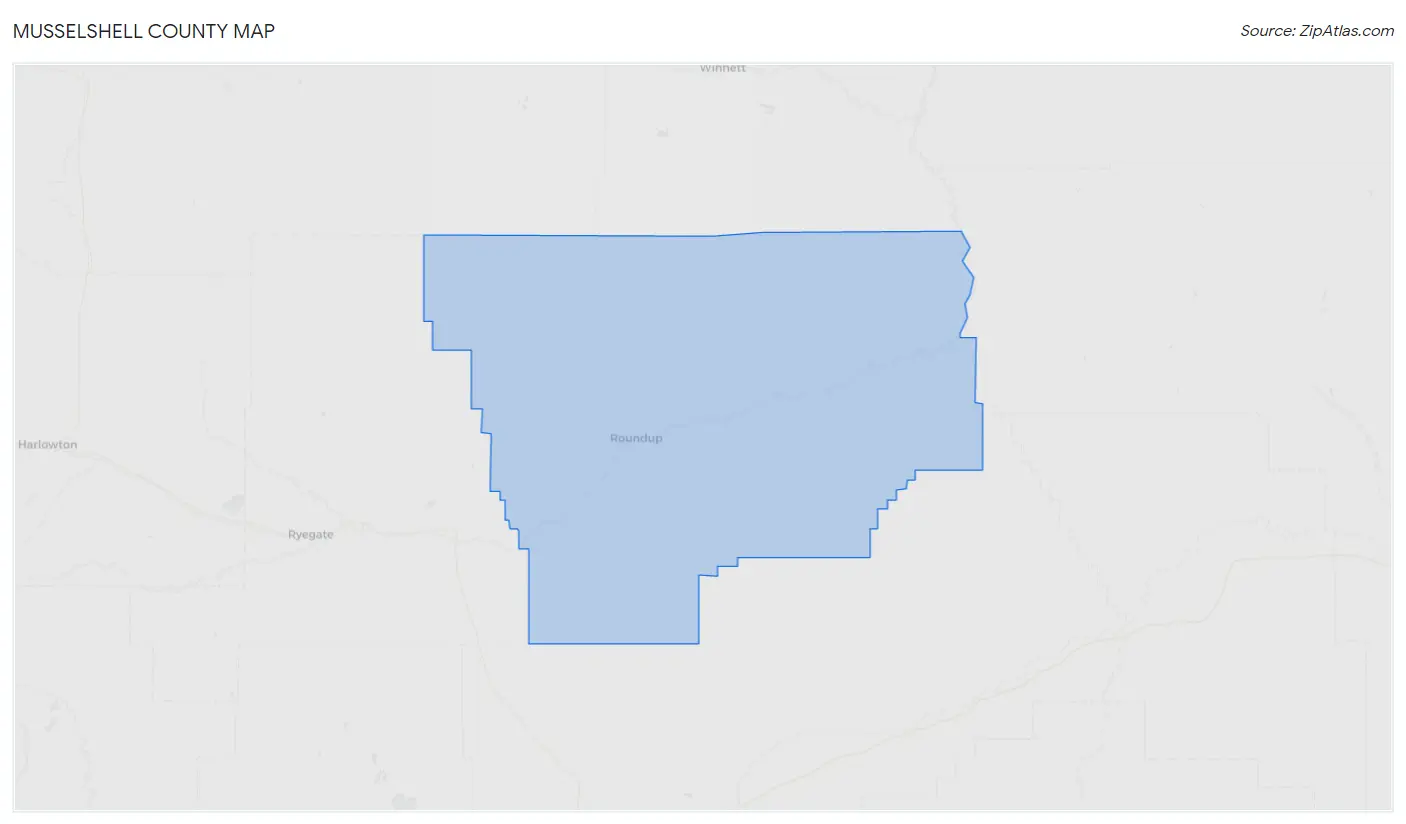
Musselshell County Map
Musselshell County Overview
4,924
TOTAL POPULATION
2,487
MALE POPULATION
2,437
FEMALE POPULATION
102.05
MALES / 100 FEMALES
97.99
FEMALES / 100 MALES
52.0
MEDIAN AGE
2.8
AVG FAMILY SIZE
2.3
AVG HOUSEHOLD SIZE
$32,506
PER CAPITA INCOME
$60,000
AVG FAMILY INCOME
$54,875
AVG HOUSEHOLD INCOME
33.4%
WAGE / INCOME GAP [ % ]
66.6¢/ $1
WAGE / INCOME GAP [ $ ]
$9,583
FAMILY INCOME DEFICIT
0.45
INEQUALITY / GINI INDEX
2,077
LABOR FORCE [ PEOPLE ]
50.4%
PERCENT IN LABOR FORCE
4.9%
UNEMPLOYMENT RATE
Musselshell County Area Codes
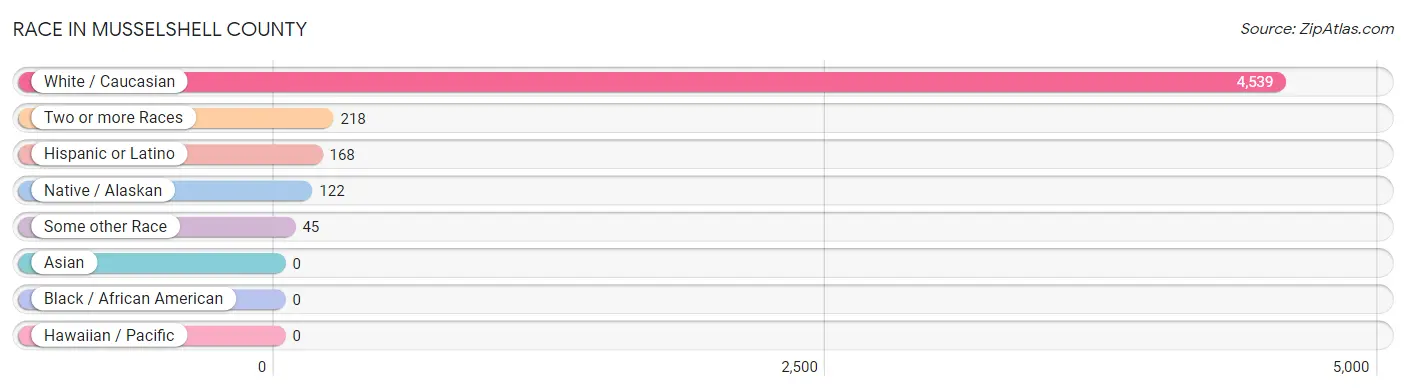
Race in Musselshell County
The most populous races in Musselshell County are White / Caucasian (4,539 | 92.2%), Two or more Races (218 | 4.4%), and Hispanic or Latino (168 | 3.4%).
| Race | # Population | % Population |
| Asian | 0 | 0.0% |
| Black / African American | 0 | 0.0% |
| Hawaiian / Pacific | 0 | 0.0% |
| Hispanic or Latino | 168 | 3.4% |
| Native / Alaskan | 122 | 2.5% |
| White / Caucasian | 4,539 | 92.2% |
| Two or more Races | 218 | 4.4% |
| Some other Race | 45 | 0.9% |
| Total | 4,924 | 100.0% |
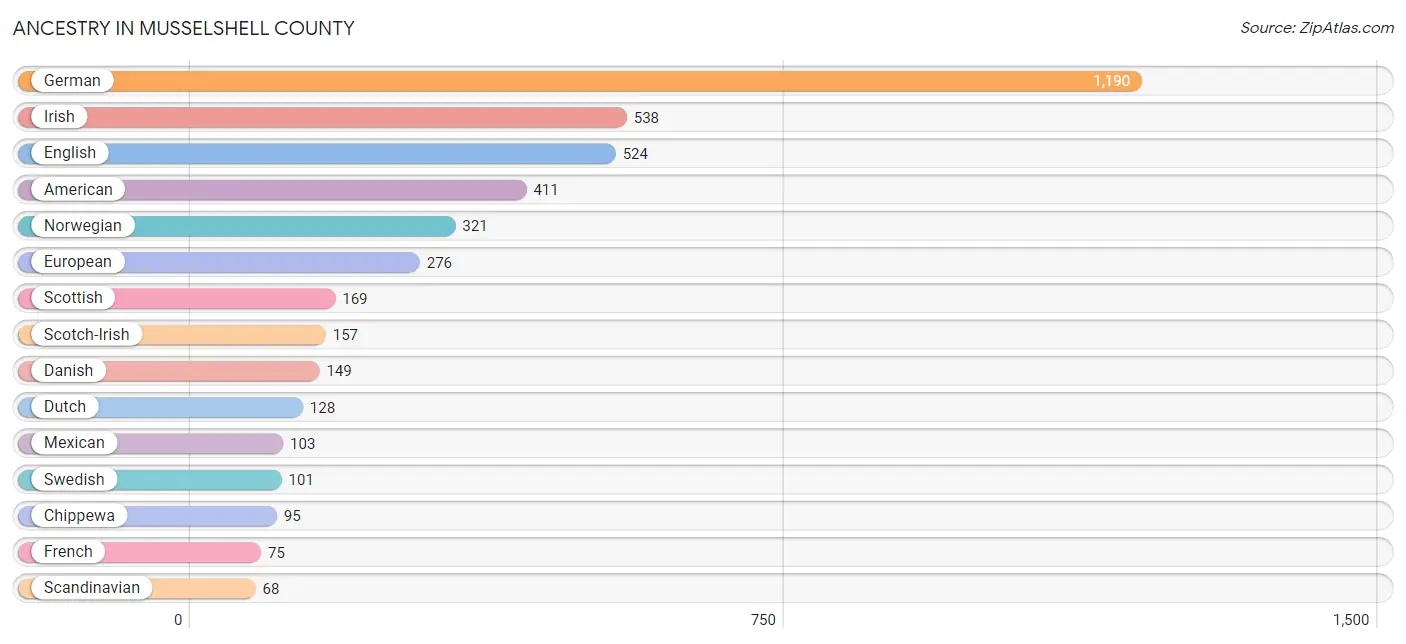
Ancestry in Musselshell County
The most populous ancestries reported in Musselshell County are German (1,190 | 24.2%), Irish (538 | 10.9%), English (524 | 10.6%), American (411 | 8.4%), and Norwegian (321 | 6.5%), together accounting for 60.6% of all Musselshell County residents.
| Ancestry | # Population | % Population |
| American | 411 | 8.4% |
| Arapaho | 43 | 0.9% |
| Austrian | 32 | 0.6% |
| Basque | 16 | 0.3% |
| Belgian | 7 | 0.1% |
| Bhutanese | 13 | 0.3% |
| British | 9 | 0.2% |
| Canadian | 18 | 0.4% |
| Cherokee | 8 | 0.2% |
| Cheyenne | 6 | 0.1% |
| Chippewa | 95 | 1.9% |
| Cuban | 2 | 0.0% |
| Czech | 24 | 0.5% |
| Czechoslovakian | 2 | 0.0% |
| Danish | 149 | 3.0% |
| Dutch | 128 | 2.6% |
| Eastern European | 9 | 0.2% |
| English | 524 | 10.6% |
| European | 276 | 5.6% |
| Finnish | 6 | 0.1% |
| French | 75 | 1.5% |
| French Canadian | 31 | 0.6% |
| German | 1,190 | 24.2% |
| Hungarian | 25 | 0.5% |
| Indian (Asian) | 20 | 0.4% |
| Irish | 538 | 10.9% |
| Italian | 54 | 1.1% |
| Mexican | 103 | 2.1% |
| Navajo | 1 | 0.0% |
| Norwegian | 321 | 6.5% |
| Osage | 13 | 0.3% |
| Pennsylvania German | 13 | 0.3% |
| Polish | 62 | 1.3% |
| Puerto Rican | 38 | 0.8% |
| Russian | 23 | 0.5% |
| Scandinavian | 68 | 1.4% |
| Scotch-Irish | 157 | 3.2% |
| Scottish | 169 | 3.4% |
| Serbian | 5 | 0.1% |
| Sioux | 37 | 0.7% |
| Slovene | 33 | 0.7% |
| Spaniard | 16 | 0.3% |
| Swedish | 101 | 2.1% |
| Swiss | 16 | 0.3% |
| Ukrainian | 18 | 0.4% |
| Welsh | 24 | 0.5% |
| Yugoslavian | 10 | 0.2% | View All 47 Rows |
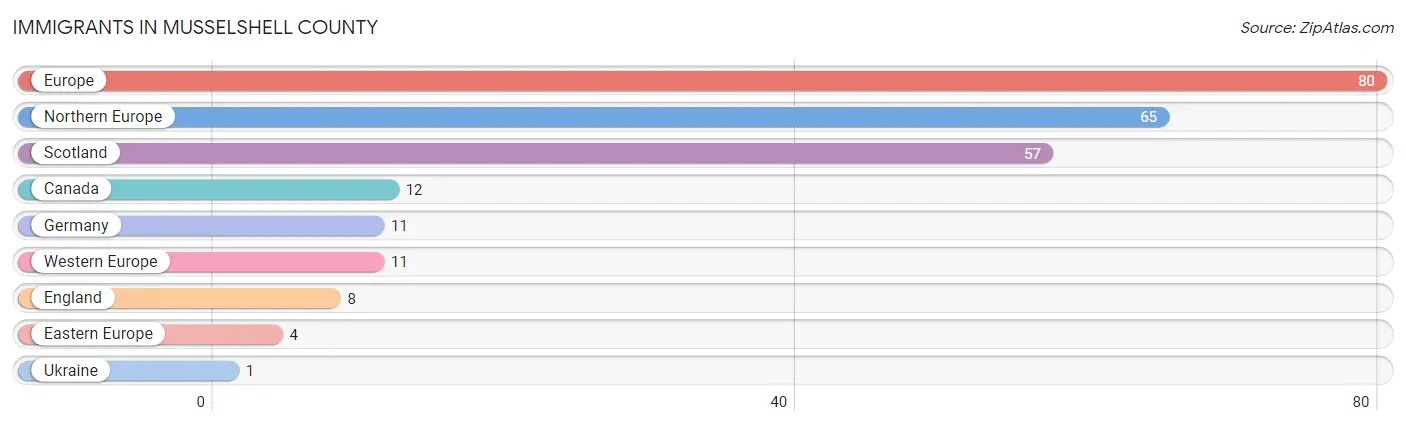
Immigrants in Musselshell County
The most numerous immigrant groups reported in Musselshell County came from Europe (80 | 1.6%), Northern Europe (65 | 1.3%), Scotland (57 | 1.2%), Canada (12 | 0.2%), and Germany (11 | 0.2%), together accounting for 4.6% of all Musselshell County residents.
| Immigration Origin | # Population | % Population |
| Canada | 12 | 0.2% |
| Eastern Europe | 4 | 0.1% |
| England | 8 | 0.2% |
| Europe | 80 | 1.6% |
| Germany | 11 | 0.2% |
| Northern Europe | 65 | 1.3% |
| Scotland | 57 | 1.2% |
| Ukraine | 1 | 0.0% |
| Western Europe | 11 | 0.2% | View All 9 Rows |
Sex and Age in Musselshell County
Sex and Age in Musselshell County
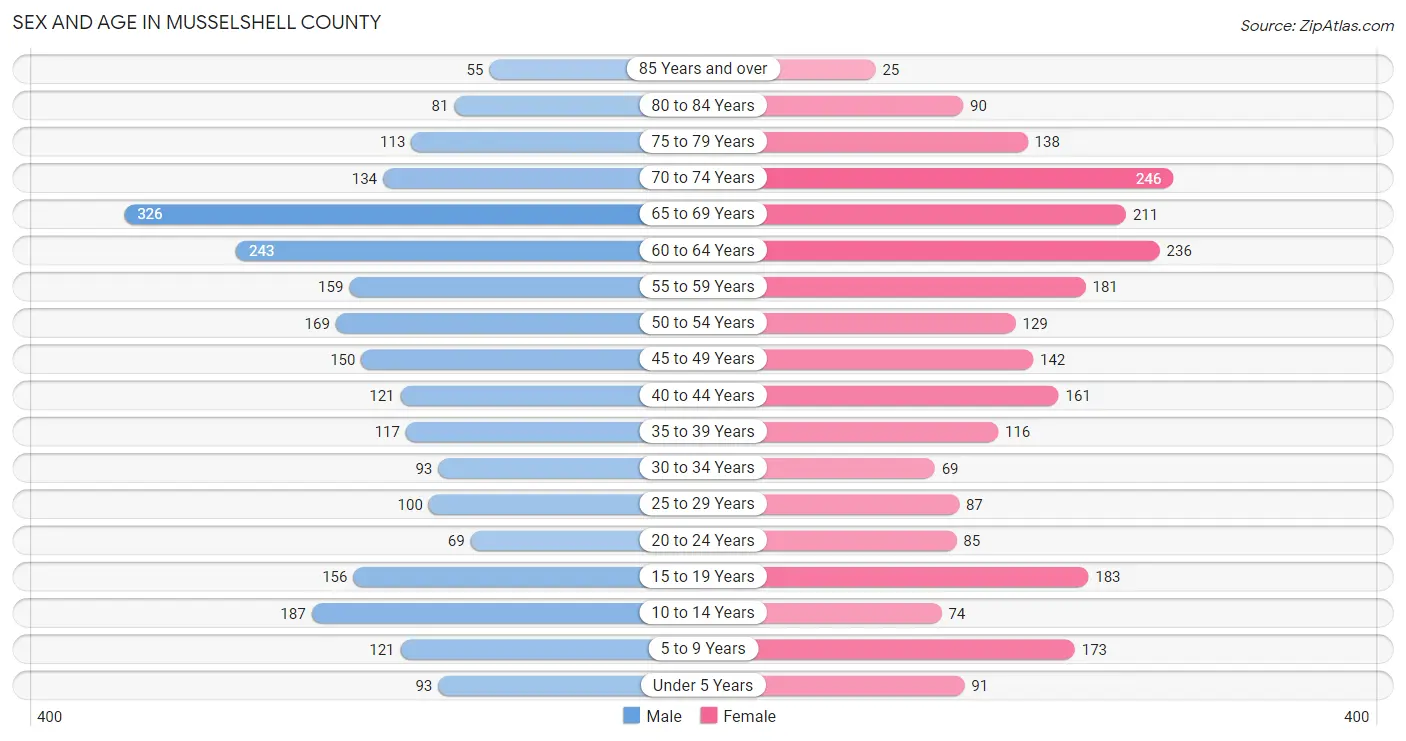
The most populous age groups in Musselshell County are 65 to 69 Years (326 | 13.1%) for men and 70 to 74 Years (246 | 10.1%) for women.
| Age Bracket | Male | Female |
| Under 5 Years | 93 (3.7%) | 91 (3.7%) |
| 5 to 9 Years | 121 (4.9%) | 173 (7.1%) |
| 10 to 14 Years | 187 (7.5%) | 74 (3.0%) |
| 15 to 19 Years | 156 (6.3%) | 183 (7.5%) |
| 20 to 24 Years | 69 (2.8%) | 85 (3.5%) |
| 25 to 29 Years | 100 (4.0%) | 87 (3.6%) |
| 30 to 34 Years | 93 (3.7%) | 69 (2.8%) |
| 35 to 39 Years | 117 (4.7%) | 116 (4.8%) |
| 40 to 44 Years | 121 (4.9%) | 161 (6.6%) |
| 45 to 49 Years | 150 (6.0%) | 142 (5.8%) |
| 50 to 54 Years | 169 (6.8%) | 129 (5.3%) |
| 55 to 59 Years | 159 (6.4%) | 181 (7.4%) |
| 60 to 64 Years | 243 (9.8%) | 236 (9.7%) |
| 65 to 69 Years | 326 (13.1%) | 211 (8.7%) |
| 70 to 74 Years | 134 (5.4%) | 246 (10.1%) |
| 75 to 79 Years | 113 (4.5%) | 138 (5.7%) |
| 80 to 84 Years | 81 (3.3%) | 90 (3.7%) |
| 85 Years and over | 55 (2.2%) | 25 (1.0%) |
| Total | 2,487 (100.0%) | 2,437 (100.0%) |
Families and Households in Musselshell County
Median Family Size in Musselshell County
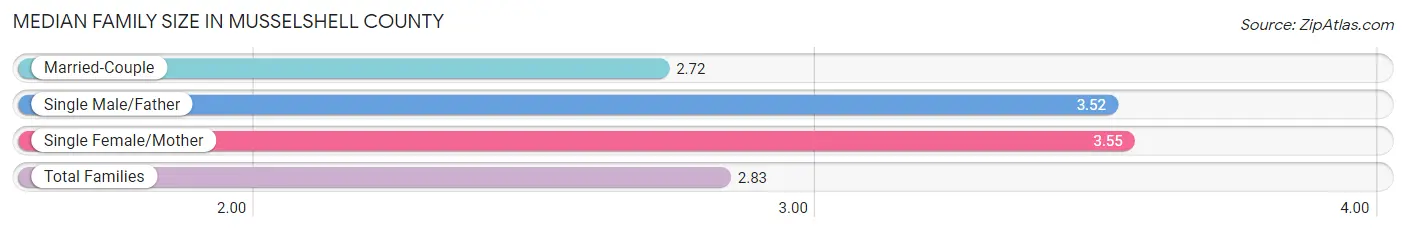
The median family size in Musselshell County is 2.83 persons per family, with single female/mother families (127 | 9.4%) accounting for the largest median family size of 3.55 persons per family. On the other hand, married-couple families (1,169 | 86.9%) represent the smallest median family size with 2.72 persons per family.
| Family Type | # Families | Family Size |
| Married-Couple | 1,169 (86.9%) | 2.72 |
| Single Male/Father | 50 (3.7%) | 3.52 |
| Single Female/Mother | 127 (9.4%) | 3.55 |
| Total Families | 1,346 (100.0%) | 2.83 |
Median Household Size in Musselshell County
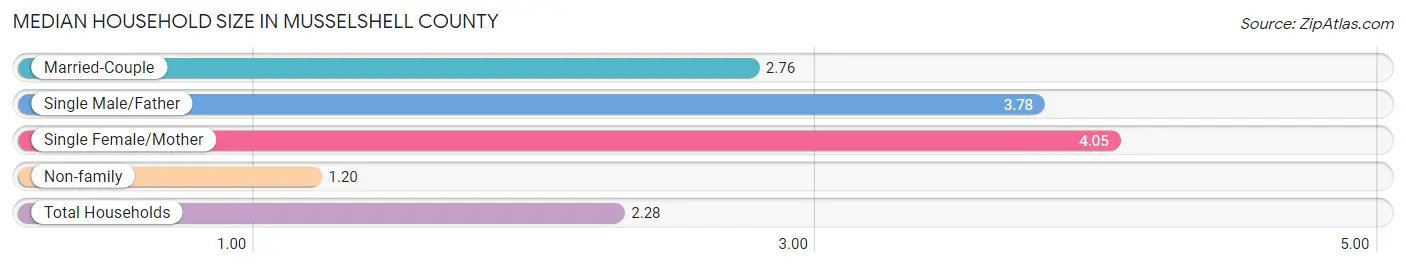
The median household size in Musselshell County is 2.28 persons per household, with single female/mother households (127 | 5.9%) accounting for the largest median household size of 4.05 persons per household. non-family households (791 | 37.0%) represent the smallest median household size with 1.20 persons per household.
| Household Type | # Households | Household Size |
| Married-Couple | 1,169 (54.7%) | 2.76 |
| Single Male/Father | 50 (2.3%) | 3.78 |
| Single Female/Mother | 127 (5.9%) | 4.05 |
| Non-family | 791 (37.0%) | 1.20 |
| Total Households | 2,137 (100.0%) | 2.28 |
Household Size by Marriage Status in Musselshell County
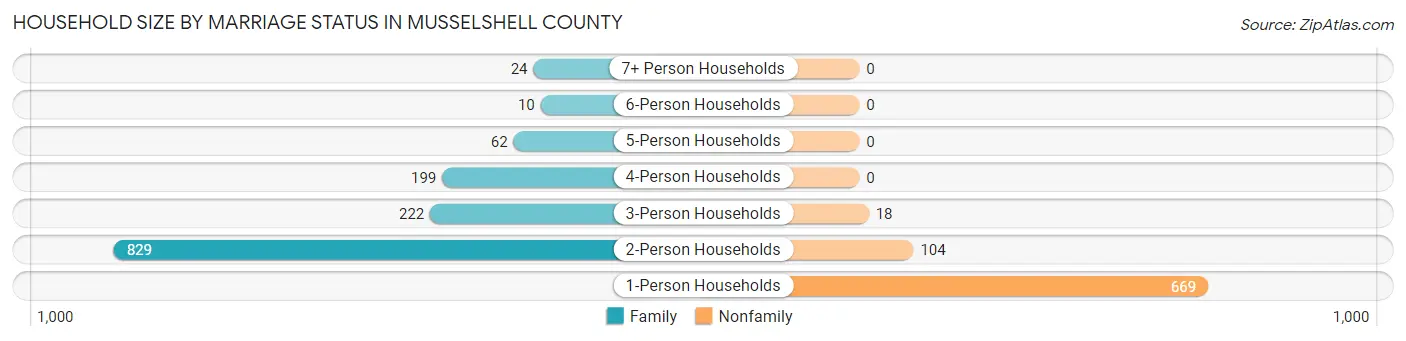
Out of a total of 2,137 households in Musselshell County, 1,346 (63.0%) are family households, while 791 (37.0%) are nonfamily households. The most numerous type of family households are 2-person households, comprising 829, and the most common type of nonfamily households are 1-person households, comprising 669.
| Household Size | Family Households | Nonfamily Households |
| 1-Person Households | - | 669 (31.3%) |
| 2-Person Households | 829 (38.8%) | 104 (4.9%) |
| 3-Person Households | 222 (10.4%) | 18 (0.8%) |
| 4-Person Households | 199 (9.3%) | 0 (0.0%) |
| 5-Person Households | 62 (2.9%) | 0 (0.0%) |
| 6-Person Households | 10 (0.5%) | 0 (0.0%) |
| 7+ Person Households | 24 (1.1%) | 0 (0.0%) |
| Total | 1,346 (63.0%) | 791 (37.0%) |
Female Fertility in Musselshell County
Fertility by Age in Musselshell County
Average fertility rate in Musselshell County is 89.0 births per 1,000 women. Women in the age bracket of 20 to 34 years have the highest fertility rate with 104.0 births per 1,000 women. Women in the age bracket of 35 to 50 years acount for 51.3% of all women with births.
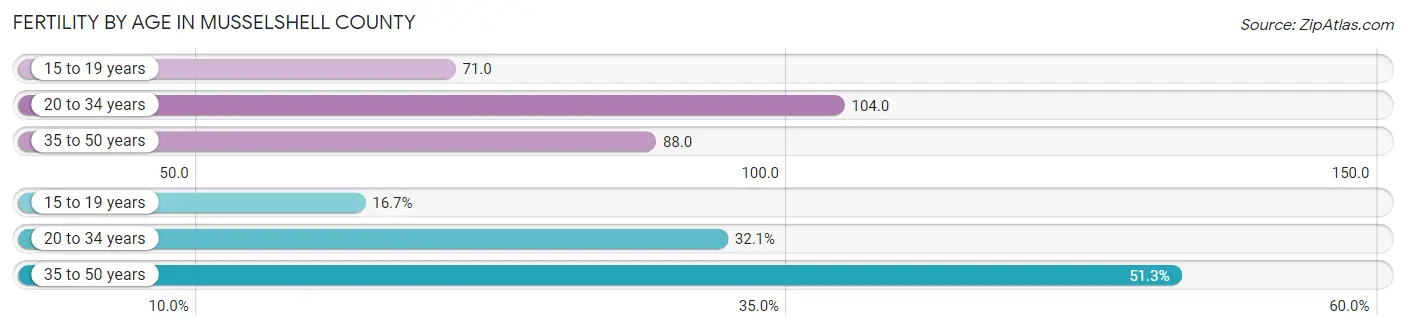
| Age Bracket | Women with Births | Births / 1,000 Women |
| 15 to 19 years | 13 (16.7%) | 71.0 |
| 20 to 34 years | 25 (32.1%) | 104.0 |
| 35 to 50 years | 40 (51.3%) | 88.0 |
| Total | 78 (100.0%) | 89.0 |
Fertility by Age by Marriage Status in Musselshell County
55.1% of women with births (78) in Musselshell County are married. The highest percentage of unmarried women with births falls into 15 to 19 years age bracket with 100.0% of them unmarried at the time of birth, while the lowest percentage of unmarried women with births belong to 35 to 50 years age bracket with 0.0% of them unmarried.
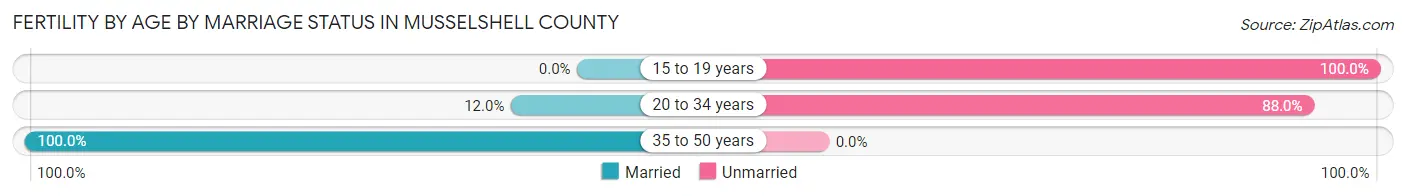
| Age Bracket | Married | Unmarried |
| 15 to 19 years | 0 (0.0%) | 13 (100.0%) |
| 20 to 34 years | 3 (12.0%) | 22 (88.0%) |
| 35 to 50 years | 40 (100.0%) | 0 (0.0%) |
| Total | 43 (55.1%) | 35 (44.9%) |
Fertility by Education in Musselshell County
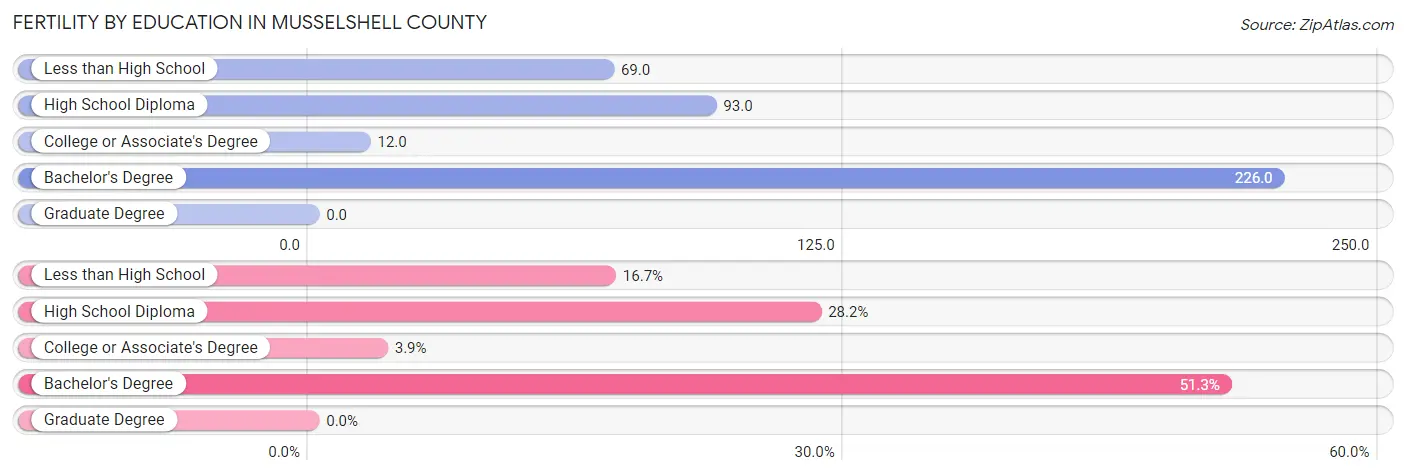
| Educational Attainment | Women with Births | Births / 1,000 Women |
| Less than High School | 13 (16.7%) | 69.0 |
| High School Diploma | 22 (28.2%) | 93.0 |
| College or Associate's Degree | 3 (3.8%) | 12.0 |
| Bachelor's Degree | 40 (51.3%) | 226.0 |
| Graduate Degree | 0 (0.0%) | 0.0 |
| Total | 78 (100.0%) | 89.0 |
Fertility by Education by Marriage Status in Musselshell County
44.9% of women with births in Musselshell County are unmarried. Women with the educational attainment of college or associate's degree are most likely to be married with 100.0% of them married at childbirth, while women with the educational attainment of less than high school are least likely to be married with 100.0% of them unmarried at childbirth.
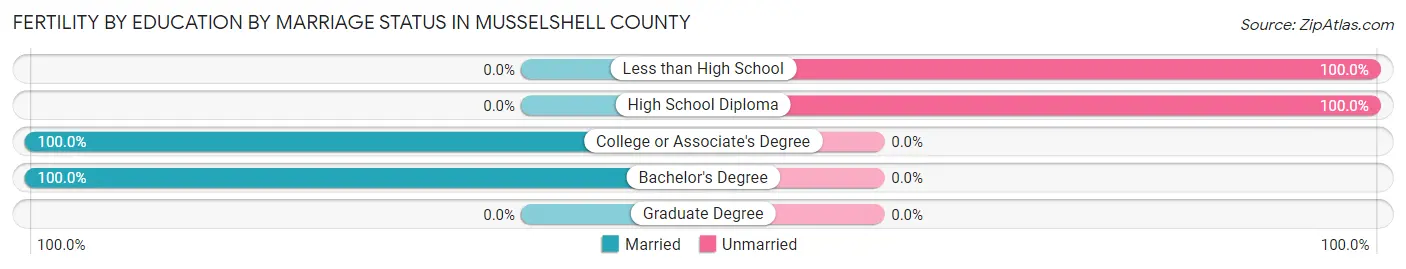
| Educational Attainment | Married | Unmarried |
| Less than High School | 0 (0.0%) | 13 (100.0%) |
| High School Diploma | 0 (0.0%) | 22 (100.0%) |
| College or Associate's Degree | 3 (100.0%) | 0 (0.0%) |
| Bachelor's Degree | 40 (100.0%) | 0 (0.0%) |
| Graduate Degree | 0 (0.0%) | 0 (0.0%) |
| Total | 43 (55.1%) | 35 (44.9%) |
Income in Musselshell County
Income Overview in Musselshell County
Per Capita Income in Musselshell County is $32,506, while median incomes of families and households are $60,000 and $54,875 respectively.
| Characteristic | Number | Measure |
| Per Capita Income | 4,924 | $32,506 |
| Median Family Income | 1,346 | $60,000 |
| Mean Family Income | 1,346 | $77,707 |
| Median Household Income | 2,137 | $54,875 |
| Mean Household Income | 2,137 | $73,212 |
| Income Deficit | 1,346 | $9,583 |
| Wage / Income Gap (%) | 4,924 | 33.37% |
| Wage / Income Gap ($) | 4,924 | 66.63¢ per $1 |
| Gini / Inequality Index | 4,924 | 0.45 |
Earnings by Sex in Musselshell County
Average Earnings in Musselshell County are $34,229, $45,448 for men and $30,281 for women, a difference of 33.4%.
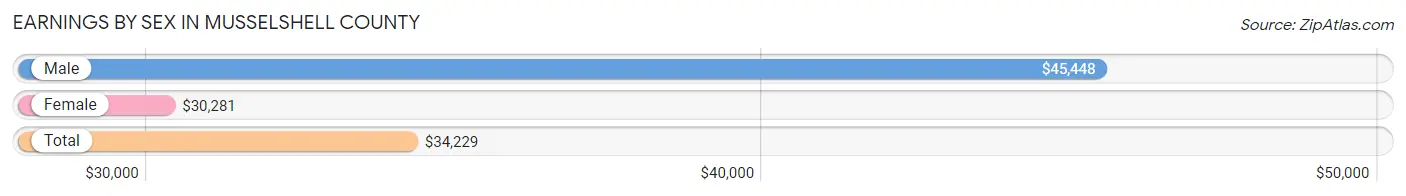
| Sex | Number | Average Earnings |
| Male | 1,129 (51.7%) | $45,448 |
| Female | 1,055 (48.3%) | $30,281 |
| Total | 2,184 (100.0%) | $34,229 |
Earnings by Sex by Income Bracket in Musselshell County
The most common earnings brackets in Musselshell County are $45,000 to $49,999 for men (157 | 13.9%) and $30,000 to $34,999 for women (156 | 14.8%).
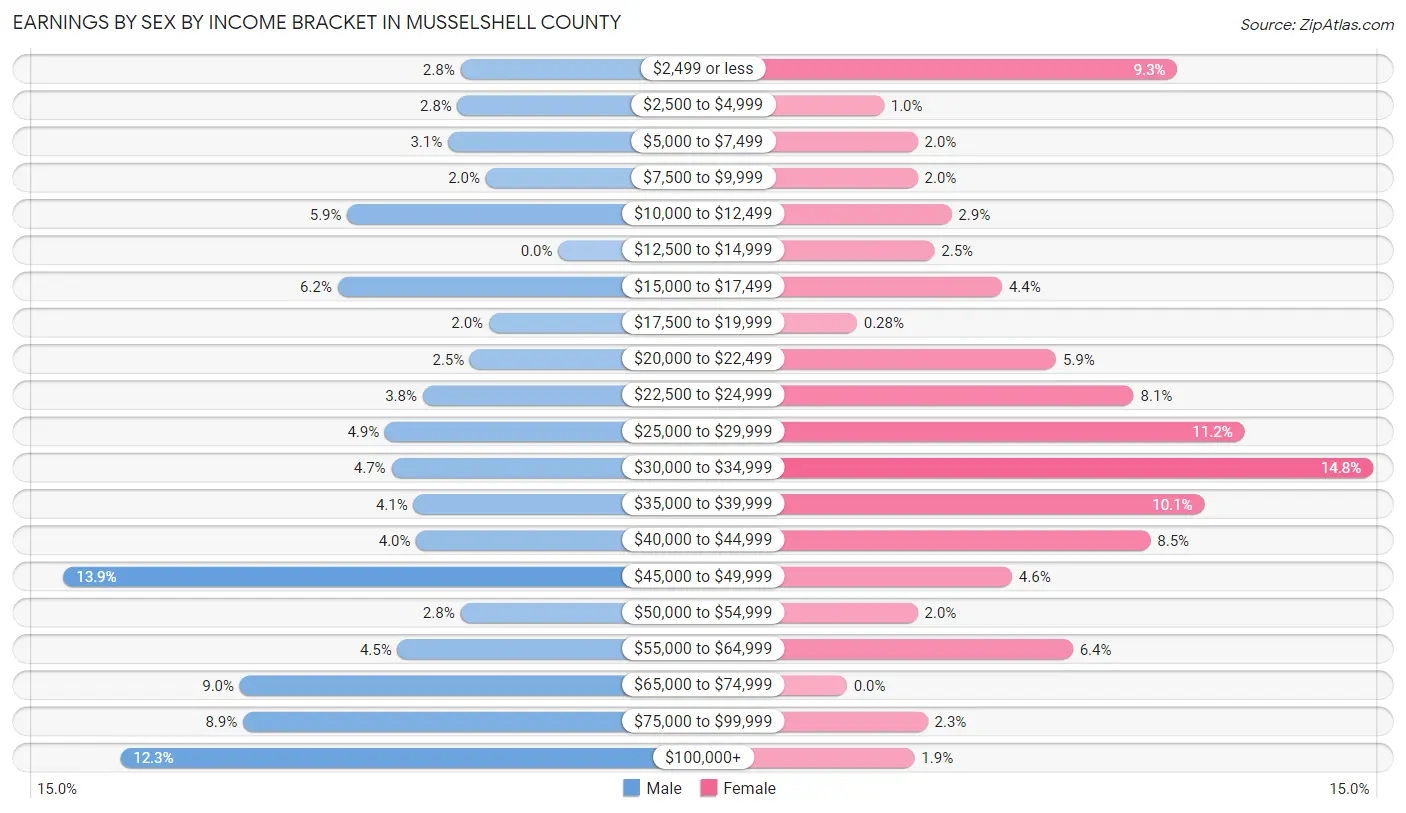
| Income | Male | Female |
| $2,499 or less | 31 (2.8%) | 98 (9.3%) |
| $2,500 to $4,999 | 32 (2.8%) | 11 (1.0%) |
| $5,000 to $7,499 | 35 (3.1%) | 21 (2.0%) |
| $7,500 to $9,999 | 23 (2.0%) | 21 (2.0%) |
| $10,000 to $12,499 | 67 (5.9%) | 31 (2.9%) |
| $12,500 to $14,999 | 0 (0.0%) | 26 (2.5%) |
| $15,000 to $17,499 | 70 (6.2%) | 46 (4.4%) |
| $17,500 to $19,999 | 22 (1.9%) | 3 (0.3%) |
| $20,000 to $22,499 | 28 (2.5%) | 62 (5.9%) |
| $22,500 to $24,999 | 43 (3.8%) | 85 (8.1%) |
| $25,000 to $29,999 | 55 (4.9%) | 118 (11.2%) |
| $30,000 to $34,999 | 53 (4.7%) | 156 (14.8%) |
| $35,000 to $39,999 | 46 (4.1%) | 106 (10.1%) |
| $40,000 to $44,999 | 45 (4.0%) | 90 (8.5%) |
| $45,000 to $49,999 | 157 (13.9%) | 49 (4.6%) |
| $50,000 to $54,999 | 31 (2.8%) | 21 (2.0%) |
| $55,000 to $64,999 | 51 (4.5%) | 67 (6.4%) |
| $65,000 to $74,999 | 101 (8.9%) | 0 (0.0%) |
| $75,000 to $99,999 | 100 (8.9%) | 24 (2.3%) |
| $100,000+ | 139 (12.3%) | 20 (1.9%) |
| Total | 1,129 (100.0%) | 1,055 (100.0%) |
Earnings by Sex by Educational Attainment in Musselshell County
Average earnings in Musselshell County are $46,821 for men and $29,814 for women, a difference of 36.3%. Men with an educational attainment of graduate degree enjoy the highest average annual earnings of $78,378, while those with high school diploma education earn the least with $47,148. Women with an educational attainment of bachelor's degree earn the most with the average annual earnings of $40,469, while those with graduate degree education have the smallest earnings of $23,517.
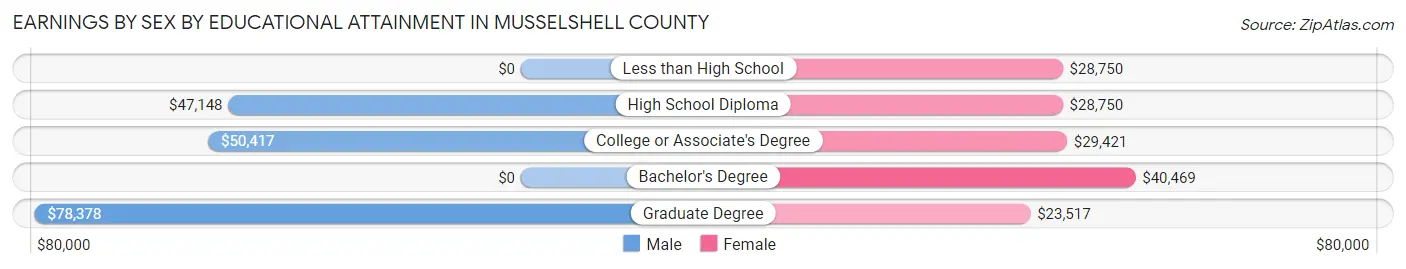
| Educational Attainment | Male Income | Female Income |
| Less than High School | - | - |
| High School Diploma | $47,148 | $28,750 |
| College or Associate's Degree | $50,417 | $29,421 |
| Bachelor's Degree | - | - |
| Graduate Degree | $78,378 | $23,517 |
| Total | $46,821 | $29,814 |
Family Income in Musselshell County
Family Income Brackets in Musselshell County
According to the Musselshell County family income data, there are 441 families falling into the $50,000 to $74,999 income range, which is the most common income bracket and makes up 32.8% of all families. Conversely, the $10,000 to $14,999 income bracket is the least frequent group with only 1 families (0.1%) belonging to this category.
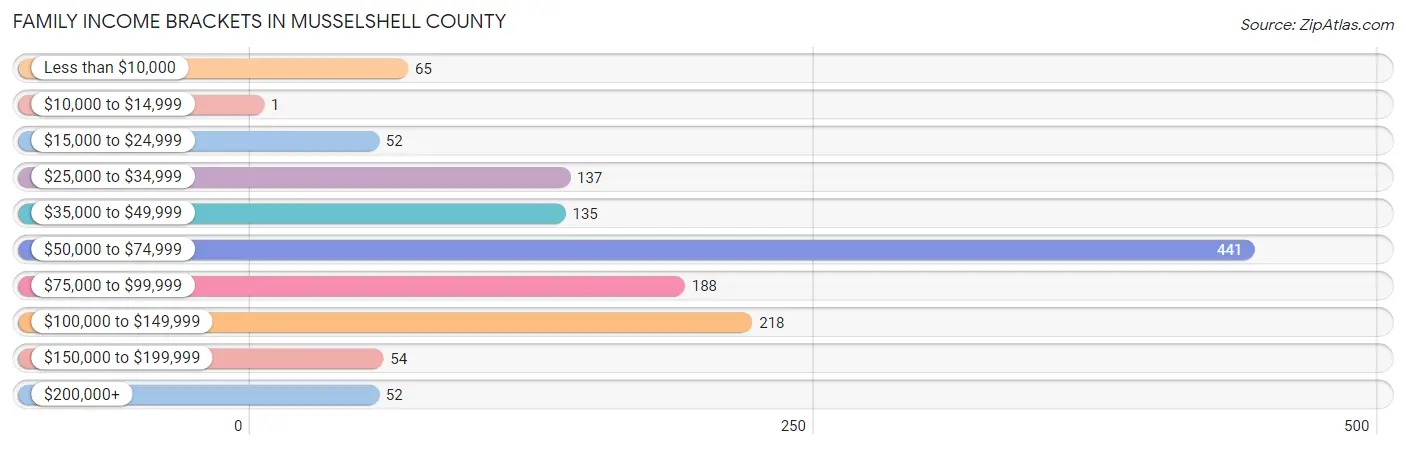
| Income Bracket | # Families | % Families |
| Less than $10,000 | 65 | 4.8% |
| $10,000 to $14,999 | 1 | 0.1% |
| $15,000 to $24,999 | 52 | 3.9% |
| $25,000 to $34,999 | 137 | 10.2% |
| $35,000 to $49,999 | 135 | 10.0% |
| $50,000 to $74,999 | 441 | 32.8% |
| $75,000 to $99,999 | 188 | 14.0% |
| $100,000 to $149,999 | 218 | 16.2% |
| $150,000 to $199,999 | 54 | 4.0% |
| $200,000+ | 52 | 3.9% |
Family Income by Famaliy Size in Musselshell County
5-person families (44 | 3.3%) account for the highest median family income in Musselshell County with $122,333 per family, while 2-person families (857 | 63.7%) have the highest median income of $29,470 per family member.
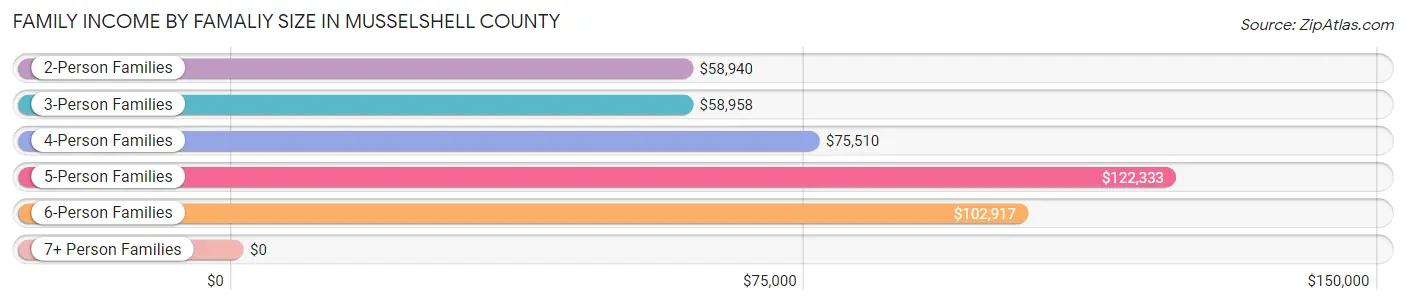
| Income Bracket | # Families | Median Income |
| 2-Person Families | 857 (63.7%) | $58,940 |
| 3-Person Families | 231 (17.2%) | $58,958 |
| 4-Person Families | 180 (13.4%) | $75,510 |
| 5-Person Families | 44 (3.3%) | $122,333 |
| 6-Person Families | 10 (0.7%) | $102,917 |
| 7+ Person Families | 24 (1.8%) | $0 |
| Total | 1,346 (100.0%) | $60,000 |
Family Income by Number of Earners in Musselshell County
The median family income in Musselshell County is $60,000, with families comprising 3+ earners (46) having the highest median family income of $145,577, while families with no earners (384) have the lowest median family income of $47,000, accounting for 3.4% and 28.5% of families, respectively.
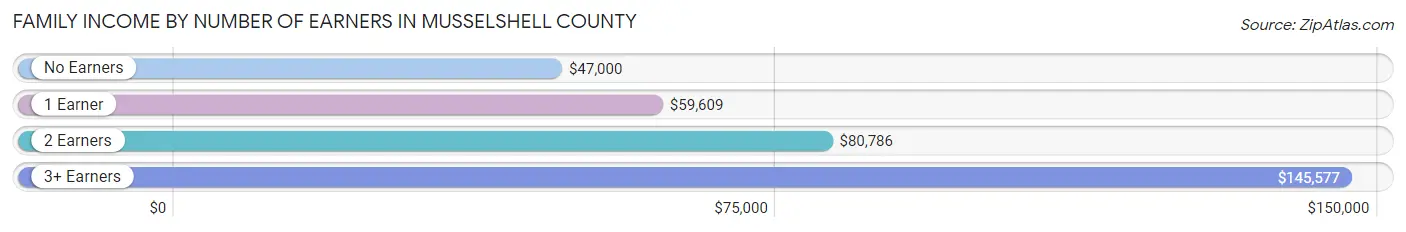
| Number of Earners | # Families | Median Income |
| No Earners | 384 (28.5%) | $47,000 |
| 1 Earner | 404 (30.0%) | $59,609 |
| 2 Earners | 512 (38.0%) | $80,786 |
| 3+ Earners | 46 (3.4%) | $145,577 |
| Total | 1,346 (100.0%) | $60,000 |
Household Income in Musselshell County
Household Income Brackets in Musselshell County
With 513 households falling in the category, the $50,000 to $74,999 income range is the most frequent in Musselshell County, accounting for 24.0% of all households. In contrast, only 62 households (2.9%) fall into the $150,000 to $199,999 income bracket, making it the least populous group.
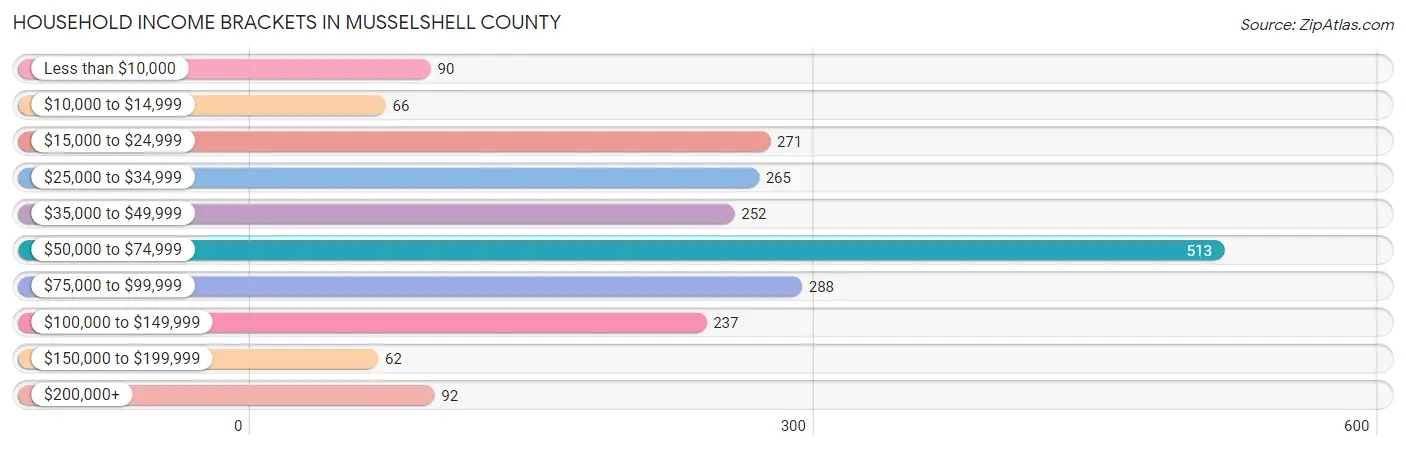
| Income Bracket | # Households | % Households |
| Less than $10,000 | 90 | 4.2% |
| $10,000 to $14,999 | 66 | 3.1% |
| $15,000 to $24,999 | 271 | 12.7% |
| $25,000 to $34,999 | 265 | 12.4% |
| $35,000 to $49,999 | 252 | 11.8% |
| $50,000 to $74,999 | 513 | 24.0% |
| $75,000 to $99,999 | 288 | 13.5% |
| $100,000 to $149,999 | 237 | 11.1% |
| $150,000 to $199,999 | 62 | 2.9% |
| $200,000+ | 92 | 4.3% |
Household Income by Householder Age in Musselshell County
The median household income in Musselshell County is $54,875, with the highest median household income of $72,206 found in the 45 to 64 years age bracket for the primary householder. A total of 746 households (34.9%) fall into this category. Meanwhile, the 15 to 24 years age bracket for the primary householder has the lowest median household income of $0, with 41 households (1.9%) in this group.
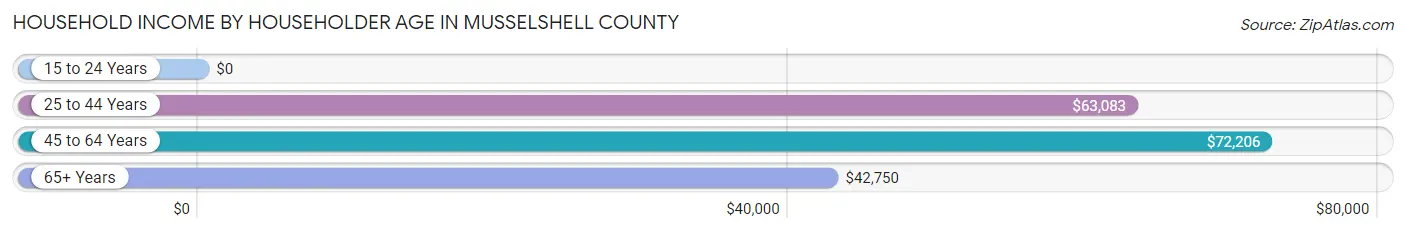
| Income Bracket | # Households | Median Income |
| 15 to 24 Years | 41 (1.9%) | $0 |
| 25 to 44 Years | 455 (21.3%) | $63,083 |
| 45 to 64 Years | 746 (34.9%) | $72,206 |
| 65+ Years | 895 (41.9%) | $42,750 |
| Total | 2,137 (100.0%) | $54,875 |
Poverty in Musselshell County
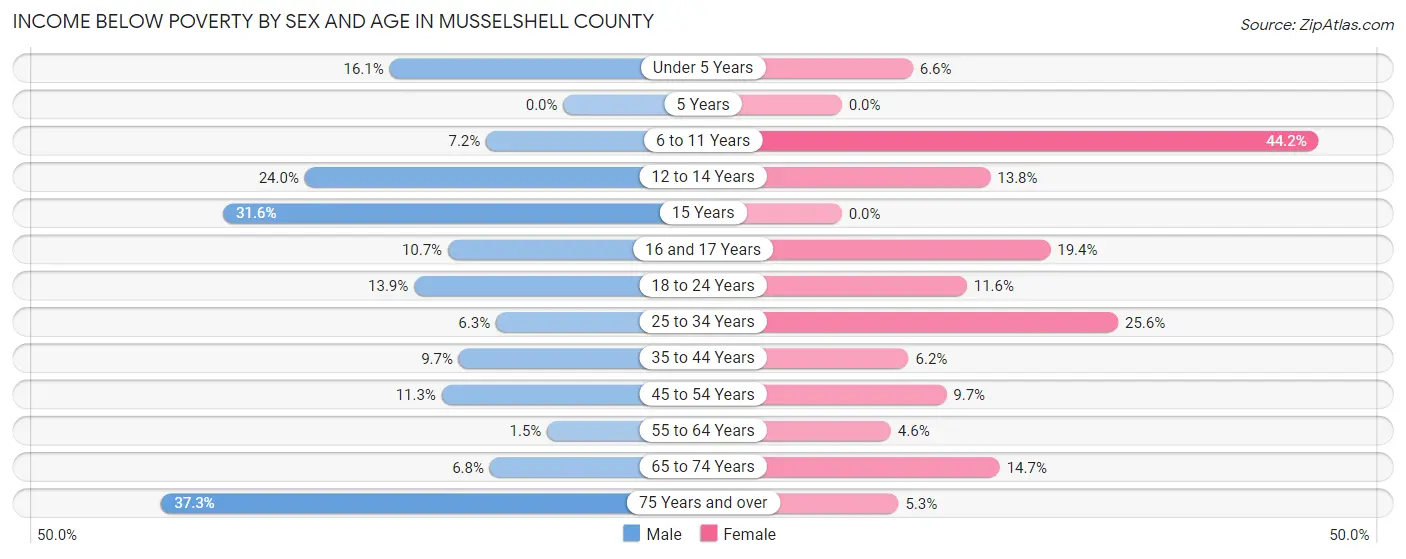
Income Below Poverty by Sex and Age in Musselshell County
With 11.4% poverty level for males and 12.3% for females among the residents of Musselshell County, 75 year old and over males and 6 to 11 year old females are the most vulnerable to poverty, with 91 males (37.3%) and 73 females (44.2%) in their respective age groups living below the poverty level.
| Age Bracket | Male | Female |
| Under 5 Years | 15 (16.1%) | 6 (6.6%) |
| 5 Years | 0 (0.0%) | 0 (0.0%) |
| 6 to 11 Years | 16 (7.2%) | 73 (44.2%) |
| 12 to 14 Years | 12 (24.0%) | 4 (13.8%) |
| 15 Years | 12 (31.6%) | 0 (0.0%) |
| 16 and 17 Years | 6 (10.7%) | 12 (19.4%) |
| 18 to 24 Years | 18 (13.9%) | 21 (11.6%) |
| 25 to 34 Years | 12 (6.2%) | 40 (25.6%) |
| 35 to 44 Years | 23 (9.7%) | 17 (6.2%) |
| 45 to 54 Years | 36 (11.3%) | 26 (9.7%) |
| 55 to 64 Years | 6 (1.5%) | 19 (4.6%) |
| 65 to 74 Years | 31 (6.8%) | 67 (14.7%) |
| 75 Years and over | 91 (37.3%) | 13 (5.3%) |
| Total | 278 (11.4%) | 298 (12.3%) |
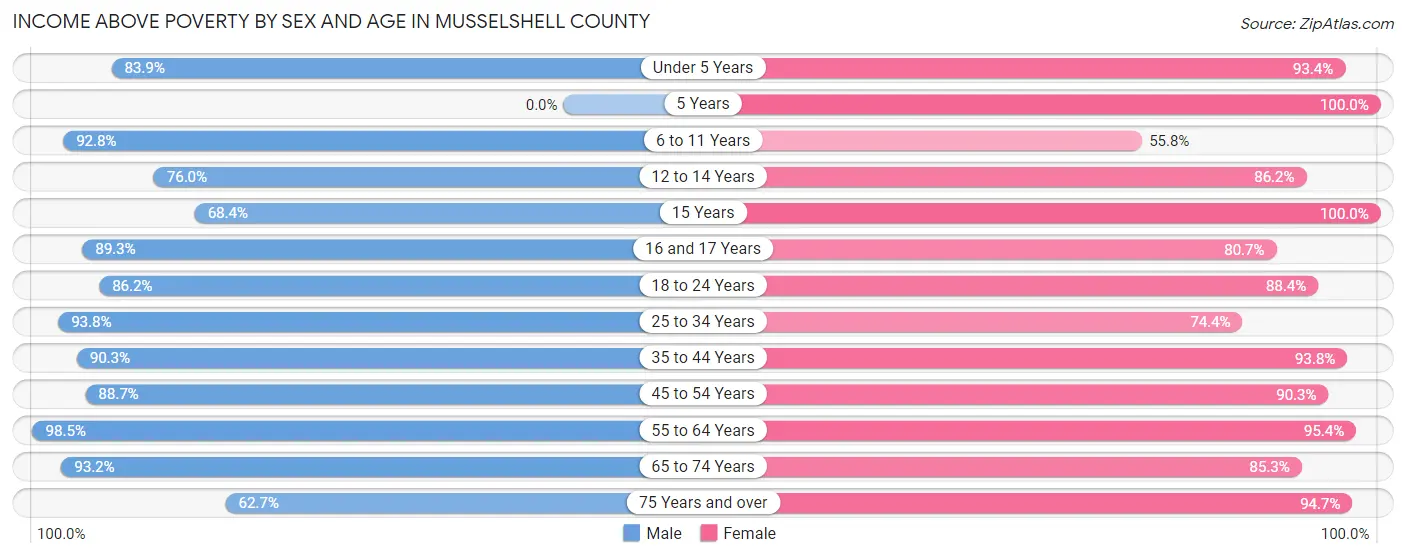
Income Above Poverty by Sex and Age in Musselshell County
According to the poverty statistics in Musselshell County, males aged 55 to 64 years and females aged 5 years are the age groups that are most secure financially, with 98.5% of males and 100.0% of females in these age groups living above the poverty line.
| Age Bracket | Male | Female |
| Under 5 Years | 78 (83.9%) | 85 (93.4%) |
| 5 Years | 0 (0.0%) | 53 (100.0%) |
| 6 to 11 Years | 207 (92.8%) | 92 (55.8%) |
| 12 to 14 Years | 38 (76.0%) | 25 (86.2%) |
| 15 Years | 26 (68.4%) | 25 (100.0%) |
| 16 and 17 Years | 50 (89.3%) | 50 (80.6%) |
| 18 to 24 Years | 112 (86.2%) | 160 (88.4%) |
| 25 to 34 Years | 180 (93.8%) | 116 (74.4%) |
| 35 to 44 Years | 214 (90.3%) | 257 (93.8%) |
| 45 to 54 Years | 283 (88.7%) | 242 (90.3%) |
| 55 to 64 Years | 394 (98.5%) | 398 (95.4%) |
| 65 to 74 Years | 423 (93.2%) | 390 (85.3%) |
| 75 Years and over | 153 (62.7%) | 234 (94.7%) |
| Total | 2,158 (88.6%) | 2,127 (87.7%) |
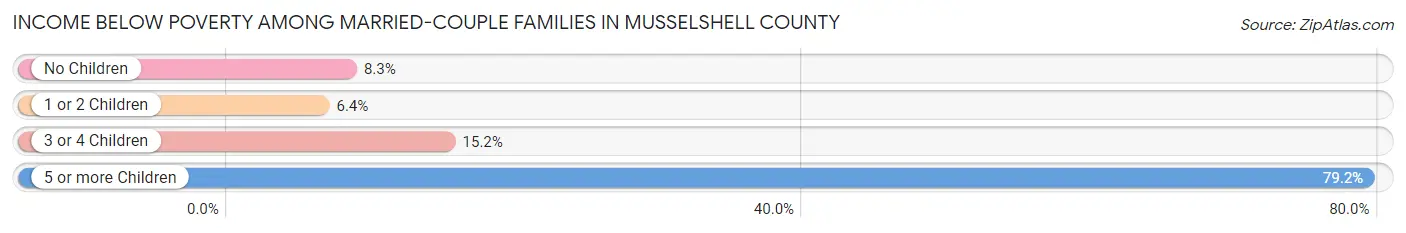
Income Below Poverty Among Married-Couple Families in Musselshell County
The poverty statistics for married-couple families in Musselshell County show that 9.5% or 111 of the total 1,169 families live below the poverty line. Families with 5 or more children have the highest poverty rate of 79.2%, comprising of 19 families. On the other hand, families with 1 or 2 children have the lowest poverty rate of 6.4%, which includes 17 families.
| Children | Above Poverty | Below Poverty |
| No Children | 775 (91.7%) | 70 (8.3%) |
| 1 or 2 Children | 250 (93.6%) | 17 (6.4%) |
| 3 or 4 Children | 28 (84.9%) | 5 (15.1%) |
| 5 or more Children | 5 (20.8%) | 19 (79.2%) |
| Total | 1,058 (90.5%) | 111 (9.5%) |
Income Below Poverty Among Single-Parent Households in Musselshell County
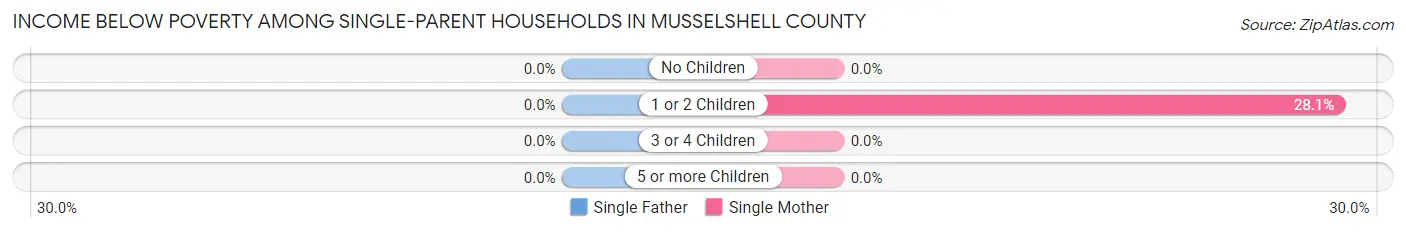
| Children | Single Father | Single Mother |
| No Children | 0 (0.0%) | 0 (0.0%) |
| 1 or 2 Children | 0 (0.0%) | 16 (28.1%) |
| 3 or 4 Children | 0 (0.0%) | 0 (0.0%) |
| 5 or more Children | 0 (0.0%) | 0 (0.0%) |
| Total | 0 (0.0%) | 16 (12.6%) |
Income Below Poverty Among Married-Couple vs Single-Parent Households in Musselshell County
The poverty data for Musselshell County shows that 111 of the married-couple family households (9.5%) and 16 of the single-parent households (9.0%) are living below the poverty level. Within the married-couple family households, those with 5 or more children have the highest poverty rate, with 19 households (79.2%) falling below the poverty line. Among the single-parent households, those with 1 or 2 children have the highest poverty rate, with 16 household (24.6%) living below poverty.
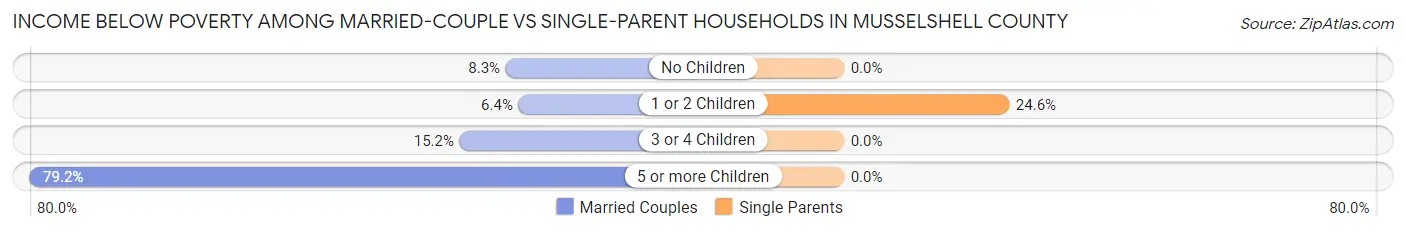
| Children | Married-Couple Families | Single-Parent Households |
| No Children | 70 (8.3%) | 0 (0.0%) |
| 1 or 2 Children | 17 (6.4%) | 16 (24.6%) |
| 3 or 4 Children | 5 (15.1%) | 0 (0.0%) |
| 5 or more Children | 19 (79.2%) | 0 (0.0%) |
| Total | 111 (9.5%) | 16 (9.0%) |
Employment Characteristics in Musselshell County
Employment by Class of Employer in Musselshell County
Among the 1,919 employed individuals in Musselshell County, private company employees (1,281 | 66.7%), self-employed (not incorporated) (144 | 7.5%), and local government employees (144 | 7.5%) make up the most common classes of employment.
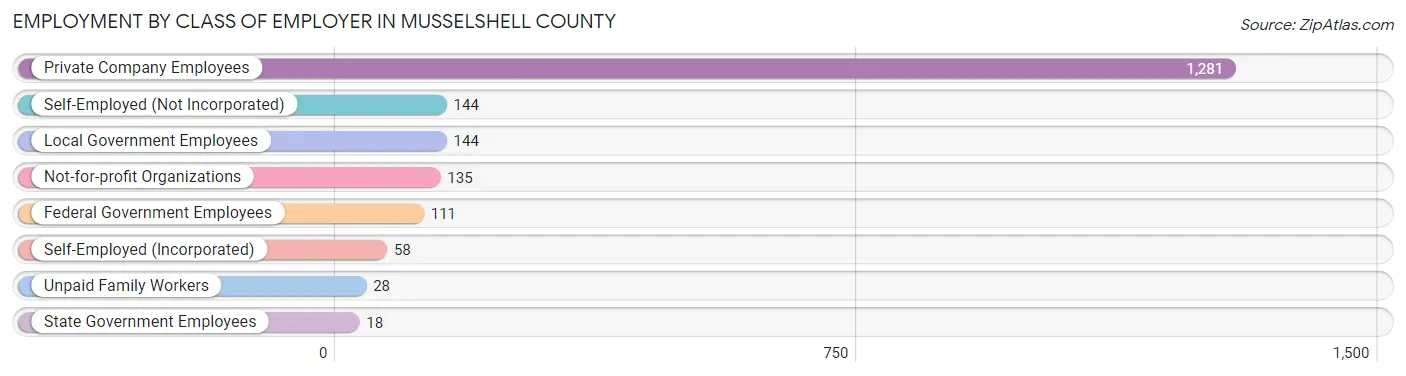
| Employer Class | # Employees | % Employees |
| Private Company Employees | 1,281 | 66.7% |
| Self-Employed (Incorporated) | 58 | 3.0% |
| Self-Employed (Not Incorporated) | 144 | 7.5% |
| Not-for-profit Organizations | 135 | 7.0% |
| Local Government Employees | 144 | 7.5% |
| State Government Employees | 18 | 0.9% |
| Federal Government Employees | 111 | 5.8% |
| Unpaid Family Workers | 28 | 1.5% |
| Total | 1,919 | 100.0% |
Employment Status by Age in Musselshell County
According to the labor force statistics for Musselshell County, out of the total population over 16 years of age (4,122), 50.4% or 2,077 individuals are in the labor force, with 4.9% or 102 of them unemployed. The age group with the highest labor force participation rate is 30 to 34 years, with 95.1% or 154 individuals in the labor force. Within the labor force, the 16 to 19 years age range has the highest percentage of unemployed individuals, with 51.6% or 47 of them being unemployed.
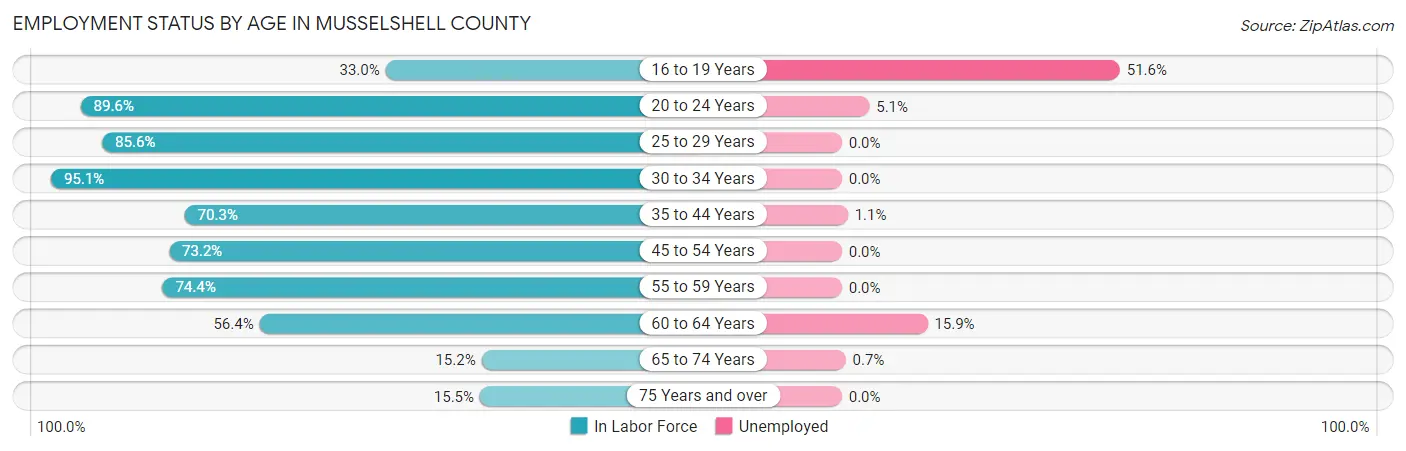
| Age Bracket | In Labor Force | Unemployed |
| 16 to 19 Years | 91 (33.0%) | 47 (51.6%) |
| 20 to 24 Years | 138 (89.6%) | 7 (5.1%) |
| 25 to 29 Years | 160 (85.6%) | 0 (0.0%) |
| 30 to 34 Years | 154 (95.1%) | 0 (0.0%) |
| 35 to 44 Years | 362 (70.3%) | 4 (1.1%) |
| 45 to 54 Years | 432 (73.2%) | 0 (0.0%) |
| 55 to 59 Years | 253 (74.4%) | 0 (0.0%) |
| 60 to 64 Years | 270 (56.4%) | 43 (15.9%) |
| 65 to 74 Years | 139 (15.2%) | 1 (0.7%) |
| 75 Years and over | 78 (15.5%) | 0 (0.0%) |
| Total | 2,077 (50.4%) | 102 (4.9%) |
Employment Status by Educational Attainment in Musselshell County
According to labor force statistics for Musselshell County, 71.8% of individuals (1,632) out of the total population between 25 and 64 years of age (2,273) are in the labor force, with 2.9% or 47 of them being unemployed. The group with the highest labor force participation rate are those with the educational attainment of bachelor's degree or higher, with 90.6% or 384 individuals in the labor force. Within the labor force, individuals with bachelor's degree or higher education have the highest percentage of unemployment, with 12.2% or 47 of them being unemployed.
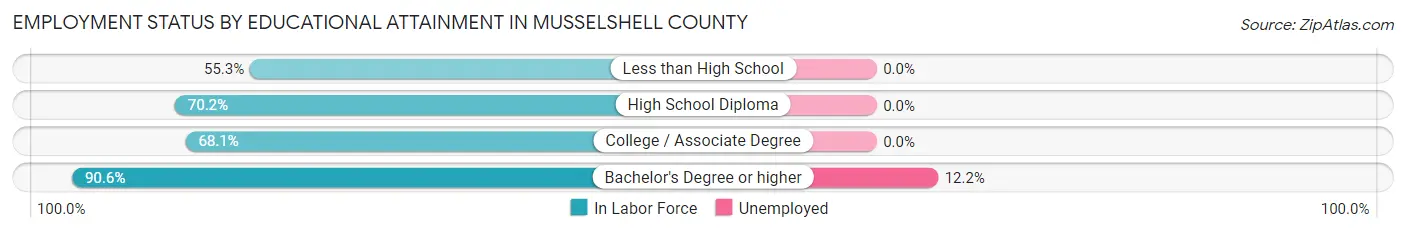
| Educational Attainment | In Labor Force | Unemployed |
| Less than High School | 130 (55.3%) | 0 (0.0%) |
| High School Diploma | 595 (70.2%) | 0 (0.0%) |
| College / Associate Degree | 522 (68.1%) | 0 (0.0%) |
| Bachelor's Degree or higher | 384 (90.6%) | 52 (12.2%) |
| Total | 1,632 (71.8%) | 66 (2.9%) |
Employment Occupations by Sex in Musselshell County
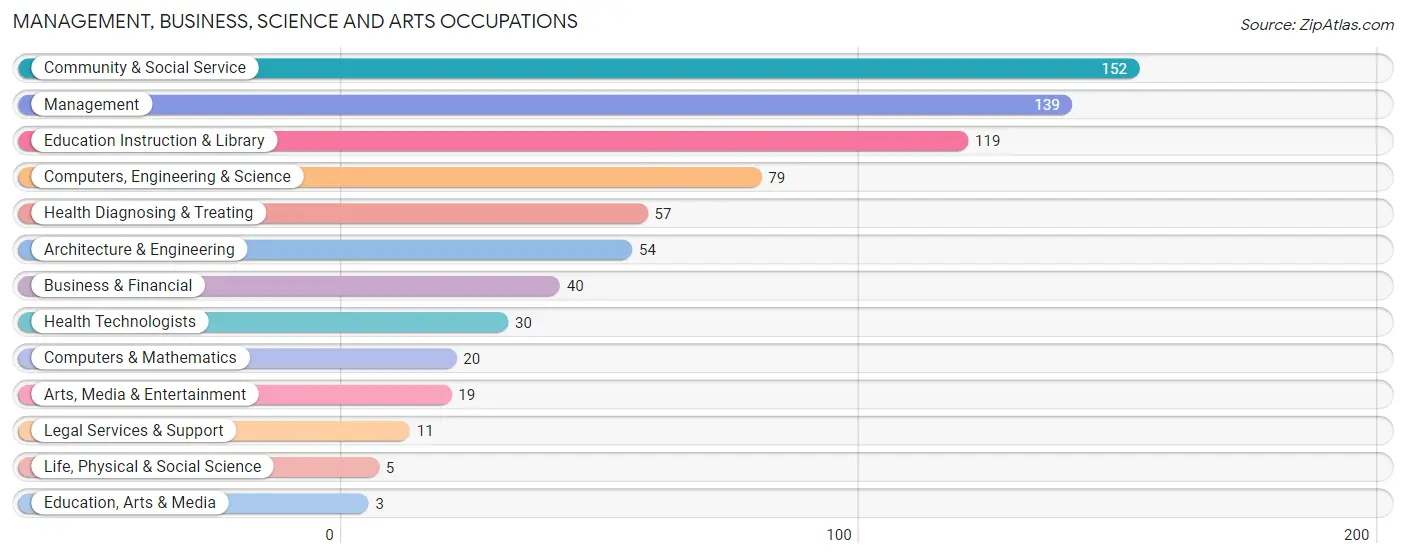
Management, Business, Science and Arts Occupations
The most common Management, Business, Science and Arts occupations in Musselshell County are Community & Social Service (152 | 7.7%), Management (139 | 7.0%), Education Instruction & Library (119 | 6.0%), Computers, Engineering & Science (79 | 4.0%), and Health Diagnosing & Treating (57 | 2.9%).
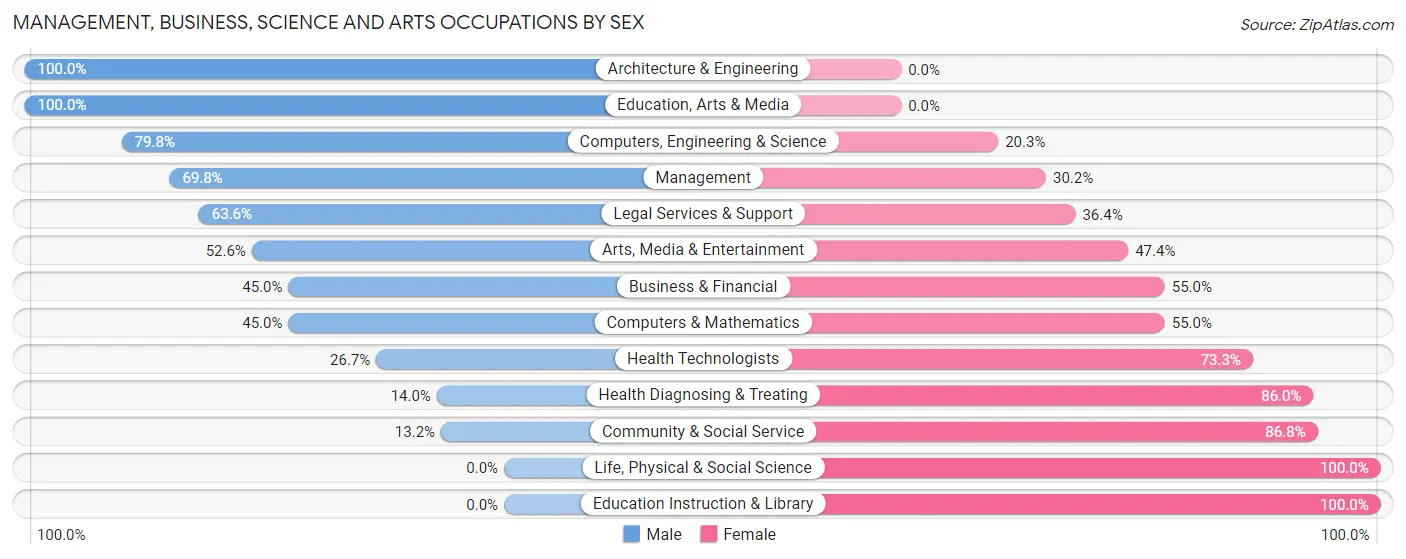
Management, Business, Science and Arts Occupations by Sex
Within the Management, Business, Science and Arts occupations in Musselshell County, the most male-oriented occupations are Architecture & Engineering (100.0%), Education, Arts & Media (100.0%), and Computers, Engineering & Science (79.7%), while the most female-oriented occupations are Life, Physical & Social Science (100.0%), Education Instruction & Library (100.0%), and Community & Social Service (86.8%).
| Occupation | Male | Female |
| Management | 97 (69.8%) | 42 (30.2%) |
| Business & Financial | 18 (45.0%) | 22 (55.0%) |
| Computers, Engineering & Science | 63 (79.7%) | 16 (20.3%) |
| Computers & Mathematics | 9 (45.0%) | 11 (55.0%) |
| Architecture & Engineering | 54 (100.0%) | 0 (0.0%) |
| Life, Physical & Social Science | 0 (0.0%) | 5 (100.0%) |
| Community & Social Service | 20 (13.2%) | 132 (86.8%) |
| Education, Arts & Media | 3 (100.0%) | 0 (0.0%) |
| Legal Services & Support | 7 (63.6%) | 4 (36.4%) |
| Education Instruction & Library | 0 (0.0%) | 119 (100.0%) |
| Arts, Media & Entertainment | 10 (52.6%) | 9 (47.4%) |
| Health Diagnosing & Treating | 8 (14.0%) | 49 (86.0%) |
| Health Technologists | 8 (26.7%) | 22 (73.3%) |
| Total (Category) | 206 (44.1%) | 261 (55.9%) |
| Total (Overall) | 1,025 (51.9%) | 950 (48.1%) |
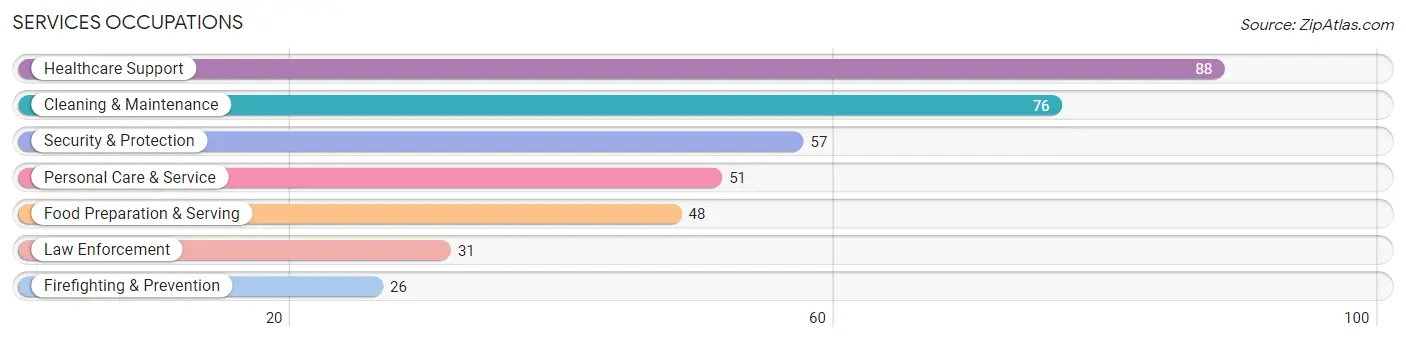
Services Occupations
The most common Services occupations in Musselshell County are Healthcare Support (88 | 4.5%), Cleaning & Maintenance (76 | 3.8%), Security & Protection (57 | 2.9%), Personal Care & Service (51 | 2.6%), and Food Preparation & Serving (48 | 2.4%).
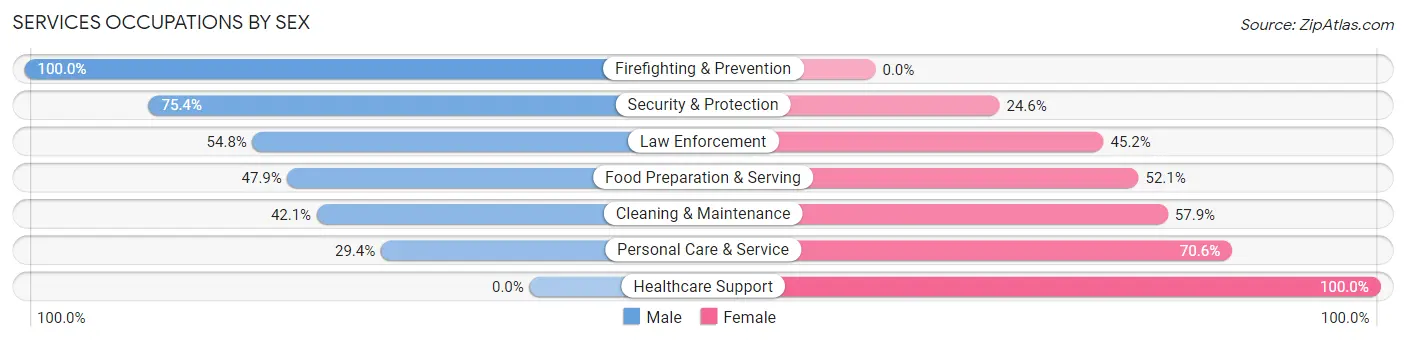
Services Occupations by Sex
Within the Services occupations in Musselshell County, the most male-oriented occupations are Firefighting & Prevention (100.0%), Security & Protection (75.4%), and Law Enforcement (54.8%), while the most female-oriented occupations are Healthcare Support (100.0%), Personal Care & Service (70.6%), and Cleaning & Maintenance (57.9%).
| Occupation | Male | Female |
| Healthcare Support | 0 (0.0%) | 88 (100.0%) |
| Security & Protection | 43 (75.4%) | 14 (24.6%) |
| Firefighting & Prevention | 26 (100.0%) | 0 (0.0%) |
| Law Enforcement | 17 (54.8%) | 14 (45.2%) |
| Food Preparation & Serving | 23 (47.9%) | 25 (52.1%) |
| Cleaning & Maintenance | 32 (42.1%) | 44 (57.9%) |
| Personal Care & Service | 15 (29.4%) | 36 (70.6%) |
| Total (Category) | 113 (35.3%) | 207 (64.7%) |
| Total (Overall) | 1,025 (51.9%) | 950 (48.1%) |
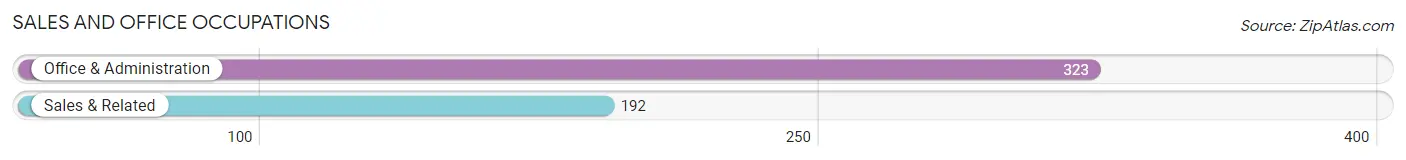
Sales and Office Occupations
The most common Sales and Office occupations in Musselshell County are Office & Administration (323 | 16.4%), and Sales & Related (192 | 9.7%).
Sales and Office Occupations by Sex
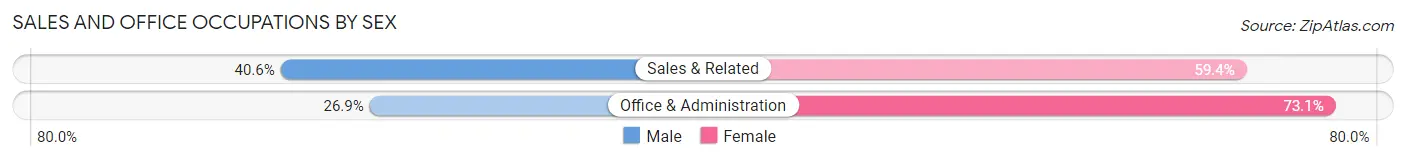
| Occupation | Male | Female |
| Sales & Related | 78 (40.6%) | 114 (59.4%) |
| Office & Administration | 87 (26.9%) | 236 (73.1%) |
| Total (Category) | 165 (32.0%) | 350 (68.0%) |
| Total (Overall) | 1,025 (51.9%) | 950 (48.1%) |
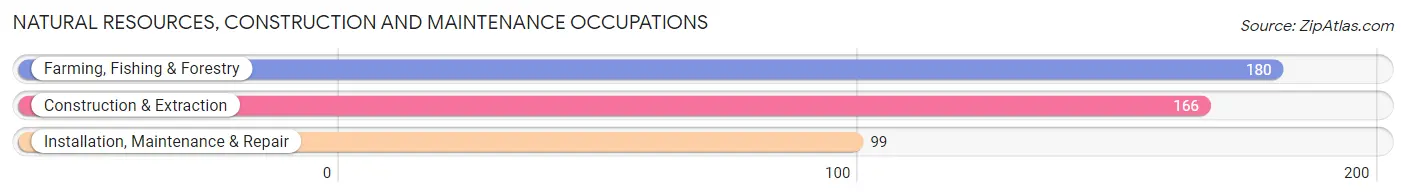
Natural Resources, Construction and Maintenance Occupations
The most common Natural Resources, Construction and Maintenance occupations in Musselshell County are Farming, Fishing & Forestry (180 | 9.1%), Construction & Extraction (166 | 8.4%), and Installation, Maintenance & Repair (99 | 5.0%).
Natural Resources, Construction and Maintenance Occupations by Sex
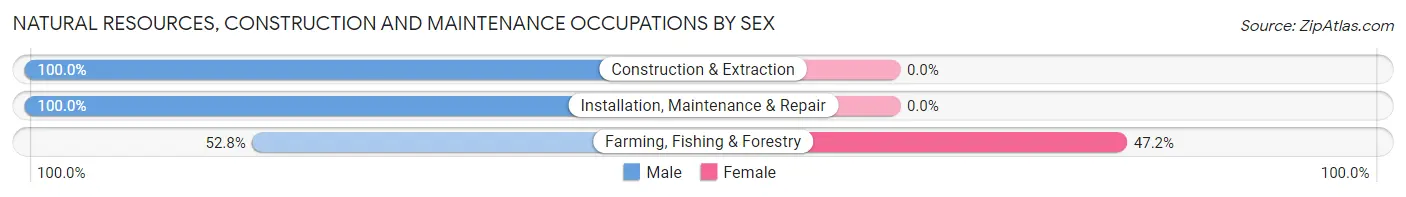
| Occupation | Male | Female |
| Farming, Fishing & Forestry | 95 (52.8%) | 85 (47.2%) |
| Construction & Extraction | 166 (100.0%) | 0 (0.0%) |
| Installation, Maintenance & Repair | 99 (100.0%) | 0 (0.0%) |
| Total (Category) | 360 (80.9%) | 85 (19.1%) |
| Total (Overall) | 1,025 (51.9%) | 950 (48.1%) |
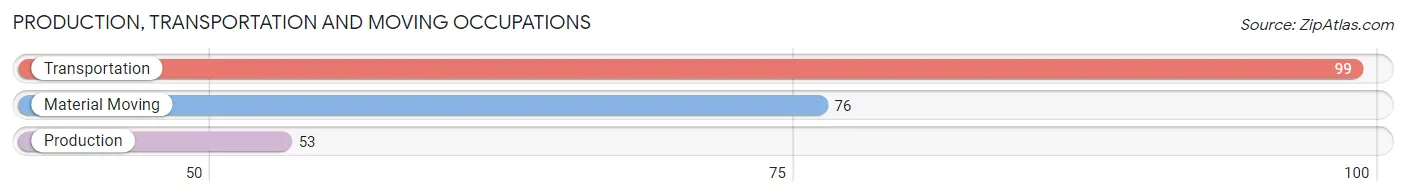
Production, Transportation and Moving Occupations
The most common Production, Transportation and Moving occupations in Musselshell County are Transportation (99 | 5.0%), Material Moving (76 | 3.8%), and Production (53 | 2.7%).
Production, Transportation and Moving Occupations by Sex
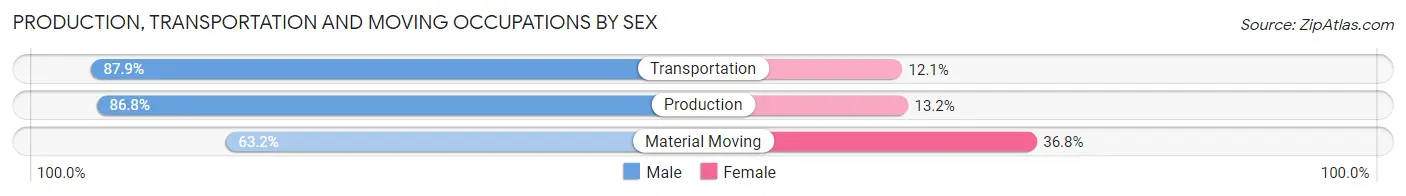
| Occupation | Male | Female |
| Production | 46 (86.8%) | 7 (13.2%) |
| Transportation | 87 (87.9%) | 12 (12.1%) |
| Material Moving | 48 (63.2%) | 28 (36.8%) |
| Total (Category) | 181 (79.4%) | 47 (20.6%) |
| Total (Overall) | 1,025 (51.9%) | 950 (48.1%) |
Employment Industries by Sex in Musselshell County
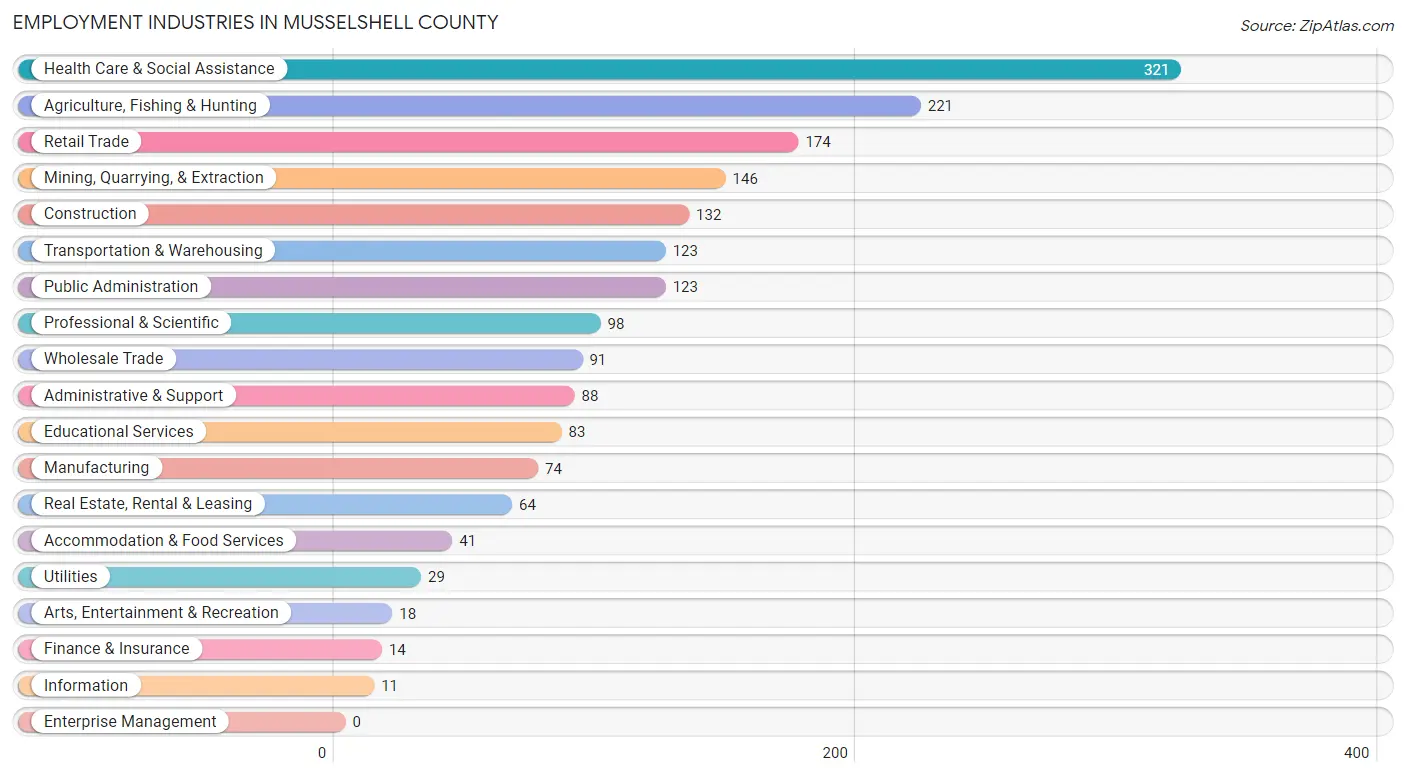
Employment Industries in Musselshell County
The major employment industries in Musselshell County include Health Care & Social Assistance (321 | 16.3%), Agriculture, Fishing & Hunting (221 | 11.2%), Retail Trade (174 | 8.8%), Mining, Quarrying, & Extraction (146 | 7.4%), and Construction (132 | 6.7%).
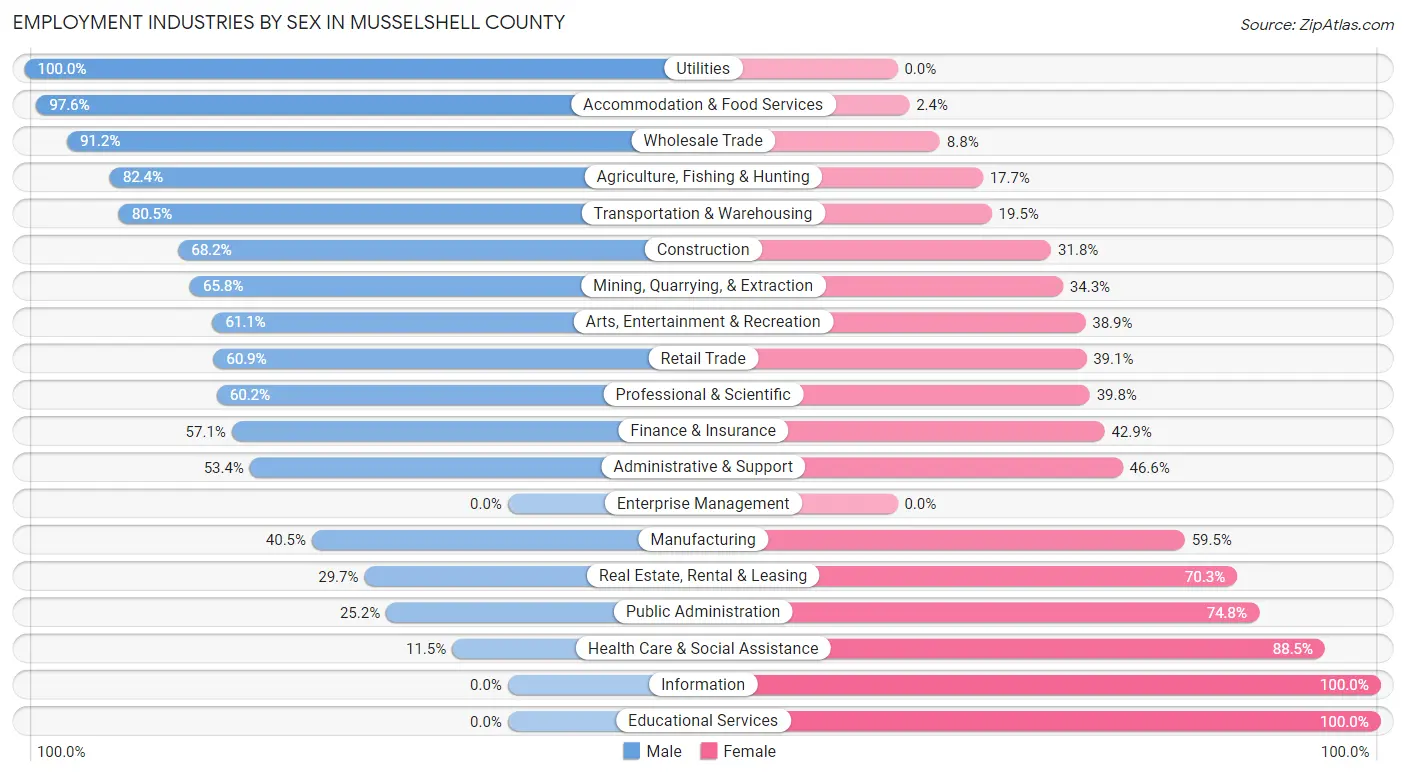
Employment Industries by Sex in Musselshell County
The Musselshell County industries that see more men than women are Utilities (100.0%), Accommodation & Food Services (97.6%), and Wholesale Trade (91.2%), whereas the industries that tend to have a higher number of women are Information (100.0%), Educational Services (100.0%), and Health Care & Social Assistance (88.5%).
| Industry | Male | Female |
| Agriculture, Fishing & Hunting | 182 (82.4%) | 39 (17.6%) |
| Mining, Quarrying, & Extraction | 96 (65.7%) | 50 (34.3%) |
| Construction | 90 (68.2%) | 42 (31.8%) |
| Manufacturing | 30 (40.5%) | 44 (59.5%) |
| Wholesale Trade | 83 (91.2%) | 8 (8.8%) |
| Retail Trade | 106 (60.9%) | 68 (39.1%) |
| Transportation & Warehousing | 99 (80.5%) | 24 (19.5%) |
| Utilities | 29 (100.0%) | 0 (0.0%) |
| Information | 0 (0.0%) | 11 (100.0%) |
| Finance & Insurance | 8 (57.1%) | 6 (42.9%) |
| Real Estate, Rental & Leasing | 19 (29.7%) | 45 (70.3%) |
| Professional & Scientific | 59 (60.2%) | 39 (39.8%) |
| Enterprise Management | 0 (0.0%) | 0 (0.0%) |
| Administrative & Support | 47 (53.4%) | 41 (46.6%) |
| Educational Services | 0 (0.0%) | 83 (100.0%) |
| Health Care & Social Assistance | 37 (11.5%) | 284 (88.5%) |
| Arts, Entertainment & Recreation | 11 (61.1%) | 7 (38.9%) |
| Accommodation & Food Services | 40 (97.6%) | 1 (2.4%) |
| Public Administration | 31 (25.2%) | 92 (74.8%) |
| Total | 1,025 (51.9%) | 950 (48.1%) |
Education in Musselshell County
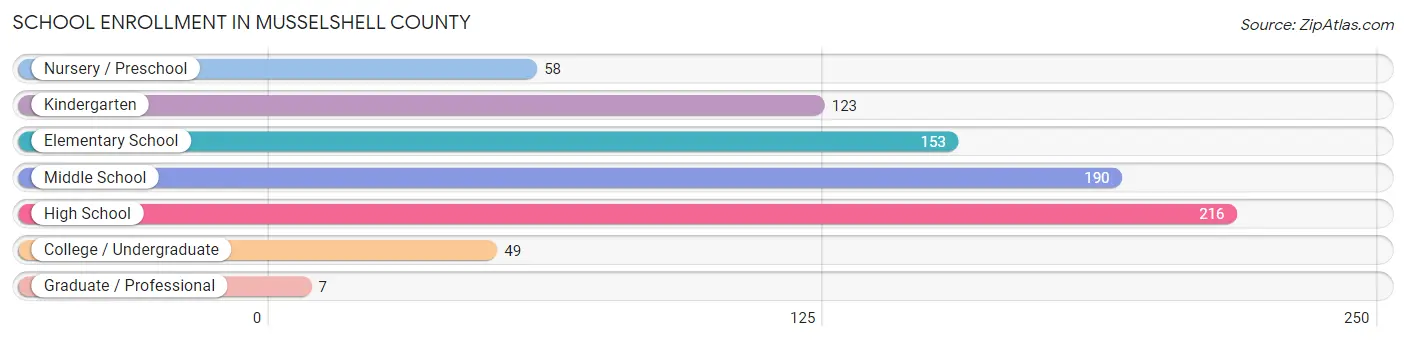
School Enrollment in Musselshell County
The most common levels of schooling among the 796 students in Musselshell County are high school (216 | 27.1%), middle school (190 | 23.9%), and elementary school (153 | 19.2%).
| School Level | # Students | % Students |
| Nursery / Preschool | 58 | 7.3% |
| Kindergarten | 123 | 15.4% |
| Elementary School | 153 | 19.2% |
| Middle School | 190 | 23.9% |
| High School | 216 | 27.1% |
| College / Undergraduate | 49 | 6.2% |
| Graduate / Professional | 7 | 0.9% |
| Total | 796 | 100.0% |
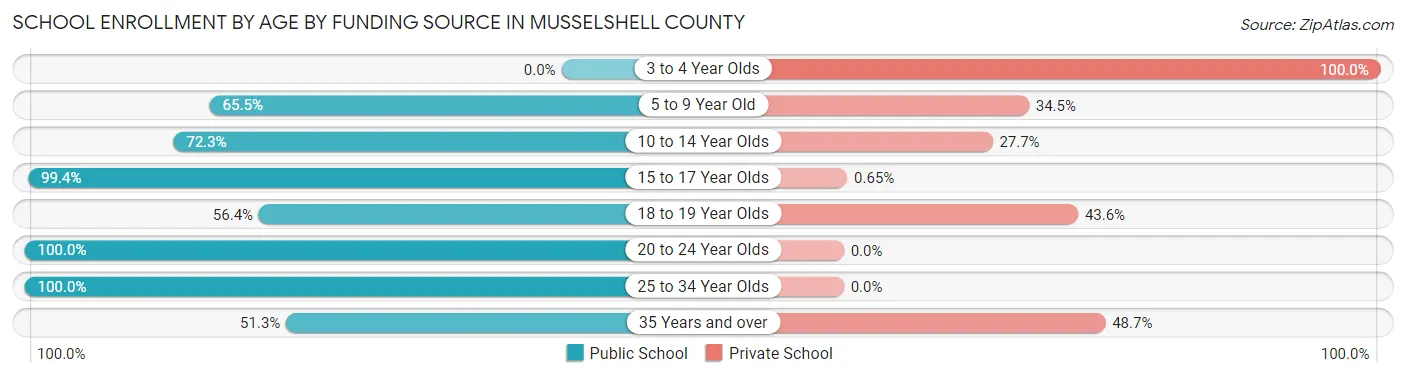
School Enrollment by Age by Funding Source in Musselshell County
Out of a total of 796 students who are enrolled in schools in Musselshell County, 244 (30.7%) attend a private institution, while the remaining 552 (69.3%) are enrolled in public schools. The age group of 3 to 4 year olds has the highest likelihood of being enrolled in private schools, with 51 (100.0% in the age bracket) enrolled. Conversely, the age group of 20 to 24 year olds has the lowest likelihood of being enrolled in a private school, with 8 (100.0% in the age bracket) attending a public institution.
| Age Bracket | Public School | Private School |
| 3 to 4 Year Olds | 0 (0.0%) | 51 (100.0%) |
| 5 to 9 Year Old | 152 (65.5%) | 80 (34.5%) |
| 10 to 14 Year Olds | 180 (72.3%) | 69 (27.7%) |
| 15 to 17 Year Olds | 152 (99.4%) | 1 (0.6%) |
| 18 to 19 Year Olds | 31 (56.4%) | 24 (43.6%) |
| 20 to 24 Year Olds | 8 (100.0%) | 0 (0.0%) |
| 25 to 34 Year Olds | 9 (100.0%) | 0 (0.0%) |
| 35 Years and over | 20 (51.3%) | 19 (48.7%) |
| Total | 552 (69.3%) | 244 (30.7%) |
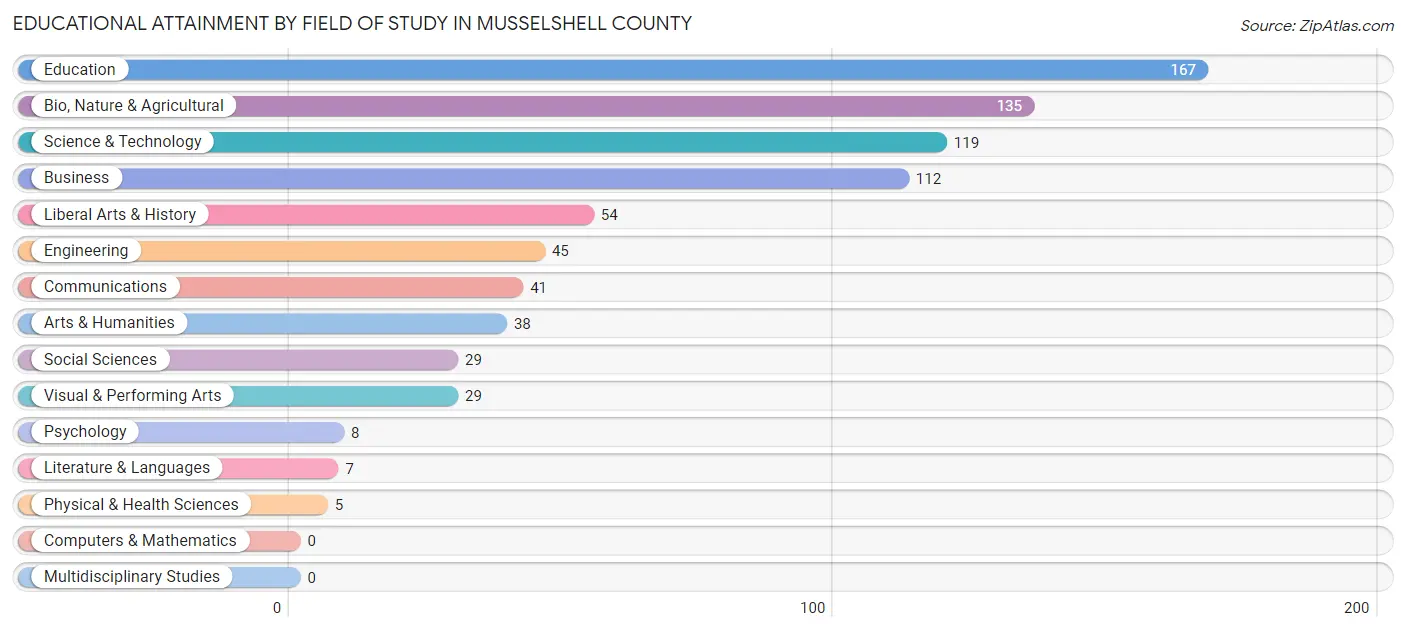
Educational Attainment by Field of Study in Musselshell County
Education (167 | 21.2%), bio, nature & agricultural (135 | 17.1%), science & technology (119 | 15.1%), business (112 | 14.2%), and liberal arts & history (54 | 6.8%) are the most common fields of study among 789 individuals in Musselshell County who have obtained a bachelor's degree or higher.
| Field of Study | # Graduates | % Graduates |
| Computers & Mathematics | 0 | 0.0% |
| Bio, Nature & Agricultural | 135 | 17.1% |
| Physical & Health Sciences | 5 | 0.6% |
| Psychology | 8 | 1.0% |
| Social Sciences | 29 | 3.7% |
| Engineering | 45 | 5.7% |
| Multidisciplinary Studies | 0 | 0.0% |
| Science & Technology | 119 | 15.1% |
| Business | 112 | 14.2% |
| Education | 167 | 21.2% |
| Literature & Languages | 7 | 0.9% |
| Liberal Arts & History | 54 | 6.8% |
| Visual & Performing Arts | 29 | 3.7% |
| Communications | 41 | 5.2% |
| Arts & Humanities | 38 | 4.8% |
| Total | 789 | 100.0% |
Transportation & Commute in Musselshell County
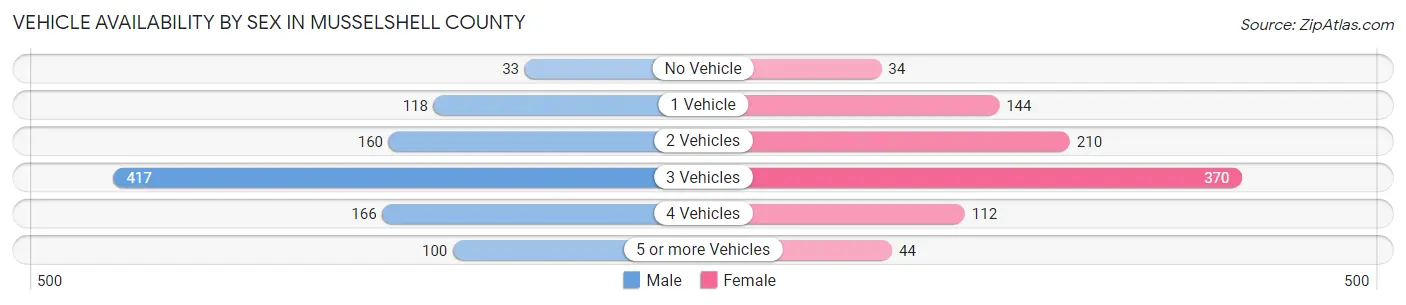
Vehicle Availability by Sex in Musselshell County
The most prevalent vehicle ownership categories in Musselshell County are males with 3 vehicles (417, accounting for 41.9%) and females with 3 vehicles (370, making up 45.6%).
| Vehicles Available | Male | Female |
| No Vehicle | 33 (3.3%) | 34 (3.7%) |
| 1 Vehicle | 118 (11.9%) | 144 (15.8%) |
| 2 Vehicles | 160 (16.1%) | 210 (23.0%) |
| 3 Vehicles | 417 (41.9%) | 370 (40.5%) |
| 4 Vehicles | 166 (16.7%) | 112 (12.2%) |
| 5 or more Vehicles | 100 (10.1%) | 44 (4.8%) |
| Total | 994 (100.0%) | 914 (100.0%) |
Commute Time in Musselshell County
The most frequently occuring commute durations in Musselshell County are 5 to 9 minutes (310 commuters, 19.2%), 60 to 89 minutes (255 commuters, 15.8%), and less than 5 minutes (239 commuters, 14.8%).
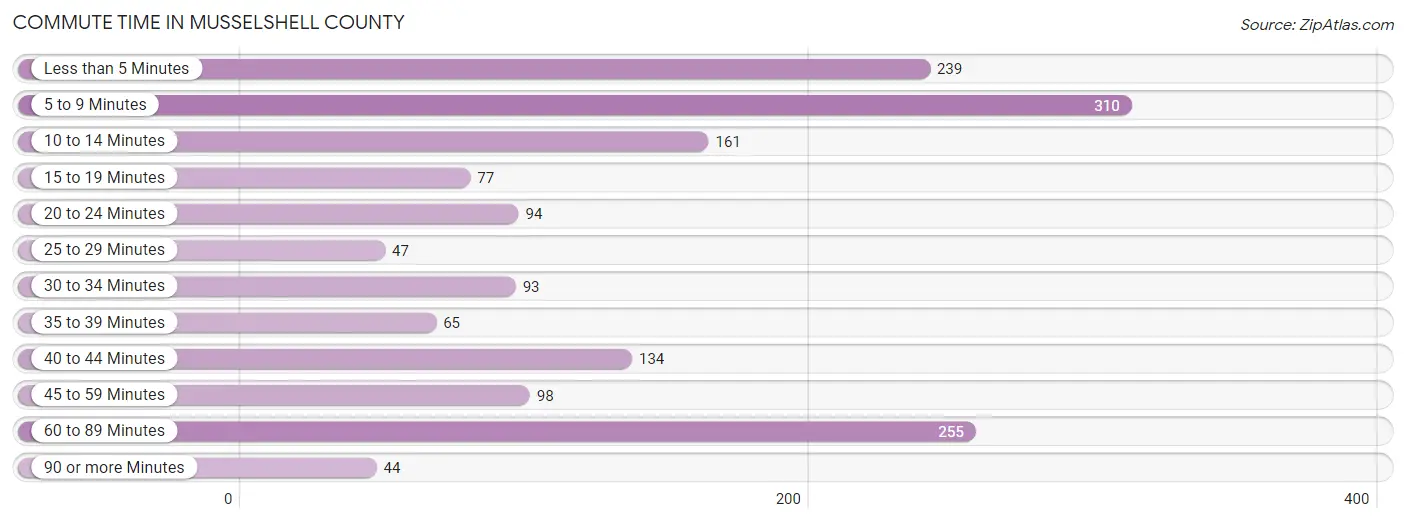
| Commute Time | # Commuters | % Commuters |
| Less than 5 Minutes | 239 | 14.8% |
| 5 to 9 Minutes | 310 | 19.2% |
| 10 to 14 Minutes | 161 | 10.0% |
| 15 to 19 Minutes | 77 | 4.8% |
| 20 to 24 Minutes | 94 | 5.8% |
| 25 to 29 Minutes | 47 | 2.9% |
| 30 to 34 Minutes | 93 | 5.8% |
| 35 to 39 Minutes | 65 | 4.0% |
| 40 to 44 Minutes | 134 | 8.3% |
| 45 to 59 Minutes | 98 | 6.1% |
| 60 to 89 Minutes | 255 | 15.8% |
| 90 or more Minutes | 44 | 2.7% |
Commute Time by Sex in Musselshell County
The most common commute times in Musselshell County are 60 to 89 minutes (208 commuters, 23.1%) for males and 5 to 9 minutes (140 commuters, 19.5%) for females.
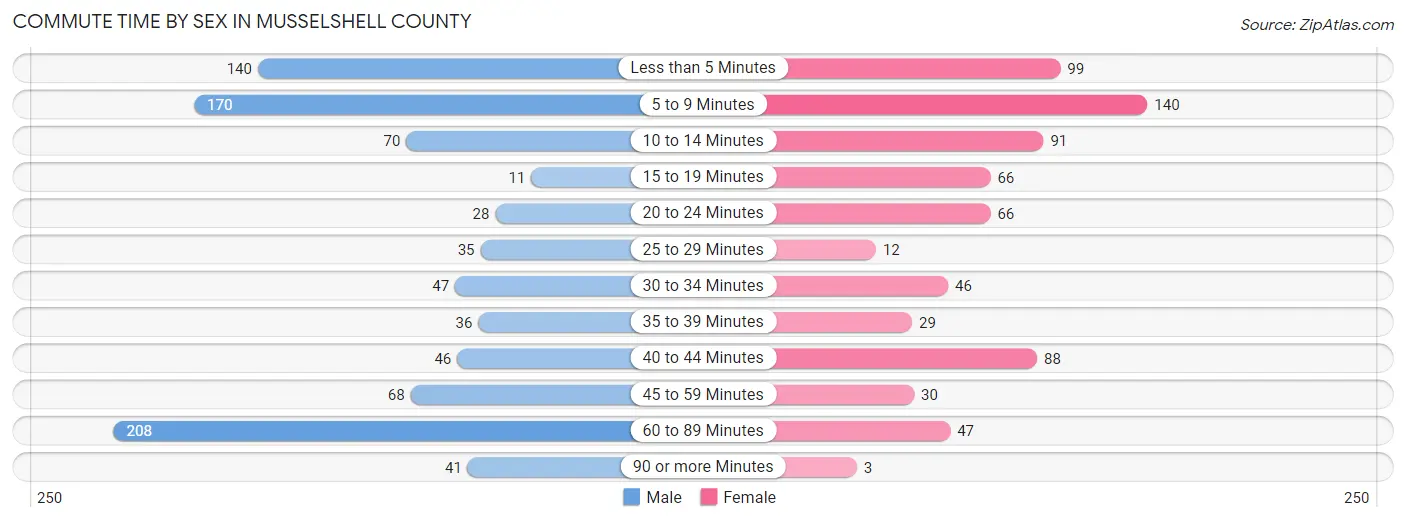
| Commute Time | Male | Female |
| Less than 5 Minutes | 140 (15.6%) | 99 (13.8%) |
| 5 to 9 Minutes | 170 (18.9%) | 140 (19.5%) |
| 10 to 14 Minutes | 70 (7.8%) | 91 (12.7%) |
| 15 to 19 Minutes | 11 (1.2%) | 66 (9.2%) |
| 20 to 24 Minutes | 28 (3.1%) | 66 (9.2%) |
| 25 to 29 Minutes | 35 (3.9%) | 12 (1.7%) |
| 30 to 34 Minutes | 47 (5.2%) | 46 (6.4%) |
| 35 to 39 Minutes | 36 (4.0%) | 29 (4.0%) |
| 40 to 44 Minutes | 46 (5.1%) | 88 (12.3%) |
| 45 to 59 Minutes | 68 (7.6%) | 30 (4.2%) |
| 60 to 89 Minutes | 208 (23.1%) | 47 (6.6%) |
| 90 or more Minutes | 41 (4.6%) | 3 (0.4%) |
Time of Departure to Work by Sex in Musselshell County
The most frequent times of departure to work in Musselshell County are 7:30 AM to 7:59 AM (151, 16.8%) for males and 7:30 AM to 7:59 AM (177, 24.7%) for females.
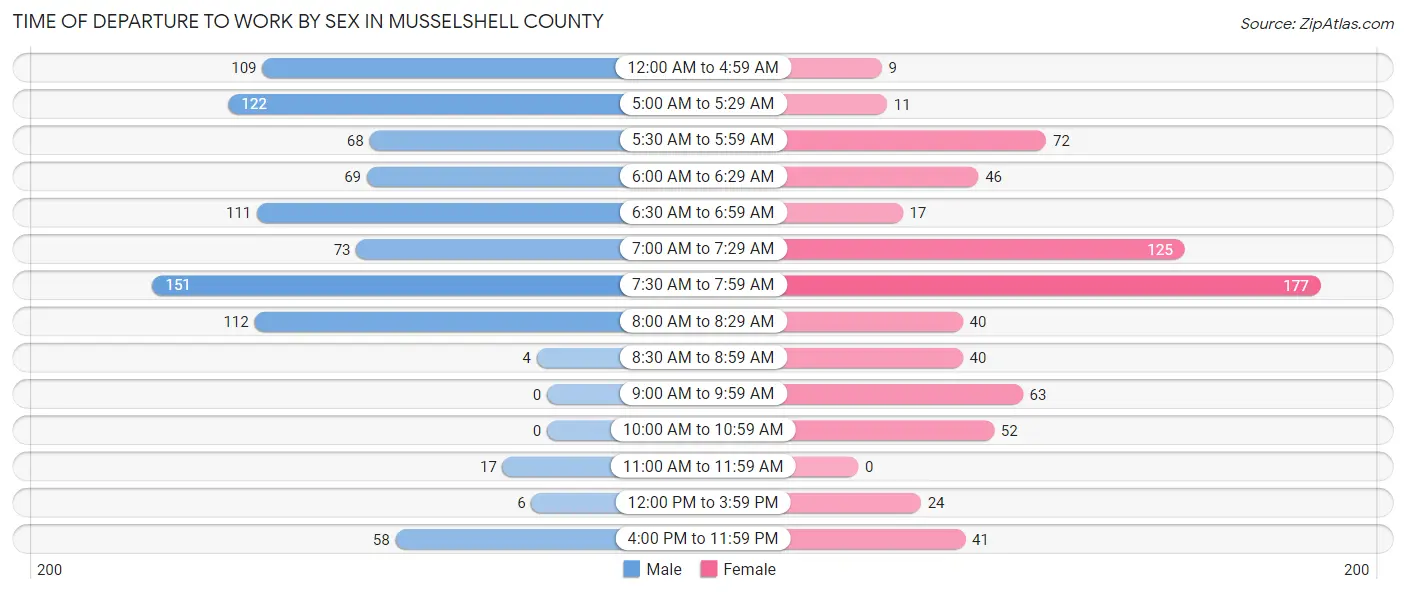
| Time of Departure | Male | Female |
| 12:00 AM to 4:59 AM | 109 (12.1%) | 9 (1.3%) |
| 5:00 AM to 5:29 AM | 122 (13.6%) | 11 (1.5%) |
| 5:30 AM to 5:59 AM | 68 (7.6%) | 72 (10.0%) |
| 6:00 AM to 6:29 AM | 69 (7.7%) | 46 (6.4%) |
| 6:30 AM to 6:59 AM | 111 (12.3%) | 17 (2.4%) |
| 7:00 AM to 7:29 AM | 73 (8.1%) | 125 (17.4%) |
| 7:30 AM to 7:59 AM | 151 (16.8%) | 177 (24.7%) |
| 8:00 AM to 8:29 AM | 112 (12.4%) | 40 (5.6%) |
| 8:30 AM to 8:59 AM | 4 (0.4%) | 40 (5.6%) |
| 9:00 AM to 9:59 AM | 0 (0.0%) | 63 (8.8%) |
| 10:00 AM to 10:59 AM | 0 (0.0%) | 52 (7.2%) |
| 11:00 AM to 11:59 AM | 17 (1.9%) | 0 (0.0%) |
| 12:00 PM to 3:59 PM | 6 (0.7%) | 24 (3.4%) |
| 4:00 PM to 11:59 PM | 58 (6.4%) | 41 (5.7%) |
| Total | 900 (100.0%) | 717 (100.0%) |
Housing Occupancy in Musselshell County
Occupancy by Ownership in Musselshell County
Of the total 2,137 dwellings in Musselshell County, owner-occupied units account for 1,727 (80.8%), while renter-occupied units make up 410 (19.2%).
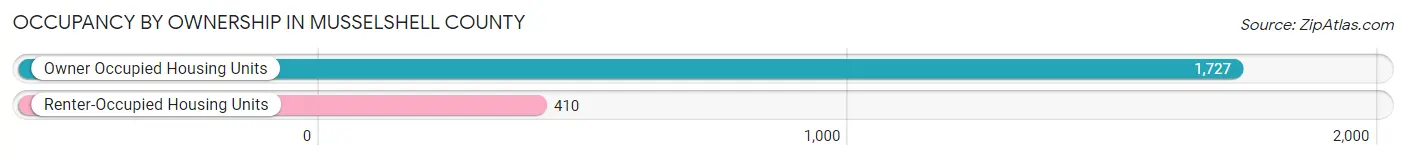
| Occupancy | # Housing Units | % Housing Units |
| Owner Occupied Housing Units | 1,727 | 80.8% |
| Renter-Occupied Housing Units | 410 | 19.2% |
| Total Occupied Housing Units | 2,137 | 100.0% |
Occupancy by Household Size in Musselshell County
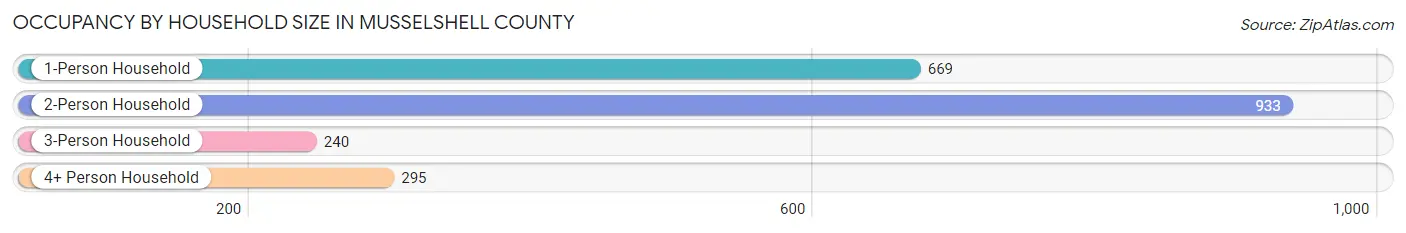
| Household Size | # Housing Units | % Housing Units |
| 1-Person Household | 669 | 31.3% |
| 2-Person Household | 933 | 43.7% |
| 3-Person Household | 240 | 11.2% |
| 4+ Person Household | 295 | 13.8% |
| Total Housing Units | 2,137 | 100.0% |
Occupancy by Ownership by Household Size in Musselshell County
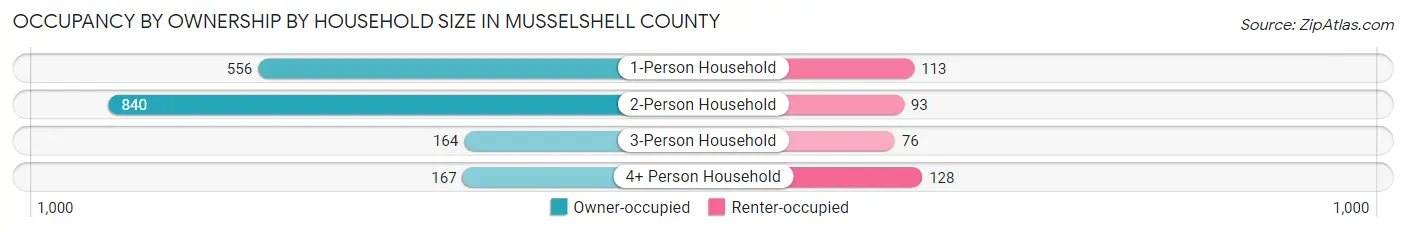
| Household Size | Owner-occupied | Renter-occupied |
| 1-Person Household | 556 (83.1%) | 113 (16.9%) |
| 2-Person Household | 840 (90.0%) | 93 (10.0%) |
| 3-Person Household | 164 (68.3%) | 76 (31.7%) |
| 4+ Person Household | 167 (56.6%) | 128 (43.4%) |
| Total Housing Units | 1,727 (80.8%) | 410 (19.2%) |
Occupancy by Educational Attainment in Musselshell County
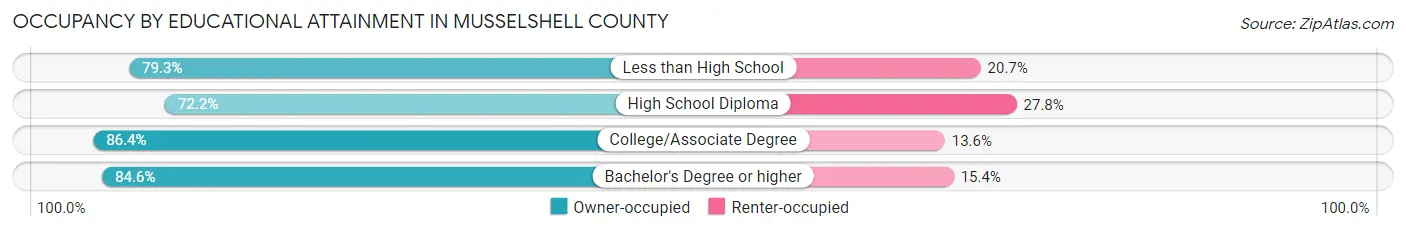
| Household Size | Owner-occupied | Renter-occupied |
| Less than High School | 157 (79.3%) | 41 (20.7%) |
| High School Diploma | 495 (72.2%) | 191 (27.8%) |
| College/Associate Degree | 717 (86.4%) | 113 (13.6%) |
| Bachelor's Degree or higher | 358 (84.6%) | 65 (15.4%) |
Occupancy by Age of Householder in Musselshell County
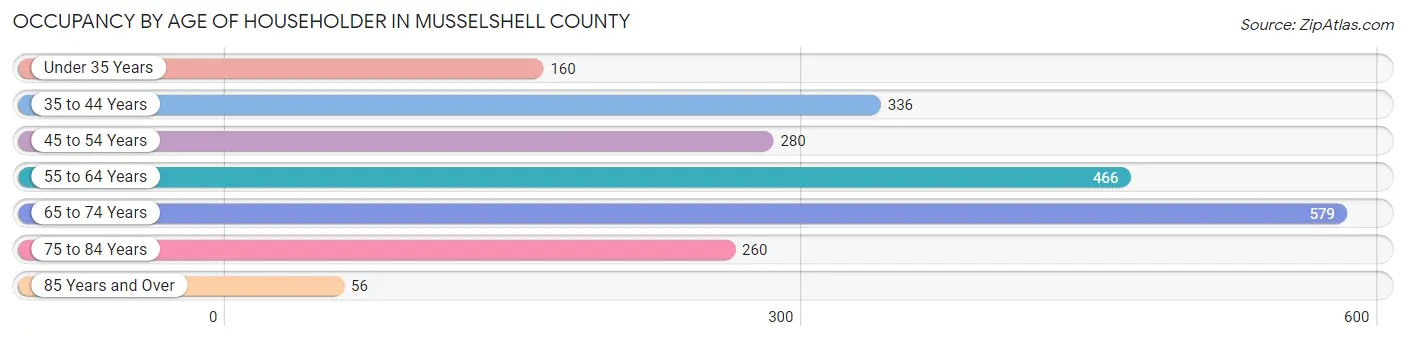
| Age Bracket | # Households | % Households |
| Under 35 Years | 160 | 7.5% |
| 35 to 44 Years | 336 | 15.7% |
| 45 to 54 Years | 280 | 13.1% |
| 55 to 64 Years | 466 | 21.8% |
| 65 to 74 Years | 579 | 27.1% |
| 75 to 84 Years | 260 | 12.2% |
| 85 Years and Over | 56 | 2.6% |
| Total | 2,137 | 100.0% |
Housing Finances in Musselshell County
Median Income by Occupancy in Musselshell County
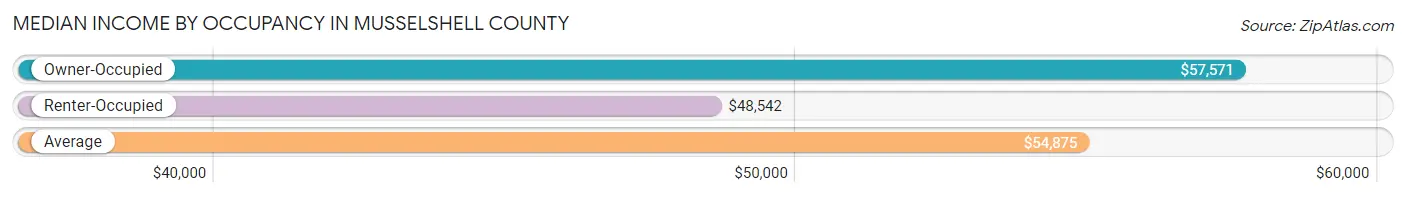
| Occupancy Type | # Households | Median Income |
| Owner-Occupied | 1,727 (80.8%) | $57,571 |
| Renter-Occupied | 410 (19.2%) | $48,542 |
| Average | 2,137 (100.0%) | $54,875 |
Occupancy by Householder Income Bracket in Musselshell County
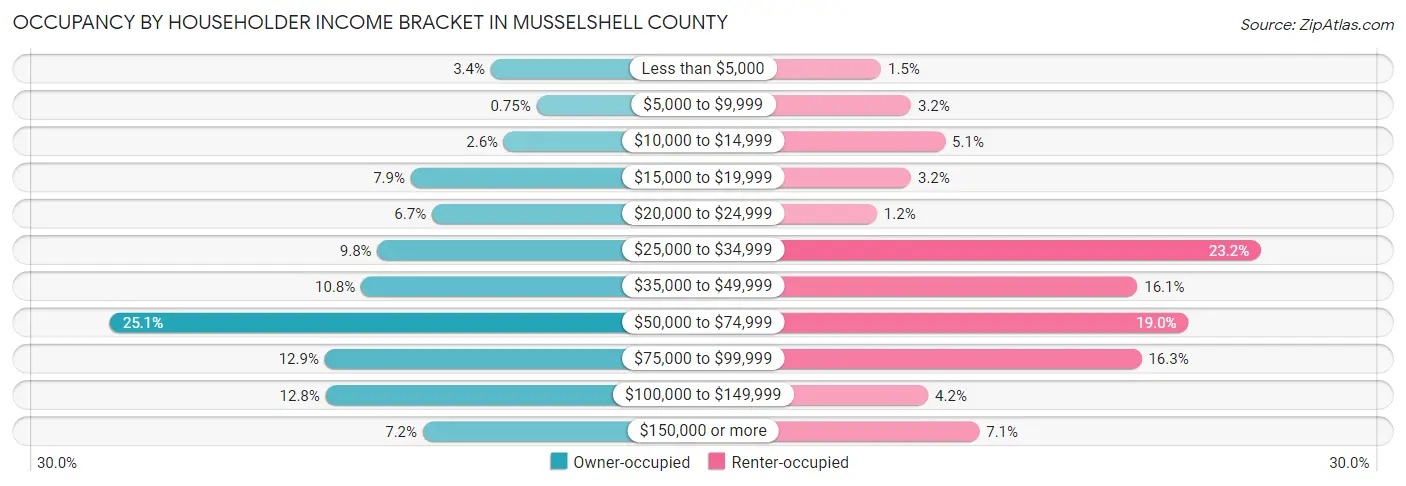
| Income Bracket | Owner-occupied | Renter-occupied |
| Less than $5,000 | 58 (3.4%) | 6 (1.5%) |
| $5,000 to $9,999 | 13 (0.7%) | 13 (3.2%) |
| $10,000 to $14,999 | 45 (2.6%) | 21 (5.1%) |
| $15,000 to $19,999 | 137 (7.9%) | 13 (3.2%) |
| $20,000 to $24,999 | 116 (6.7%) | 5 (1.2%) |
| $25,000 to $34,999 | 170 (9.8%) | 95 (23.2%) |
| $35,000 to $49,999 | 186 (10.8%) | 66 (16.1%) |
| $50,000 to $74,999 | 434 (25.1%) | 78 (19.0%) |
| $75,000 to $99,999 | 222 (12.9%) | 67 (16.3%) |
| $100,000 to $149,999 | 221 (12.8%) | 17 (4.2%) |
| $150,000 or more | 125 (7.2%) | 29 (7.1%) |
| Total | 1,727 (100.0%) | 410 (100.0%) |
Monthly Housing Cost Tiers in Musselshell County
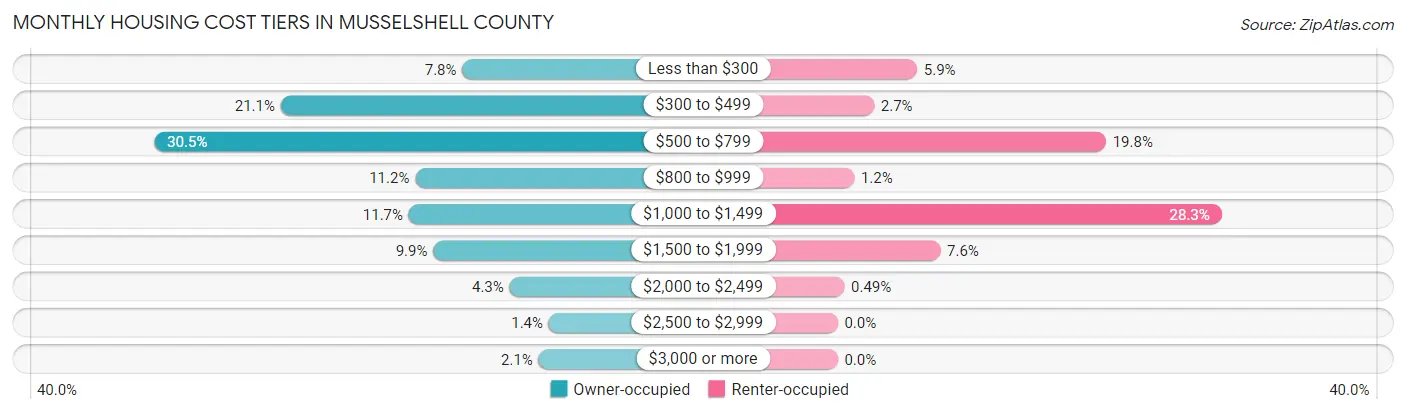
| Monthly Cost | Owner-occupied | Renter-occupied |
| Less than $300 | 134 (7.8%) | 24 (5.9%) |
| $300 to $499 | 365 (21.1%) | 11 (2.7%) |
| $500 to $799 | 526 (30.5%) | 81 (19.8%) |
| $800 to $999 | 194 (11.2%) | 5 (1.2%) |
| $1,000 to $1,499 | 202 (11.7%) | 116 (28.3%) |
| $1,500 to $1,999 | 171 (9.9%) | 31 (7.6%) |
| $2,000 to $2,499 | 74 (4.3%) | 2 (0.5%) |
| $2,500 to $2,999 | 24 (1.4%) | 0 (0.0%) |
| $3,000 or more | 37 (2.1%) | 0 (0.0%) |
| Total | 1,727 (100.0%) | 410 (100.0%) |
Physical Housing Characteristics in Musselshell County
Housing Structures in Musselshell County
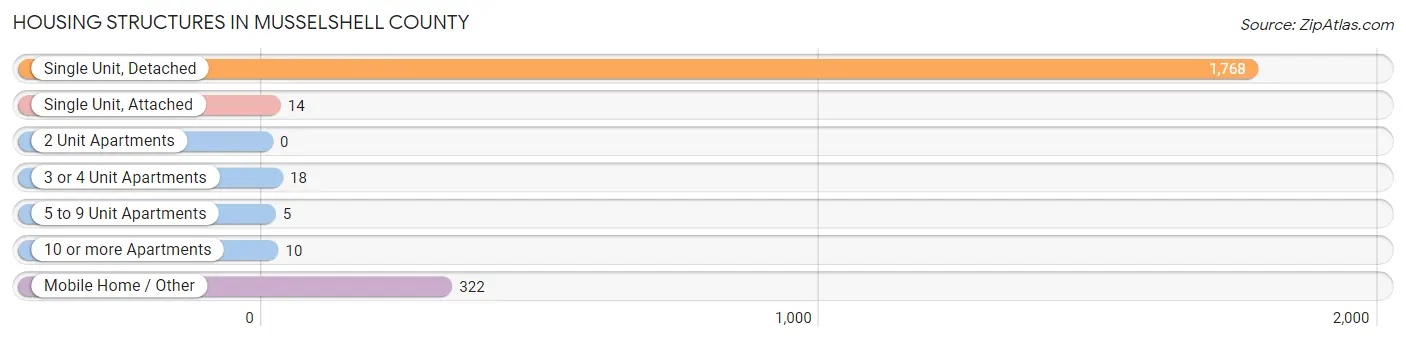
| Structure Type | # Housing Units | % Housing Units |
| Single Unit, Detached | 1,768 | 82.7% |
| Single Unit, Attached | 14 | 0.7% |
| 2 Unit Apartments | 0 | 0.0% |
| 3 or 4 Unit Apartments | 18 | 0.8% |
| 5 to 9 Unit Apartments | 5 | 0.2% |
| 10 or more Apartments | 10 | 0.5% |
| Mobile Home / Other | 322 | 15.1% |
| Total | 2,137 | 100.0% |
Housing Structures by Occupancy in Musselshell County
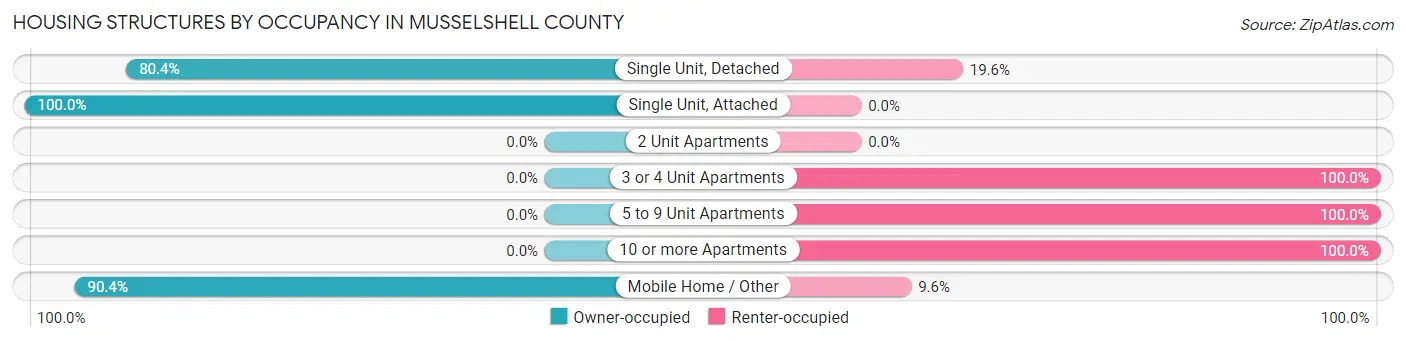
| Structure Type | Owner-occupied | Renter-occupied |
| Single Unit, Detached | 1,422 (80.4%) | 346 (19.6%) |
| Single Unit, Attached | 14 (100.0%) | 0 (0.0%) |
| 2 Unit Apartments | 0 (0.0%) | 0 (0.0%) |
| 3 or 4 Unit Apartments | 0 (0.0%) | 18 (100.0%) |
| 5 to 9 Unit Apartments | 0 (0.0%) | 5 (100.0%) |
| 10 or more Apartments | 0 (0.0%) | 10 (100.0%) |
| Mobile Home / Other | 291 (90.4%) | 31 (9.6%) |
| Total | 1,727 (80.8%) | 410 (19.2%) |
Housing Structures by Number of Rooms in Musselshell County
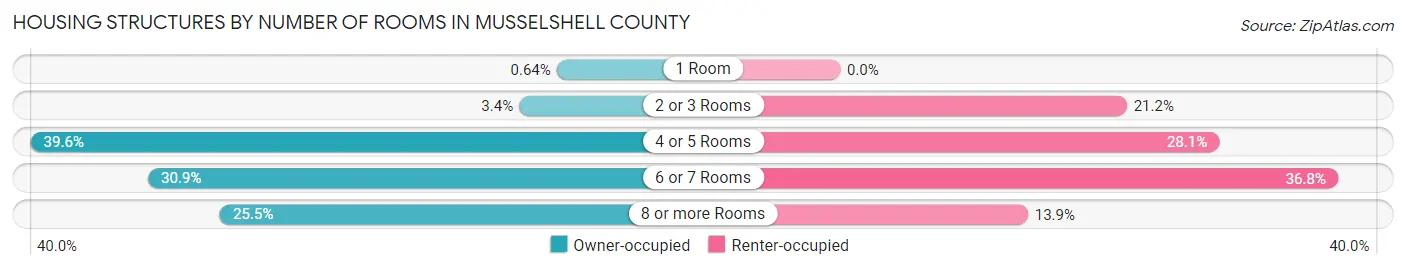
| Number of Rooms | Owner-occupied | Renter-occupied |
| 1 Room | 11 (0.6%) | 0 (0.0%) |
| 2 or 3 Rooms | 59 (3.4%) | 87 (21.2%) |
| 4 or 5 Rooms | 683 (39.6%) | 115 (28.1%) |
| 6 or 7 Rooms | 533 (30.9%) | 151 (36.8%) |
| 8 or more Rooms | 441 (25.5%) | 57 (13.9%) |
| Total | 1,727 (100.0%) | 410 (100.0%) |
Housing Structure by Heating Type in Musselshell County
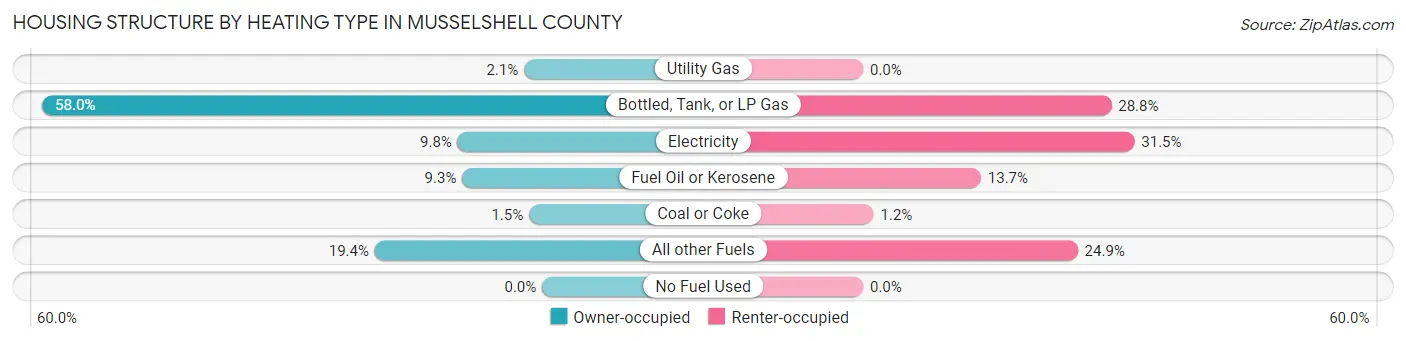
| Heating Type | Owner-occupied | Renter-occupied |
| Utility Gas | 36 (2.1%) | 0 (0.0%) |
| Bottled, Tank, or LP Gas | 1,001 (58.0%) | 118 (28.8%) |
| Electricity | 169 (9.8%) | 129 (31.5%) |
| Fuel Oil or Kerosene | 160 (9.3%) | 56 (13.7%) |
| Coal or Coke | 26 (1.5%) | 5 (1.2%) |
| All other Fuels | 335 (19.4%) | 102 (24.9%) |
| No Fuel Used | 0 (0.0%) | 0 (0.0%) |
| Total | 1,727 (100.0%) | 410 (100.0%) |
Household Vehicle Usage in Musselshell County
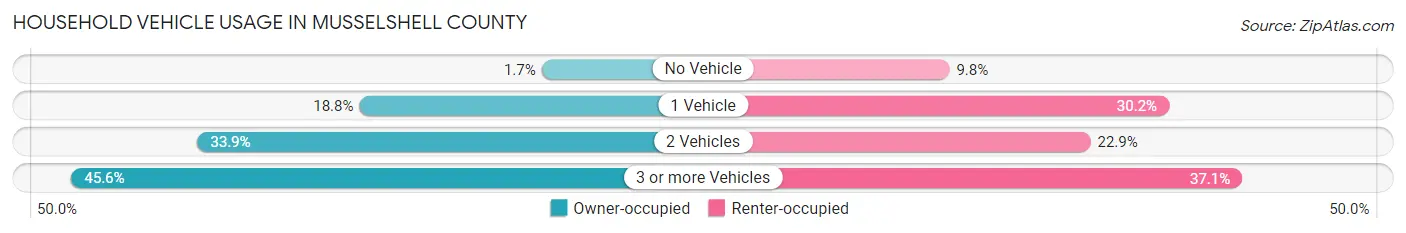
| Vehicles per Household | Owner-occupied | Renter-occupied |
| No Vehicle | 30 (1.7%) | 40 (9.8%) |
| 1 Vehicle | 324 (18.8%) | 124 (30.2%) |
| 2 Vehicles | 585 (33.9%) | 94 (22.9%) |
| 3 or more Vehicles | 788 (45.6%) | 152 (37.1%) |
| Total | 1,727 (100.0%) | 410 (100.0%) |
Real Estate & Mortgages in Musselshell County
Real Estate and Mortgage Overview in Musselshell County
| Characteristic | Without Mortgage | With Mortgage |
| Housing Units | 1,005 | 722 |
| Median Property Value | $220,900 | $222,800 |
| Median Household Income | $47,091 | $86 |
| Monthly Housing Costs | $511 | $37 |
| Real Estate Taxes | $1,549 | $49 |
Property Value by Mortgage Status in Musselshell County
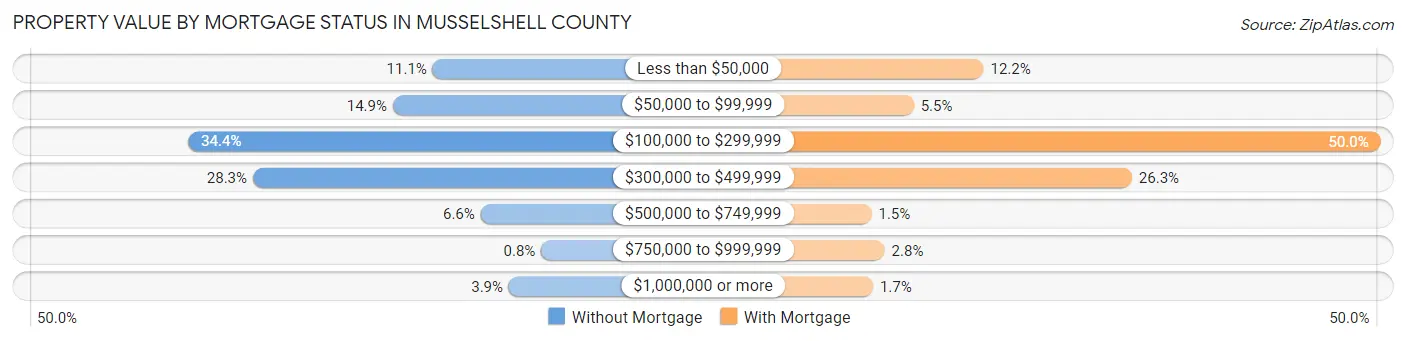
| Property Value | Without Mortgage | With Mortgage |
| Less than $50,000 | 112 (11.1%) | 88 (12.2%) |
| $50,000 to $99,999 | 150 (14.9%) | 40 (5.5%) |
| $100,000 to $299,999 | 346 (34.4%) | 361 (50.0%) |
| $300,000 to $499,999 | 284 (28.3%) | 190 (26.3%) |
| $500,000 to $749,999 | 66 (6.6%) | 11 (1.5%) |
| $750,000 to $999,999 | 8 (0.8%) | 20 (2.8%) |
| $1,000,000 or more | 39 (3.9%) | 12 (1.7%) |
| Total | 1,005 (100.0%) | 722 (100.0%) |
Household Income by Mortgage Status in Musselshell County
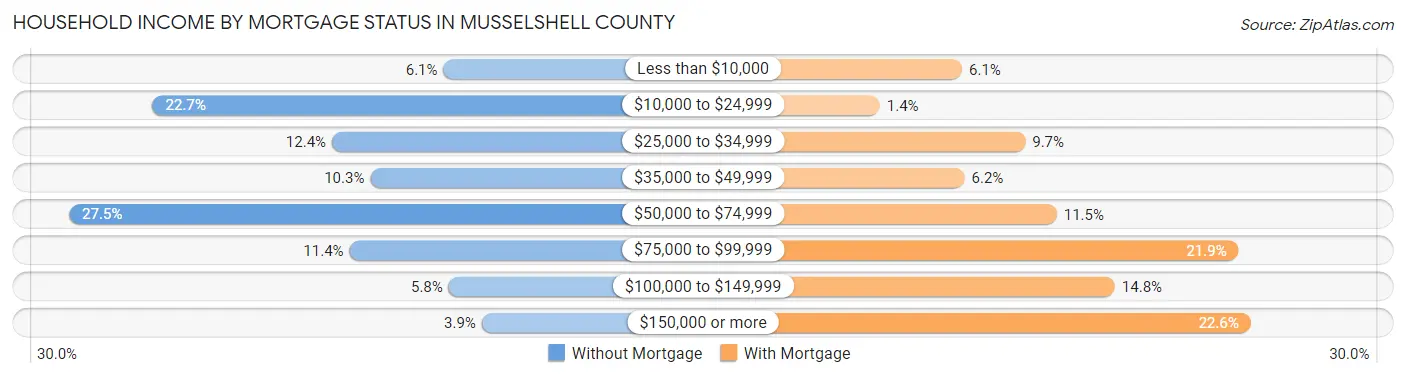
| Household Income | Without Mortgage | With Mortgage |
| Less than $10,000 | 61 (6.1%) | 44 (6.1%) |
| $10,000 to $24,999 | 228 (22.7%) | 10 (1.4%) |
| $25,000 to $34,999 | 125 (12.4%) | 70 (9.7%) |
| $35,000 to $49,999 | 103 (10.2%) | 45 (6.2%) |
| $50,000 to $74,999 | 276 (27.5%) | 83 (11.5%) |
| $75,000 to $99,999 | 115 (11.4%) | 158 (21.9%) |
| $100,000 to $149,999 | 58 (5.8%) | 107 (14.8%) |
| $150,000 or more | 39 (3.9%) | 163 (22.6%) |
| Total | 1,005 (100.0%) | 722 (100.0%) |
Property Value to Household Income Ratio in Musselshell County
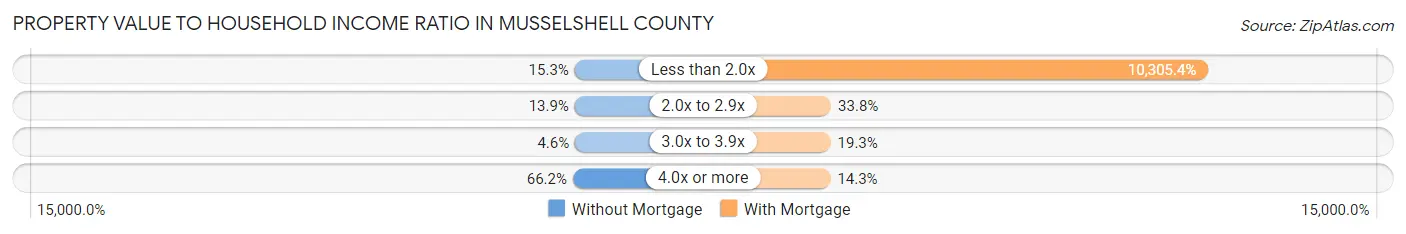
| Value-to-Income Ratio | Without Mortgage | With Mortgage |
| Less than 2.0x | 154 (15.3%) | 74,405 (10,305.4%) |
| 2.0x to 2.9x | 140 (13.9%) | 244 (33.8%) |
| 3.0x to 3.9x | 46 (4.6%) | 139 (19.3%) |
| 4.0x or more | 665 (66.2%) | 103 (14.3%) |
| Total | 1,005 (100.0%) | 722 (100.0%) |
Real Estate Taxes by Mortgage Status in Musselshell County
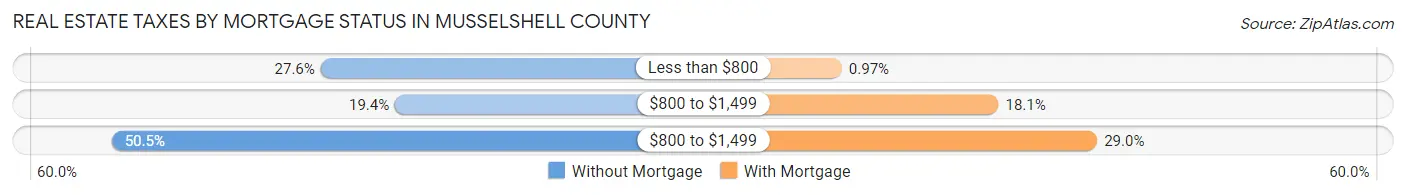
| Property Taxes | Without Mortgage | With Mortgage |
| Less than $800 | 277 (27.6%) | 7 (1.0%) |
| $800 to $1,499 | 195 (19.4%) | 131 (18.1%) |
| $800 to $1,499 | 507 (50.4%) | 209 (28.9%) |
| Total | 1,005 (100.0%) | 722 (100.0%) |
Health & Disability in Musselshell County
Health Insurance Coverage by Age in Musselshell County
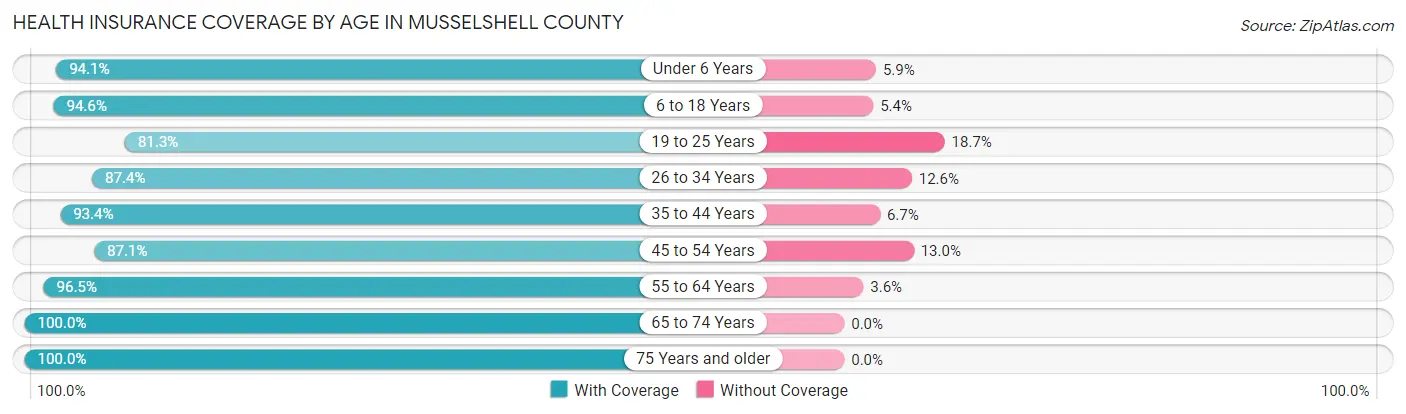
| Age Bracket | With Coverage | Without Coverage |
| Under 6 Years | 223 (94.1%) | 14 (5.9%) |
| 6 to 18 Years | 718 (94.6%) | 41 (5.4%) |
| 19 to 25 Years | 239 (81.3%) | 55 (18.7%) |
| 26 to 34 Years | 250 (87.4%) | 36 (12.6%) |
| 35 to 44 Years | 477 (93.3%) | 34 (6.7%) |
| 45 to 54 Years | 511 (87.1%) | 76 (13.0%) |
| 55 to 64 Years | 788 (96.5%) | 29 (3.5%) |
| 65 to 74 Years | 911 (100.0%) | 0 (0.0%) |
| 75 Years and older | 491 (100.0%) | 0 (0.0%) |
| Total | 4,608 (94.2%) | 285 (5.8%) |
Health Insurance Coverage by Citizenship Status in Musselshell County
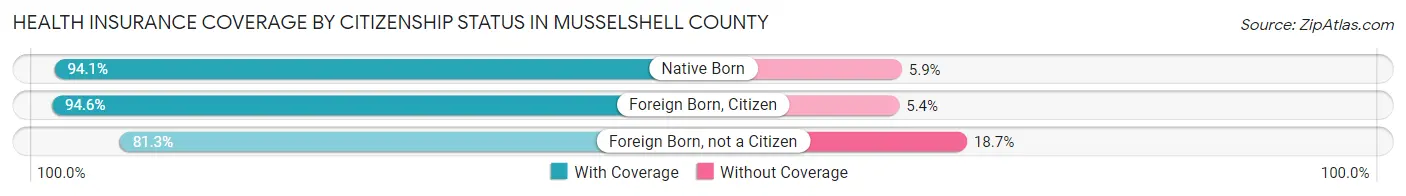
| Citizenship Status | With Coverage | Without Coverage |
| Native Born | 223 (94.1%) | 14 (5.9%) |
| Foreign Born, Citizen | 718 (94.6%) | 41 (5.4%) |
| Foreign Born, not a Citizen | 239 (81.3%) | 55 (18.7%) |
Health Insurance Coverage by Household Income in Musselshell County
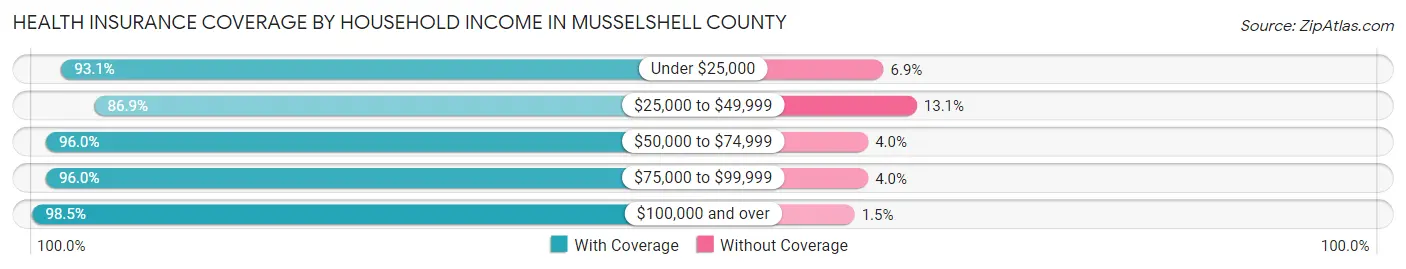
| Household Income | With Coverage | Without Coverage |
| Under $25,000 | 526 (93.1%) | 39 (6.9%) |
| $25,000 to $49,999 | 953 (86.9%) | 144 (13.1%) |
| $50,000 to $74,999 | 1,122 (96.0%) | 47 (4.0%) |
| $75,000 to $99,999 | 929 (96.0%) | 39 (4.0%) |
| $100,000 and over | 1,067 (98.5%) | 16 (1.5%) |
Public vs Private Health Insurance Coverage by Age in Musselshell County
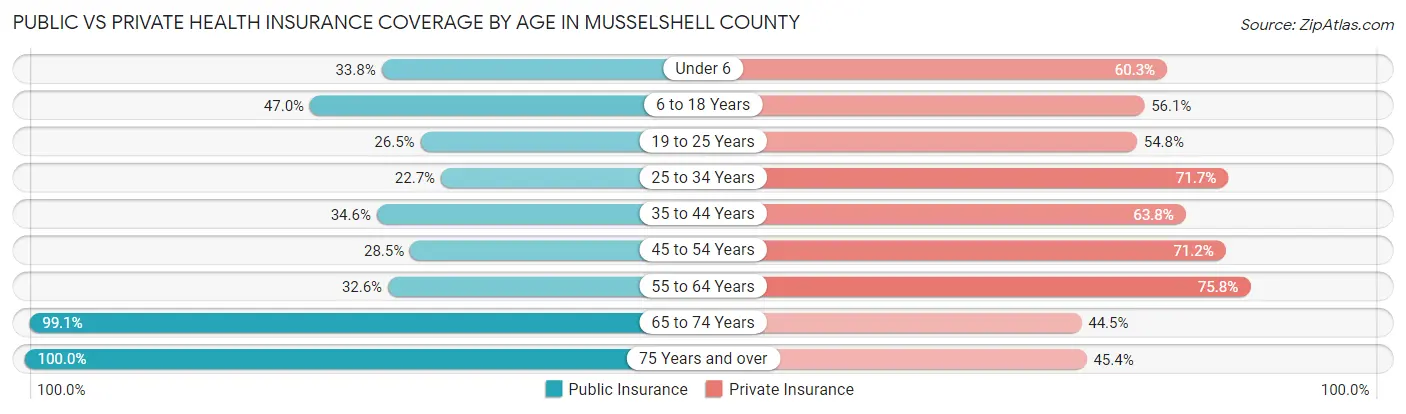
| Age Bracket | Public Insurance | Private Insurance |
| Under 6 | 80 (33.8%) | 143 (60.3%) |
| 6 to 18 Years | 357 (47.0%) | 426 (56.1%) |
| 19 to 25 Years | 78 (26.5%) | 161 (54.8%) |
| 25 to 34 Years | 65 (22.7%) | 205 (71.7%) |
| 35 to 44 Years | 177 (34.6%) | 326 (63.8%) |
| 45 to 54 Years | 167 (28.4%) | 418 (71.2%) |
| 55 to 64 Years | 266 (32.6%) | 619 (75.8%) |
| 65 to 74 Years | 903 (99.1%) | 405 (44.5%) |
| 75 Years and over | 491 (100.0%) | 223 (45.4%) |
| Total | 2,584 (52.8%) | 2,926 (59.8%) |
Disability Status by Sex by Age in Musselshell County
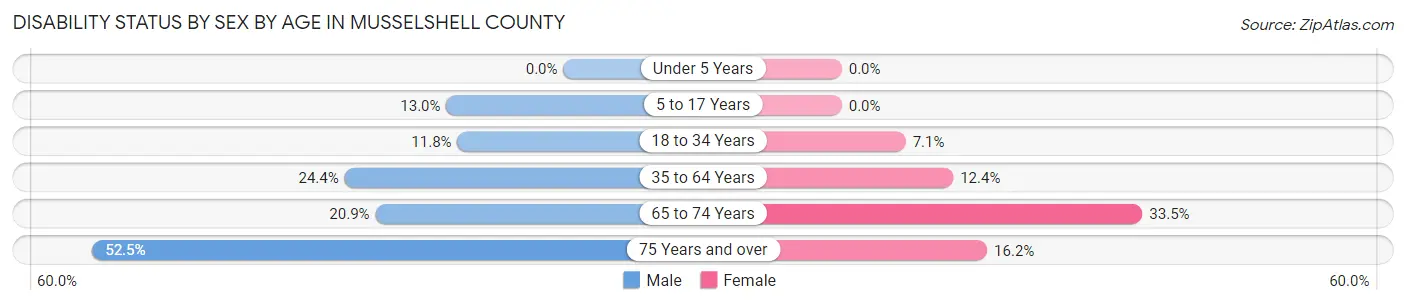
| Age Bracket | Male | Female |
| Under 5 Years | 0 (0.0%) | 0 (0.0%) |
| 5 to 17 Years | 52 (13.0%) | 0 (0.0%) |
| 18 to 34 Years | 38 (11.8%) | 24 (7.1%) |
| 35 to 64 Years | 233 (24.4%) | 119 (12.4%) |
| 65 to 74 Years | 95 (20.9%) | 153 (33.5%) |
| 75 Years and over | 128 (52.5%) | 40 (16.2%) |
Disability Class by Sex by Age in Musselshell County
Disability Class: Hearing Difficulty
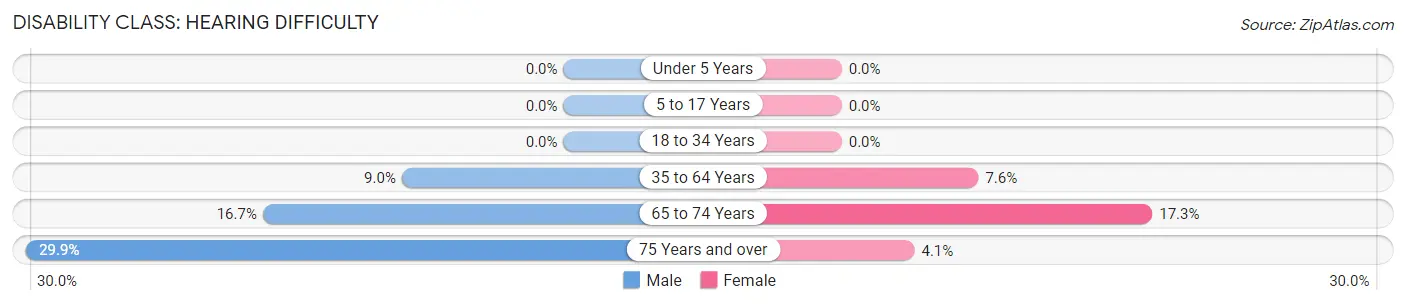
| Age Bracket | Male | Female |
| Under 5 Years | 0 (0.0%) | 0 (0.0%) |
| 5 to 17 Years | 0 (0.0%) | 0 (0.0%) |
| 18 to 34 Years | 0 (0.0%) | 0 (0.0%) |
| 35 to 64 Years | 86 (9.0%) | 73 (7.6%) |
| 65 to 74 Years | 76 (16.7%) | 79 (17.3%) |
| 75 Years and over | 73 (29.9%) | 10 (4.1%) |
Disability Class: Vision Difficulty
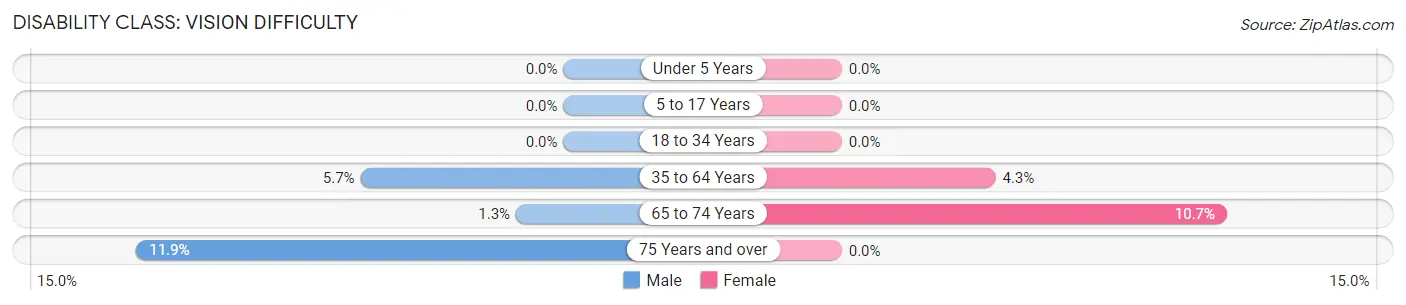
| Age Bracket | Male | Female |
| Under 5 Years | 0 (0.0%) | 0 (0.0%) |
| 5 to 17 Years | 0 (0.0%) | 0 (0.0%) |
| 18 to 34 Years | 0 (0.0%) | 0 (0.0%) |
| 35 to 64 Years | 54 (5.7%) | 41 (4.3%) |
| 65 to 74 Years | 6 (1.3%) | 49 (10.7%) |
| 75 Years and over | 29 (11.9%) | 0 (0.0%) |
Disability Class: Cognitive Difficulty
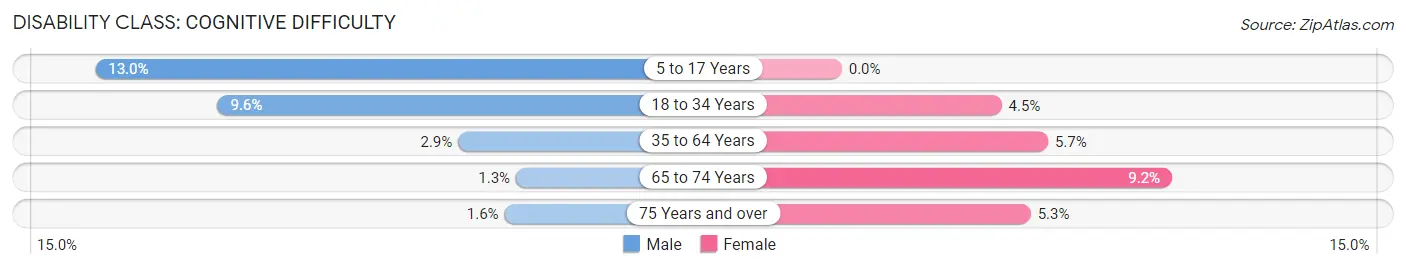
| Age Bracket | Male | Female |
| 5 to 17 Years | 52 (13.0%) | 0 (0.0%) |
| 18 to 34 Years | 31 (9.6%) | 15 (4.4%) |
| 35 to 64 Years | 28 (2.9%) | 55 (5.7%) |
| 65 to 74 Years | 6 (1.3%) | 42 (9.2%) |
| 75 Years and over | 4 (1.6%) | 13 (5.3%) |
Disability Class: Ambulatory Difficulty
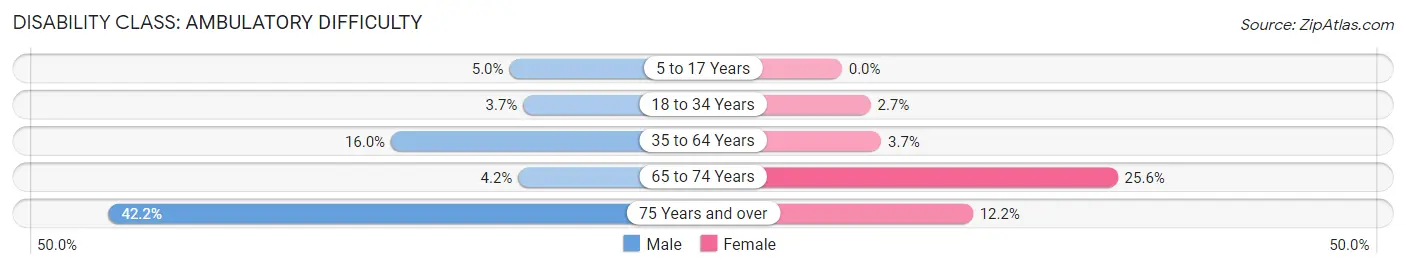
| Age Bracket | Male | Female |
| 5 to 17 Years | 20 (5.0%) | 0 (0.0%) |
| 18 to 34 Years | 12 (3.7%) | 9 (2.7%) |
| 35 to 64 Years | 153 (16.0%) | 35 (3.6%) |
| 65 to 74 Years | 19 (4.2%) | 117 (25.6%) |
| 75 Years and over | 103 (42.2%) | 30 (12.1%) |
Disability Class: Self-Care Difficulty
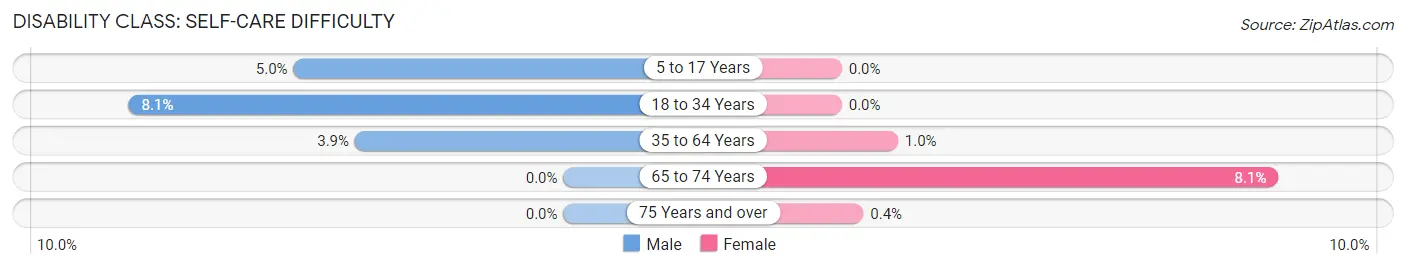
| Age Bracket | Male | Female |
| 5 to 17 Years | 20 (5.0%) | 0 (0.0%) |
| 18 to 34 Years | 26 (8.1%) | 0 (0.0%) |
| 35 to 64 Years | 37 (3.9%) | 10 (1.0%) |
| 65 to 74 Years | 0 (0.0%) | 37 (8.1%) |
| 75 Years and over | 0 (0.0%) | 1 (0.4%) |
Technology Access in Musselshell County
Computing Device Access in Musselshell County
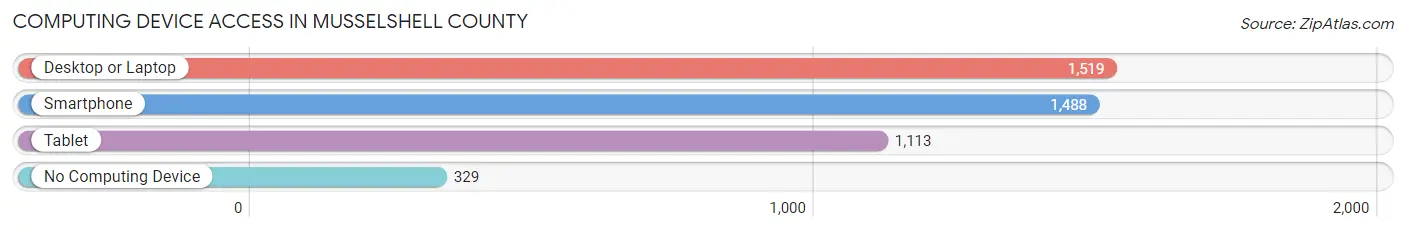
| Device Type | # Households | % Households |
| Desktop or Laptop | 1,519 | 71.1% |
| Smartphone | 1,488 | 69.6% |
| Tablet | 1,113 | 52.1% |
| No Computing Device | 329 | 15.4% |
| Total | 2,137 | 100.0% |
Internet Access in Musselshell County
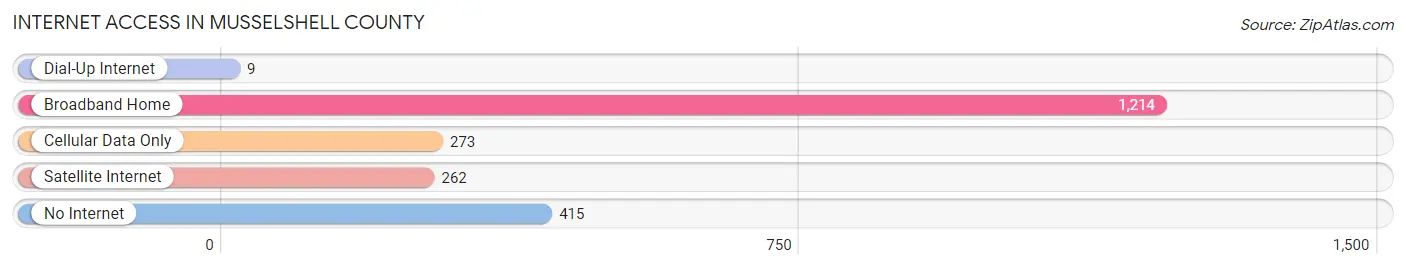
| Internet Type | # Households | % Households |
| Dial-Up Internet | 9 | 0.4% |
| Broadband Home | 1,214 | 56.8% |
| Cellular Data Only | 273 | 12.8% |
| Satellite Internet | 262 | 12.3% |
| No Internet | 415 | 19.4% |
| Total | 2,137 | 100.0% |
Musselshell County Summary
Musselshell County is located in the central part of Montana, and is bordered by Yellowstone County to the west, Golden Valley County to the north, Fergus County to the east, and Carbon County to the south. The county seat is Roundup, and the largest city is Billings. The county has a total area of 2,622 square miles, of which 2,619 square miles is land and 3 square miles is water.
History
Musselshell County was established in 1919, and was named after the Musselshell River, which runs through the county. The area was originally inhabited by the Crow and Sioux Native American tribes, and was later settled by ranchers and farmers in the late 1800s. The county was originally part of Yellowstone County, but was split off in 1919.
Geography
Musselshell County is located in the central part of Montana, and is bordered by Yellowstone County to the west, Golden Valley County to the north, Fergus County to the east, and Carbon County to the south. The county has a total area of 2,622 square miles, of which 2,619 square miles is land and 3 square miles is water. The county is mostly flat, with rolling hills in the east and south. The Musselshell River runs through the county, and there are several small lakes and reservoirs. The county is home to the Pryor Mountains, which are located in the south-central part of the county.
Economy
The economy of Musselshell County is largely based on agriculture and ranching. The county is home to several large cattle ranches, and the county is also a major producer of wheat, barley, and hay. The county also has a large oil and gas industry, and there are several oil and gas wells in the county. The county is also home to several coal mines, and there are several coal-fired power plants in the county.
Demographics
As of the 2010 census, there were 7,656 people, 2,945 households, and 2,072 families living in Musselshell County. The population density was 3 people per square mile. The racial makeup of the county was 95.3% White, 0.3% African American, 1.2% Native American, 0.3% Asian, 0.1% Pacific Islander, 0.7% from other races, and 2.1% from two or more races. Hispanic or Latino of any race were 2.7% of the population.
The median income for a household in the county was $37,917, and the median income for a family was $45,938. The per capita income for the county was $18,945. About 11.2% of families and 14.7% of the population were below the poverty line, including 19.2% of those under age 18 and 8.7% of those age 65 or over.
Common Questions
What is the Total Population of Musselshell County?
Total Population of Musselshell County is 4,924.
What is the Total Male Population of Musselshell County?
Total Male Population of Musselshell County is 2,487.
What is the Total Female Population of Musselshell County?
Total Female Population of Musselshell County is 2,437.
What is the Ratio of Males per 100 Females in Musselshell County?
There are 102.05 Males per 100 Females in Musselshell County.
What is the Ratio of Females per 100 Males in Musselshell County?
There are 97.99 Females per 100 Males in Musselshell County.
What is the Median Population Age in Musselshell County?
Median Population Age in Musselshell County is 52.0 Years.
What is the Average Family Size in Musselshell County
Average Family Size in Musselshell County is 2.8 People.
What is the Average Household Size in Musselshell County
Average Household Size in Musselshell County is 2.3 People.
What is Per Capita Income in Musselshell County?
Per Capita income in Musselshell County is $32,506.
What is the Median Family Income in Musselshell County?
Median Family Income in Musselshell County is $60,000.
What is the Median Household income in Musselshell County?
Median Household Income in Musselshell County is $54,875.
What is Income or Wage Gap in Musselshell County?
Income or Wage Gap in Musselshell County is 33.4%.
Women in Musselshell County earn 66.6 cents for every dollar earned by a man.
What is Family Income Deficit in Musselshell County?
Family Income Deficit in Musselshell County is $9,583.
Families that are below poverty line in Musselshell County earn $9,583 less on average than the poverty threshold level.
What is Inequality or Gini Index in Musselshell County?
Inequality or Gini Index in Musselshell County is 0.45.
How Large is the Labor Force in Musselshell County?
There are 2,077 People in the Labor Forcein in Musselshell County.
What is the Percentage of People in the Labor Force in Musselshell County?
50.4% of People are in the Labor Force in Musselshell County.
What is the Unemployment Rate in Musselshell County?
Unemployment Rate in Musselshell County is 4.9%.