Meagher County, MT
Meagher County Map
Meagher County Overview
1,948
TOTAL POPULATION
1,057
MALE POPULATION
891
FEMALE POPULATION
118.63
MALES / 100 FEMALES
84.30
FEMALES / 100 MALES
57.6
MEDIAN AGE
2.7
AVG FAMILY SIZE
2.3
AVG HOUSEHOLD SIZE
$37,498
PER CAPITA INCOME
$72,357
AVG FAMILY INCOME
$55,753
AVG HOUSEHOLD INCOME
33.0%
WAGE / INCOME GAP [ % ]
67.0¢/ $1
WAGE / INCOME GAP [ $ ]
$11,041
FAMILY INCOME DEFICIT
0.46
INEQUALITY / GINI INDEX
1,037
LABOR FORCE [ PEOPLE ]
61.1%
PERCENT IN LABOR FORCE
1.5%
UNEMPLOYMENT RATE
Meagher County Area Codes
Race in Meagher County
The most populous races in Meagher County are White / Caucasian (1,799 | 92.3%), Native / Alaskan (91 | 4.7%), and Two or more Races (51 | 2.6%).

| Race | # Population | % Population |
| Asian | 5 | 0.3% |
| Black / African American | 1 | 0.1% |
| Hawaiian / Pacific | 0 | 0.0% |
| Hispanic or Latino | 50 | 2.6% |
| Native / Alaskan | 91 | 4.7% |
| White / Caucasian | 1,799 | 92.3% |
| Two or more Races | 51 | 2.6% |
| Some other Race | 1 | 0.1% |
| Total | 1,948 | 100.0% |
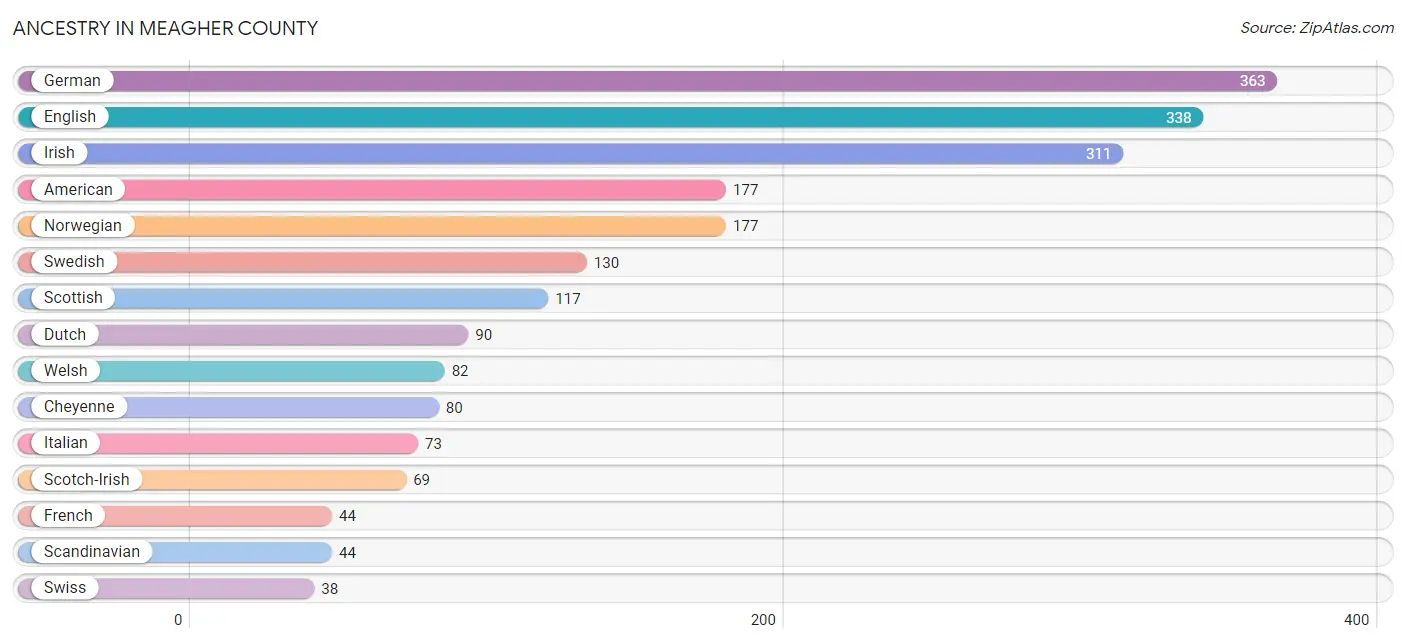
Ancestry in Meagher County
The most populous ancestries reported in Meagher County are German (363 | 18.6%), English (338 | 17.3%), Irish (311 | 16.0%), American (177 | 9.1%), and Norwegian (177 | 9.1%), together accounting for 70.1% of all Meagher County residents.
| Ancestry | # Population | % Population |
| American | 177 | 9.1% |
| Belgian | 20 | 1.0% |
| British | 1 | 0.1% |
| Canadian | 3 | 0.2% |
| Cherokee | 2 | 0.1% |
| Cheyenne | 80 | 4.1% |
| Colombian | 3 | 0.2% |
| Crow | 1 | 0.1% |
| Czech | 2 | 0.1% |
| Danish | 6 | 0.3% |
| Dutch | 90 | 4.6% |
| Eastern European | 1 | 0.1% |
| English | 338 | 17.3% |
| European | 23 | 1.2% |
| Finnish | 28 | 1.4% |
| French | 44 | 2.3% |
| German | 363 | 18.6% |
| Irish | 311 | 16.0% |
| Italian | 73 | 3.7% |
| Korean | 5 | 0.3% |
| Lithuanian | 12 | 0.6% |
| Northern European | 24 | 1.2% |
| Norwegian | 177 | 9.1% |
| Pennsylvania German | 3 | 0.2% |
| Polish | 34 | 1.8% |
| Puerto Rican | 10 | 0.5% |
| Russian | 2 | 0.1% |
| Scandinavian | 44 | 2.3% |
| Scotch-Irish | 69 | 3.5% |
| Scottish | 117 | 6.0% |
| Sioux | 8 | 0.4% |
| Slovak | 9 | 0.5% |
| South American | 3 | 0.2% |
| Spaniard | 12 | 0.6% |
| Spanish | 25 | 1.3% |
| Swedish | 130 | 6.7% |
| Swiss | 38 | 1.9% |
| Welsh | 82 | 4.2% | View All 38 Rows |
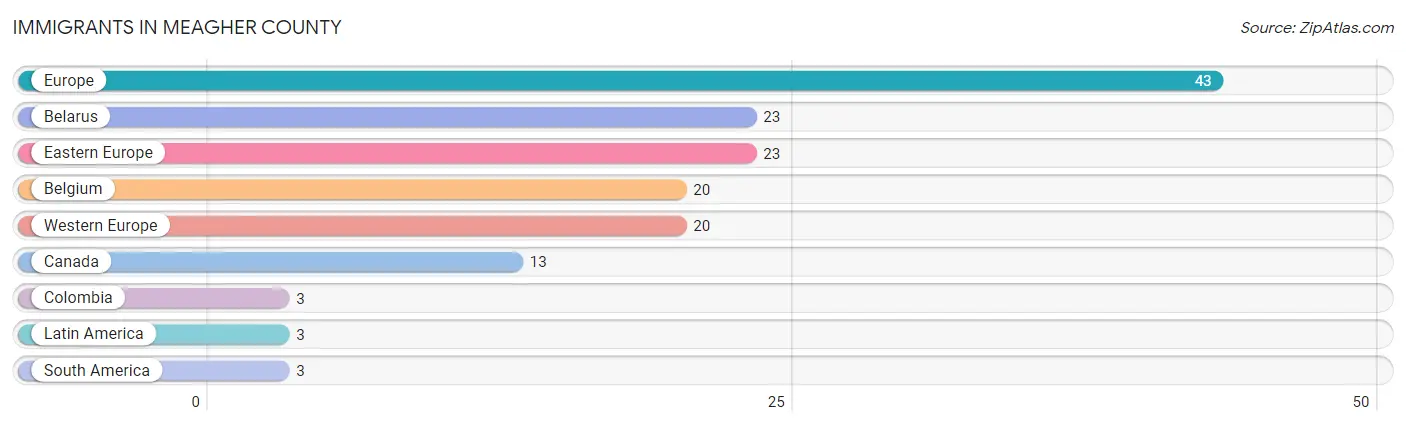
Immigrants in Meagher County
The most numerous immigrant groups reported in Meagher County came from Europe (43 | 2.2%), Belarus (23 | 1.2%), Eastern Europe (23 | 1.2%), Belgium (20 | 1.0%), and Western Europe (20 | 1.0%), together accounting for 6.6% of all Meagher County residents.
| Immigration Origin | # Population | % Population |
| Belarus | 23 | 1.2% |
| Belgium | 20 | 1.0% |
| Canada | 13 | 0.7% |
| Colombia | 3 | 0.2% |
| Eastern Europe | 23 | 1.2% |
| Europe | 43 | 2.2% |
| Latin America | 3 | 0.2% |
| South America | 3 | 0.2% |
| Western Europe | 20 | 1.0% | View All 9 Rows |
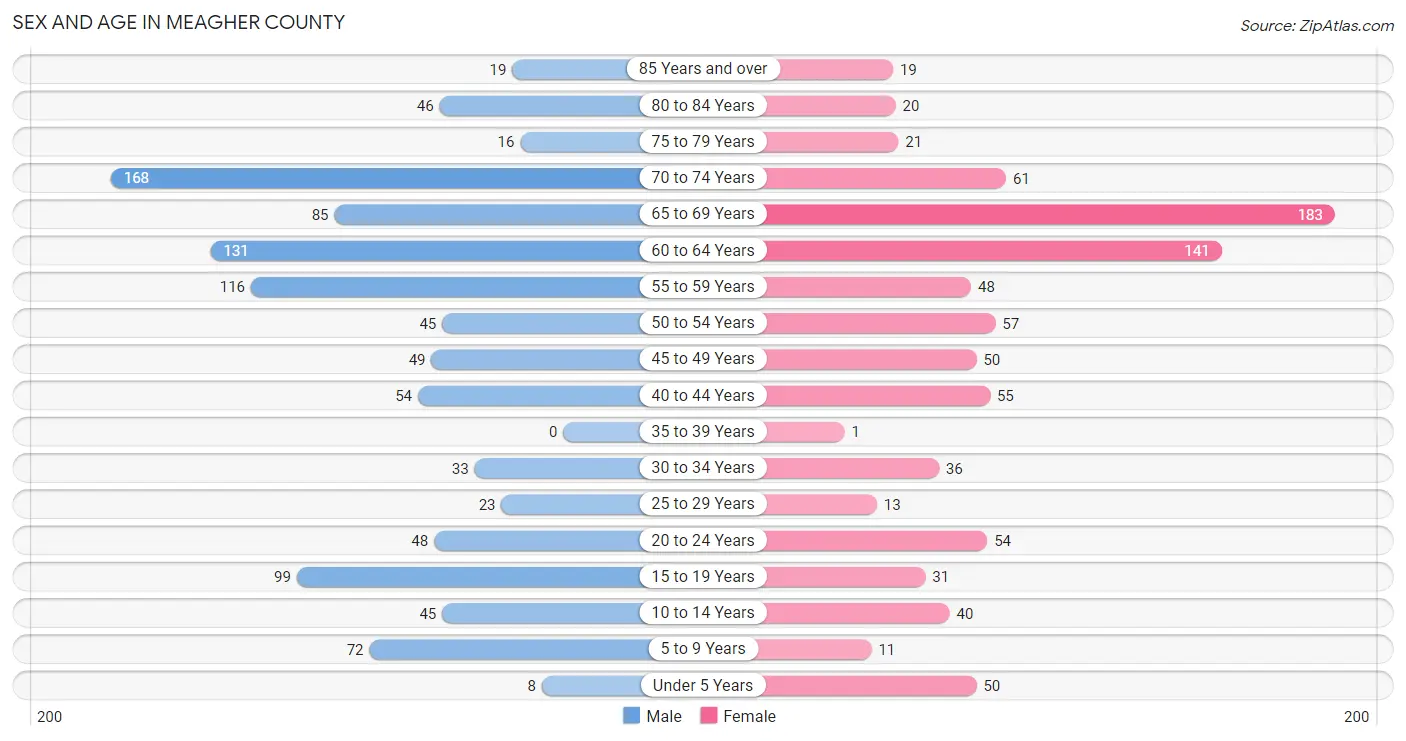
Sex and Age in Meagher County
Sex and Age in Meagher County
The most populous age groups in Meagher County are 70 to 74 Years (168 | 15.9%) for men and 65 to 69 Years (183 | 20.5%) for women.
| Age Bracket | Male | Female |
| Under 5 Years | 8 (0.8%) | 50 (5.6%) |
| 5 to 9 Years | 72 (6.8%) | 11 (1.2%) |
| 10 to 14 Years | 45 (4.3%) | 40 (4.5%) |
| 15 to 19 Years | 99 (9.4%) | 31 (3.5%) |
| 20 to 24 Years | 48 (4.5%) | 54 (6.1%) |
| 25 to 29 Years | 23 (2.2%) | 13 (1.5%) |
| 30 to 34 Years | 33 (3.1%) | 36 (4.0%) |
| 35 to 39 Years | 0 (0.0%) | 1 (0.1%) |
| 40 to 44 Years | 54 (5.1%) | 55 (6.2%) |
| 45 to 49 Years | 49 (4.6%) | 50 (5.6%) |
| 50 to 54 Years | 45 (4.3%) | 57 (6.4%) |
| 55 to 59 Years | 116 (11.0%) | 48 (5.4%) |
| 60 to 64 Years | 131 (12.4%) | 141 (15.8%) |
| 65 to 69 Years | 85 (8.0%) | 183 (20.5%) |
| 70 to 74 Years | 168 (15.9%) | 61 (6.9%) |
| 75 to 79 Years | 16 (1.5%) | 21 (2.4%) |
| 80 to 84 Years | 46 (4.3%) | 20 (2.2%) |
| 85 Years and over | 19 (1.8%) | 19 (2.1%) |
| Total | 1,057 (100.0%) | 891 (100.0%) |
Families and Households in Meagher County
Median Family Size in Meagher County
The median family size in Meagher County is 2.70 persons per family, with single male/father families (7 | 1.3%) accounting for the largest median family size of 9.43 persons per family. On the other hand, married-couple families (527 | 95.5%) represent the smallest median family size with 2.56 persons per family.

| Family Type | # Families | Family Size |
| Married-Couple | 527 (95.5%) | 2.56 |
| Single Male/Father | 7 (1.3%) | 9.43 |
| Single Female/Mother | 18 (3.3%) | 4.11 |
| Total Families | 552 (100.0%) | 2.70 |
Median Household Size in Meagher County
The median household size in Meagher County is 2.30 persons per household, with single male/father households (7 | 0.8%) accounting for the largest median household size of 9.43 persons per household. non-family households (282 | 33.8%) represent the smallest median household size with 1.12 persons per household.
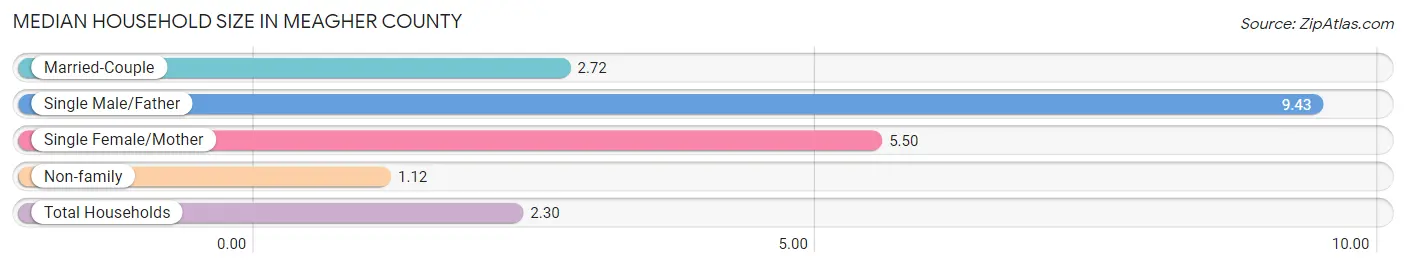
| Household Type | # Households | Household Size |
| Married-Couple | 527 (63.2%) | 2.72 |
| Single Male/Father | 7 (0.8%) | 9.43 |
| Single Female/Mother | 18 (2.2%) | 5.50 |
| Non-family | 282 (33.8%) | 1.12 |
| Total Households | 834 (100.0%) | 2.30 |
Household Size by Marriage Status in Meagher County
Out of a total of 834 households in Meagher County, 552 (66.2%) are family households, while 282 (33.8%) are nonfamily households. The most numerous type of family households are 2-person households, comprising 397, and the most common type of nonfamily households are 1-person households, comprising 264.
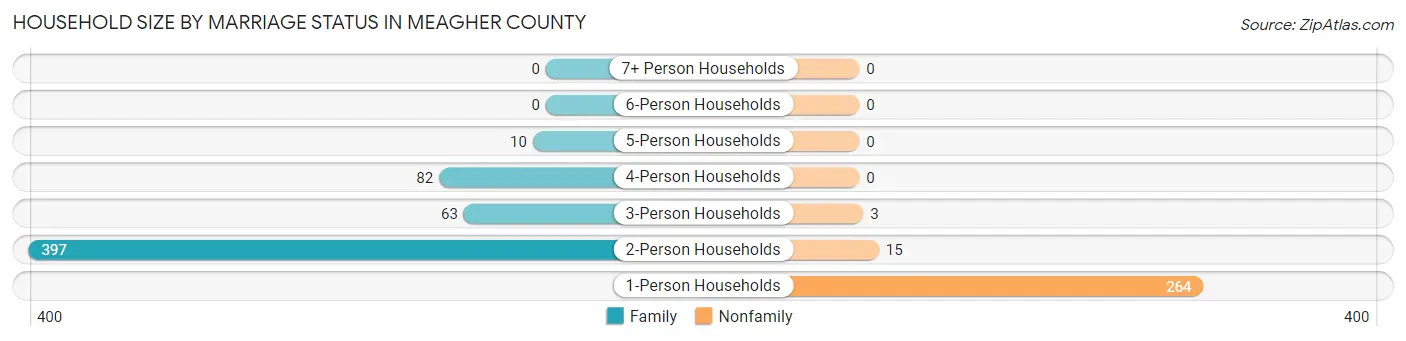
| Household Size | Family Households | Nonfamily Households |
| 1-Person Households | - | 264 (31.7%) |
| 2-Person Households | 397 (47.6%) | 15 (1.8%) |
| 3-Person Households | 63 (7.5%) | 3 (0.4%) |
| 4-Person Households | 82 (9.8%) | 0 (0.0%) |
| 5-Person Households | 10 (1.2%) | 0 (0.0%) |
| 6-Person Households | 0 (0.0%) | 0 (0.0%) |
| 7+ Person Households | 0 (0.0%) | 0 (0.0%) |
| Total | 552 (66.2%) | 282 (33.8%) |
Female Fertility in Meagher County
Fertility by Age in Meagher County
Average fertility rate in Meagher County is 29.0 births per 1,000 women. Women in the age bracket of 20 to 34 years have the highest fertility rate with 68.0 births per 1,000 women. Women in the age bracket of 20 to 34 years acount for 100.0% of all women with births.
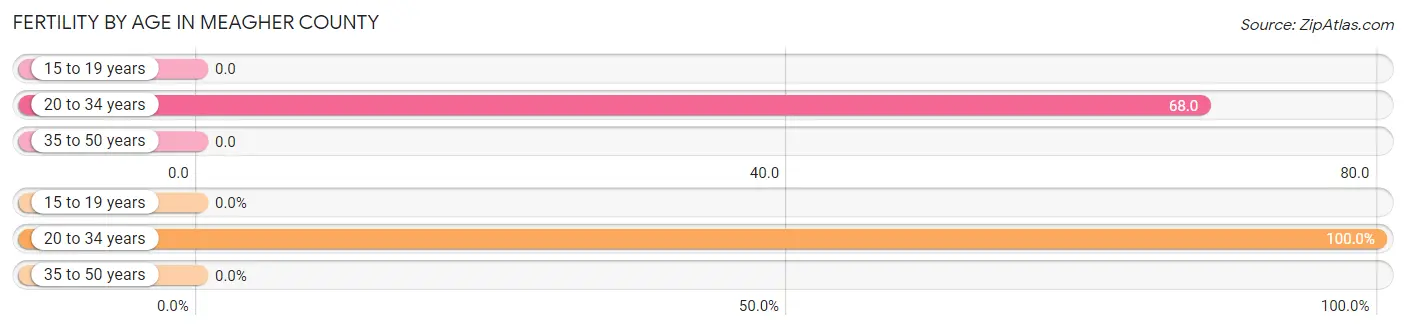
| Age Bracket | Women with Births | Births / 1,000 Women |
| 15 to 19 years | 0 (0.0%) | 0.0 |
| 20 to 34 years | 7 (100.0%) | 68.0 |
| 35 to 50 years | 0 (0.0%) | 0.0 |
| Total | 7 (100.0%) | 29.0 |
Fertility by Age by Marriage Status in Meagher County
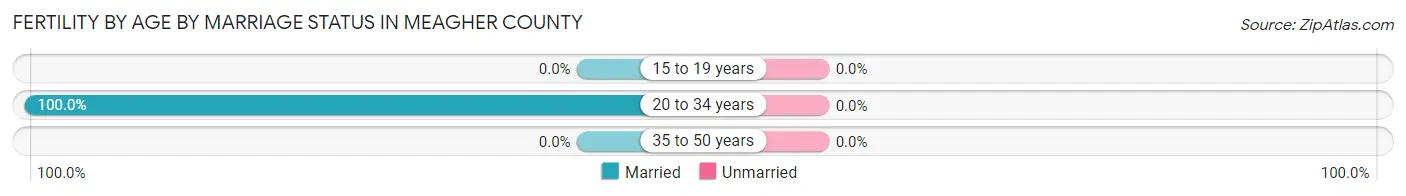
| Age Bracket | Married | Unmarried |
| 15 to 19 years | 0 (0.0%) | 0 (0.0%) |
| 20 to 34 years | 7 (100.0%) | 0 (0.0%) |
| 35 to 50 years | 0 (0.0%) | 0 (0.0%) |
| Total | 7 (100.0%) | 0 (0.0%) |
Fertility by Education in Meagher County
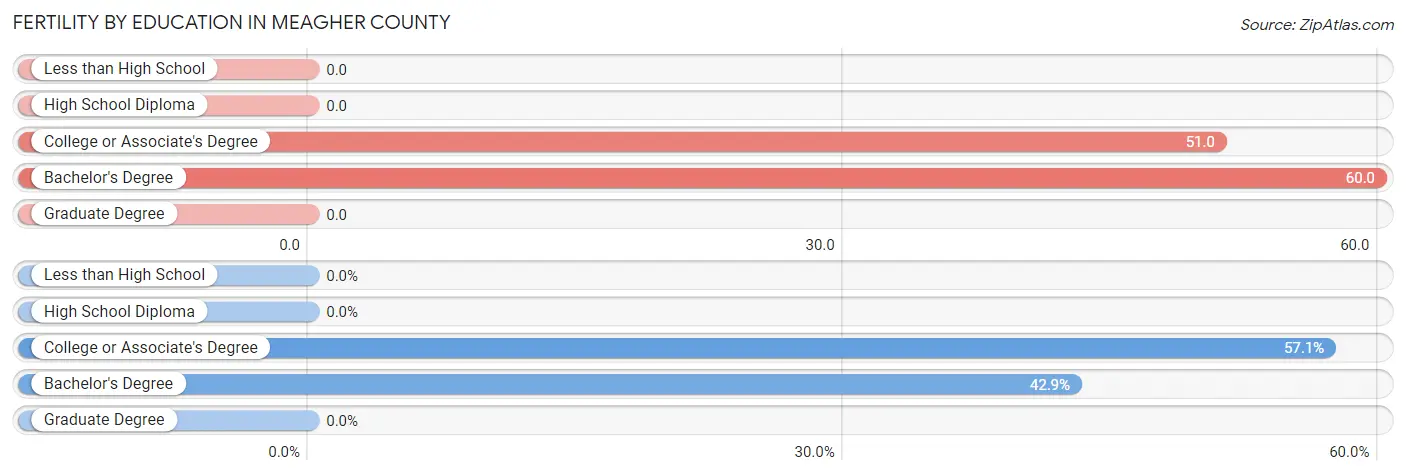
| Educational Attainment | Women with Births | Births / 1,000 Women |
| Less than High School | 0 (0.0%) | 0.0 |
| High School Diploma | 0 (0.0%) | 0.0 |
| College or Associate's Degree | 4 (57.1%) | 51.0 |
| Bachelor's Degree | 3 (42.9%) | 60.0 |
| Graduate Degree | 0 (0.0%) | 0.0 |
| Total | 7 (100.0%) | 29.0 |
Fertility by Education by Marriage Status in Meagher County
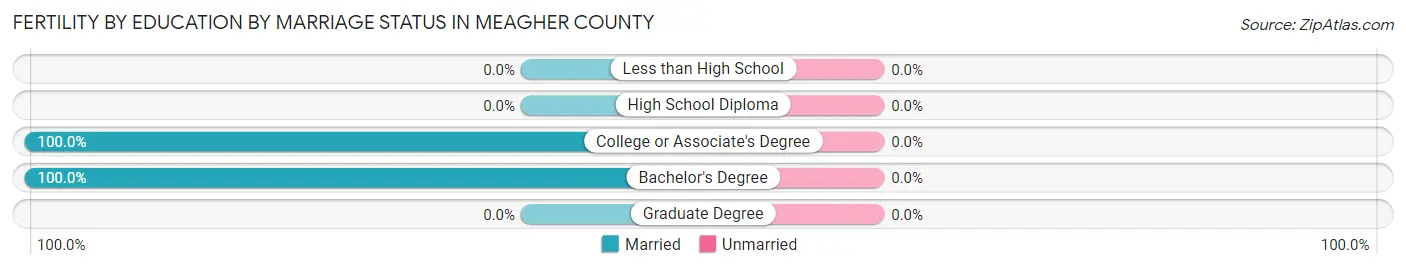
| Educational Attainment | Married | Unmarried |
| Less than High School | 0 (0.0%) | 0 (0.0%) |
| High School Diploma | 0 (0.0%) | 0 (0.0%) |
| College or Associate's Degree | 4 (100.0%) | 0 (0.0%) |
| Bachelor's Degree | 3 (100.0%) | 0 (0.0%) |
| Graduate Degree | 0 (0.0%) | 0 (0.0%) |
| Total | 7 (100.0%) | 0 (0.0%) |
Income in Meagher County
Income Overview in Meagher County
Per Capita Income in Meagher County is $37,498, while median incomes of families and households are $72,357 and $55,753 respectively.
| Characteristic | Number | Measure |
| Per Capita Income | 1,948 | $37,498 |
| Median Family Income | 552 | $72,357 |
| Mean Family Income | 552 | $100,465 |
| Median Household Income | 834 | $55,753 |
| Mean Household Income | 834 | $81,138 |
| Income Deficit | 552 | $11,041 |
| Wage / Income Gap (%) | 1,948 | 32.96% |
| Wage / Income Gap ($) | 1,948 | 67.04¢ per $1 |
| Gini / Inequality Index | 1,948 | 0.46 |
Earnings by Sex in Meagher County
Average Earnings in Meagher County are $27,621, $22,500 for men and $33,560 for women, a difference of 33.0%.
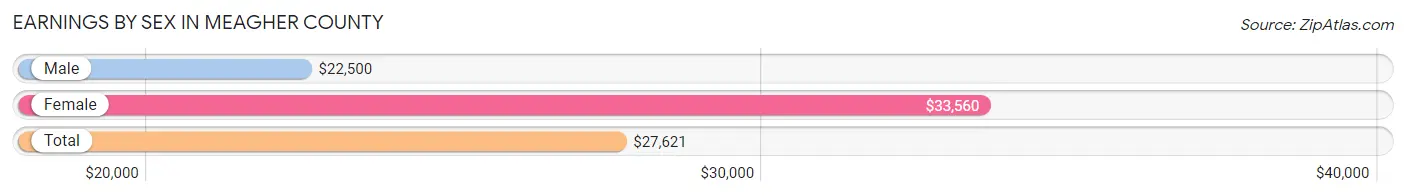
| Sex | Number | Average Earnings |
| Male | 624 (56.5%) | $22,500 |
| Female | 481 (43.5%) | $33,560 |
| Total | 1,105 (100.0%) | $27,621 |
Earnings by Sex by Income Bracket in Meagher County
The most common earnings brackets in Meagher County are $2,499 or less for men (95 | 15.2%) and $15,000 to $17,499 for women (55 | 11.4%).
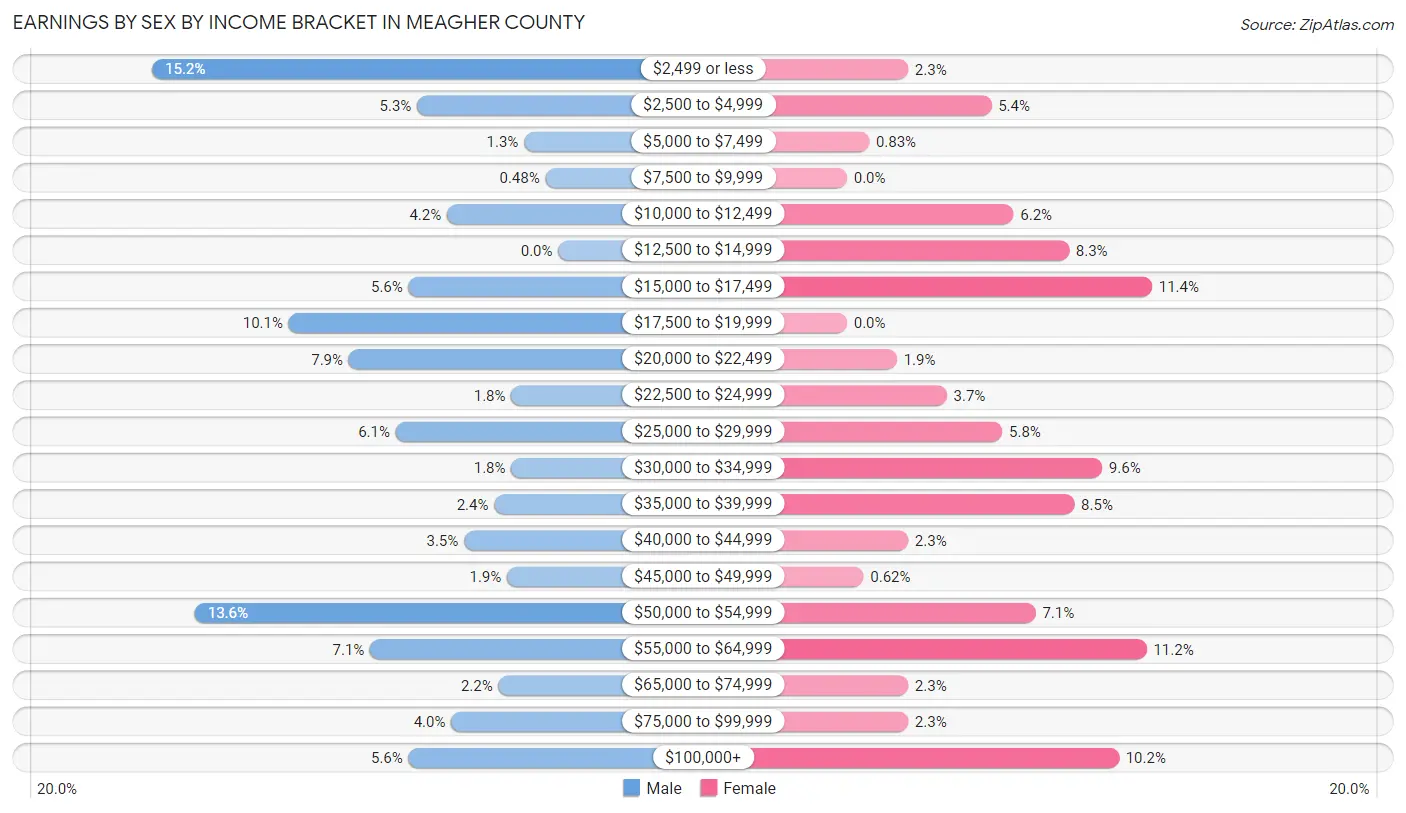
| Income | Male | Female |
| $2,499 or less | 95 (15.2%) | 11 (2.3%) |
| $2,500 to $4,999 | 33 (5.3%) | 26 (5.4%) |
| $5,000 to $7,499 | 8 (1.3%) | 4 (0.8%) |
| $7,500 to $9,999 | 3 (0.5%) | 0 (0.0%) |
| $10,000 to $12,499 | 26 (4.2%) | 30 (6.2%) |
| $12,500 to $14,999 | 0 (0.0%) | 40 (8.3%) |
| $15,000 to $17,499 | 35 (5.6%) | 55 (11.4%) |
| $17,500 to $19,999 | 63 (10.1%) | 0 (0.0%) |
| $20,000 to $22,499 | 49 (7.9%) | 9 (1.9%) |
| $22,500 to $24,999 | 11 (1.8%) | 18 (3.7%) |
| $25,000 to $29,999 | 38 (6.1%) | 28 (5.8%) |
| $30,000 to $34,999 | 11 (1.8%) | 46 (9.6%) |
| $35,000 to $39,999 | 15 (2.4%) | 41 (8.5%) |
| $40,000 to $44,999 | 22 (3.5%) | 11 (2.3%) |
| $45,000 to $49,999 | 12 (1.9%) | 3 (0.6%) |
| $50,000 to $54,999 | 85 (13.6%) | 34 (7.1%) |
| $55,000 to $64,999 | 44 (7.0%) | 54 (11.2%) |
| $65,000 to $74,999 | 14 (2.2%) | 11 (2.3%) |
| $75,000 to $99,999 | 25 (4.0%) | 11 (2.3%) |
| $100,000+ | 35 (5.6%) | 49 (10.2%) |
| Total | 624 (100.0%) | 481 (100.0%) |
Earnings by Sex by Educational Attainment in Meagher County
Average earnings in Meagher County are $33,750 for men and $34,321 for women, a difference of 1.7%. Men with an educational attainment of college or associate's degree enjoy the highest average annual earnings of $53,235, while those with bachelor's degree education earn the least with $20,200. Women with an educational attainment of bachelor's degree earn the most with the average annual earnings of $63,867, while those with high school diploma education have the smallest earnings of $17,331.
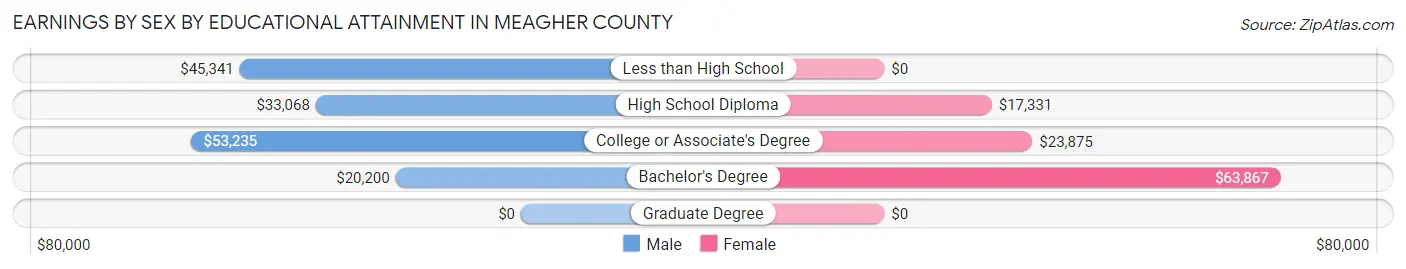
| Educational Attainment | Male Income | Female Income |
| Less than High School | $45,341 | $0 |
| High School Diploma | $33,068 | $17,331 |
| College or Associate's Degree | $53,235 | $23,875 |
| Bachelor's Degree | $20,200 | $63,867 |
| Graduate Degree | - | - |
| Total | $33,750 | $34,321 |
Family Income in Meagher County
Family Income Brackets in Meagher County
According to the Meagher County family income data, there are 141 families falling into the $100,000 to $149,999 income range, which is the most common income bracket and makes up 25.5% of all families.

| Income Bracket | # Families | % Families |
| Less than $10,000 | 61 | 11.1% |
| $10,000 to $14,999 | 17 | 3.1% |
| $15,000 to $24,999 | 2 | 0.4% |
| $25,000 to $34,999 | 0 | 0.0% |
| $35,000 to $49,999 | 98 | 17.8% |
| $50,000 to $74,999 | 100 | 18.1% |
| $75,000 to $99,999 | 30 | 5.4% |
| $100,000 to $149,999 | 141 | 25.5% |
| $150,000 to $199,999 | 30 | 5.4% |
| $200,000+ | 73 | 13.2% |
Family Income by Famaliy Size in Meagher County
4-person families (86 | 15.6%) account for the highest median family income in Meagher County with $133,214 per family, while 3-person families (47 | 8.5%) have the highest median income of $37,113 per family member.
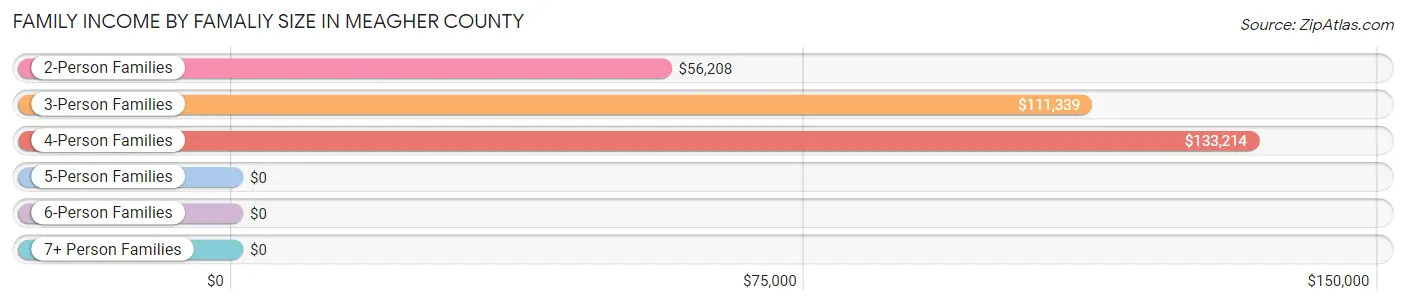
| Income Bracket | # Families | Median Income |
| 2-Person Families | 419 (75.9%) | $56,208 |
| 3-Person Families | 47 (8.5%) | $111,339 |
| 4-Person Families | 86 (15.6%) | $133,214 |
| 5-Person Families | 0 (0.0%) | $0 |
| 6-Person Families | 0 (0.0%) | $0 |
| 7+ Person Families | 0 (0.0%) | $0 |
| Total | 552 (100.0%) | $72,357 |
Family Income by Number of Earners in Meagher County
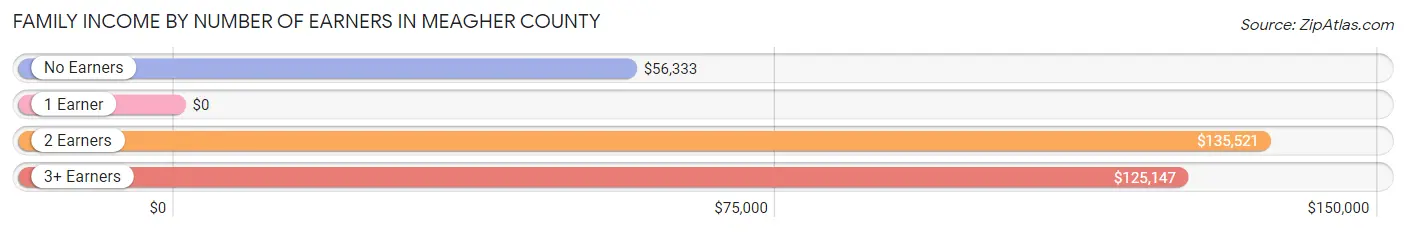
| Number of Earners | # Families | Median Income |
| No Earners | 154 (27.9%) | $56,333 |
| 1 Earner | 137 (24.8%) | $0 |
| 2 Earners | 187 (33.9%) | $135,521 |
| 3+ Earners | 74 (13.4%) | $125,147 |
| Total | 552 (100.0%) | $72,357 |
Household Income in Meagher County
Household Income Brackets in Meagher County
With 174 households falling in the category, the $50,000 to $74,999 income range is the most frequent in Meagher County, accounting for 20.9% of all households. In contrast, only 18 households (2.2%) fall into the $15,000 to $24,999 income bracket, making it the least populous group.
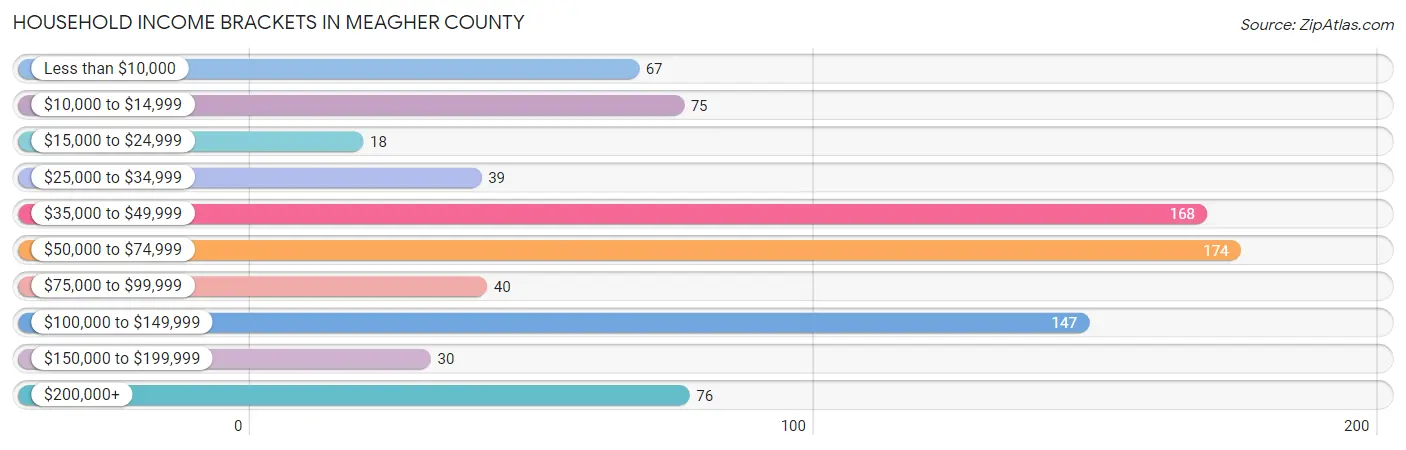
| Income Bracket | # Households | % Households |
| Less than $10,000 | 67 | 8.0% |
| $10,000 to $14,999 | 75 | 9.0% |
| $15,000 to $24,999 | 18 | 2.2% |
| $25,000 to $34,999 | 39 | 4.7% |
| $35,000 to $49,999 | 168 | 20.1% |
| $50,000 to $74,999 | 174 | 20.9% |
| $75,000 to $99,999 | 40 | 4.8% |
| $100,000 to $149,999 | 147 | 17.6% |
| $150,000 to $199,999 | 30 | 3.6% |
| $200,000+ | 76 | 9.1% |
Household Income by Householder Age in Meagher County
The median household income in Meagher County is $55,753, with the highest median household income of $55,625 found in the 65+ years age bracket for the primary householder. A total of 371 households (44.5%) fall into this category. Meanwhile, the 15 to 24 years age bracket for the primary householder has the lowest median household income of $0, with 12 households (1.4%) in this group.

| Income Bracket | # Households | Median Income |
| 15 to 24 Years | 12 (1.4%) | $0 |
| 25 to 44 Years | 106 (12.7%) | $0 |
| 45 to 64 Years | 345 (41.4%) | $46,250 |
| 65+ Years | 371 (44.5%) | $55,625 |
| Total | 834 (100.0%) | $55,753 |
Poverty in Meagher County
Income Below Poverty by Sex and Age in Meagher County
With 12.3% poverty level for males and 11.7% for females among the residents of Meagher County, under 5 year old males and 6 to 11 year old females are the most vulnerable to poverty, with 8 males (100.0%) and 11 females (100.0%) in their respective age groups living below the poverty level.
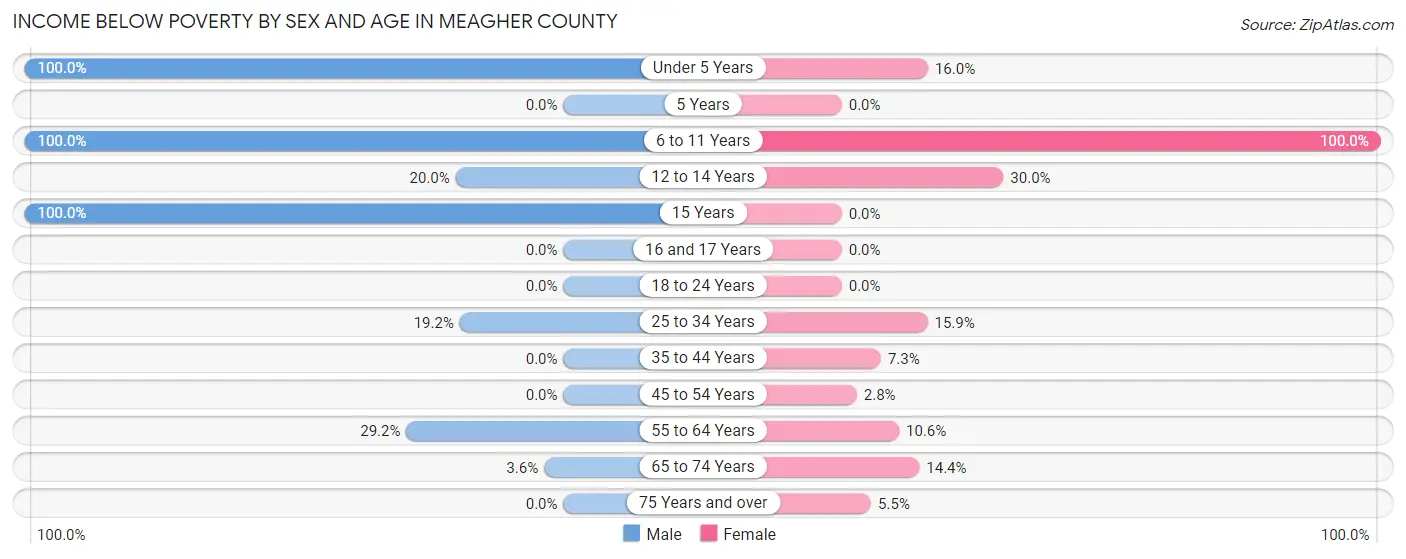
| Age Bracket | Male | Female |
| Under 5 Years | 8 (100.0%) | 8 (16.0%) |
| 5 Years | 0 (0.0%) | 0 (0.0%) |
| 6 to 11 Years | 8 (100.0%) | 11 (100.0%) |
| 12 to 14 Years | 9 (20.0%) | 12 (30.0%) |
| 15 Years | 4 (100.0%) | 0 (0.0%) |
| 16 and 17 Years | 0 (0.0%) | 0 (0.0%) |
| 18 to 24 Years | 0 (0.0%) | 0 (0.0%) |
| 25 to 34 Years | 10 (19.2%) | 7 (15.9%) |
| 35 to 44 Years | 0 (0.0%) | 4 (7.3%) |
| 45 to 54 Years | 0 (0.0%) | 3 (2.8%) |
| 55 to 64 Years | 72 (29.1%) | 20 (10.6%) |
| 65 to 74 Years | 9 (3.6%) | 35 (14.4%) |
| 75 Years and over | 0 (0.0%) | 3 (5.4%) |
| Total | 120 (12.3%) | 103 (11.7%) |
Income Above Poverty by Sex and Age in Meagher County
According to the poverty statistics in Meagher County, males aged 16 and 17 years and females aged 15 years are the age groups that are most secure financially, with 100.0% of males and 100.0% of females in these age groups living above the poverty line.
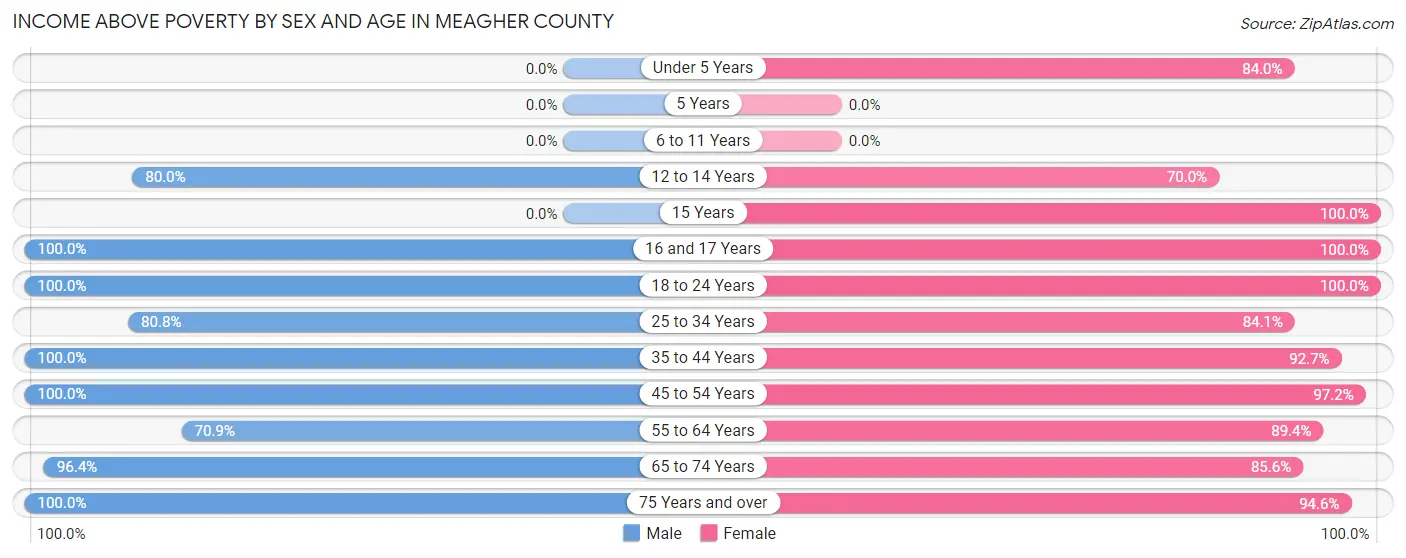
| Age Bracket | Male | Female |
| Under 5 Years | 0 (0.0%) | 42 (84.0%) |
| 5 Years | 0 (0.0%) | 0 (0.0%) |
| 6 to 11 Years | 0 (0.0%) | 0 (0.0%) |
| 12 to 14 Years | 36 (80.0%) | 28 (70.0%) |
| 15 Years | 0 (0.0%) | 21 (100.0%) |
| 16 and 17 Years | 37 (100.0%) | 10 (100.0%) |
| 18 to 24 Years | 106 (100.0%) | 54 (100.0%) |
| 25 to 34 Years | 42 (80.8%) | 37 (84.1%) |
| 35 to 44 Years | 54 (100.0%) | 51 (92.7%) |
| 45 to 54 Years | 94 (100.0%) | 104 (97.2%) |
| 55 to 64 Years | 175 (70.9%) | 168 (89.4%) |
| 65 to 74 Years | 242 (96.4%) | 208 (85.6%) |
| 75 Years and over | 73 (100.0%) | 52 (94.6%) |
| Total | 859 (87.7%) | 775 (88.3%) |
Income Below Poverty Among Married-Couple Families in Meagher County
The poverty statistics for married-couple families in Meagher County show that 11.8% or 62 of the total 527 families live below the poverty line. Families with no children have the highest poverty rate of 13.9%, comprising of 62 families. On the other hand, families with 1 or 2 children have the lowest poverty rate of 0.0%, which includes 0 families.
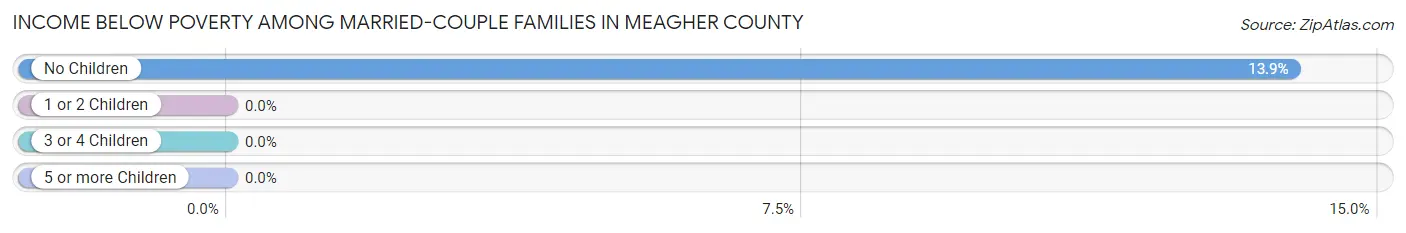
| Children | Above Poverty | Below Poverty |
| No Children | 385 (86.1%) | 62 (13.9%) |
| 1 or 2 Children | 80 (100.0%) | 0 (0.0%) |
| 3 or 4 Children | 0 (0.0%) | 0 (0.0%) |
| 5 or more Children | 0 (0.0%) | 0 (0.0%) |
| Total | 465 (88.2%) | 62 (11.8%) |
Income Below Poverty Among Single-Parent Households in Meagher County
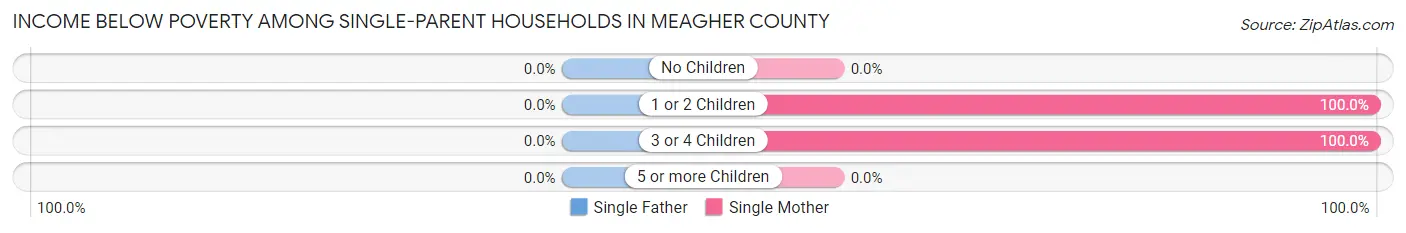
| Children | Single Father | Single Mother |
| No Children | 0 (0.0%) | 0 (0.0%) |
| 1 or 2 Children | 0 (0.0%) | 17 (100.0%) |
| 3 or 4 Children | 0 (0.0%) | 1 (100.0%) |
| 5 or more Children | 0 (0.0%) | 0 (0.0%) |
| Total | 0 (0.0%) | 18 (100.0%) |
Income Below Poverty Among Married-Couple vs Single-Parent Households in Meagher County
The poverty data for Meagher County shows that 62 of the married-couple family households (11.8%) and 18 of the single-parent households (72.0%) are living below the poverty level. Within the married-couple family households, those with no children have the highest poverty rate, with 62 households (13.9%) falling below the poverty line. Among the single-parent households, those with 1 or 2 children have the highest poverty rate, with 17 household (100.0%) living below poverty.
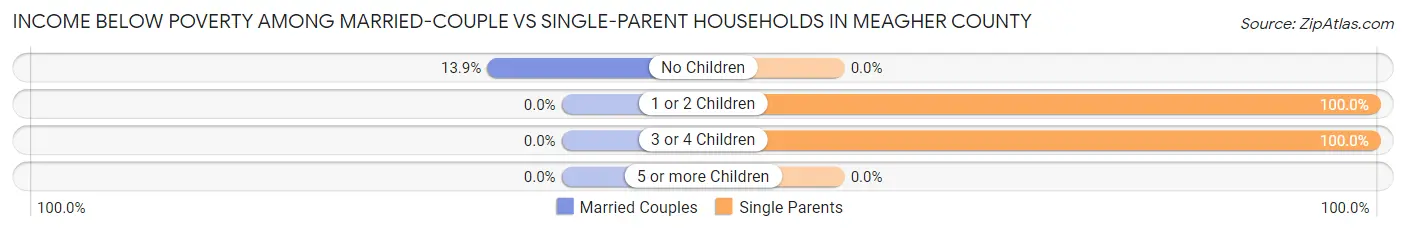
| Children | Married-Couple Families | Single-Parent Households |
| No Children | 62 (13.9%) | 0 (0.0%) |
| 1 or 2 Children | 0 (0.0%) | 17 (100.0%) |
| 3 or 4 Children | 0 (0.0%) | 1 (100.0%) |
| 5 or more Children | 0 (0.0%) | 0 (0.0%) |
| Total | 62 (11.8%) | 18 (72.0%) |
Employment Characteristics in Meagher County
Employment by Class of Employer in Meagher County
Among the 1,007 employed individuals in Meagher County, private company employees (447 | 44.4%), self-employed (not incorporated) (196 | 19.5%), and local government employees (139 | 13.8%) make up the most common classes of employment.
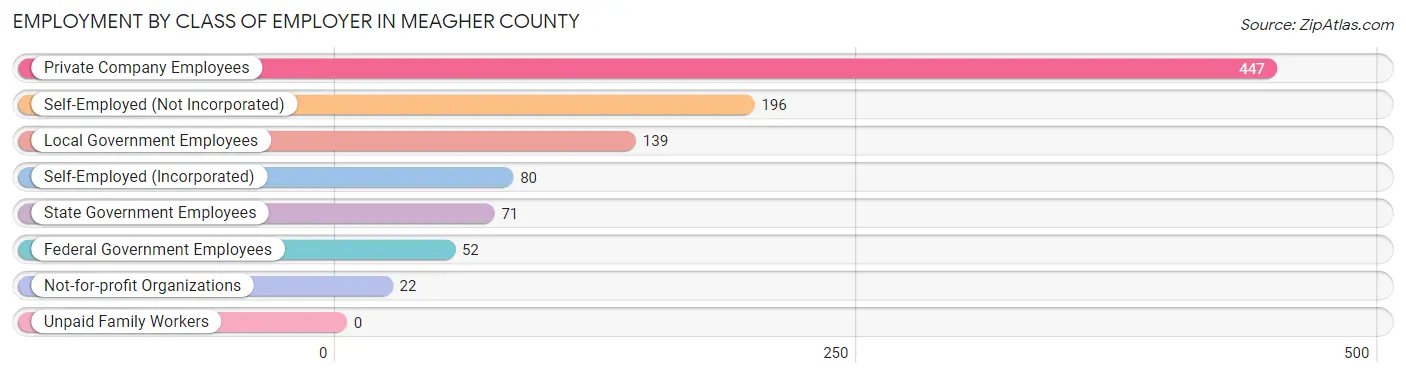
| Employer Class | # Employees | % Employees |
| Private Company Employees | 447 | 44.4% |
| Self-Employed (Incorporated) | 80 | 7.9% |
| Self-Employed (Not Incorporated) | 196 | 19.5% |
| Not-for-profit Organizations | 22 | 2.2% |
| Local Government Employees | 139 | 13.8% |
| State Government Employees | 71 | 7.0% |
| Federal Government Employees | 52 | 5.2% |
| Unpaid Family Workers | 0 | 0.0% |
| Total | 1,007 | 100.0% |
Employment Status by Age in Meagher County
According to the labor force statistics for Meagher County, out of the total population over 16 years of age (1,697), 61.1% or 1,037 individuals are in the labor force, with 1.5% or 16 of them unemployed. The age group with the highest labor force participation rate is 20 to 24 years, with 100.0% or 102 individuals in the labor force. Within the labor force, the 65 to 74 years age range has the highest percentage of unemployed individuals, with 10.9% or 15 of them being unemployed.

| Age Bracket | In Labor Force | Unemployed |
| 16 to 19 Years | 73 (69.5%) | 0 (0.0%) |
| 20 to 24 Years | 102 (100.0%) | 0 (0.0%) |
| 25 to 29 Years | 29 (80.6%) | 1 (3.4%) |
| 30 to 34 Years | 67 (97.1%) | 0 (0.0%) |
| 35 to 44 Years | 109 (99.1%) | 0 (0.0%) |
| 45 to 54 Years | 173 (86.1%) | 0 (0.0%) |
| 55 to 59 Years | 132 (80.5%) | 0 (0.0%) |
| 60 to 64 Years | 196 (72.1%) | 0 (0.0%) |
| 65 to 74 Years | 137 (27.6%) | 15 (10.9%) |
| 75 Years and over | 19 (13.5%) | 0 (0.0%) |
| Total | 1,037 (61.1%) | 16 (1.5%) |
Employment Status by Educational Attainment in Meagher County
According to labor force statistics for Meagher County, 82.9% of individuals (706) out of the total population between 25 and 64 years of age (852) are in the labor force, with 0.1% or 1 of them being unemployed. The group with the highest labor force participation rate are those with the educational attainment of less than high school, with 94.7% or 18 individuals in the labor force. Within the labor force, individuals with high school diploma education have the highest percentage of unemployment, with 0.5% or 1 of them being unemployed.

| Educational Attainment | In Labor Force | Unemployed |
| Less than High School | 18 (94.7%) | 0 (0.0%) |
| High School Diploma | 182 (81.3%) | 1 (0.5%) |
| College / Associate Degree | 193 (82.5%) | 0 (0.0%) |
| Bachelor's Degree or higher | 313 (83.5%) | 0 (0.0%) |
| Total | 706 (82.9%) | 1 (0.1%) |
Employment Occupations by Sex in Meagher County
Management, Business, Science and Arts Occupations
The most common Management, Business, Science and Arts occupations in Meagher County are Community & Social Service (179 | 17.5%), Management (173 | 16.9%), Education Instruction & Library (95 | 9.3%), Arts, Media & Entertainment (70 | 6.9%), and Health Diagnosing & Treating (56 | 5.5%).
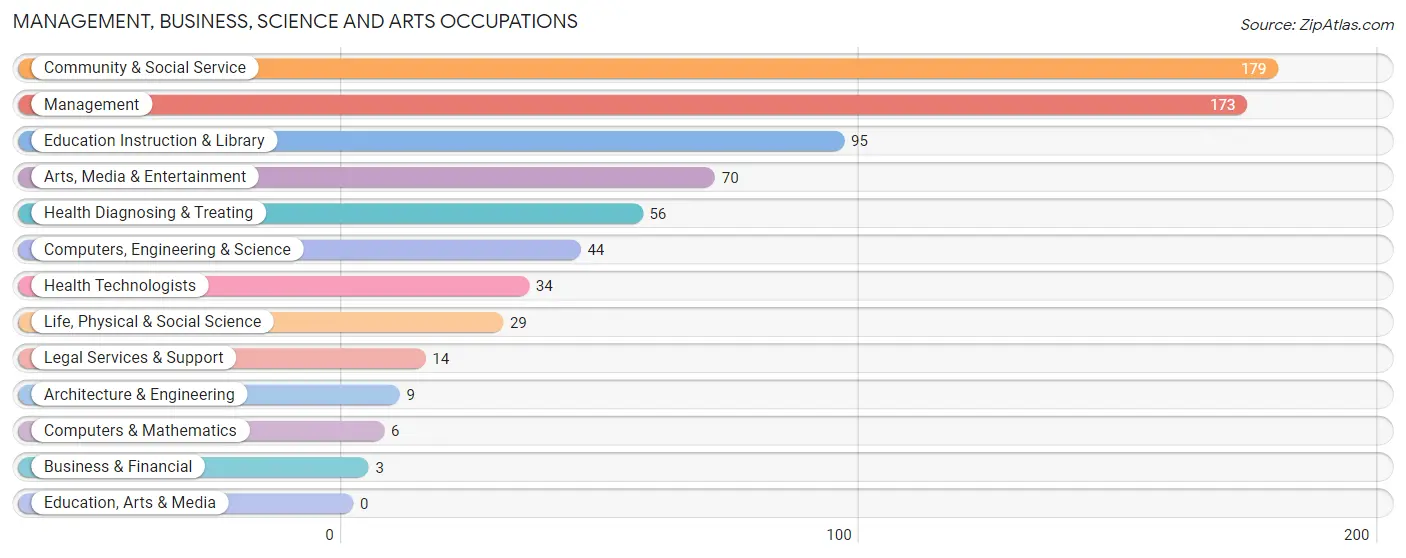
Management, Business, Science and Arts Occupations by Sex
Within the Management, Business, Science and Arts occupations in Meagher County, the most male-oriented occupations are Legal Services & Support (100.0%), Health Technologists (100.0%), and Life, Physical & Social Science (79.3%), while the most female-oriented occupations are Business & Financial (100.0%), Computers & Mathematics (100.0%), and Architecture & Engineering (100.0%).

| Occupation | Male | Female |
| Management | 107 (61.9%) | 66 (38.2%) |
| Business & Financial | 0 (0.0%) | 3 (100.0%) |
| Computers, Engineering & Science | 23 (52.3%) | 21 (47.7%) |
| Computers & Mathematics | 0 (0.0%) | 6 (100.0%) |
| Architecture & Engineering | 0 (0.0%) | 9 (100.0%) |
| Life, Physical & Social Science | 23 (79.3%) | 6 (20.7%) |
| Community & Social Service | 79 (44.1%) | 100 (55.9%) |
| Education, Arts & Media | 0 (0.0%) | 0 (0.0%) |
| Legal Services & Support | 14 (100.0%) | 0 (0.0%) |
| Education Instruction & Library | 13 (13.7%) | 82 (86.3%) |
| Arts, Media & Entertainment | 52 (74.3%) | 18 (25.7%) |
| Health Diagnosing & Treating | 34 (60.7%) | 22 (39.3%) |
| Health Technologists | 34 (100.0%) | 0 (0.0%) |
| Total (Category) | 243 (53.4%) | 212 (46.6%) |
| Total (Overall) | 563 (55.1%) | 458 (44.9%) |
Services Occupations
The most common Services occupations in Meagher County are Food Preparation & Serving (66 | 6.5%), Security & Protection (48 | 4.7%), Law Enforcement (27 | 2.6%), Cleaning & Maintenance (27 | 2.6%), and Firefighting & Prevention (21 | 2.1%).

Services Occupations by Sex
Within the Services occupations in Meagher County, the most male-oriented occupations are Security & Protection (100.0%), Firefighting & Prevention (100.0%), and Law Enforcement (100.0%), while the most female-oriented occupations are Cleaning & Maintenance (100.0%), Personal Care & Service (100.0%), and Food Preparation & Serving (60.6%).
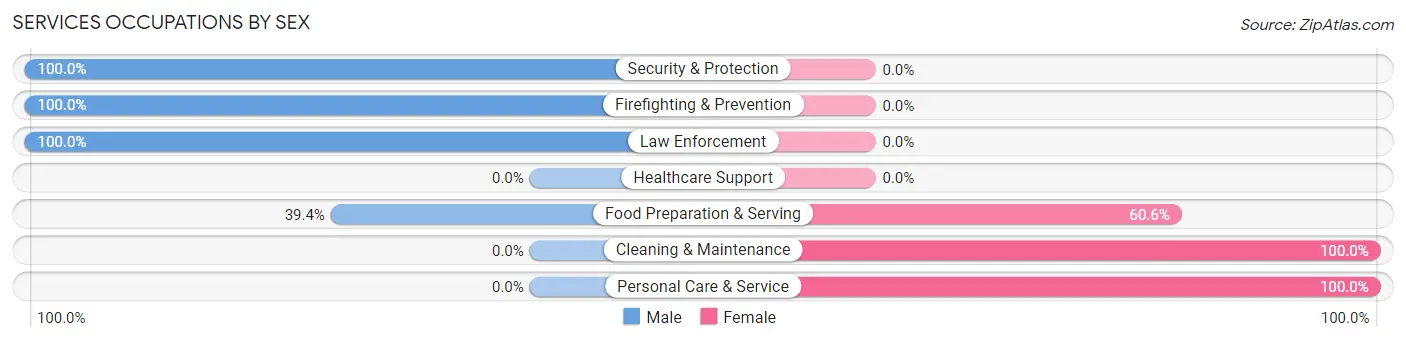
| Occupation | Male | Female |
| Healthcare Support | 0 (0.0%) | 0 (0.0%) |
| Security & Protection | 48 (100.0%) | 0 (0.0%) |
| Firefighting & Prevention | 21 (100.0%) | 0 (0.0%) |
| Law Enforcement | 27 (100.0%) | 0 (0.0%) |
| Food Preparation & Serving | 26 (39.4%) | 40 (60.6%) |
| Cleaning & Maintenance | 0 (0.0%) | 27 (100.0%) |
| Personal Care & Service | 0 (0.0%) | 9 (100.0%) |
| Total (Category) | 74 (49.3%) | 76 (50.7%) |
| Total (Overall) | 563 (55.1%) | 458 (44.9%) |
Sales and Office Occupations
The most common Sales and Office occupations in Meagher County are Office & Administration (103 | 10.1%), and Sales & Related (61 | 6.0%).
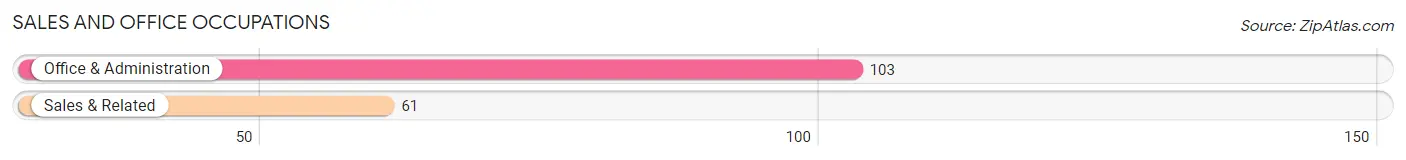
Sales and Office Occupations by Sex

| Occupation | Male | Female |
| Sales & Related | 42 (68.9%) | 19 (31.1%) |
| Office & Administration | 0 (0.0%) | 103 (100.0%) |
| Total (Category) | 42 (25.6%) | 122 (74.4%) |
| Total (Overall) | 563 (55.1%) | 458 (44.9%) |
Natural Resources, Construction and Maintenance Occupations
The most common Natural Resources, Construction and Maintenance occupations in Meagher County are Farming, Fishing & Forestry (106 | 10.4%), Construction & Extraction (25 | 2.5%), and Installation, Maintenance & Repair (16 | 1.6%).
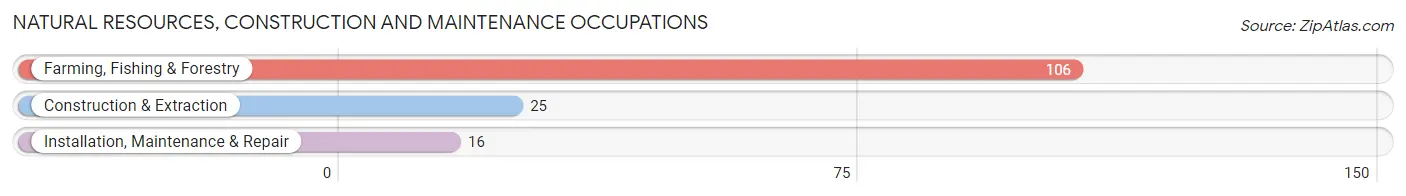
Natural Resources, Construction and Maintenance Occupations by Sex
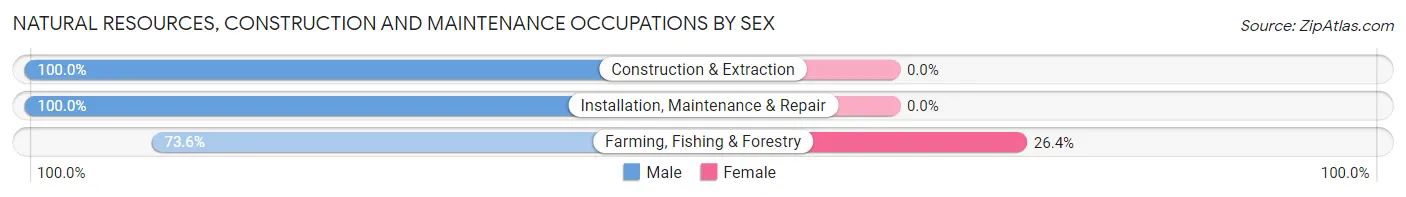
| Occupation | Male | Female |
| Farming, Fishing & Forestry | 78 (73.6%) | 28 (26.4%) |
| Construction & Extraction | 25 (100.0%) | 0 (0.0%) |
| Installation, Maintenance & Repair | 16 (100.0%) | 0 (0.0%) |
| Total (Category) | 119 (80.9%) | 28 (19.1%) |
| Total (Overall) | 563 (55.1%) | 458 (44.9%) |
Production, Transportation and Moving Occupations
The most common Production, Transportation and Moving occupations in Meagher County are Production (46 | 4.5%), Material Moving (35 | 3.4%), and Transportation (24 | 2.4%).

Production, Transportation and Moving Occupations by Sex
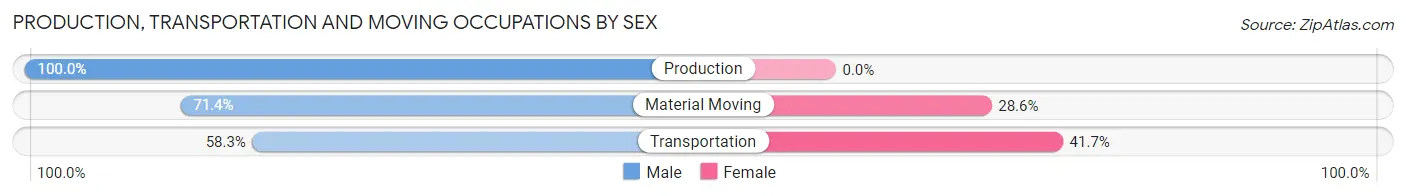
| Occupation | Male | Female |
| Production | 46 (100.0%) | 0 (0.0%) |
| Transportation | 14 (58.3%) | 10 (41.7%) |
| Material Moving | 25 (71.4%) | 10 (28.6%) |
| Total (Category) | 85 (80.9%) | 20 (19.1%) |
| Total (Overall) | 563 (55.1%) | 458 (44.9%) |
Employment Industries by Sex in Meagher County
Employment Industries in Meagher County
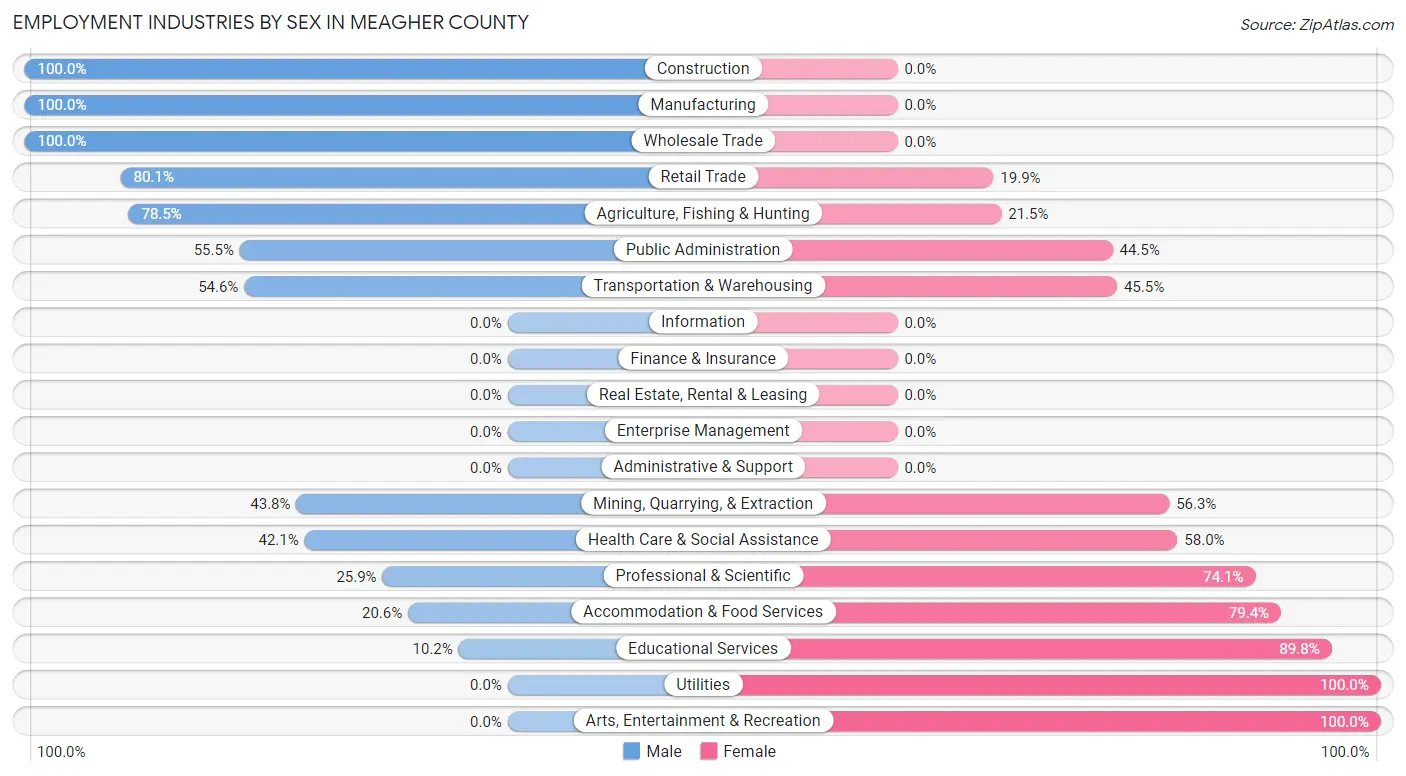
The major employment industries in Meagher County include Agriculture, Fishing & Hunting (214 | 21.0%), Retail Trade (156 | 15.3%), Educational Services (128 | 12.5%), Public Administration (128 | 12.5%), and Health Care & Social Assistance (88 | 8.6%).

Employment Industries by Sex in Meagher County
The Meagher County industries that see more men than women are Construction (100.0%), Manufacturing (100.0%), and Wholesale Trade (100.0%), whereas the industries that tend to have a higher number of women are Utilities (100.0%), Arts, Entertainment & Recreation (100.0%), and Educational Services (89.8%).
| Industry | Male | Female |
| Agriculture, Fishing & Hunting | 168 (78.5%) | 46 (21.5%) |
| Mining, Quarrying, & Extraction | 7 (43.8%) | 9 (56.2%) |
| Construction | 28 (100.0%) | 0 (0.0%) |
| Manufacturing | 36 (100.0%) | 0 (0.0%) |
| Wholesale Trade | 2 (100.0%) | 0 (0.0%) |
| Retail Trade | 125 (80.1%) | 31 (19.9%) |
| Transportation & Warehousing | 12 (54.5%) | 10 (45.5%) |
| Utilities | 0 (0.0%) | 6 (100.0%) |
| Information | 0 (0.0%) | 0 (0.0%) |
| Finance & Insurance | 0 (0.0%) | 0 (0.0%) |
| Real Estate, Rental & Leasing | 0 (0.0%) | 0 (0.0%) |
| Professional & Scientific | 21 (25.9%) | 60 (74.1%) |
| Enterprise Management | 0 (0.0%) | 0 (0.0%) |
| Administrative & Support | 0 (0.0%) | 0 (0.0%) |
| Educational Services | 13 (10.2%) | 115 (89.8%) |
| Health Care & Social Assistance | 37 (42.0%) | 51 (58.0%) |
| Arts, Entertainment & Recreation | 0 (0.0%) | 9 (100.0%) |
| Accommodation & Food Services | 13 (20.6%) | 50 (79.4%) |
| Public Administration | 71 (55.5%) | 57 (44.5%) |
| Total | 563 (55.1%) | 458 (44.9%) |
Education in Meagher County
School Enrollment in Meagher County
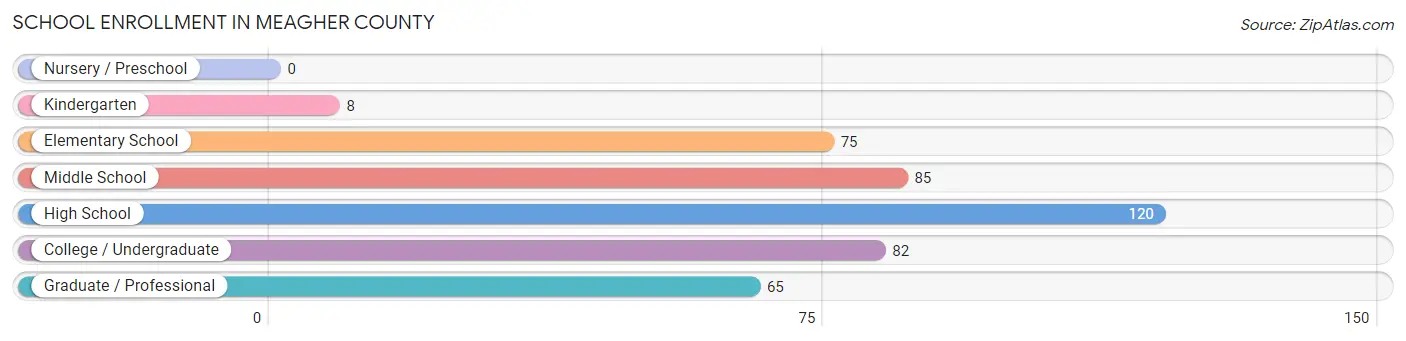
The most common levels of schooling among the 435 students in Meagher County are high school (120 | 27.6%), middle school (85 | 19.5%), and college / undergraduate (82 | 18.9%).
| School Level | # Students | % Students |
| Nursery / Preschool | 0 | 0.0% |
| Kindergarten | 8 | 1.8% |
| Elementary School | 75 | 17.2% |
| Middle School | 85 | 19.5% |
| High School | 120 | 27.6% |
| College / Undergraduate | 82 | 18.9% |
| Graduate / Professional | 65 | 14.9% |
| Total | 435 | 100.0% |
School Enrollment by Age by Funding Source in Meagher County
Out of a total of 435 students who are enrolled in schools in Meagher County, 63 (14.5%) attend a private institution, while the remaining 372 (85.5%) are enrolled in public schools. The age group of 25 to 34 year olds has the highest likelihood of being enrolled in private schools, with 9 (100.0% in the age bracket) enrolled. Conversely, the age group of 5 to 9 year old has the lowest likelihood of being enrolled in a private school, with 83 (100.0% in the age bracket) attending a public institution.

| Age Bracket | Public School | Private School |
| 3 to 4 Year Olds | 0 (0.0%) | 0 (0.0%) |
| 5 to 9 Year Old | 83 (100.0%) | 0 (0.0%) |
| 10 to 14 Year Olds | 85 (100.0%) | 0 (0.0%) |
| 15 to 17 Year Olds | 72 (100.0%) | 0 (0.0%) |
| 18 to 19 Year Olds | 58 (100.0%) | 0 (0.0%) |
| 20 to 24 Year Olds | 18 (26.9%) | 49 (73.1%) |
| 25 to 34 Year Olds | 0 (0.0%) | 9 (100.0%) |
| 35 Years and over | 56 (91.8%) | 5 (8.2%) |
| Total | 372 (85.5%) | 63 (14.5%) |
Educational Attainment by Field of Study in Meagher County
Education (183 | 29.7%), business (148 | 24.0%), engineering (65 | 10.5%), science & technology (60 | 9.7%), and arts & humanities (38 | 6.2%) are the most common fields of study among 616 individuals in Meagher County who have obtained a bachelor's degree or higher.

| Field of Study | # Graduates | % Graduates |
| Computers & Mathematics | 20 | 3.3% |
| Bio, Nature & Agricultural | 34 | 5.5% |
| Physical & Health Sciences | 14 | 2.3% |
| Psychology | 0 | 0.0% |
| Social Sciences | 1 | 0.2% |
| Engineering | 65 | 10.5% |
| Multidisciplinary Studies | 0 | 0.0% |
| Science & Technology | 60 | 9.7% |
| Business | 148 | 24.0% |
| Education | 183 | 29.7% |
| Literature & Languages | 0 | 0.0% |
| Liberal Arts & History | 32 | 5.2% |
| Visual & Performing Arts | 16 | 2.6% |
| Communications | 5 | 0.8% |
| Arts & Humanities | 38 | 6.2% |
| Total | 616 | 100.0% |
Transportation & Commute in Meagher County
Vehicle Availability by Sex in Meagher County
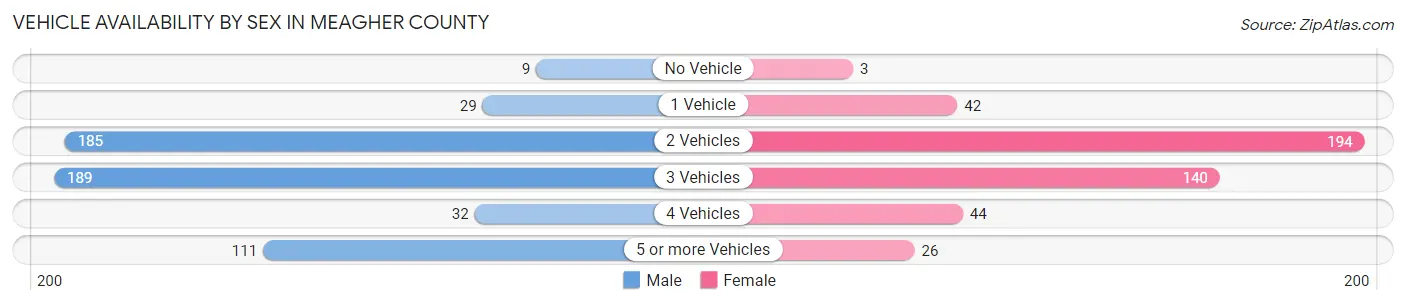
The most prevalent vehicle ownership categories in Meagher County are males with 3 vehicles (189, accounting for 34.1%) and females with 3 vehicles (140, making up 42.1%).
| Vehicles Available | Male | Female |
| No Vehicle | 9 (1.6%) | 3 (0.7%) |
| 1 Vehicle | 29 (5.2%) | 42 (9.3%) |
| 2 Vehicles | 185 (33.3%) | 194 (43.2%) |
| 3 Vehicles | 189 (34.1%) | 140 (31.2%) |
| 4 Vehicles | 32 (5.8%) | 44 (9.8%) |
| 5 or more Vehicles | 111 (20.0%) | 26 (5.8%) |
| Total | 555 (100.0%) | 449 (100.0%) |
Commute Time in Meagher County
The most frequently occuring commute durations in Meagher County are 5 to 9 minutes (258 commuters, 29.1%), less than 5 minutes (177 commuters, 20.0%), and 10 to 14 minutes (104 commuters, 11.7%).

| Commute Time | # Commuters | % Commuters |
| Less than 5 Minutes | 177 | 20.0% |
| 5 to 9 Minutes | 258 | 29.1% |
| 10 to 14 Minutes | 104 | 11.7% |
| 15 to 19 Minutes | 73 | 8.3% |
| 20 to 24 Minutes | 74 | 8.4% |
| 25 to 29 Minutes | 5 | 0.6% |
| 30 to 34 Minutes | 53 | 6.0% |
| 35 to 39 Minutes | 0 | 0.0% |
| 40 to 44 Minutes | 0 | 0.0% |
| 45 to 59 Minutes | 10 | 1.1% |
| 60 to 89 Minutes | 84 | 9.5% |
| 90 or more Minutes | 47 | 5.3% |
Commute Time by Sex in Meagher County
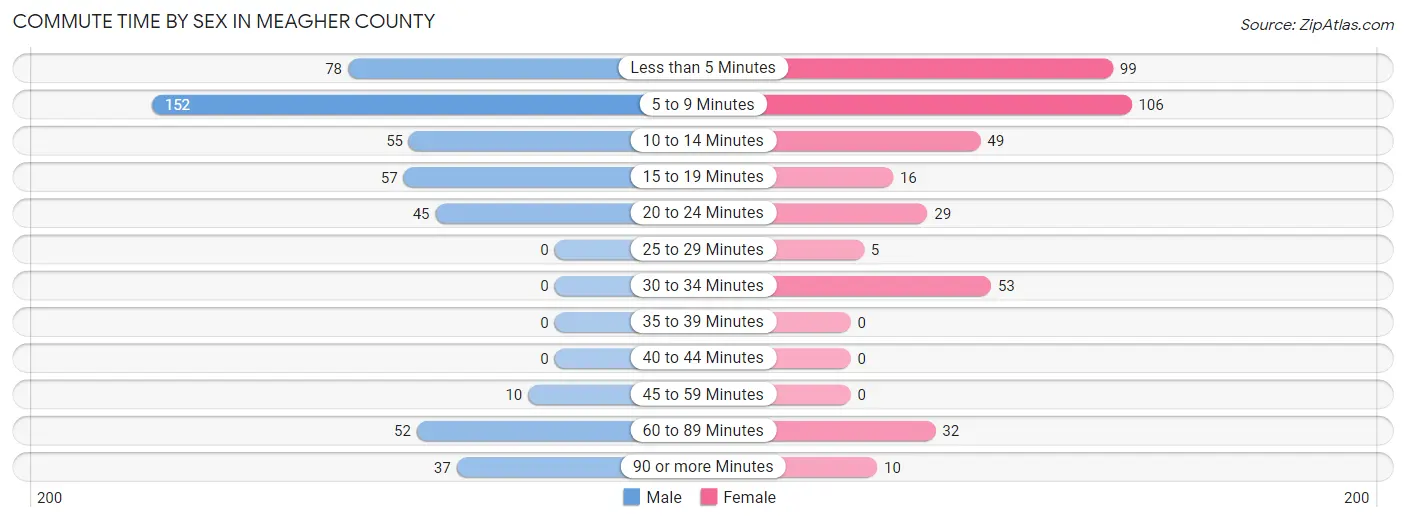
The most common commute times in Meagher County are 5 to 9 minutes (152 commuters, 31.3%) for males and 5 to 9 minutes (106 commuters, 26.6%) for females.
| Commute Time | Male | Female |
| Less than 5 Minutes | 78 (16.1%) | 99 (24.8%) |
| 5 to 9 Minutes | 152 (31.3%) | 106 (26.6%) |
| 10 to 14 Minutes | 55 (11.3%) | 49 (12.3%) |
| 15 to 19 Minutes | 57 (11.7%) | 16 (4.0%) |
| 20 to 24 Minutes | 45 (9.3%) | 29 (7.3%) |
| 25 to 29 Minutes | 0 (0.0%) | 5 (1.3%) |
| 30 to 34 Minutes | 0 (0.0%) | 53 (13.3%) |
| 35 to 39 Minutes | 0 (0.0%) | 0 (0.0%) |
| 40 to 44 Minutes | 0 (0.0%) | 0 (0.0%) |
| 45 to 59 Minutes | 10 (2.1%) | 0 (0.0%) |
| 60 to 89 Minutes | 52 (10.7%) | 32 (8.0%) |
| 90 or more Minutes | 37 (7.6%) | 10 (2.5%) |
Time of Departure to Work by Sex in Meagher County
The most frequent times of departure to work in Meagher County are 8:00 AM to 8:29 AM (104, 21.4%) for males and 7:30 AM to 7:59 AM (122, 30.6%) for females.
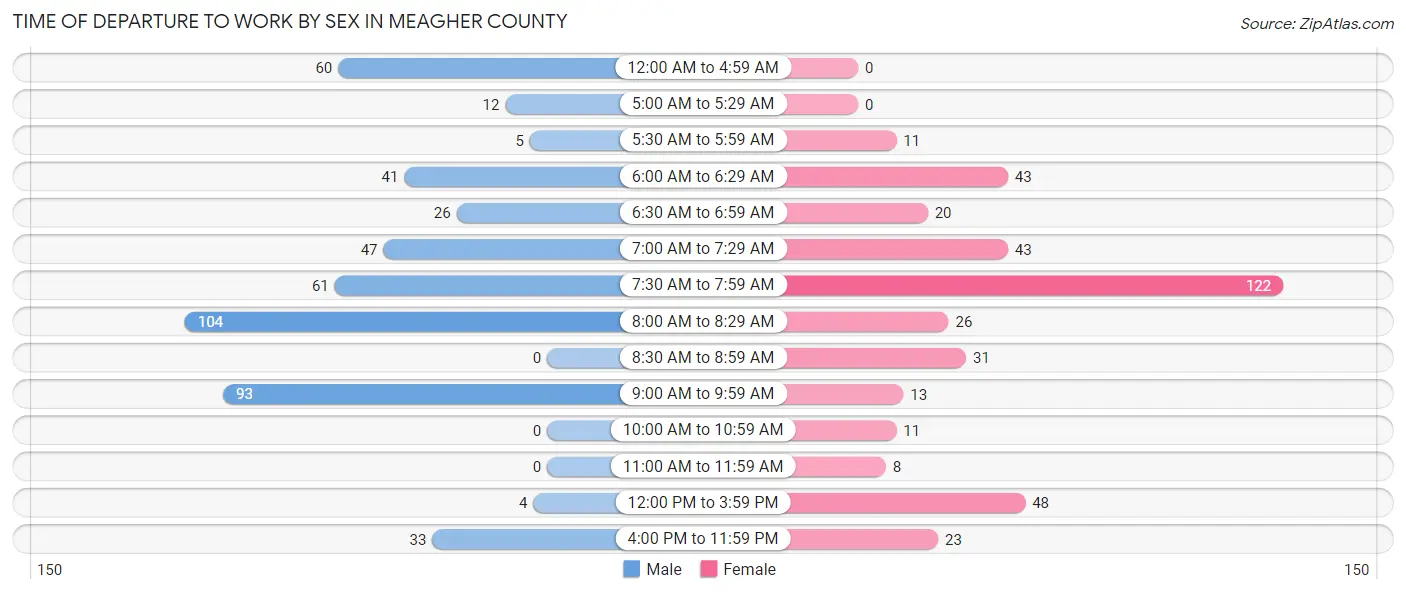
| Time of Departure | Male | Female |
| 12:00 AM to 4:59 AM | 60 (12.3%) | 0 (0.0%) |
| 5:00 AM to 5:29 AM | 12 (2.5%) | 0 (0.0%) |
| 5:30 AM to 5:59 AM | 5 (1.0%) | 11 (2.8%) |
| 6:00 AM to 6:29 AM | 41 (8.4%) | 43 (10.8%) |
| 6:30 AM to 6:59 AM | 26 (5.3%) | 20 (5.0%) |
| 7:00 AM to 7:29 AM | 47 (9.7%) | 43 (10.8%) |
| 7:30 AM to 7:59 AM | 61 (12.6%) | 122 (30.6%) |
| 8:00 AM to 8:29 AM | 104 (21.4%) | 26 (6.5%) |
| 8:30 AM to 8:59 AM | 0 (0.0%) | 31 (7.8%) |
| 9:00 AM to 9:59 AM | 93 (19.1%) | 13 (3.3%) |
| 10:00 AM to 10:59 AM | 0 (0.0%) | 11 (2.8%) |
| 11:00 AM to 11:59 AM | 0 (0.0%) | 8 (2.0%) |
| 12:00 PM to 3:59 PM | 4 (0.8%) | 48 (12.0%) |
| 4:00 PM to 11:59 PM | 33 (6.8%) | 23 (5.8%) |
| Total | 486 (100.0%) | 399 (100.0%) |
Housing Occupancy in Meagher County
Occupancy by Ownership in Meagher County
Of the total 834 dwellings in Meagher County, owner-occupied units account for 712 (85.4%), while renter-occupied units make up 122 (14.6%).

| Occupancy | # Housing Units | % Housing Units |
| Owner Occupied Housing Units | 712 | 85.4% |
| Renter-Occupied Housing Units | 122 | 14.6% |
| Total Occupied Housing Units | 834 | 100.0% |
Occupancy by Household Size in Meagher County
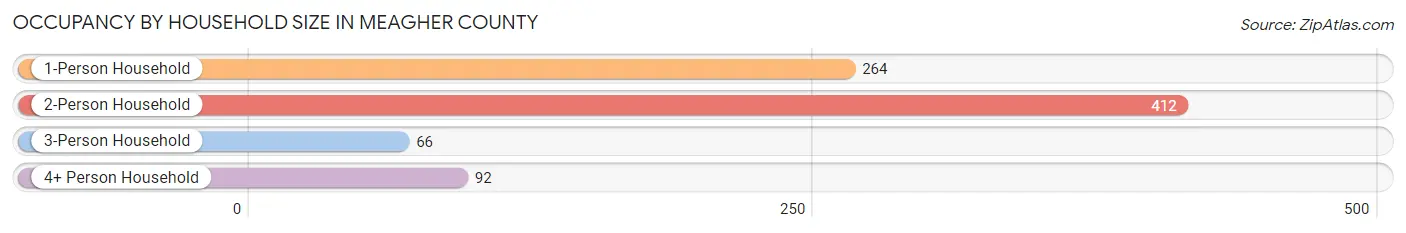
| Household Size | # Housing Units | % Housing Units |
| 1-Person Household | 264 | 31.7% |
| 2-Person Household | 412 | 49.4% |
| 3-Person Household | 66 | 7.9% |
| 4+ Person Household | 92 | 11.0% |
| Total Housing Units | 834 | 100.0% |
Occupancy by Ownership by Household Size in Meagher County

| Household Size | Owner-occupied | Renter-occupied |
| 1-Person Household | 248 (93.9%) | 16 (6.1%) |
| 2-Person Household | 346 (84.0%) | 66 (16.0%) |
| 3-Person Household | 63 (95.5%) | 3 (4.5%) |
| 4+ Person Household | 55 (59.8%) | 37 (40.2%) |
| Total Housing Units | 712 (85.4%) | 122 (14.6%) |
Occupancy by Educational Attainment in Meagher County
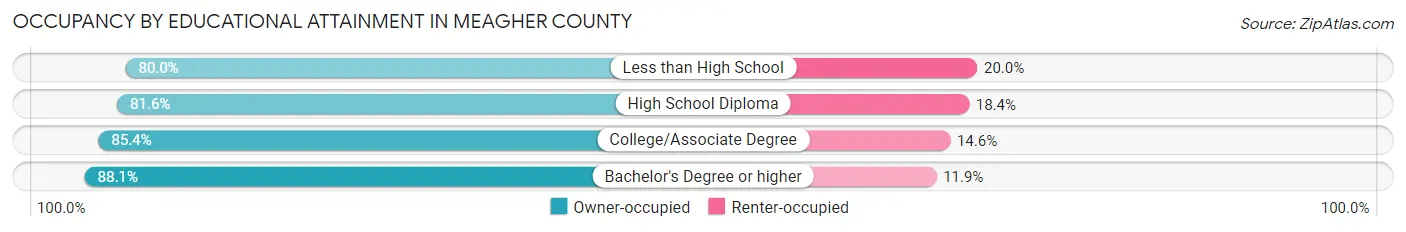
| Household Size | Owner-occupied | Renter-occupied |
| Less than High School | 4 (80.0%) | 1 (20.0%) |
| High School Diploma | 169 (81.6%) | 38 (18.4%) |
| College/Associate Degree | 280 (85.4%) | 48 (14.6%) |
| Bachelor's Degree or higher | 259 (88.1%) | 35 (11.9%) |
Occupancy by Age of Householder in Meagher County

| Age Bracket | # Households | % Households |
| Under 35 Years | 58 | 7.0% |
| 35 to 44 Years | 60 | 7.2% |
| 45 to 54 Years | 71 | 8.5% |
| 55 to 64 Years | 274 | 32.9% |
| 65 to 74 Years | 268 | 32.1% |
| 75 to 84 Years | 85 | 10.2% |
| 85 Years and Over | 18 | 2.2% |
| Total | 834 | 100.0% |
Housing Finances in Meagher County
Median Income by Occupancy in Meagher County
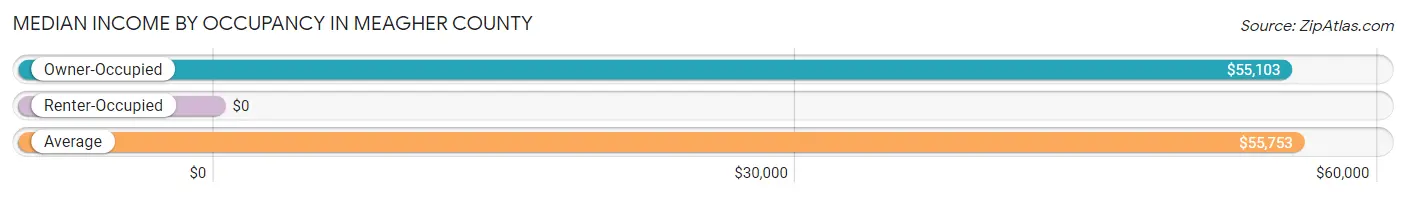
| Occupancy Type | # Households | Median Income |
| Owner-Occupied | 712 (85.4%) | $55,103 |
| Renter-Occupied | 122 (14.6%) | $0 |
| Average | 834 (100.0%) | $55,753 |
Occupancy by Householder Income Bracket in Meagher County

| Income Bracket | Owner-occupied | Renter-occupied |
| Less than $5,000 | 8 (1.1%) | 0 (0.0%) |
| $5,000 to $9,999 | 52 (7.3%) | 7 (5.7%) |
| $10,000 to $14,999 | 74 (10.4%) | 1 (0.8%) |
| $15,000 to $19,999 | 15 (2.1%) | 0 (0.0%) |
| $20,000 to $24,999 | 0 (0.0%) | 3 (2.5%) |
| $25,000 to $34,999 | 30 (4.2%) | 9 (7.4%) |
| $35,000 to $49,999 | 146 (20.5%) | 22 (18.0%) |
| $50,000 to $74,999 | 149 (20.9%) | 25 (20.5%) |
| $75,000 to $99,999 | 40 (5.6%) | 0 (0.0%) |
| $100,000 to $149,999 | 104 (14.6%) | 43 (35.2%) |
| $150,000 or more | 94 (13.2%) | 12 (9.8%) |
| Total | 712 (100.0%) | 122 (100.0%) |
Monthly Housing Cost Tiers in Meagher County
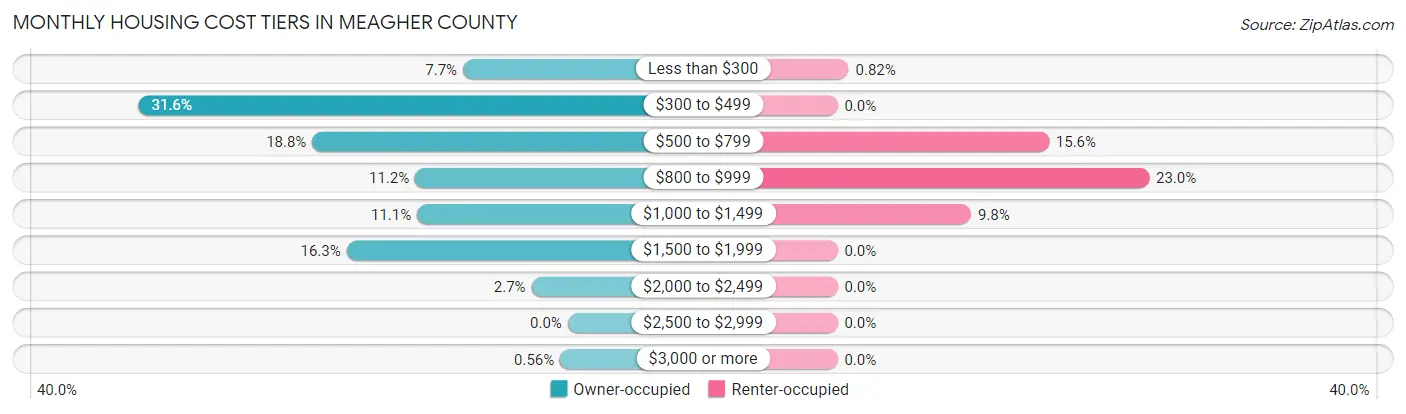
| Monthly Cost | Owner-occupied | Renter-occupied |
| Less than $300 | 55 (7.7%) | 1 (0.8%) |
| $300 to $499 | 225 (31.6%) | 0 (0.0%) |
| $500 to $799 | 134 (18.8%) | 19 (15.6%) |
| $800 to $999 | 80 (11.2%) | 28 (23.0%) |
| $1,000 to $1,499 | 79 (11.1%) | 12 (9.8%) |
| $1,500 to $1,999 | 116 (16.3%) | 0 (0.0%) |
| $2,000 to $2,499 | 19 (2.7%) | 0 (0.0%) |
| $2,500 to $2,999 | 0 (0.0%) | 0 (0.0%) |
| $3,000 or more | 4 (0.6%) | 0 (0.0%) |
| Total | 712 (100.0%) | 122 (100.0%) |
Physical Housing Characteristics in Meagher County
Housing Structures in Meagher County
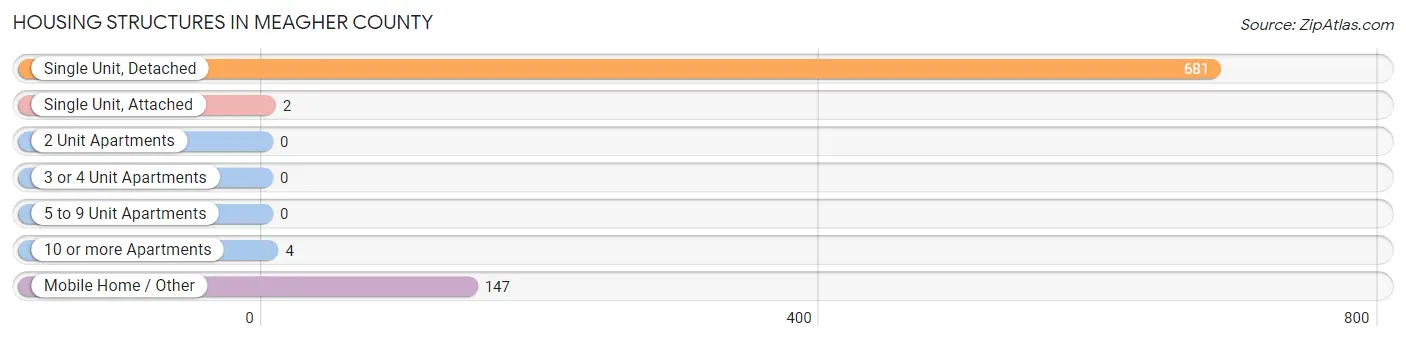
| Structure Type | # Housing Units | % Housing Units |
| Single Unit, Detached | 681 | 81.7% |
| Single Unit, Attached | 2 | 0.2% |
| 2 Unit Apartments | 0 | 0.0% |
| 3 or 4 Unit Apartments | 0 | 0.0% |
| 5 to 9 Unit Apartments | 0 | 0.0% |
| 10 or more Apartments | 4 | 0.5% |
| Mobile Home / Other | 147 | 17.6% |
| Total | 834 | 100.0% |
Housing Structures by Occupancy in Meagher County
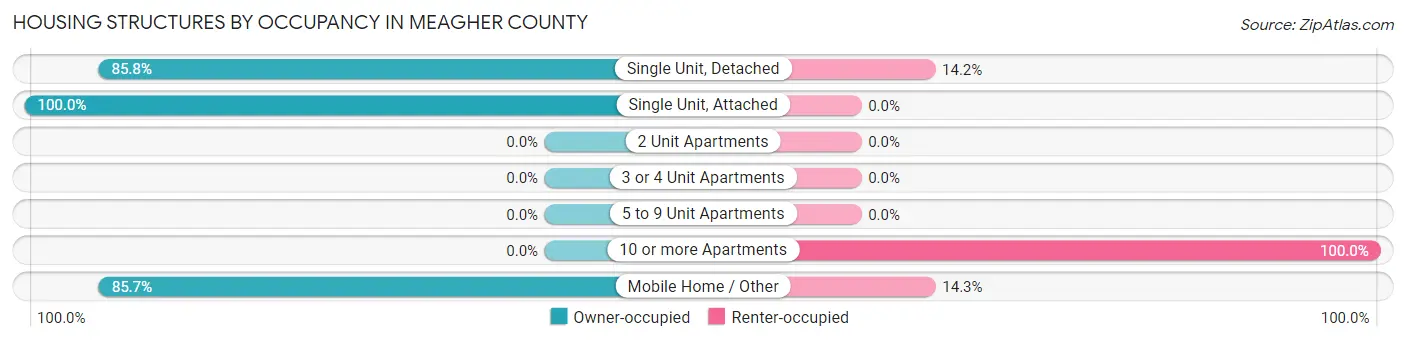
| Structure Type | Owner-occupied | Renter-occupied |
| Single Unit, Detached | 584 (85.8%) | 97 (14.2%) |
| Single Unit, Attached | 2 (100.0%) | 0 (0.0%) |
| 2 Unit Apartments | 0 (0.0%) | 0 (0.0%) |
| 3 or 4 Unit Apartments | 0 (0.0%) | 0 (0.0%) |
| 5 to 9 Unit Apartments | 0 (0.0%) | 0 (0.0%) |
| 10 or more Apartments | 0 (0.0%) | 4 (100.0%) |
| Mobile Home / Other | 126 (85.7%) | 21 (14.3%) |
| Total | 712 (85.4%) | 122 (14.6%) |
Housing Structures by Number of Rooms in Meagher County
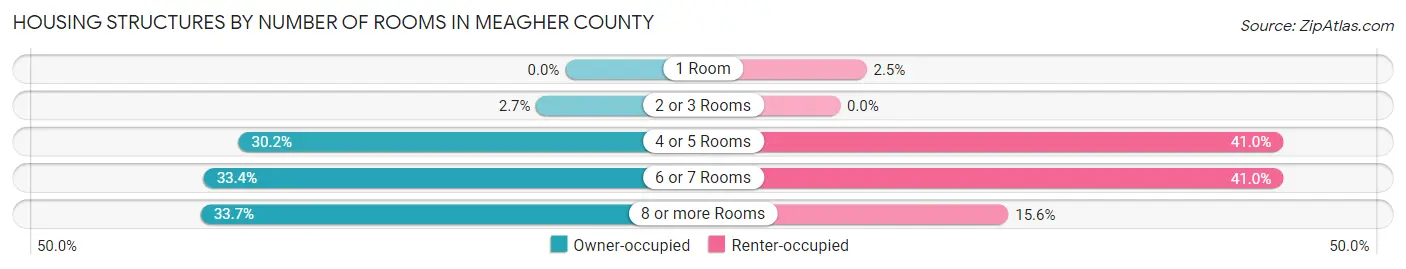
| Number of Rooms | Owner-occupied | Renter-occupied |
| 1 Room | 0 (0.0%) | 3 (2.5%) |
| 2 or 3 Rooms | 19 (2.7%) | 0 (0.0%) |
| 4 or 5 Rooms | 215 (30.2%) | 50 (41.0%) |
| 6 or 7 Rooms | 238 (33.4%) | 50 (41.0%) |
| 8 or more Rooms | 240 (33.7%) | 19 (15.6%) |
| Total | 712 (100.0%) | 122 (100.0%) |
Housing Structure by Heating Type in Meagher County
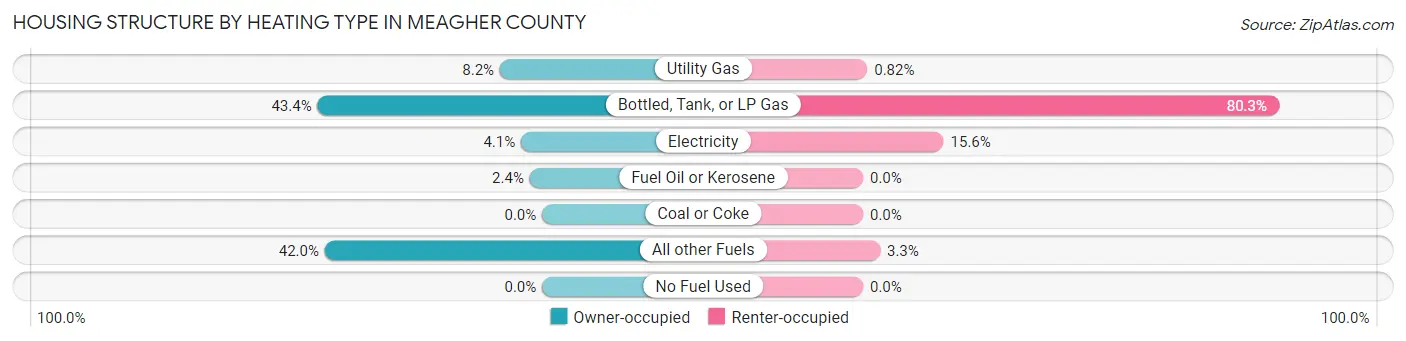
| Heating Type | Owner-occupied | Renter-occupied |
| Utility Gas | 58 (8.2%) | 1 (0.8%) |
| Bottled, Tank, or LP Gas | 309 (43.4%) | 98 (80.3%) |
| Electricity | 29 (4.1%) | 19 (15.6%) |
| Fuel Oil or Kerosene | 17 (2.4%) | 0 (0.0%) |
| Coal or Coke | 0 (0.0%) | 0 (0.0%) |
| All other Fuels | 299 (42.0%) | 4 (3.3%) |
| No Fuel Used | 0 (0.0%) | 0 (0.0%) |
| Total | 712 (100.0%) | 122 (100.0%) |
Household Vehicle Usage in Meagher County

| Vehicles per Household | Owner-occupied | Renter-occupied |
| No Vehicle | 0 (0.0%) | 3 (2.5%) |
| 1 Vehicle | 119 (16.7%) | 14 (11.5%) |
| 2 Vehicles | 248 (34.8%) | 41 (33.6%) |
| 3 or more Vehicles | 345 (48.5%) | 64 (52.5%) |
| Total | 712 (100.0%) | 122 (100.0%) |
Real Estate & Mortgages in Meagher County
Real Estate and Mortgage Overview in Meagher County
| Characteristic | Without Mortgage | With Mortgage |
| Housing Units | 449 | 263 |
| Median Property Value | $271,700 | $194,600 |
| Median Household Income | $55,051 | $36 |
| Monthly Housing Costs | $477 | $4 |
| Real Estate Taxes | $1,419 | $0 |
Property Value by Mortgage Status in Meagher County
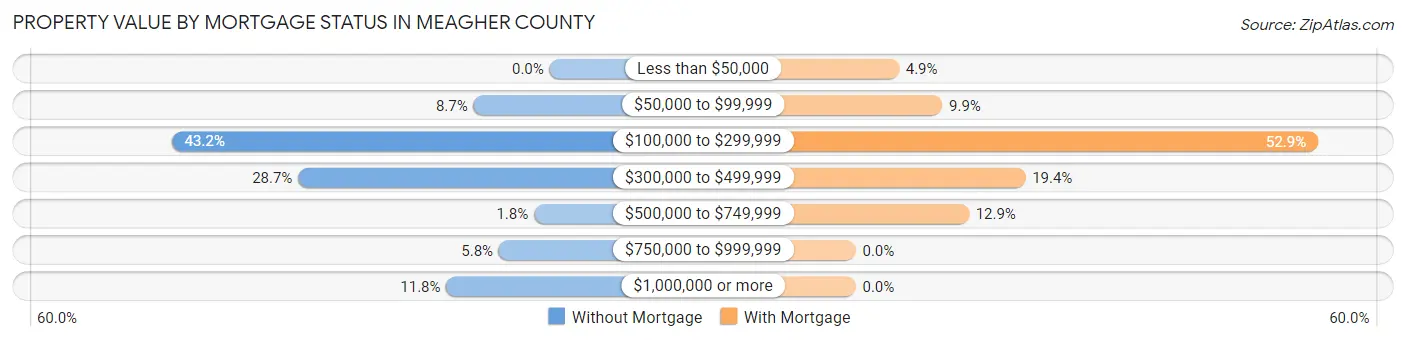
| Property Value | Without Mortgage | With Mortgage |
| Less than $50,000 | 0 (0.0%) | 13 (4.9%) |
| $50,000 to $99,999 | 39 (8.7%) | 26 (9.9%) |
| $100,000 to $299,999 | 194 (43.2%) | 139 (52.8%) |
| $300,000 to $499,999 | 129 (28.7%) | 51 (19.4%) |
| $500,000 to $749,999 | 8 (1.8%) | 34 (12.9%) |
| $750,000 to $999,999 | 26 (5.8%) | 0 (0.0%) |
| $1,000,000 or more | 53 (11.8%) | 0 (0.0%) |
| Total | 449 (100.0%) | 263 (100.0%) |
Household Income by Mortgage Status in Meagher County
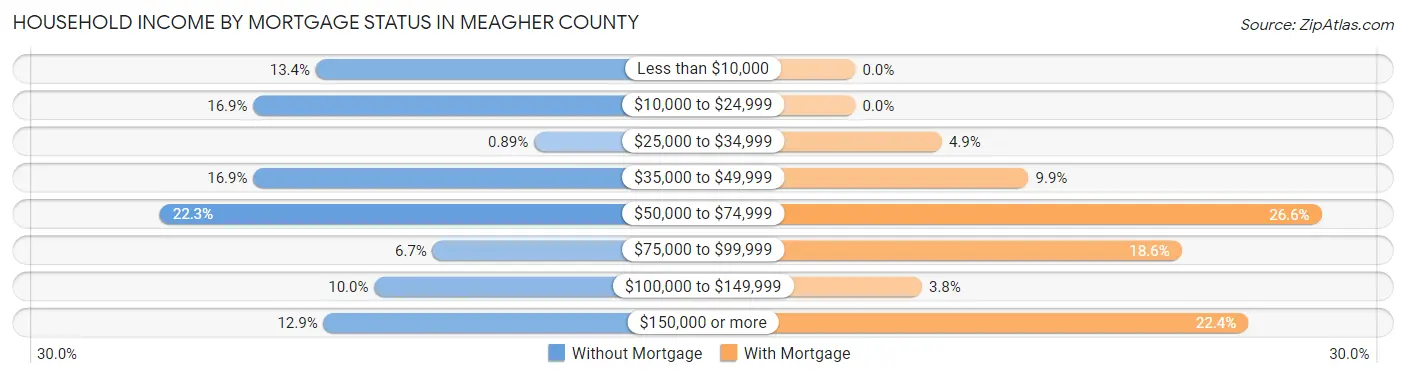
| Household Income | Without Mortgage | With Mortgage |
| Less than $10,000 | 60 (13.4%) | 0 (0.0%) |
| $10,000 to $24,999 | 76 (16.9%) | 0 (0.0%) |
| $25,000 to $34,999 | 4 (0.9%) | 13 (4.9%) |
| $35,000 to $49,999 | 76 (16.9%) | 26 (9.9%) |
| $50,000 to $74,999 | 100 (22.3%) | 70 (26.6%) |
| $75,000 to $99,999 | 30 (6.7%) | 49 (18.6%) |
| $100,000 to $149,999 | 45 (10.0%) | 10 (3.8%) |
| $150,000 or more | 58 (12.9%) | 59 (22.4%) |
| Total | 449 (100.0%) | 263 (100.0%) |
Property Value to Household Income Ratio in Meagher County
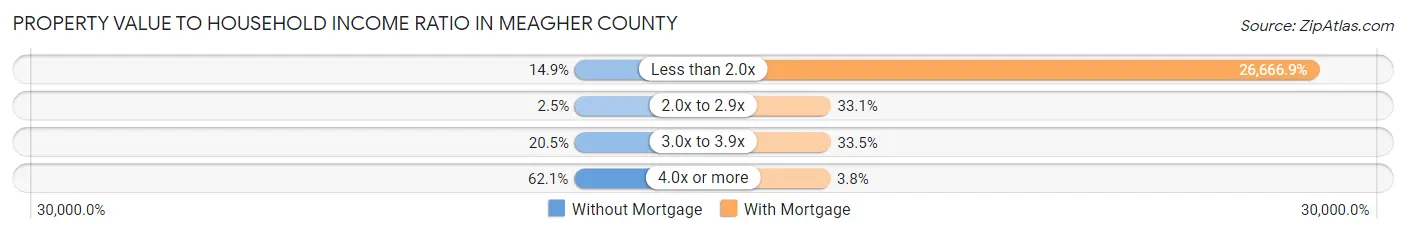
| Value-to-Income Ratio | Without Mortgage | With Mortgage |
| Less than 2.0x | 67 (14.9%) | 70,134 (26,666.9%) |
| 2.0x to 2.9x | 11 (2.5%) | 87 (33.1%) |
| 3.0x to 3.9x | 92 (20.5%) | 88 (33.5%) |
| 4.0x or more | 279 (62.1%) | 10 (3.8%) |
| Total | 449 (100.0%) | 263 (100.0%) |
Real Estate Taxes by Mortgage Status in Meagher County
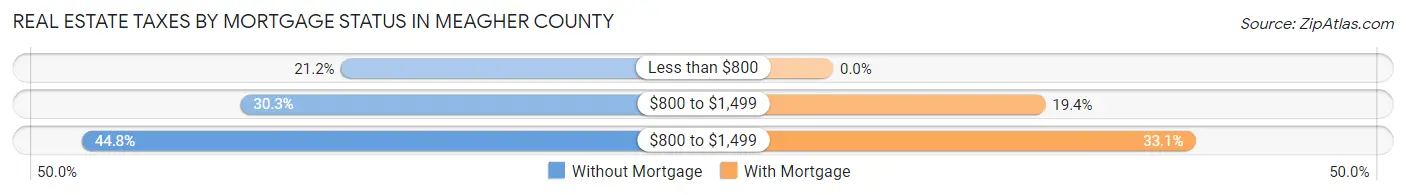
| Property Taxes | Without Mortgage | With Mortgage |
| Less than $800 | 95 (21.2%) | 0 (0.0%) |
| $800 to $1,499 | 136 (30.3%) | 51 (19.4%) |
| $800 to $1,499 | 201 (44.8%) | 87 (33.1%) |
| Total | 449 (100.0%) | 263 (100.0%) |
Health & Disability in Meagher County
Health Insurance Coverage by Age in Meagher County
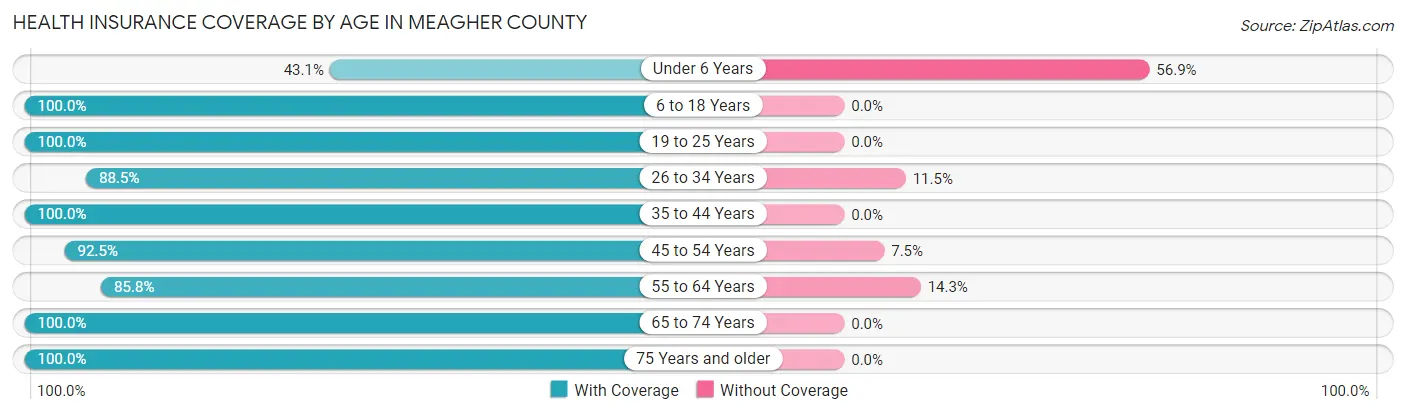
| Age Bracket | With Coverage | Without Coverage |
| Under 6 Years | 25 (43.1%) | 33 (56.9%) |
| 6 to 18 Years | 298 (100.0%) | 0 (0.0%) |
| 19 to 25 Years | 102 (100.0%) | 0 (0.0%) |
| 26 to 34 Years | 85 (88.5%) | 11 (11.5%) |
| 35 to 44 Years | 109 (100.0%) | 0 (0.0%) |
| 45 to 54 Years | 186 (92.5%) | 15 (7.5%) |
| 55 to 64 Years | 373 (85.8%) | 62 (14.2%) |
| 65 to 74 Years | 494 (100.0%) | 0 (0.0%) |
| 75 Years and older | 128 (100.0%) | 0 (0.0%) |
| Total | 1,800 (93.7%) | 121 (6.3%) |
Health Insurance Coverage by Citizenship Status in Meagher County
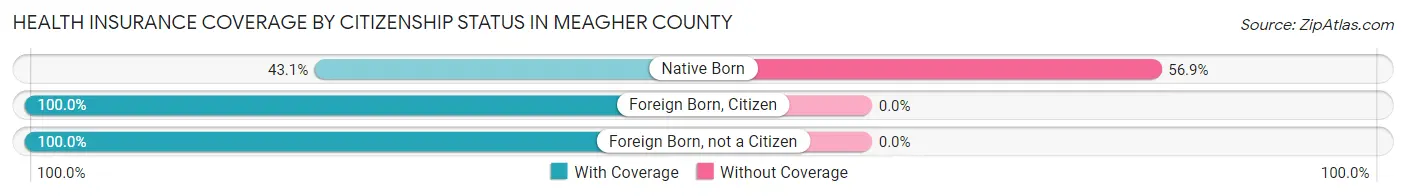
| Citizenship Status | With Coverage | Without Coverage |
| Native Born | 25 (43.1%) | 33 (56.9%) |
| Foreign Born, Citizen | 298 (100.0%) | 0 (0.0%) |
| Foreign Born, not a Citizen | 102 (100.0%) | 0 (0.0%) |
Health Insurance Coverage by Household Income in Meagher County
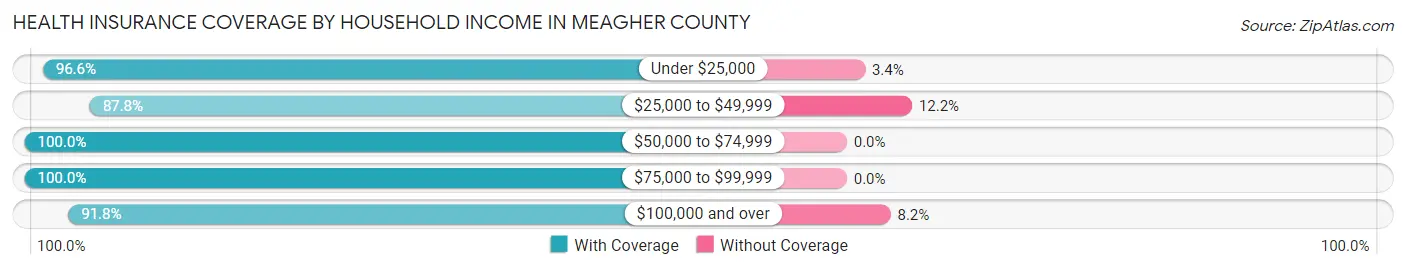
| Household Income | With Coverage | Without Coverage |
| Under $25,000 | 198 (96.6%) | 7 (3.4%) |
| $25,000 to $49,999 | 338 (87.8%) | 47 (12.2%) |
| $50,000 to $74,999 | 400 (100.0%) | 0 (0.0%) |
| $75,000 to $99,999 | 110 (100.0%) | 0 (0.0%) |
| $100,000 and over | 751 (91.8%) | 67 (8.2%) |
Public vs Private Health Insurance Coverage by Age in Meagher County

| Age Bracket | Public Insurance | Private Insurance |
| Under 6 | 16 (27.6%) | 9 (15.5%) |
| 6 to 18 Years | 136 (45.6%) | 162 (54.4%) |
| 19 to 25 Years | 49 (48.0%) | 53 (52.0%) |
| 25 to 34 Years | 10 (10.4%) | 75 (78.1%) |
| 35 to 44 Years | 20 (18.3%) | 89 (81.7%) |
| 45 to 54 Years | 44 (21.9%) | 142 (70.7%) |
| 55 to 64 Years | 114 (26.2%) | 281 (64.6%) |
| 65 to 74 Years | 487 (98.6%) | 245 (49.6%) |
| 75 Years and over | 128 (100.0%) | 70 (54.7%) |
| Total | 1,004 (52.3%) | 1,126 (58.6%) |
Disability Status by Sex by Age in Meagher County
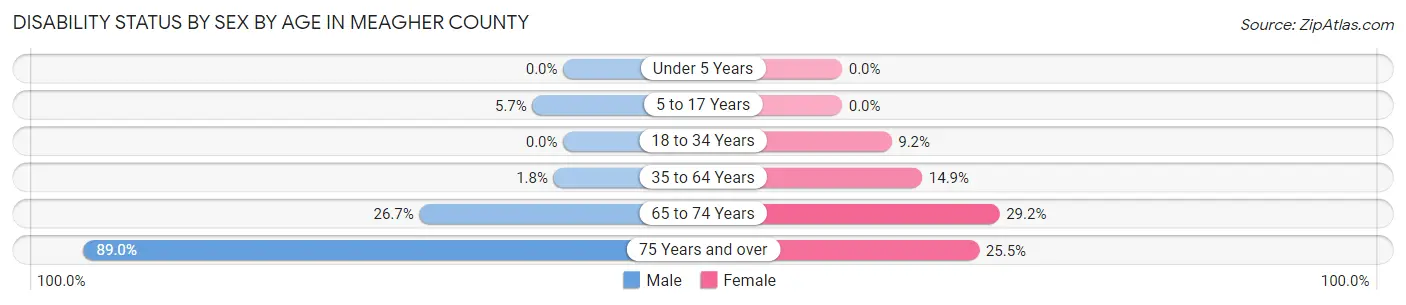
| Age Bracket | Male | Female |
| Under 5 Years | 0 (0.0%) | 0 (0.0%) |
| 5 to 17 Years | 9 (5.7%) | 0 (0.0%) |
| 18 to 34 Years | 0 (0.0%) | 9 (9.2%) |
| 35 to 64 Years | 7 (1.8%) | 52 (14.9%) |
| 65 to 74 Years | 67 (26.7%) | 71 (29.2%) |
| 75 Years and over | 65 (89.0%) | 14 (25.5%) |
Disability Class by Sex by Age in Meagher County
Disability Class: Hearing Difficulty

| Age Bracket | Male | Female |
| Under 5 Years | 0 (0.0%) | 0 (0.0%) |
| 5 to 17 Years | 0 (0.0%) | 0 (0.0%) |
| 18 to 34 Years | 0 (0.0%) | 0 (0.0%) |
| 35 to 64 Years | 0 (0.0%) | 0 (0.0%) |
| 65 to 74 Years | 20 (8.0%) | 19 (7.8%) |
| 75 Years and over | 56 (76.7%) | 13 (23.6%) |
Disability Class: Vision Difficulty

| Age Bracket | Male | Female |
| Under 5 Years | 0 (0.0%) | 0 (0.0%) |
| 5 to 17 Years | 0 (0.0%) | 0 (0.0%) |
| 18 to 34 Years | 0 (0.0%) | 0 (0.0%) |
| 35 to 64 Years | 0 (0.0%) | 0 (0.0%) |
| 65 to 74 Years | 0 (0.0%) | 0 (0.0%) |
| 75 Years and over | 15 (20.5%) | 0 (0.0%) |
Disability Class: Cognitive Difficulty
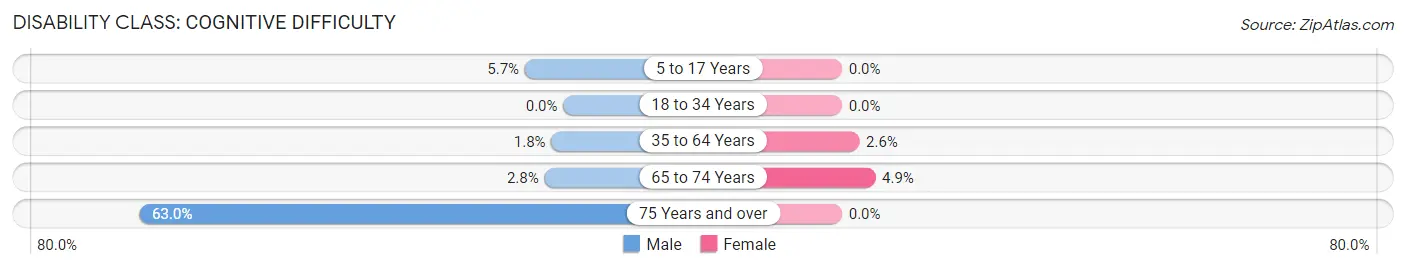
| Age Bracket | Male | Female |
| 5 to 17 Years | 9 (5.7%) | 0 (0.0%) |
| 18 to 34 Years | 0 (0.0%) | 0 (0.0%) |
| 35 to 64 Years | 7 (1.8%) | 9 (2.6%) |
| 65 to 74 Years | 7 (2.8%) | 12 (4.9%) |
| 75 Years and over | 46 (63.0%) | 0 (0.0%) |
Disability Class: Ambulatory Difficulty

| Age Bracket | Male | Female |
| 5 to 17 Years | 0 (0.0%) | 0 (0.0%) |
| 18 to 34 Years | 0 (0.0%) | 9 (9.2%) |
| 35 to 64 Years | 0 (0.0%) | 52 (14.9%) |
| 65 to 74 Years | 47 (18.7%) | 19 (7.8%) |
| 75 Years and over | 40 (54.8%) | 5 (9.1%) |
Disability Class: Self-Care Difficulty
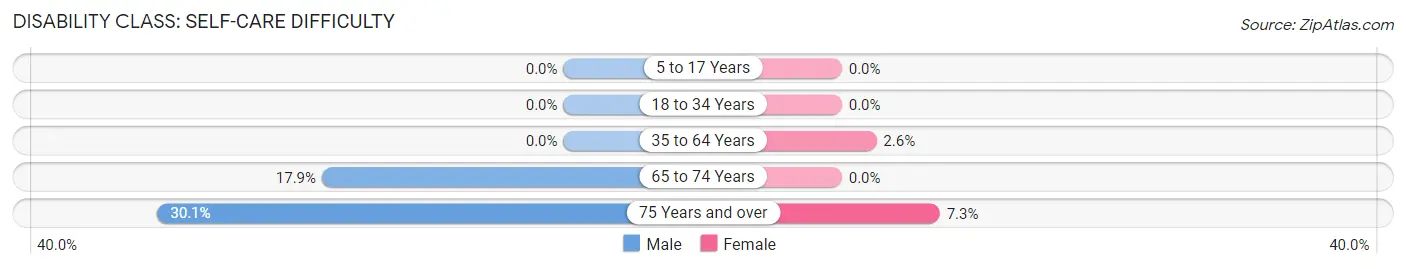
| Age Bracket | Male | Female |
| 5 to 17 Years | 0 (0.0%) | 0 (0.0%) |
| 18 to 34 Years | 0 (0.0%) | 0 (0.0%) |
| 35 to 64 Years | 0 (0.0%) | 9 (2.6%) |
| 65 to 74 Years | 45 (17.9%) | 0 (0.0%) |
| 75 Years and over | 22 (30.1%) | 4 (7.3%) |
Technology Access in Meagher County
Computing Device Access in Meagher County
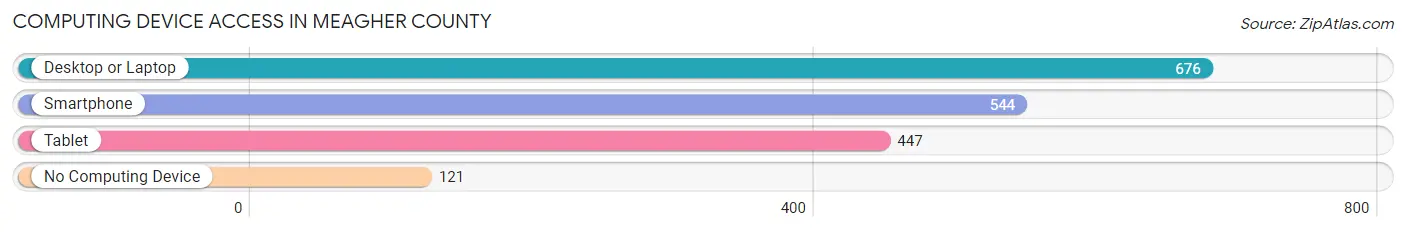
| Device Type | # Households | % Households |
| Desktop or Laptop | 676 | 81.1% |
| Smartphone | 544 | 65.2% |
| Tablet | 447 | 53.6% |
| No Computing Device | 121 | 14.5% |
| Total | 834 | 100.0% |
Internet Access in Meagher County

| Internet Type | # Households | % Households |
| Dial-Up Internet | 15 | 1.8% |
| Broadband Home | 534 | 64.0% |
| Cellular Data Only | 39 | 4.7% |
| Satellite Internet | 41 | 4.9% |
| No Internet | 172 | 20.6% |
| Total | 834 | 100.0% |
Meagher County Summary
Meagher County is located in the state of Montana, in the United States of America. It is bordered by Cascade County to the north, Lewis and Clark County to the east, Broadwater County to the south, and Park County to the west. The county seat is White Sulphur Springs, and the largest city is Martinsdale. Meagher County is part of the Great Falls, MT Metropolitan Statistical Area.
History
Meagher County was created in 1919 from parts of Cascade, Lewis and Clark, and Park Counties. It was named after Thomas Francis Meagher, an Irish patriot who served as the first Governor of the Montana Territory. Meagher County was originally inhabited by the Blackfeet and Gros Ventre tribes, and later by settlers of European descent. The first permanent settlement in the county was established in 1864, when a group of miners and ranchers arrived in the area.
Geography
Meagher County covers an area of 1,845 square miles, making it the fourth-largest county in Montana. The county is located in the Rocky Mountain region of the state, and is characterized by rolling hills, grassy plains, and rugged mountains. The highest point in the county is Mount Baldy, which has an elevation of 8,890 feet. The county is home to several rivers, including the Smith, Dearborn, and Missouri Rivers.
The climate of Meagher County is semi-arid, with hot summers and cold winters. The average annual temperature is 44°F, and the average annual precipitation is 13.5 inches.
Economy
The economy of Meagher County is largely based on agriculture and tourism. The county is home to several large ranches, and the agricultural sector is the largest employer in the county. Cattle, sheep, and hay are the main agricultural products.
Tourism is also an important part of the economy, as the county is home to several popular attractions, including the Lewis and Clark Caverns State Park, the Smith River, and the White Sulphur Springs National Fish Hatchery.
Demographics
As of the 2010 census, Meagher County had a population of 7,049. The racial makeup of the county was 95.3% White, 0.7% Native American, 0.3% Asian, 0.2% Black or African American, 0.1% Pacific Islander, and 2.4% from two or more races. The median household income was $37,945, and the median family income was $45,938.
Meagher County is home to a large number of veterans, with 8.3% of the population having served in the military. The county is also home to a large number of retirees, with 16.3% of the population over the age of 65. The largest religious group in the county is the Catholic Church, with 28.3% of the population identifying as Catholic.
Common Questions
What is the Total Population of Meagher County?
Total Population of Meagher County is 1,948.
What is the Total Male Population of Meagher County?
Total Male Population of Meagher County is 1,057.
What is the Total Female Population of Meagher County?
Total Female Population of Meagher County is 891.
What is the Ratio of Males per 100 Females in Meagher County?
There are 118.63 Males per 100 Females in Meagher County.
What is the Ratio of Females per 100 Males in Meagher County?
There are 84.30 Females per 100 Males in Meagher County.
What is the Median Population Age in Meagher County?
Median Population Age in Meagher County is 57.6 Years.
What is the Average Family Size in Meagher County
Average Family Size in Meagher County is 2.7 People.
What is the Average Household Size in Meagher County
Average Household Size in Meagher County is 2.3 People.
What is Per Capita Income in Meagher County?
Per Capita income in Meagher County is $37,498.
What is the Median Family Income in Meagher County?
Median Family Income in Meagher County is $72,357.
What is the Median Household income in Meagher County?
Median Household Income in Meagher County is $55,753.
What is Income or Wage Gap in Meagher County?
Income or Wage Gap in Meagher County is 33.0%.
Women in Meagher County earn 67.0 cents for every dollar earned by a man.
What is Family Income Deficit in Meagher County?
Family Income Deficit in Meagher County is $11,041.
Families that are below poverty line in Meagher County earn $11,041 less on average than the poverty threshold level.
What is Inequality or Gini Index in Meagher County?
Inequality or Gini Index in Meagher County is 0.46.
How Large is the Labor Force in Meagher County?
There are 1,037 People in the Labor Forcein in Meagher County.
What is the Percentage of People in the Labor Force in Meagher County?
61.1% of People are in the Labor Force in Meagher County.
What is the Unemployment Rate in Meagher County?
Unemployment Rate in Meagher County is 1.5%.