McCone County, MT
McCone County Map
McCone County Overview
1,746
TOTAL POPULATION
913
MALE POPULATION
833
FEMALE POPULATION
109.60
MALES / 100 FEMALES
91.24
FEMALES / 100 MALES
54.0
MEDIAN AGE
2.9
AVG FAMILY SIZE
2.2
AVG HOUSEHOLD SIZE
$39,284
PER CAPITA INCOME
$85,417
AVG FAMILY INCOME
$79,022
AVG HOUSEHOLD INCOME
13.0%
WAGE / INCOME GAP [ % ]
87.0¢/ $1
WAGE / INCOME GAP [ $ ]
$9,500
FAMILY INCOME DEFICIT
0.36
INEQUALITY / GINI INDEX
938
LABOR FORCE [ PEOPLE ]
63.4%
PERCENT IN LABOR FORCE
2.5%
UNEMPLOYMENT RATE
McCone County Area Codes
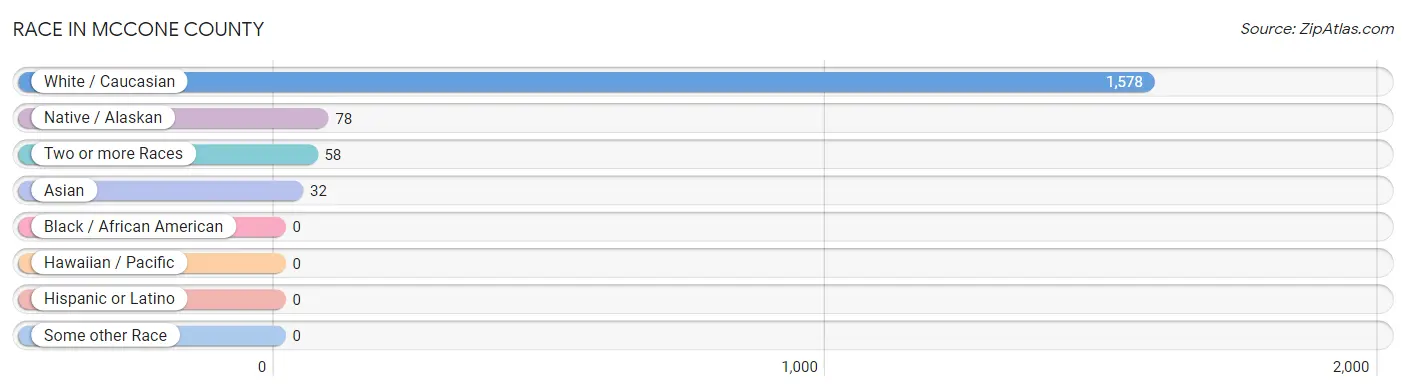
Race in McCone County
The most populous races in McCone County are White / Caucasian (1,578 | 90.4%), Native / Alaskan (78 | 4.5%), and Two or more Races (58 | 3.3%).
| Race | # Population | % Population |
| Asian | 32 | 1.8% |
| Black / African American | 0 | 0.0% |
| Hawaiian / Pacific | 0 | 0.0% |
| Hispanic or Latino | 0 | 0.0% |
| Native / Alaskan | 78 | 4.5% |
| White / Caucasian | 1,578 | 90.4% |
| Two or more Races | 58 | 3.3% |
| Some other Race | 0 | 0.0% |
| Total | 1,746 | 100.0% |
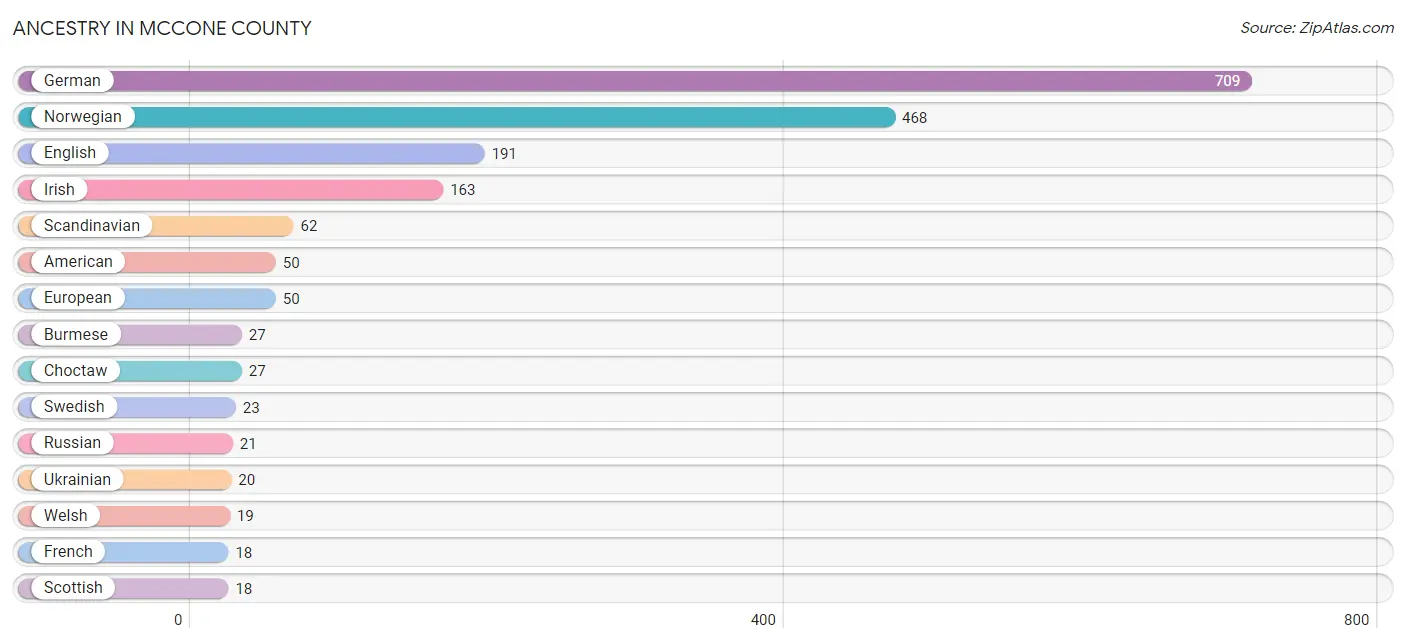
Ancestry in McCone County
The most populous ancestries reported in McCone County are German (709 | 40.6%), Norwegian (468 | 26.8%), English (191 | 10.9%), Irish (163 | 9.3%), and Scandinavian (62 | 3.5%), together accounting for 91.2% of all McCone County residents.
| Ancestry | # Population | % Population |
| American | 50 | 2.9% |
| Austrian | 6 | 0.3% |
| British | 4 | 0.2% |
| Burmese | 27 | 1.5% |
| Canadian | 13 | 0.7% |
| Cherokee | 6 | 0.3% |
| Cheyenne | 9 | 0.5% |
| Choctaw | 27 | 1.5% |
| Czech | 4 | 0.2% |
| Czechoslovakian | 10 | 0.6% |
| Danish | 5 | 0.3% |
| Dutch | 17 | 1.0% |
| English | 191 | 10.9% |
| European | 50 | 2.9% |
| Finnish | 3 | 0.2% |
| French | 18 | 1.0% |
| French Canadian | 3 | 0.2% |
| German | 709 | 40.6% |
| Irish | 163 | 9.3% |
| Italian | 7 | 0.4% |
| Korean | 5 | 0.3% |
| Norwegian | 468 | 26.8% |
| Osage | 13 | 0.7% |
| Pennsylvania German | 14 | 0.8% |
| Polish | 16 | 0.9% |
| Portuguese | 4 | 0.2% |
| Russian | 21 | 1.2% |
| Scandinavian | 62 | 3.5% |
| Scotch-Irish | 2 | 0.1% |
| Scottish | 18 | 1.0% |
| Swedish | 23 | 1.3% |
| Swiss | 12 | 0.7% |
| Ukrainian | 20 | 1.1% |
| Welsh | 19 | 1.1% | View All 34 Rows |
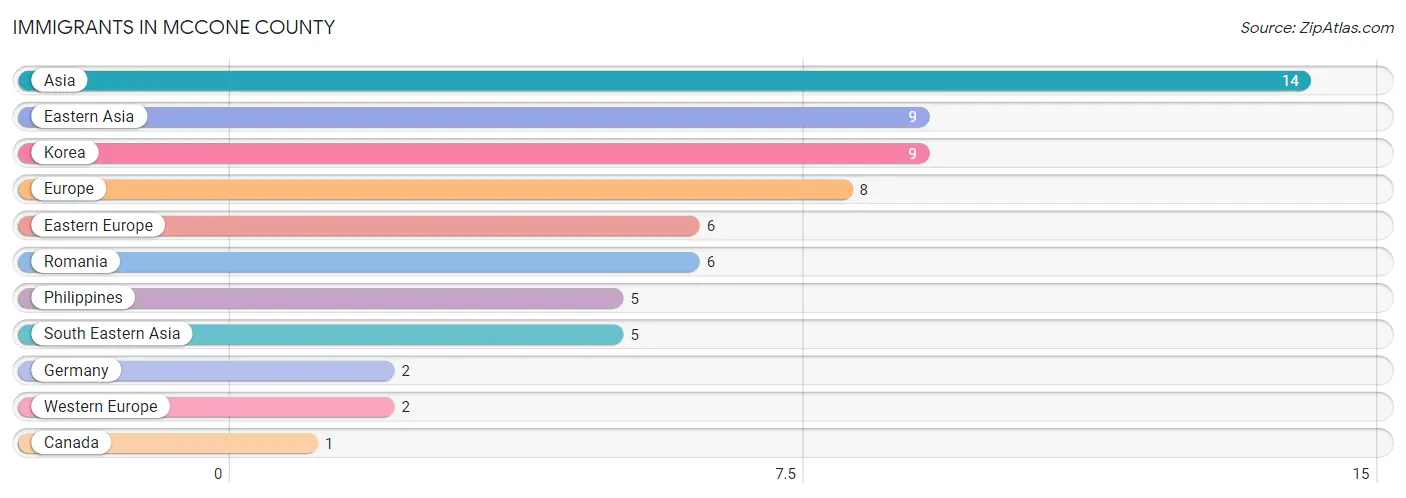
Immigrants in McCone County
The most numerous immigrant groups reported in McCone County came from Asia (14 | 0.8%), Eastern Asia (9 | 0.5%), Korea (9 | 0.5%), Europe (8 | 0.5%), and Eastern Europe (6 | 0.3%), together accounting for 2.6% of all McCone County residents.
| Immigration Origin | # Population | % Population |
| Asia | 14 | 0.8% |
| Canada | 1 | 0.1% |
| Eastern Asia | 9 | 0.5% |
| Eastern Europe | 6 | 0.3% |
| Europe | 8 | 0.5% |
| Germany | 2 | 0.1% |
| Korea | 9 | 0.5% |
| Philippines | 5 | 0.3% |
| Romania | 6 | 0.3% |
| South Eastern Asia | 5 | 0.3% |
| Western Europe | 2 | 0.1% | View All 11 Rows |
Sex and Age in McCone County
Sex and Age in McCone County
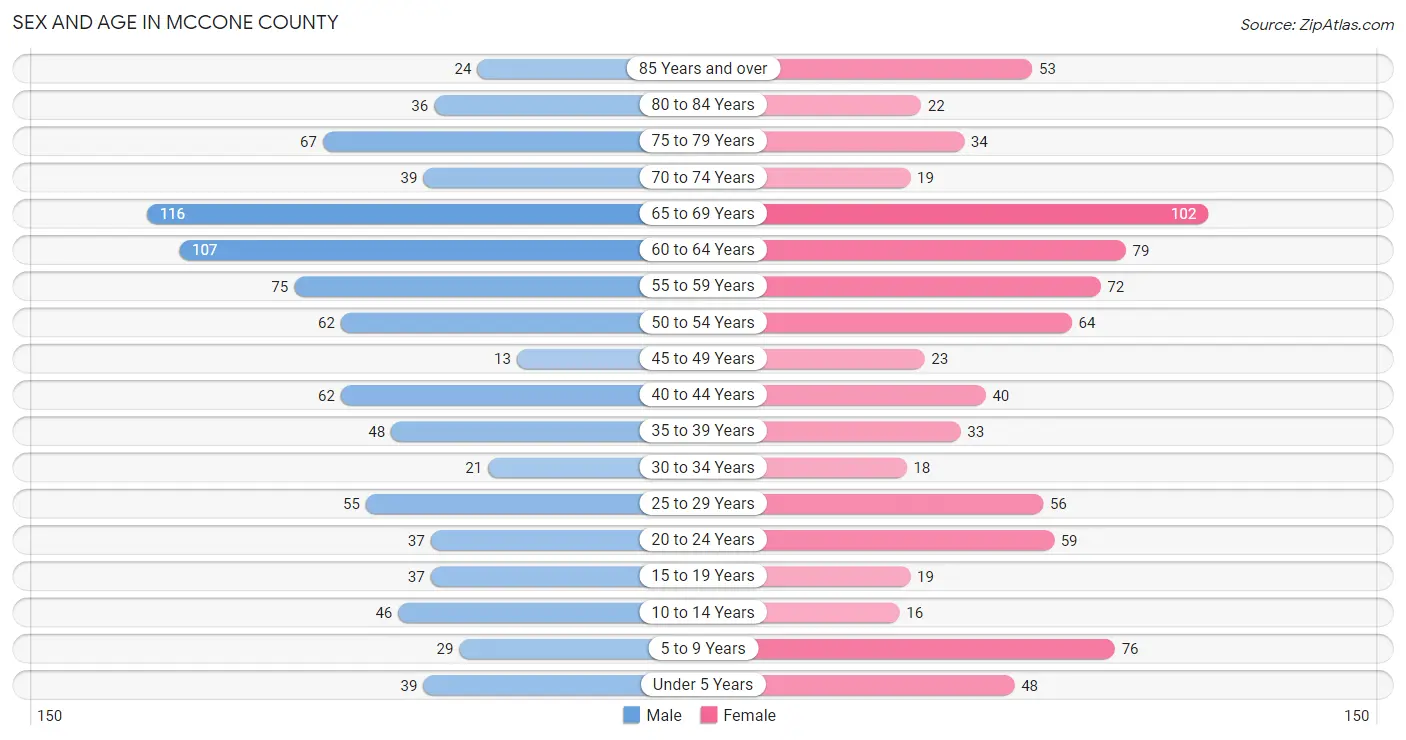
The most populous age groups in McCone County are 65 to 69 Years (116 | 12.7%) for men and 65 to 69 Years (102 | 12.2%) for women.
| Age Bracket | Male | Female |
| Under 5 Years | 39 (4.3%) | 48 (5.8%) |
| 5 to 9 Years | 29 (3.2%) | 76 (9.1%) |
| 10 to 14 Years | 46 (5.0%) | 16 (1.9%) |
| 15 to 19 Years | 37 (4.1%) | 19 (2.3%) |
| 20 to 24 Years | 37 (4.1%) | 59 (7.1%) |
| 25 to 29 Years | 55 (6.0%) | 56 (6.7%) |
| 30 to 34 Years | 21 (2.3%) | 18 (2.2%) |
| 35 to 39 Years | 48 (5.3%) | 33 (4.0%) |
| 40 to 44 Years | 62 (6.8%) | 40 (4.8%) |
| 45 to 49 Years | 13 (1.4%) | 23 (2.8%) |
| 50 to 54 Years | 62 (6.8%) | 64 (7.7%) |
| 55 to 59 Years | 75 (8.2%) | 72 (8.6%) |
| 60 to 64 Years | 107 (11.7%) | 79 (9.5%) |
| 65 to 69 Years | 116 (12.7%) | 102 (12.2%) |
| 70 to 74 Years | 39 (4.3%) | 19 (2.3%) |
| 75 to 79 Years | 67 (7.3%) | 34 (4.1%) |
| 80 to 84 Years | 36 (3.9%) | 22 (2.6%) |
| 85 Years and over | 24 (2.6%) | 53 (6.4%) |
| Total | 913 (100.0%) | 833 (100.0%) |
Families and Households in McCone County
Median Family Size in McCone County
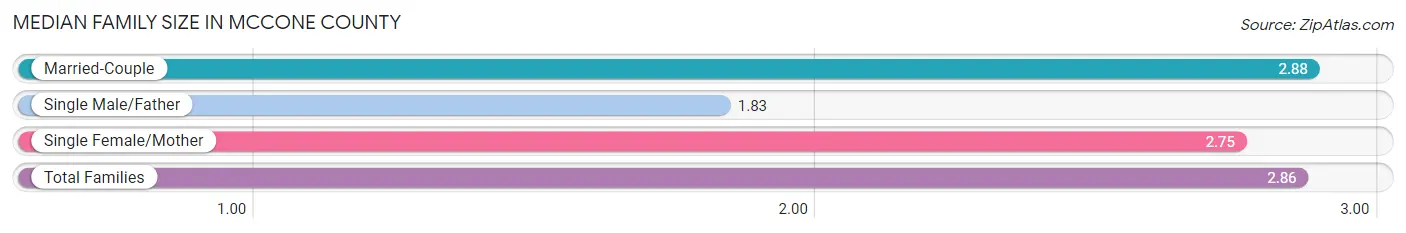
The median family size in McCone County is 2.86 persons per family, with married-couple families (456 | 93.8%) accounting for the largest median family size of 2.88 persons per family. On the other hand, single male/father families (6 | 1.2%) represent the smallest median family size with 1.83 persons per family.
| Family Type | # Families | Family Size |
| Married-Couple | 456 (93.8%) | 2.88 |
| Single Male/Father | 6 (1.2%) | 1.83 |
| Single Female/Mother | 24 (4.9%) | 2.75 |
| Total Families | 486 (100.0%) | 2.86 |
Median Household Size in McCone County
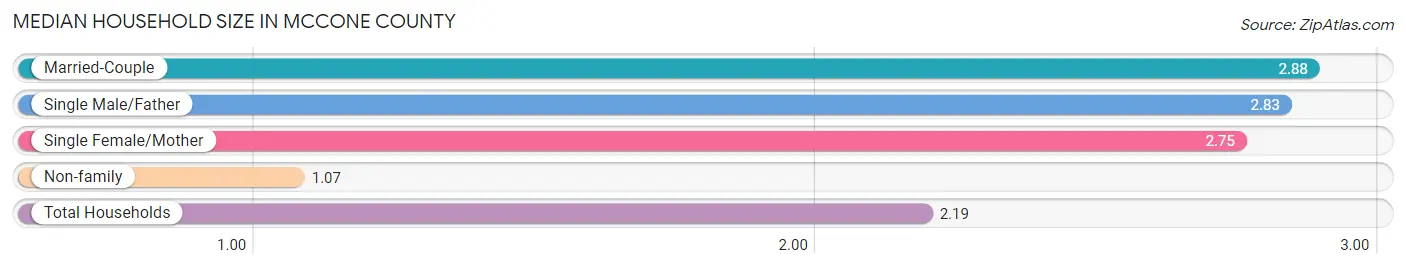
The median household size in McCone County is 2.19 persons per household, with married-couple households (456 | 58.3%) accounting for the largest median household size of 2.88 persons per household. non-family households (296 | 37.9%) represent the smallest median household size with 1.07 persons per household.
| Household Type | # Households | Household Size |
| Married-Couple | 456 (58.3%) | 2.88 |
| Single Male/Father | 6 (0.8%) | 2.83 |
| Single Female/Mother | 24 (3.1%) | 2.75 |
| Non-family | 296 (37.9%) | 1.07 |
| Total Households | 782 (100.0%) | 2.19 |
Household Size by Marriage Status in McCone County
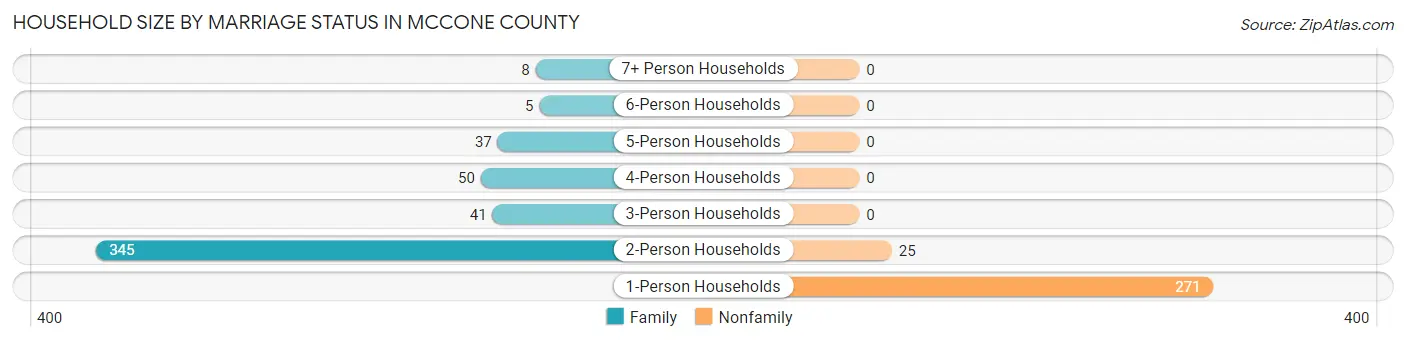
Out of a total of 782 households in McCone County, 486 (62.2%) are family households, while 296 (37.9%) are nonfamily households. The most numerous type of family households are 2-person households, comprising 345, and the most common type of nonfamily households are 1-person households, comprising 271.
| Household Size | Family Households | Nonfamily Households |
| 1-Person Households | - | 271 (34.6%) |
| 2-Person Households | 345 (44.1%) | 25 (3.2%) |
| 3-Person Households | 41 (5.2%) | 0 (0.0%) |
| 4-Person Households | 50 (6.4%) | 0 (0.0%) |
| 5-Person Households | 37 (4.7%) | 0 (0.0%) |
| 6-Person Households | 5 (0.6%) | 0 (0.0%) |
| 7+ Person Households | 8 (1.0%) | 0 (0.0%) |
| Total | 486 (62.2%) | 296 (37.9%) |
Female Fertility in McCone County
Fertility by Age in McCone County
Average fertility rate in McCone County is 126.0 births per 1,000 women. Women in the age bracket of 20 to 34 years have the highest fertility rate with 248.0 births per 1,000 women. Women in the age bracket of 20 to 34 years acount for 100.0% of all women with births.
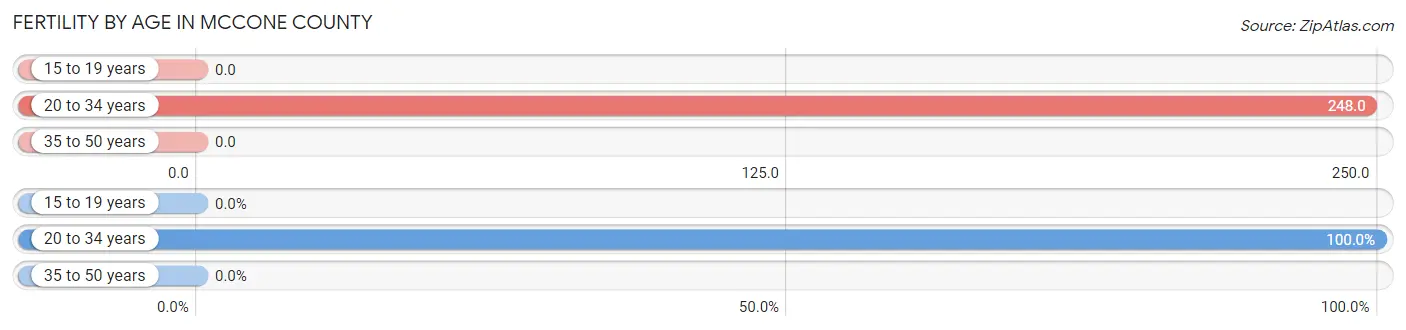
| Age Bracket | Women with Births | Births / 1,000 Women |
| 15 to 19 years | 0 (0.0%) | 0.0 |
| 20 to 34 years | 33 (100.0%) | 248.0 |
| 35 to 50 years | 0 (0.0%) | 0.0 |
| Total | 33 (100.0%) | 126.0 |
Fertility by Age by Marriage Status in McCone County
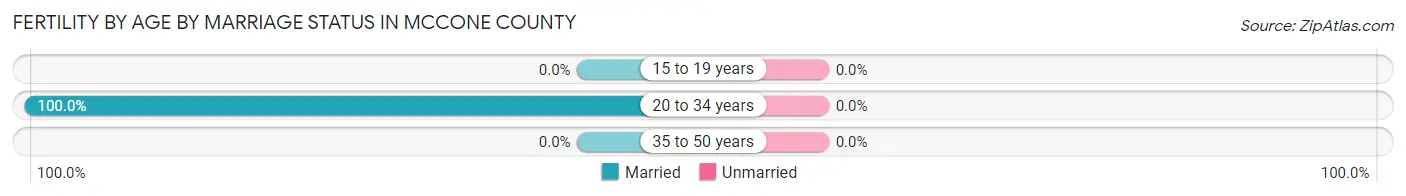
| Age Bracket | Married | Unmarried |
| 15 to 19 years | 0 (0.0%) | 0 (0.0%) |
| 20 to 34 years | 33 (100.0%) | 0 (0.0%) |
| 35 to 50 years | 0 (0.0%) | 0 (0.0%) |
| Total | 33 (100.0%) | 0 (0.0%) |
Fertility by Education in McCone County
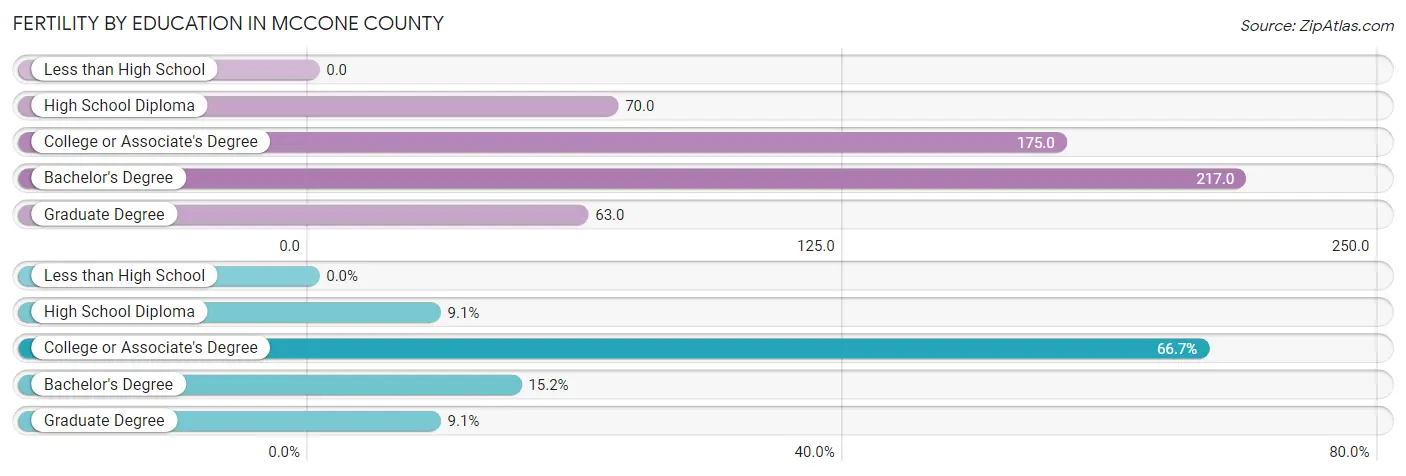
| Educational Attainment | Women with Births | Births / 1,000 Women |
| Less than High School | 0 (0.0%) | 0.0 |
| High School Diploma | 3 (9.1%) | 70.0 |
| College or Associate's Degree | 22 (66.7%) | 175.0 |
| Bachelor's Degree | 5 (15.1%) | 217.0 |
| Graduate Degree | 3 (9.1%) | 63.0 |
| Total | 33 (100.0%) | 126.0 |
Fertility by Education by Marriage Status in McCone County
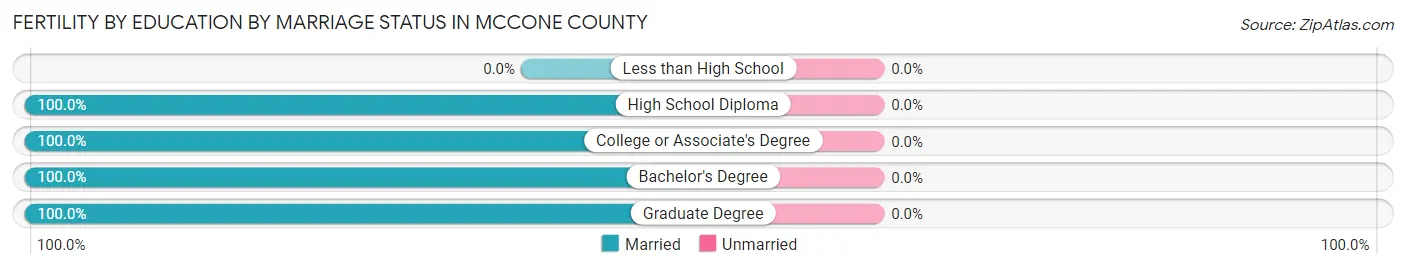
| Educational Attainment | Married | Unmarried |
| Less than High School | 0 (0.0%) | 0 (0.0%) |
| High School Diploma | 3 (100.0%) | 0 (0.0%) |
| College or Associate's Degree | 22 (100.0%) | 0 (0.0%) |
| Bachelor's Degree | 5 (100.0%) | 0 (0.0%) |
| Graduate Degree | 3 (100.0%) | 0 (0.0%) |
| Total | 33 (100.0%) | 0 (0.0%) |
Income in McCone County
Income Overview in McCone County
Per Capita Income in McCone County is $39,284, while median incomes of families and households are $85,417 and $79,022 respectively.
| Characteristic | Number | Measure |
| Per Capita Income | 1,746 | $39,284 |
| Median Family Income | 486 | $85,417 |
| Mean Family Income | 486 | $98,808 |
| Median Household Income | 782 | $79,022 |
| Mean Household Income | 782 | $86,096 |
| Income Deficit | 486 | $9,500 |
| Wage / Income Gap (%) | 1,746 | 12.97% |
| Wage / Income Gap ($) | 1,746 | 87.03¢ per $1 |
| Gini / Inequality Index | 1,746 | 0.36 |
Earnings by Sex in McCone County
Average Earnings in McCone County are $42,708, $44,884 for men and $39,063 for women, a difference of 13.0%.
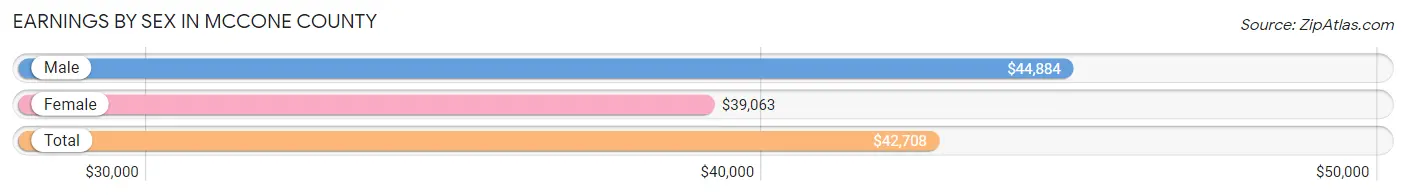
| Sex | Number | Average Earnings |
| Male | 590 (57.8%) | $44,884 |
| Female | 430 (42.2%) | $39,063 |
| Total | 1,020 (100.0%) | $42,708 |
Earnings by Sex by Income Bracket in McCone County
The most common earnings brackets in McCone County are $40,000 to $44,999 for men (95 | 16.1%) and $45,000 to $49,999 for women (55 | 12.8%).
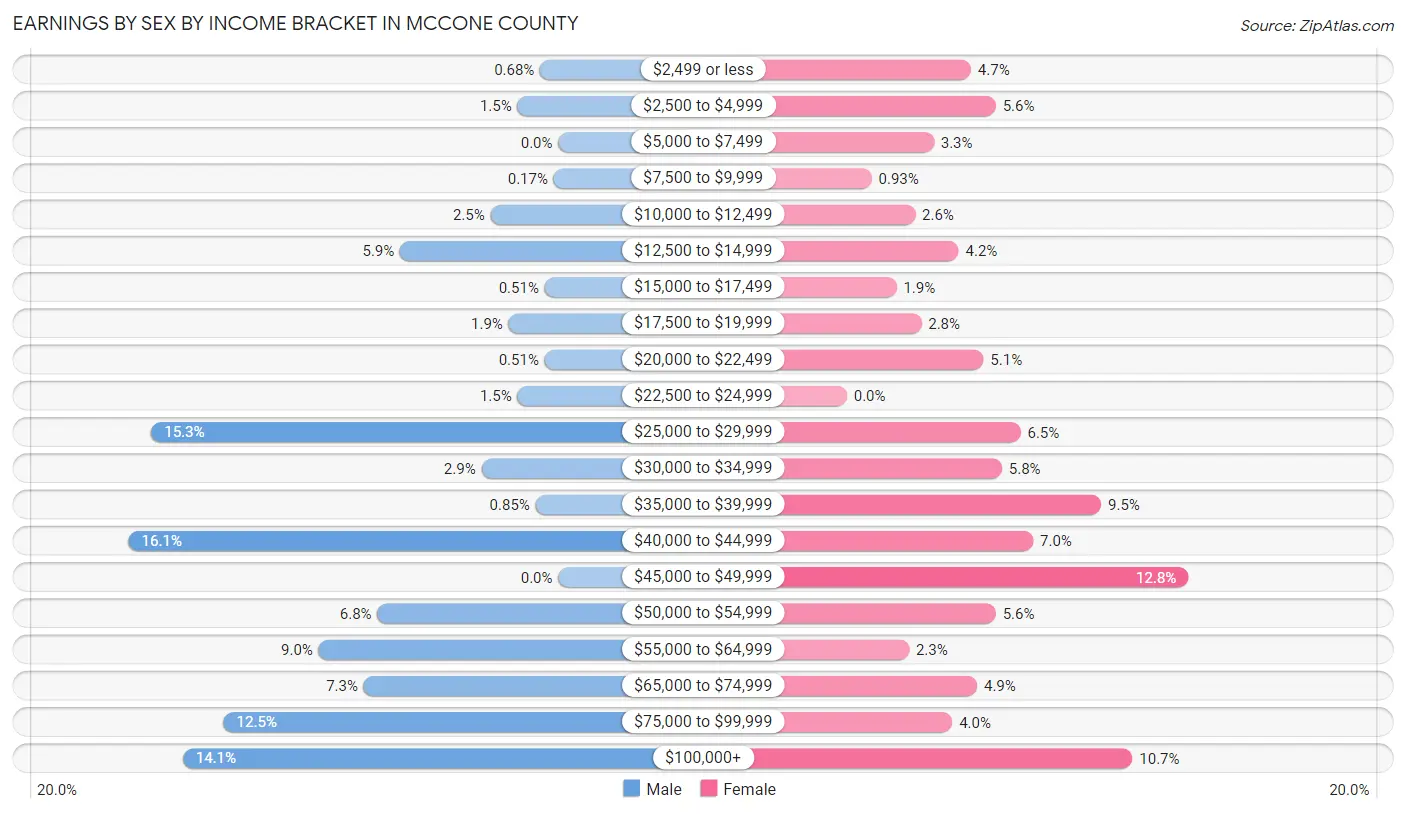
| Income | Male | Female |
| $2,499 or less | 4 (0.7%) | 20 (4.6%) |
| $2,500 to $4,999 | 9 (1.5%) | 24 (5.6%) |
| $5,000 to $7,499 | 0 (0.0%) | 14 (3.3%) |
| $7,500 to $9,999 | 1 (0.2%) | 4 (0.9%) |
| $10,000 to $12,499 | 15 (2.5%) | 11 (2.6%) |
| $12,500 to $14,999 | 35 (5.9%) | 18 (4.2%) |
| $15,000 to $17,499 | 3 (0.5%) | 8 (1.9%) |
| $17,500 to $19,999 | 11 (1.9%) | 12 (2.8%) |
| $20,000 to $22,499 | 3 (0.5%) | 22 (5.1%) |
| $22,500 to $24,999 | 9 (1.5%) | 0 (0.0%) |
| $25,000 to $29,999 | 90 (15.2%) | 28 (6.5%) |
| $30,000 to $34,999 | 17 (2.9%) | 25 (5.8%) |
| $35,000 to $39,999 | 5 (0.9%) | 41 (9.5%) |
| $40,000 to $44,999 | 95 (16.1%) | 30 (7.0%) |
| $45,000 to $49,999 | 0 (0.0%) | 55 (12.8%) |
| $50,000 to $54,999 | 40 (6.8%) | 24 (5.6%) |
| $55,000 to $64,999 | 53 (9.0%) | 10 (2.3%) |
| $65,000 to $74,999 | 43 (7.3%) | 21 (4.9%) |
| $75,000 to $99,999 | 74 (12.5%) | 17 (4.0%) |
| $100,000+ | 83 (14.1%) | 46 (10.7%) |
| Total | 590 (100.0%) | 430 (100.0%) |
Earnings by Sex by Educational Attainment in McCone County
Average earnings in McCone County are $52,973 for men and $40,764 for women, a difference of 23.1%. Men with an educational attainment of high school diploma enjoy the highest average annual earnings of $57,955, while those with less than high school education earn the least with $28,750. Women with an educational attainment of bachelor's degree earn the most with the average annual earnings of $63,125, while those with less than high school education have the smallest earnings of $2,499.
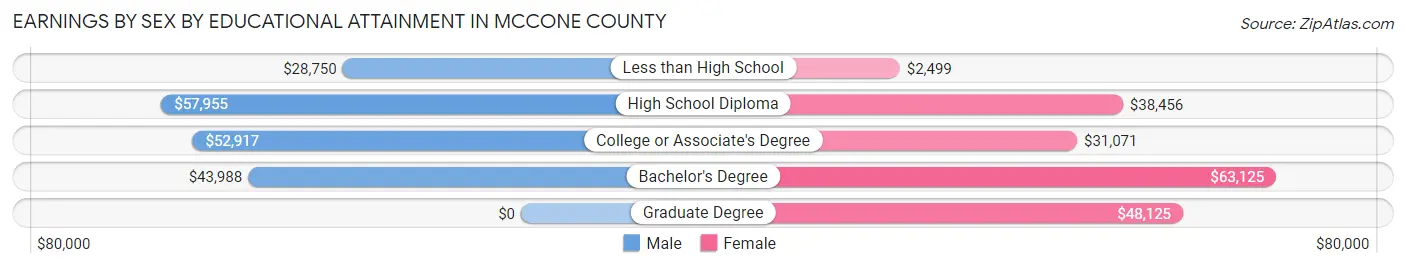
| Educational Attainment | Male Income | Female Income |
| Less than High School | $28,750 | $2,499 |
| High School Diploma | $57,955 | $38,456 |
| College or Associate's Degree | $52,917 | $31,071 |
| Bachelor's Degree | $43,988 | $63,125 |
| Graduate Degree | - | - |
| Total | $52,973 | $40,764 |
Family Income in McCone County
Family Income Brackets in McCone County
According to the McCone County family income data, there are 157 families falling into the $100,000 to $149,999 income range, which is the most common income bracket and makes up 32.3% of all families. Conversely, the $10,000 to $14,999 income bracket is the least frequent group with only 1 families (0.2%) belonging to this category.
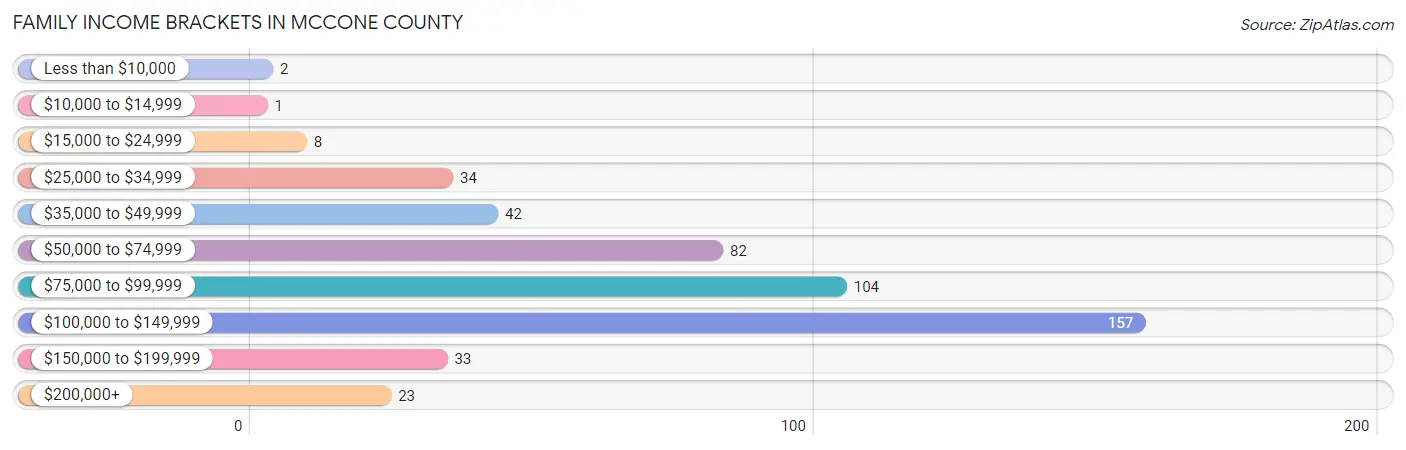
| Income Bracket | # Families | % Families |
| Less than $10,000 | 2 | 0.4% |
| $10,000 to $14,999 | 1 | 0.2% |
| $15,000 to $24,999 | 8 | 1.6% |
| $25,000 to $34,999 | 34 | 7.0% |
| $35,000 to $49,999 | 42 | 8.6% |
| $50,000 to $74,999 | 82 | 16.9% |
| $75,000 to $99,999 | 104 | 21.4% |
| $100,000 to $149,999 | 157 | 32.3% |
| $150,000 to $199,999 | 33 | 6.8% |
| $200,000+ | 23 | 4.7% |
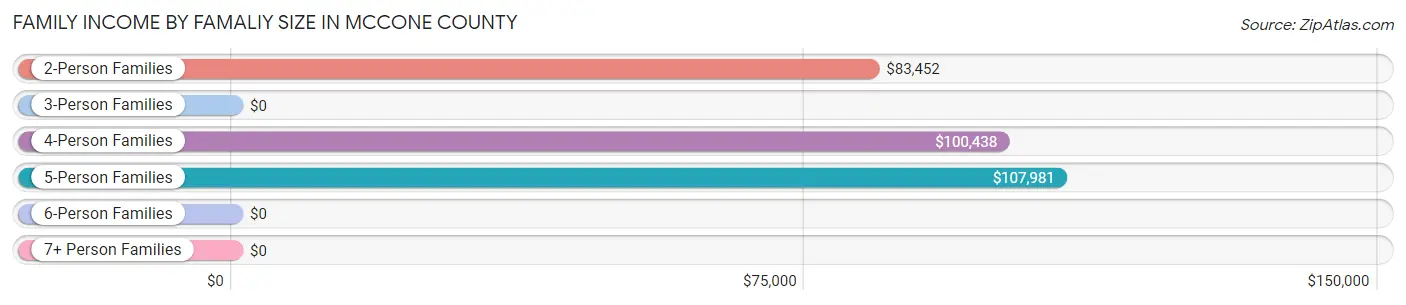
Family Income by Famaliy Size in McCone County
5-person families (37 | 7.6%) account for the highest median family income in McCone County with $107,981 per family, while 2-person families (348 | 71.6%) have the highest median income of $41,726 per family member.
| Income Bracket | # Families | Median Income |
| 2-Person Families | 348 (71.6%) | $83,452 |
| 3-Person Families | 41 (8.4%) | $0 |
| 4-Person Families | 47 (9.7%) | $100,438 |
| 5-Person Families | 37 (7.6%) | $107,981 |
| 6-Person Families | 5 (1.0%) | $0 |
| 7+ Person Families | 8 (1.7%) | $0 |
| Total | 486 (100.0%) | $85,417 |
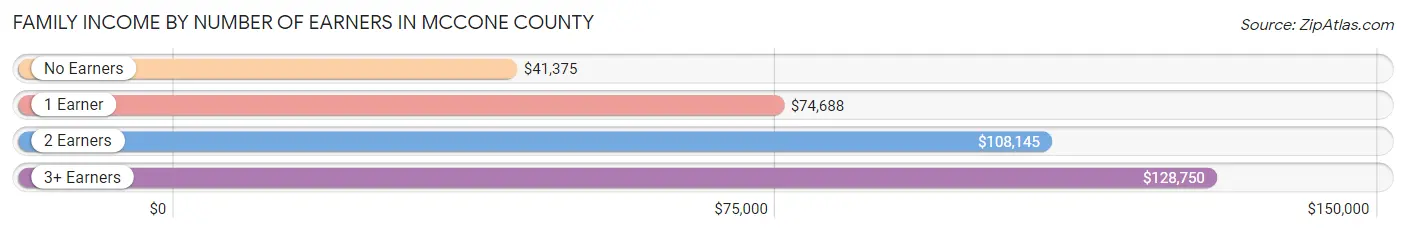
Family Income by Number of Earners in McCone County
The median family income in McCone County is $85,417, with families comprising 3+ earners (22) having the highest median family income of $128,750, while families with no earners (63) have the lowest median family income of $41,375, accounting for 4.5% and 13.0% of families, respectively.
| Number of Earners | # Families | Median Income |
| No Earners | 63 (13.0%) | $41,375 |
| 1 Earner | 129 (26.5%) | $74,688 |
| 2 Earners | 272 (56.0%) | $108,145 |
| 3+ Earners | 22 (4.5%) | $128,750 |
| Total | 486 (100.0%) | $85,417 |
Household Income in McCone County
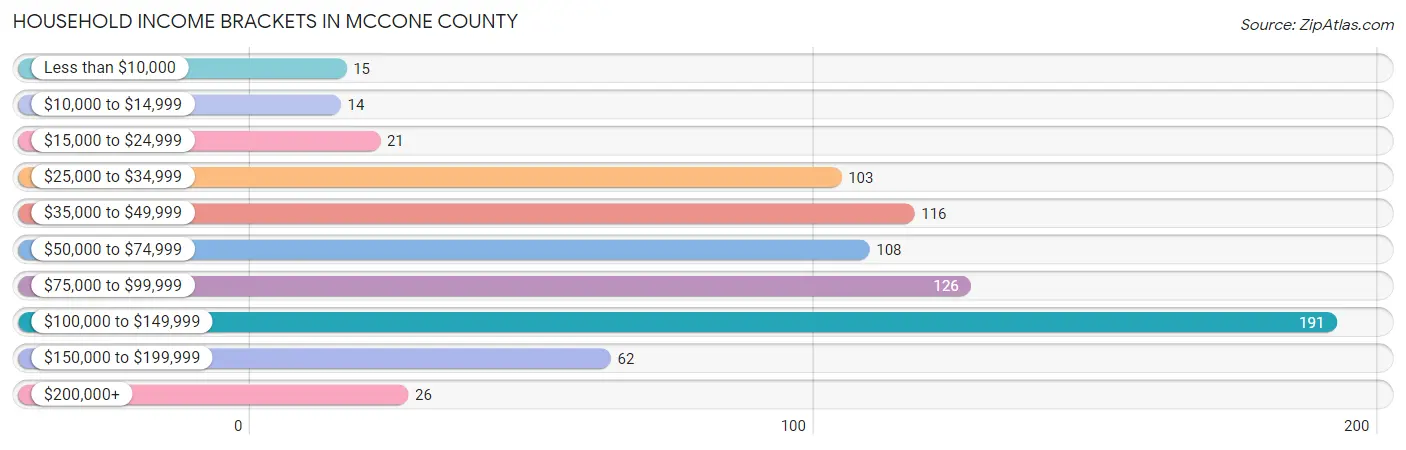
Household Income Brackets in McCone County
With 191 households falling in the category, the $100,000 to $149,999 income range is the most frequent in McCone County, accounting for 24.4% of all households. In contrast, only 14 households (1.8%) fall into the $10,000 to $14,999 income bracket, making it the least populous group.
| Income Bracket | # Households | % Households |
| Less than $10,000 | 15 | 1.9% |
| $10,000 to $14,999 | 14 | 1.8% |
| $15,000 to $24,999 | 21 | 2.7% |
| $25,000 to $34,999 | 103 | 13.2% |
| $35,000 to $49,999 | 116 | 14.8% |
| $50,000 to $74,999 | 108 | 13.8% |
| $75,000 to $99,999 | 126 | 16.1% |
| $100,000 to $149,999 | 191 | 24.4% |
| $150,000 to $199,999 | 62 | 7.9% |
| $200,000+ | 26 | 3.3% |
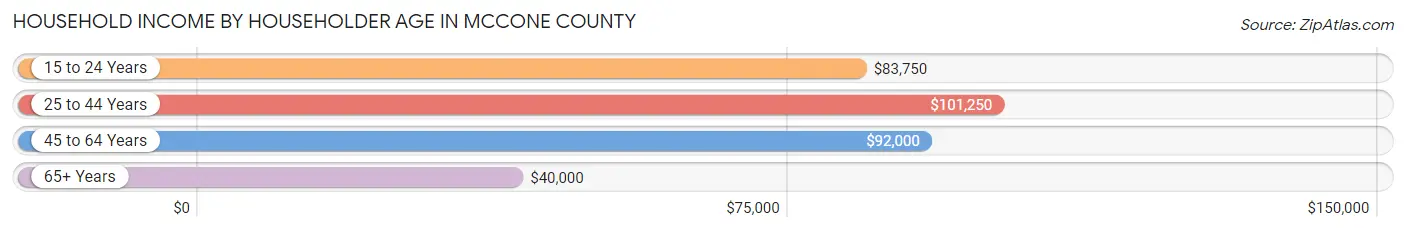
Household Income by Householder Age in McCone County
The median household income in McCone County is $79,022, with the highest median household income of $101,250 found in the 25 to 44 years age bracket for the primary householder. A total of 148 households (18.9%) fall into this category. Meanwhile, the 65+ years age bracket for the primary householder has the lowest median household income of $40,000, with 324 households (41.4%) in this group.
| Income Bracket | # Households | Median Income |
| 15 to 24 Years | 48 (6.1%) | $83,750 |
| 25 to 44 Years | 148 (18.9%) | $101,250 |
| 45 to 64 Years | 262 (33.5%) | $92,000 |
| 65+ Years | 324 (41.4%) | $40,000 |
| Total | 782 (100.0%) | $79,022 |
Poverty in McCone County
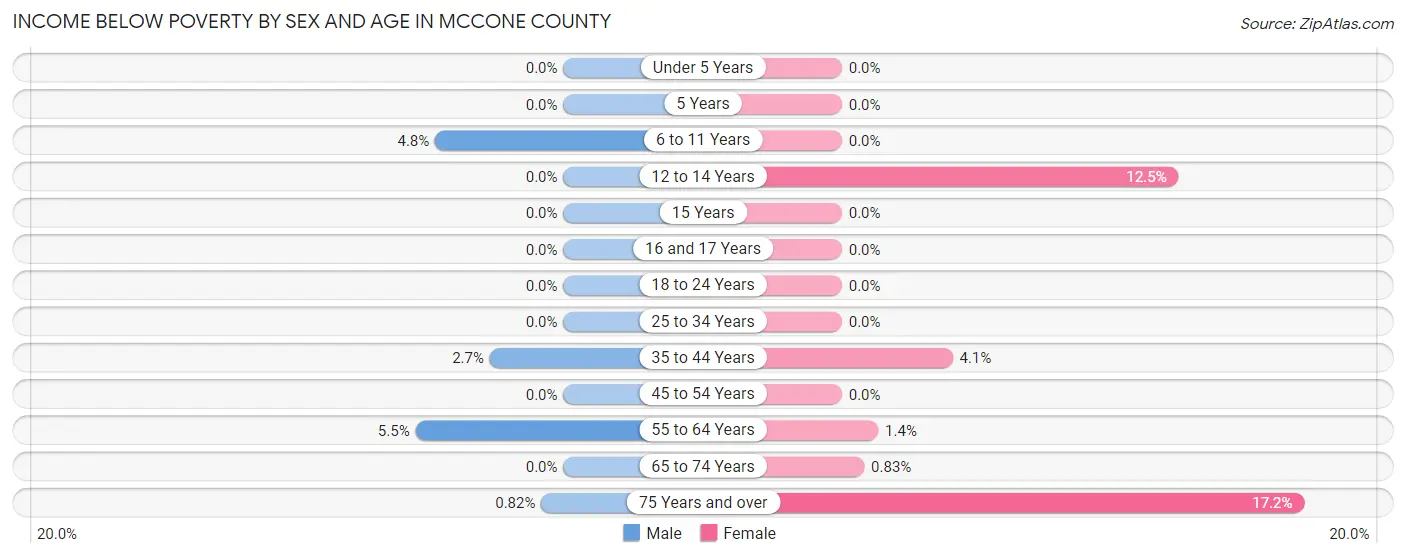
Income Below Poverty by Sex and Age in McCone County
With 1.9% poverty level for males and 3.0% for females among the residents of McCone County, 55 to 64 year old males and 75 year old and over females are the most vulnerable to poverty, with 10 males (5.5%) and 17 females (17.2%) in their respective age groups living below the poverty level.
| Age Bracket | Male | Female |
| Under 5 Years | 0 (0.0%) | 0 (0.0%) |
| 5 Years | 0 (0.0%) | 0 (0.0%) |
| 6 to 11 Years | 3 (4.8%) | 0 (0.0%) |
| 12 to 14 Years | 0 (0.0%) | 2 (12.5%) |
| 15 Years | 0 (0.0%) | 0 (0.0%) |
| 16 and 17 Years | 0 (0.0%) | 0 (0.0%) |
| 18 to 24 Years | 0 (0.0%) | 0 (0.0%) |
| 25 to 34 Years | 0 (0.0%) | 0 (0.0%) |
| 35 to 44 Years | 3 (2.7%) | 3 (4.1%) |
| 45 to 54 Years | 0 (0.0%) | 0 (0.0%) |
| 55 to 64 Years | 10 (5.5%) | 2 (1.3%) |
| 65 to 74 Years | 0 (0.0%) | 1 (0.8%) |
| 75 Years and over | 1 (0.8%) | 17 (17.2%) |
| Total | 17 (1.9%) | 25 (3.0%) |
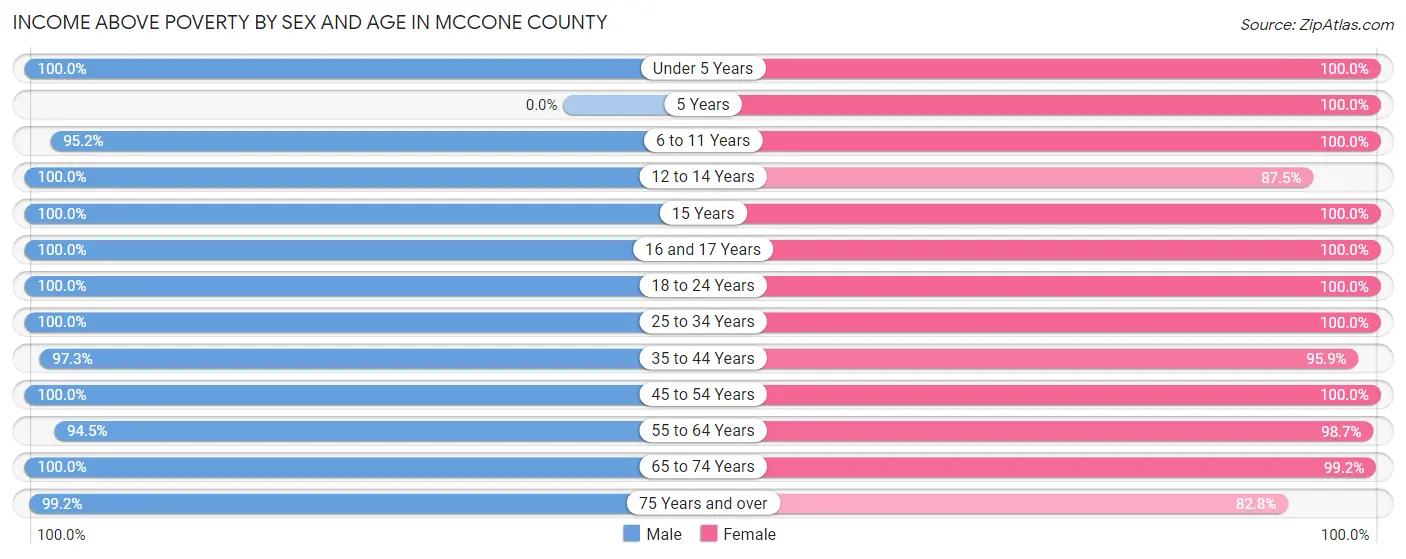
Income Above Poverty by Sex and Age in McCone County
According to the poverty statistics in McCone County, males aged under 5 years and females aged under 5 years are the age groups that are most secure financially, with 100.0% of males and 100.0% of females in these age groups living above the poverty line.
| Age Bracket | Male | Female |
| Under 5 Years | 39 (100.0%) | 48 (100.0%) |
| 5 Years | 0 (0.0%) | 52 (100.0%) |
| 6 to 11 Years | 60 (95.2%) | 24 (100.0%) |
| 12 to 14 Years | 9 (100.0%) | 14 (87.5%) |
| 15 Years | 8 (100.0%) | 5 (100.0%) |
| 16 and 17 Years | 14 (100.0%) | 14 (100.0%) |
| 18 to 24 Years | 52 (100.0%) | 59 (100.0%) |
| 25 to 34 Years | 76 (100.0%) | 74 (100.0%) |
| 35 to 44 Years | 107 (97.3%) | 70 (95.9%) |
| 45 to 54 Years | 75 (100.0%) | 87 (100.0%) |
| 55 to 64 Years | 172 (94.5%) | 146 (98.7%) |
| 65 to 74 Years | 154 (100.0%) | 119 (99.2%) |
| 75 Years and over | 121 (99.2%) | 82 (82.8%) |
| Total | 887 (98.1%) | 794 (97.0%) |
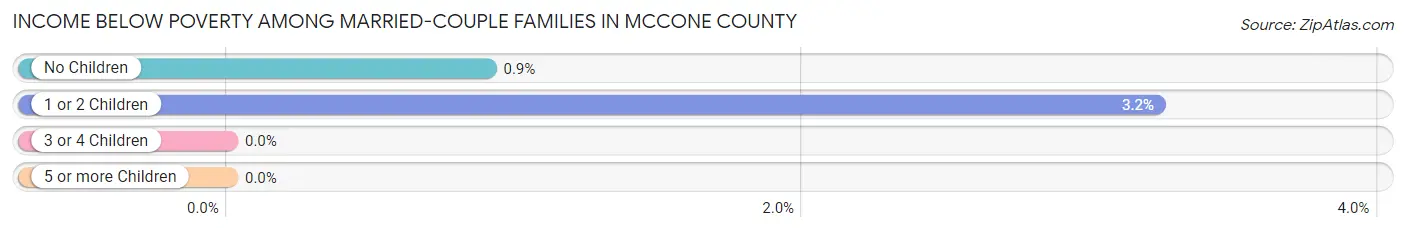
Income Below Poverty Among Married-Couple Families in McCone County
The poverty statistics for married-couple families in McCone County show that 1.3% or 6 of the total 456 families live below the poverty line. Families with 1 or 2 children have the highest poverty rate of 3.2%, comprising of 3 families. On the other hand, families with 3 or 4 children have the lowest poverty rate of 0.0%, which includes 0 families.
| Children | Above Poverty | Below Poverty |
| No Children | 330 (99.1%) | 3 (0.9%) |
| 1 or 2 Children | 90 (96.8%) | 3 (3.2%) |
| 3 or 4 Children | 24 (100.0%) | 0 (0.0%) |
| 5 or more Children | 6 (100.0%) | 0 (0.0%) |
| Total | 450 (98.7%) | 6 (1.3%) |
Income Below Poverty Among Single-Parent Households in McCone County
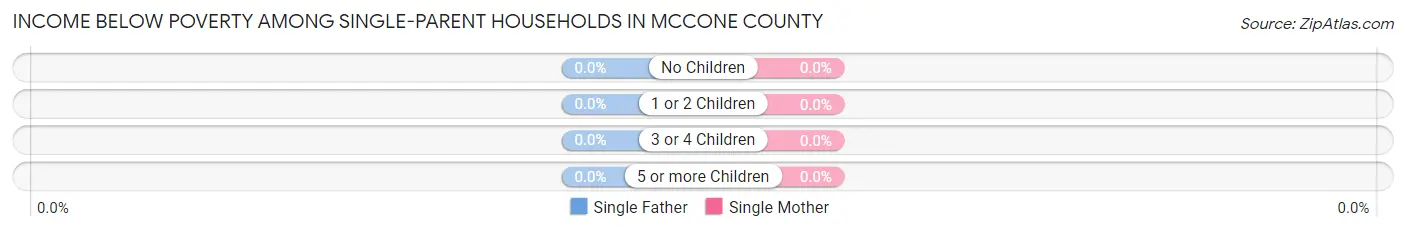
| Children | Single Father | Single Mother |
| No Children | 0 (0.0%) | 0 (0.0%) |
| 1 or 2 Children | 0 (0.0%) | 0 (0.0%) |
| 3 or 4 Children | 0 (0.0%) | 0 (0.0%) |
| 5 or more Children | 0 (0.0%) | 0 (0.0%) |
| Total | 0 (0.0%) | 0 (0.0%) |
Income Below Poverty Among Married-Couple vs Single-Parent Households in McCone County
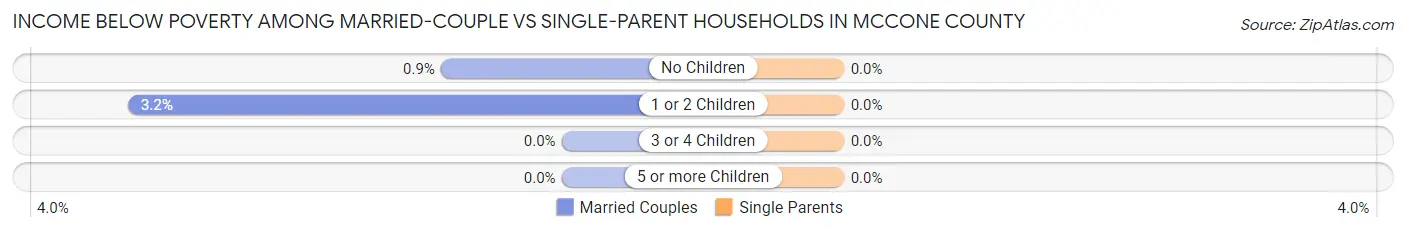
| Children | Married-Couple Families | Single-Parent Households |
| No Children | 3 (0.9%) | 0 (0.0%) |
| 1 or 2 Children | 3 (3.2%) | 0 (0.0%) |
| 3 or 4 Children | 0 (0.0%) | 0 (0.0%) |
| 5 or more Children | 0 (0.0%) | 0 (0.0%) |
| Total | 6 (1.3%) | 0 (0.0%) |
Employment Characteristics in McCone County
Employment by Class of Employer in McCone County
Among the 904 employed individuals in McCone County, private company employees (359 | 39.7%), self-employed (not incorporated) (236 | 26.1%), and local government employees (115 | 12.7%) make up the most common classes of employment.
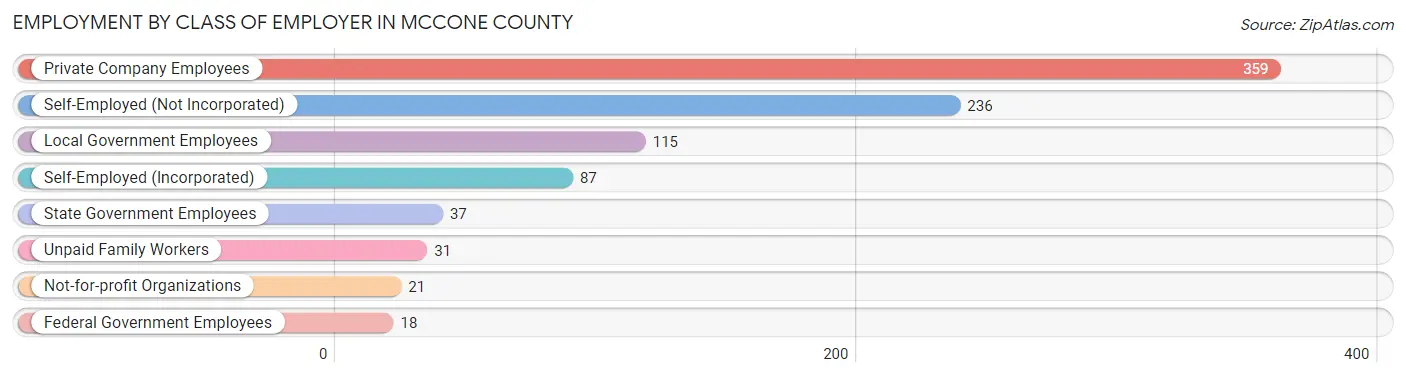
| Employer Class | # Employees | % Employees |
| Private Company Employees | 359 | 39.7% |
| Self-Employed (Incorporated) | 87 | 9.6% |
| Self-Employed (Not Incorporated) | 236 | 26.1% |
| Not-for-profit Organizations | 21 | 2.3% |
| Local Government Employees | 115 | 12.7% |
| State Government Employees | 37 | 4.1% |
| Federal Government Employees | 18 | 2.0% |
| Unpaid Family Workers | 31 | 3.4% |
| Total | 904 | 100.0% |
Employment Status by Age in McCone County
According to the labor force statistics for McCone County, out of the total population over 16 years of age (1,479), 63.4% or 938 individuals are in the labor force, with 2.5% or 23 of them unemployed. The age group with the highest labor force participation rate is 55 to 59 years, with 91.2% or 134 individuals in the labor force. Within the labor force, the 55 to 59 years age range has the highest percentage of unemployed individuals, with 6.7% or 9 of them being unemployed.
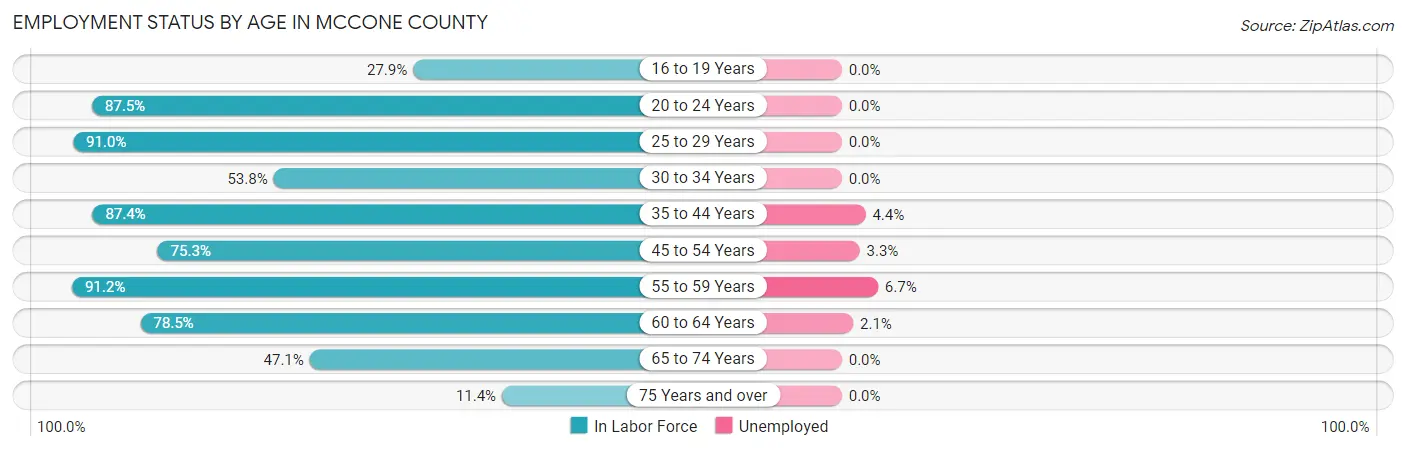
| Age Bracket | In Labor Force | Unemployed |
| 16 to 19 Years | 12 (27.9%) | 0 (0.0%) |
| 20 to 24 Years | 84 (87.5%) | 0 (0.0%) |
| 25 to 29 Years | 101 (91.0%) | 0 (0.0%) |
| 30 to 34 Years | 21 (53.8%) | 0 (0.0%) |
| 35 to 44 Years | 160 (87.4%) | 7 (4.4%) |
| 45 to 54 Years | 122 (75.3%) | 4 (3.3%) |
| 55 to 59 Years | 134 (91.2%) | 9 (6.7%) |
| 60 to 64 Years | 146 (78.5%) | 3 (2.1%) |
| 65 to 74 Years | 130 (47.1%) | 0 (0.0%) |
| 75 Years and over | 27 (11.4%) | 0 (0.0%) |
| Total | 938 (63.4%) | 23 (2.5%) |
Employment Status by Educational Attainment in McCone County
According to labor force statistics for McCone County, 82.6% of individuals (684) out of the total population between 25 and 64 years of age (828) are in the labor force, with 3.4% or 23 of them being unemployed. The group with the highest labor force participation rate are those with the educational attainment of bachelor's degree or higher, with 89.7% or 201 individuals in the labor force. Within the labor force, individuals with high school diploma education have the highest percentage of unemployment, with 9.3% or 19 of them being unemployed.
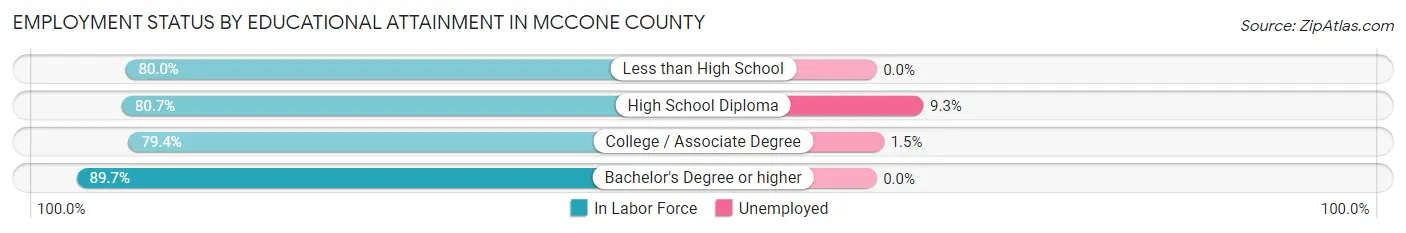
| Educational Attainment | In Labor Force | Unemployed |
| Less than High School | 16 (80.0%) | 0 (0.0%) |
| High School Diploma | 205 (80.7%) | 24 (9.3%) |
| College / Associate Degree | 262 (79.4%) | 5 (1.5%) |
| Bachelor's Degree or higher | 201 (89.7%) | 0 (0.0%) |
| Total | 684 (82.6%) | 28 (3.4%) |
Employment Occupations by Sex in McCone County
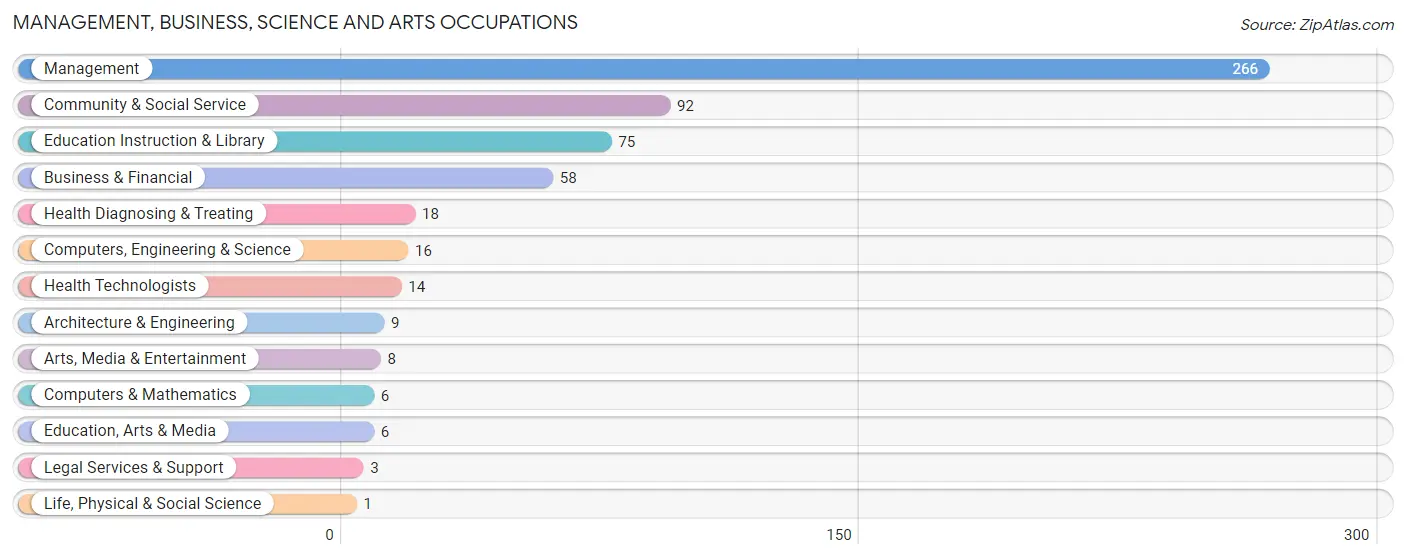
Management, Business, Science and Arts Occupations
The most common Management, Business, Science and Arts occupations in McCone County are Management (266 | 29.1%), Community & Social Service (92 | 10.1%), Education Instruction & Library (75 | 8.2%), Business & Financial (58 | 6.4%), and Health Diagnosing & Treating (18 | 2.0%).
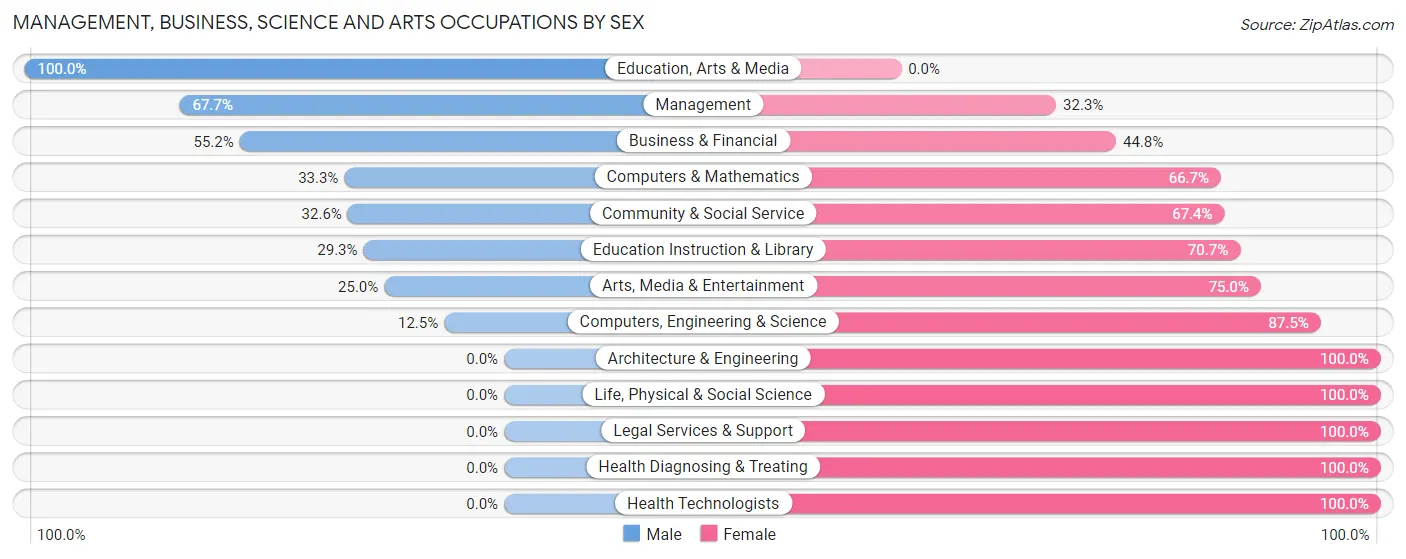
Management, Business, Science and Arts Occupations by Sex
Within the Management, Business, Science and Arts occupations in McCone County, the most male-oriented occupations are Education, Arts & Media (100.0%), Management (67.7%), and Business & Financial (55.2%), while the most female-oriented occupations are Architecture & Engineering (100.0%), Life, Physical & Social Science (100.0%), and Legal Services & Support (100.0%).
| Occupation | Male | Female |
| Management | 180 (67.7%) | 86 (32.3%) |
| Business & Financial | 32 (55.2%) | 26 (44.8%) |
| Computers, Engineering & Science | 2 (12.5%) | 14 (87.5%) |
| Computers & Mathematics | 2 (33.3%) | 4 (66.7%) |
| Architecture & Engineering | 0 (0.0%) | 9 (100.0%) |
| Life, Physical & Social Science | 0 (0.0%) | 1 (100.0%) |
| Community & Social Service | 30 (32.6%) | 62 (67.4%) |
| Education, Arts & Media | 6 (100.0%) | 0 (0.0%) |
| Legal Services & Support | 0 (0.0%) | 3 (100.0%) |
| Education Instruction & Library | 22 (29.3%) | 53 (70.7%) |
| Arts, Media & Entertainment | 2 (25.0%) | 6 (75.0%) |
| Health Diagnosing & Treating | 0 (0.0%) | 18 (100.0%) |
| Health Technologists | 0 (0.0%) | 14 (100.0%) |
| Total (Category) | 244 (54.2%) | 206 (45.8%) |
| Total (Overall) | 524 (57.3%) | 390 (42.7%) |
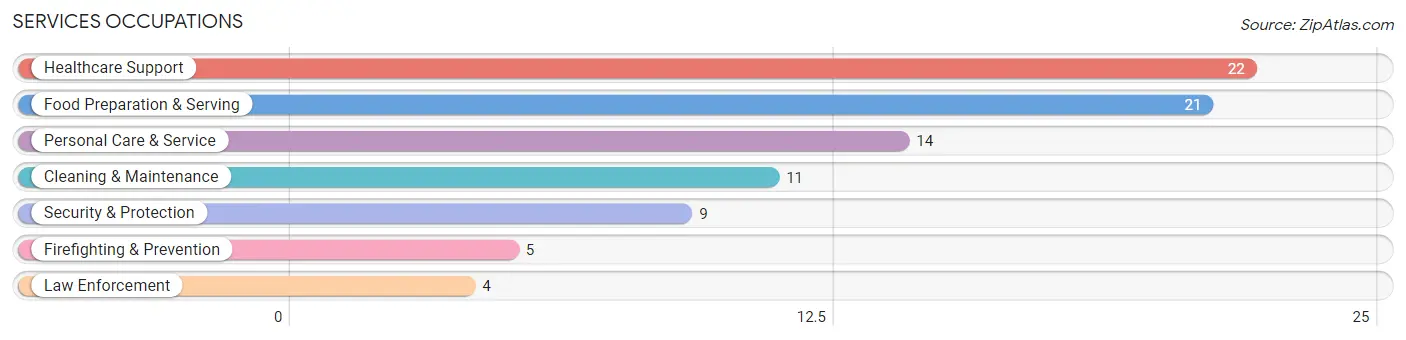
Services Occupations
The most common Services occupations in McCone County are Healthcare Support (22 | 2.4%), Food Preparation & Serving (21 | 2.3%), Personal Care & Service (14 | 1.5%), Cleaning & Maintenance (11 | 1.2%), and Security & Protection (9 | 1.0%).
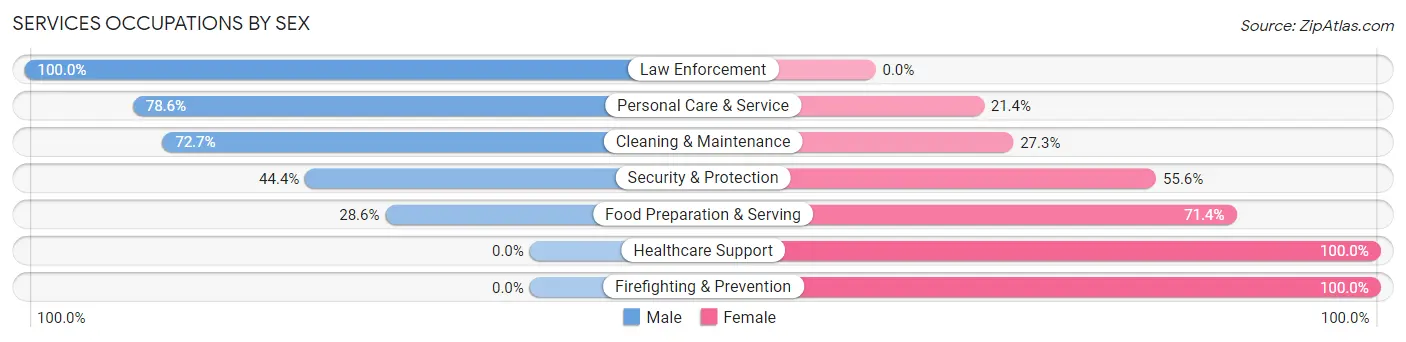
Services Occupations by Sex
Within the Services occupations in McCone County, the most male-oriented occupations are Law Enforcement (100.0%), Personal Care & Service (78.6%), and Cleaning & Maintenance (72.7%), while the most female-oriented occupations are Healthcare Support (100.0%), Firefighting & Prevention (100.0%), and Food Preparation & Serving (71.4%).
| Occupation | Male | Female |
| Healthcare Support | 0 (0.0%) | 22 (100.0%) |
| Security & Protection | 4 (44.4%) | 5 (55.6%) |
| Firefighting & Prevention | 0 (0.0%) | 5 (100.0%) |
| Law Enforcement | 4 (100.0%) | 0 (0.0%) |
| Food Preparation & Serving | 6 (28.6%) | 15 (71.4%) |
| Cleaning & Maintenance | 8 (72.7%) | 3 (27.3%) |
| Personal Care & Service | 11 (78.6%) | 3 (21.4%) |
| Total (Category) | 29 (37.7%) | 48 (62.3%) |
| Total (Overall) | 524 (57.3%) | 390 (42.7%) |
Sales and Office Occupations
The most common Sales and Office occupations in McCone County are Office & Administration (68 | 7.4%), and Sales & Related (45 | 4.9%).
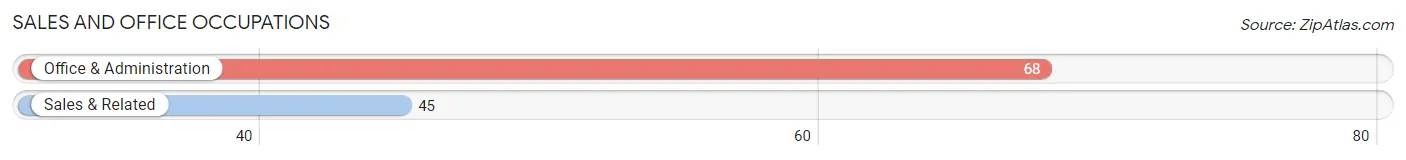
Sales and Office Occupations by Sex
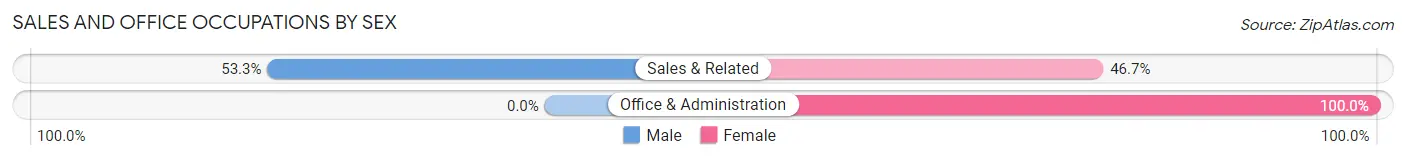
| Occupation | Male | Female |
| Sales & Related | 24 (53.3%) | 21 (46.7%) |
| Office & Administration | 0 (0.0%) | 68 (100.0%) |
| Total (Category) | 24 (21.2%) | 89 (78.8%) |
| Total (Overall) | 524 (57.3%) | 390 (42.7%) |
Natural Resources, Construction and Maintenance Occupations
The most common Natural Resources, Construction and Maintenance occupations in McCone County are Farming, Fishing & Forestry (89 | 9.7%), Construction & Extraction (42 | 4.6%), and Installation, Maintenance & Repair (31 | 3.4%).
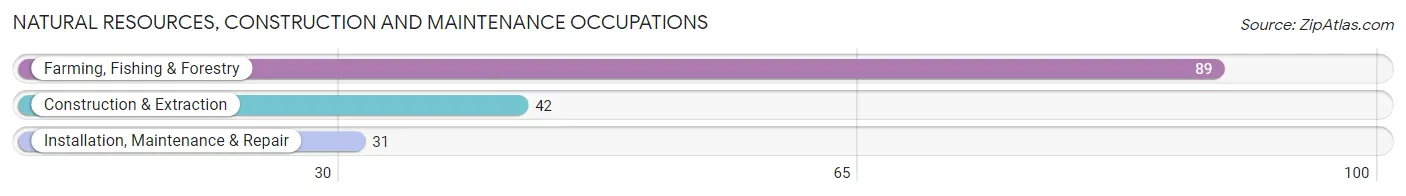
Natural Resources, Construction and Maintenance Occupations by Sex
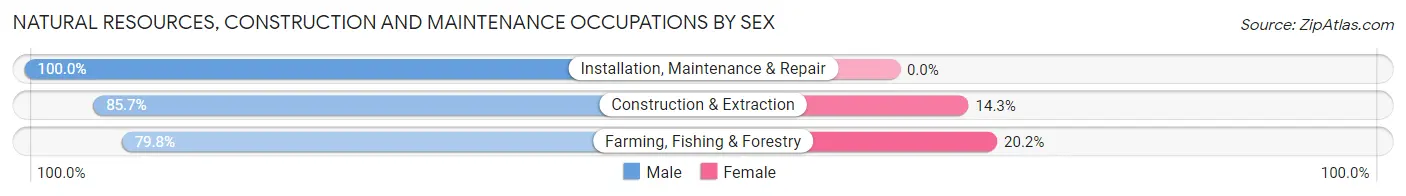
| Occupation | Male | Female |
| Farming, Fishing & Forestry | 71 (79.8%) | 18 (20.2%) |
| Construction & Extraction | 36 (85.7%) | 6 (14.3%) |
| Installation, Maintenance & Repair | 31 (100.0%) | 0 (0.0%) |
| Total (Category) | 138 (85.2%) | 24 (14.8%) |
| Total (Overall) | 524 (57.3%) | 390 (42.7%) |
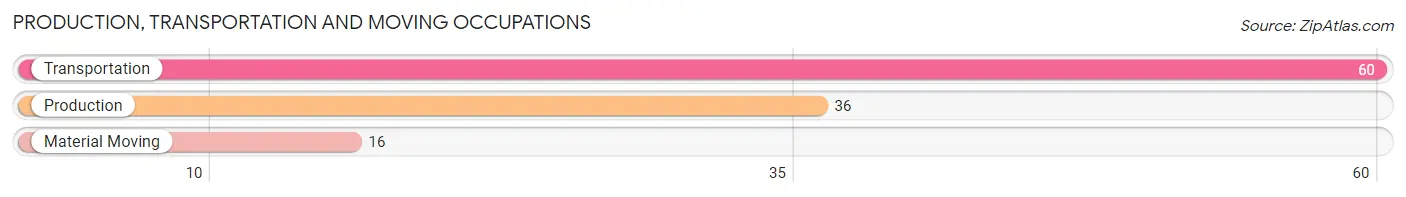
Production, Transportation and Moving Occupations
The most common Production, Transportation and Moving occupations in McCone County are Transportation (60 | 6.6%), Production (36 | 3.9%), and Material Moving (16 | 1.8%).
Production, Transportation and Moving Occupations by Sex
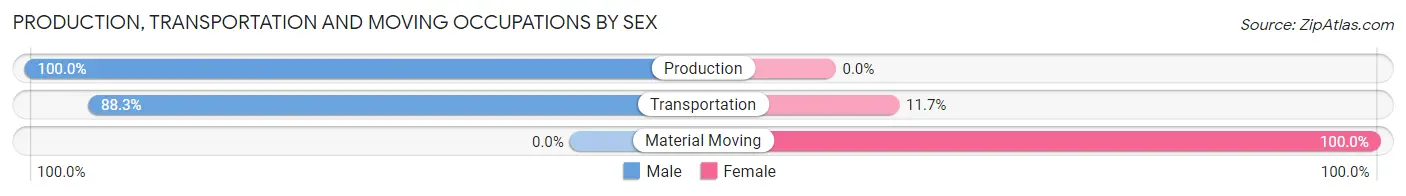
| Occupation | Male | Female |
| Production | 36 (100.0%) | 0 (0.0%) |
| Transportation | 53 (88.3%) | 7 (11.7%) |
| Material Moving | 0 (0.0%) | 16 (100.0%) |
| Total (Category) | 89 (79.5%) | 23 (20.5%) |
| Total (Overall) | 524 (57.3%) | 390 (42.7%) |
Employment Industries by Sex in McCone County
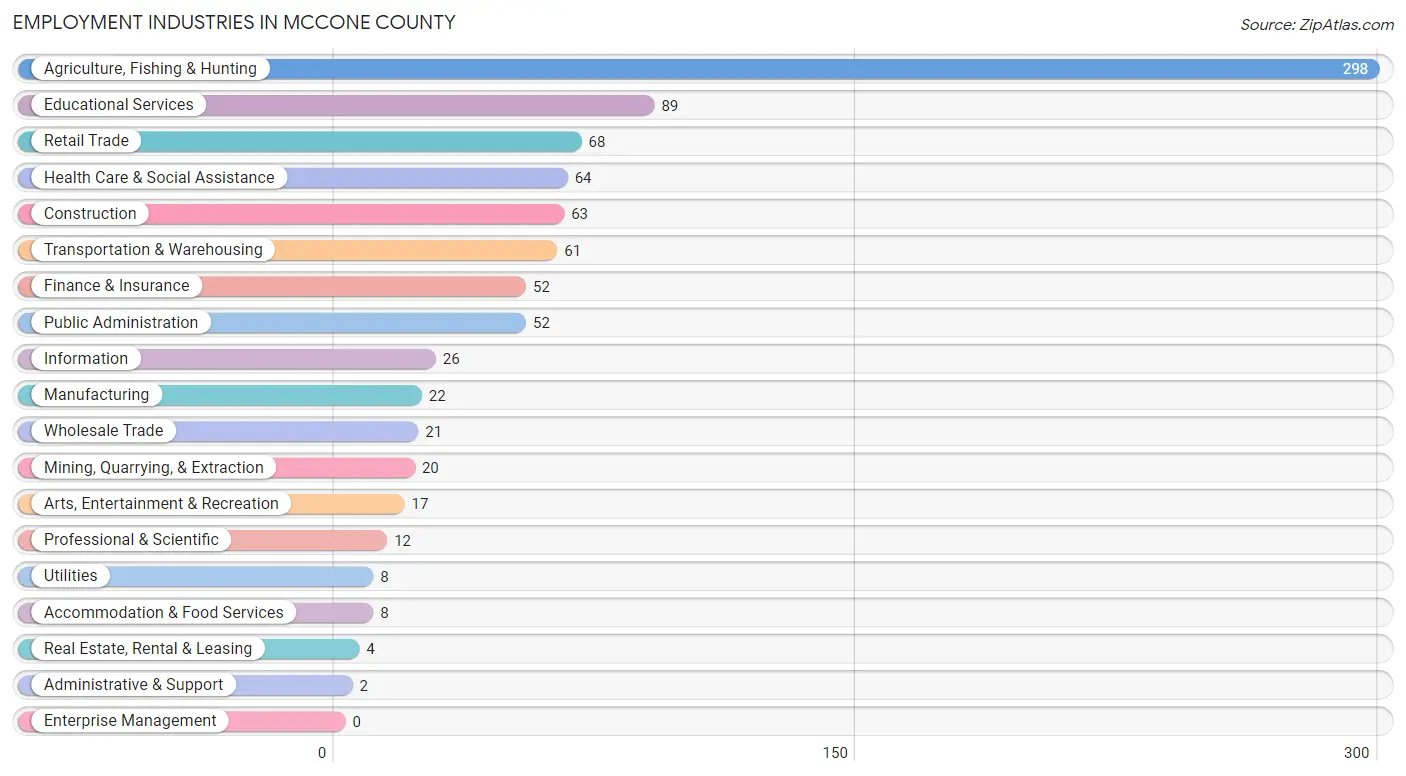
Employment Industries in McCone County
The major employment industries in McCone County include Agriculture, Fishing & Hunting (298 | 32.6%), Educational Services (89 | 9.7%), Retail Trade (68 | 7.4%), Health Care & Social Assistance (64 | 7.0%), and Construction (63 | 6.9%).
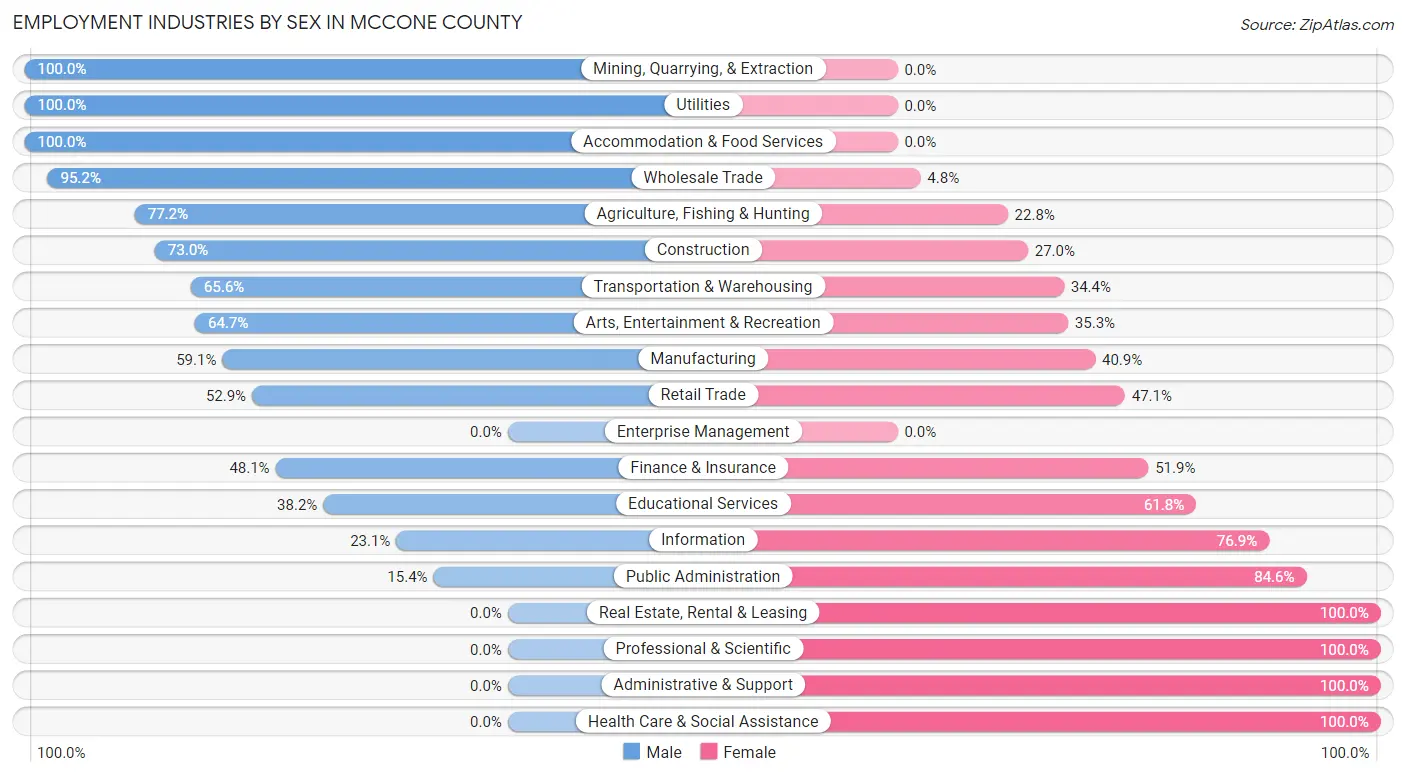
Employment Industries by Sex in McCone County
The McCone County industries that see more men than women are Mining, Quarrying, & Extraction (100.0%), Utilities (100.0%), and Accommodation & Food Services (100.0%), whereas the industries that tend to have a higher number of women are Real Estate, Rental & Leasing (100.0%), Professional & Scientific (100.0%), and Administrative & Support (100.0%).
| Industry | Male | Female |
| Agriculture, Fishing & Hunting | 230 (77.2%) | 68 (22.8%) |
| Mining, Quarrying, & Extraction | 20 (100.0%) | 0 (0.0%) |
| Construction | 46 (73.0%) | 17 (27.0%) |
| Manufacturing | 13 (59.1%) | 9 (40.9%) |
| Wholesale Trade | 20 (95.2%) | 1 (4.8%) |
| Retail Trade | 36 (52.9%) | 32 (47.1%) |
| Transportation & Warehousing | 40 (65.6%) | 21 (34.4%) |
| Utilities | 8 (100.0%) | 0 (0.0%) |
| Information | 6 (23.1%) | 20 (76.9%) |
| Finance & Insurance | 25 (48.1%) | 27 (51.9%) |
| Real Estate, Rental & Leasing | 0 (0.0%) | 4 (100.0%) |
| Professional & Scientific | 0 (0.0%) | 12 (100.0%) |
| Enterprise Management | 0 (0.0%) | 0 (0.0%) |
| Administrative & Support | 0 (0.0%) | 2 (100.0%) |
| Educational Services | 34 (38.2%) | 55 (61.8%) |
| Health Care & Social Assistance | 0 (0.0%) | 64 (100.0%) |
| Arts, Entertainment & Recreation | 11 (64.7%) | 6 (35.3%) |
| Accommodation & Food Services | 8 (100.0%) | 0 (0.0%) |
| Public Administration | 8 (15.4%) | 44 (84.6%) |
| Total | 524 (57.3%) | 390 (42.7%) |
Education in McCone County
School Enrollment in McCone County
The most common levels of schooling among the 257 students in McCone County are high school (56 | 21.8%), elementary school (53 | 20.6%), and nursery / preschool (52 | 20.2%).
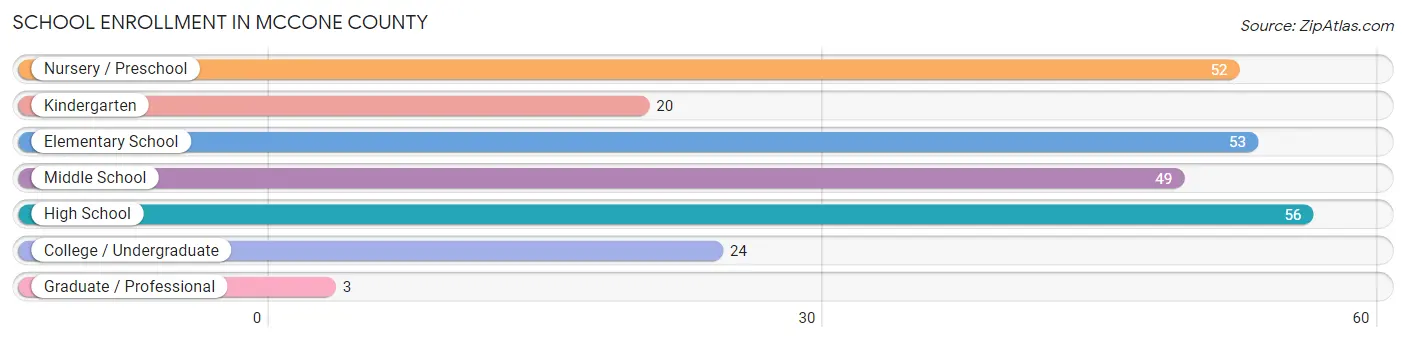
| School Level | # Students | % Students |
| Nursery / Preschool | 52 | 20.2% |
| Kindergarten | 20 | 7.8% |
| Elementary School | 53 | 20.6% |
| Middle School | 49 | 19.1% |
| High School | 56 | 21.8% |
| College / Undergraduate | 24 | 9.3% |
| Graduate / Professional | 3 | 1.2% |
| Total | 257 | 100.0% |
School Enrollment by Age by Funding Source in McCone County
Out of a total of 257 students who are enrolled in schools in McCone County, 27 (10.5%) attend a private institution, while the remaining 230 (89.5%) are enrolled in public schools. The age group of 35 years and over has the highest likelihood of being enrolled in private schools, with 5 (27.8% in the age bracket) enrolled. Conversely, the age group of 3 to 4 year olds has the lowest likelihood of being enrolled in a private school, with 7 (100.0% in the age bracket) attending a public institution.
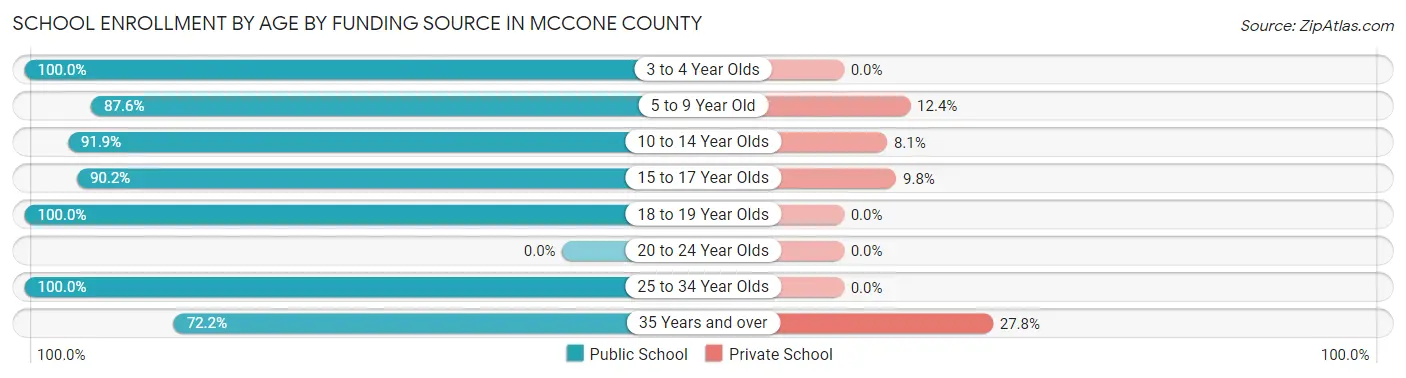
| Age Bracket | Public School | Private School |
| 3 to 4 Year Olds | 7 (100.0%) | 0 (0.0%) |
| 5 to 9 Year Old | 92 (87.6%) | 13 (12.4%) |
| 10 to 14 Year Olds | 57 (91.9%) | 5 (8.1%) |
| 15 to 17 Year Olds | 37 (90.2%) | 4 (9.8%) |
| 18 to 19 Year Olds | 15 (100.0%) | 0 (0.0%) |
| 20 to 24 Year Olds | 0 (0.0%) | 0 (0.0%) |
| 25 to 34 Year Olds | 9 (100.0%) | 0 (0.0%) |
| 35 Years and over | 13 (72.2%) | 5 (27.8%) |
| Total | 230 (89.5%) | 27 (10.5%) |
Educational Attainment by Field of Study in McCone County
Education (101 | 30.7%), business (82 | 24.9%), arts & humanities (36 | 10.9%), bio, nature & agricultural (34 | 10.3%), and engineering (21 | 6.4%) are the most common fields of study among 329 individuals in McCone County who have obtained a bachelor's degree or higher.
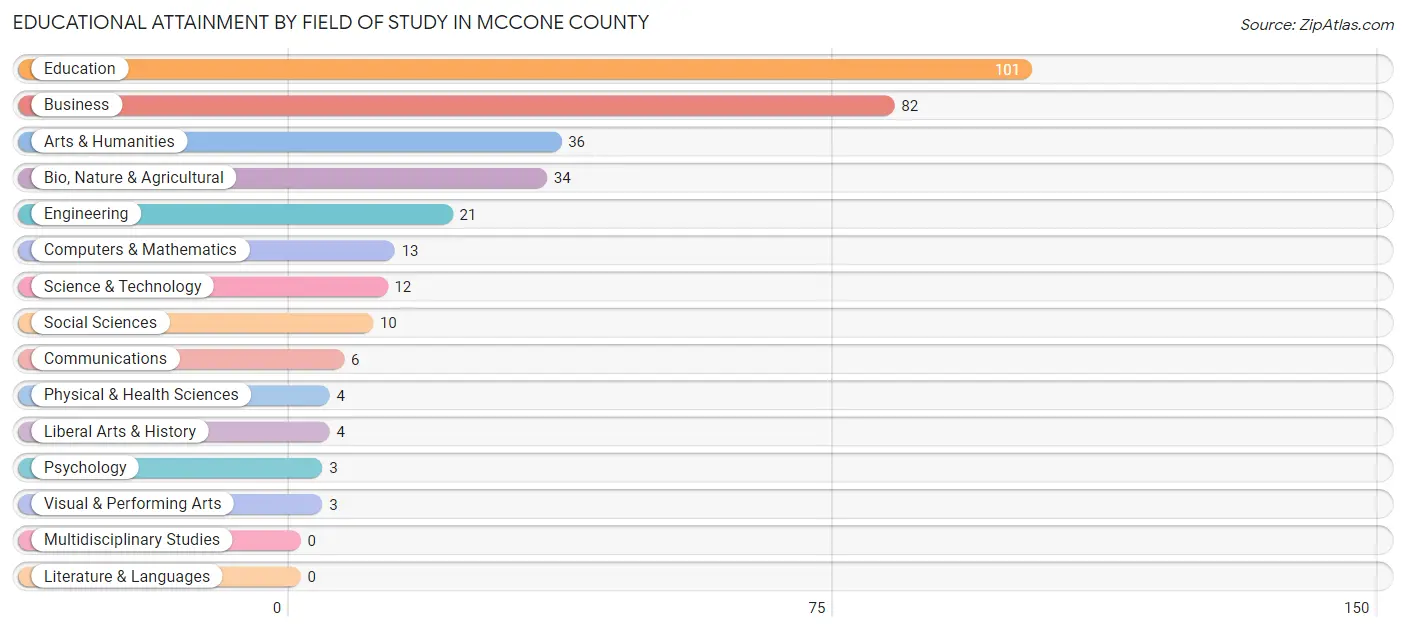
| Field of Study | # Graduates | % Graduates |
| Computers & Mathematics | 13 | 4.0% |
| Bio, Nature & Agricultural | 34 | 10.3% |
| Physical & Health Sciences | 4 | 1.2% |
| Psychology | 3 | 0.9% |
| Social Sciences | 10 | 3.0% |
| Engineering | 21 | 6.4% |
| Multidisciplinary Studies | 0 | 0.0% |
| Science & Technology | 12 | 3.6% |
| Business | 82 | 24.9% |
| Education | 101 | 30.7% |
| Literature & Languages | 0 | 0.0% |
| Liberal Arts & History | 4 | 1.2% |
| Visual & Performing Arts | 3 | 0.9% |
| Communications | 6 | 1.8% |
| Arts & Humanities | 36 | 10.9% |
| Total | 329 | 100.0% |
Transportation & Commute in McCone County
Vehicle Availability by Sex in McCone County
The most prevalent vehicle ownership categories in McCone County are males with 3 vehicles (161, accounting for 32.0%) and females with 3 vehicles (97, making up 41.4%).
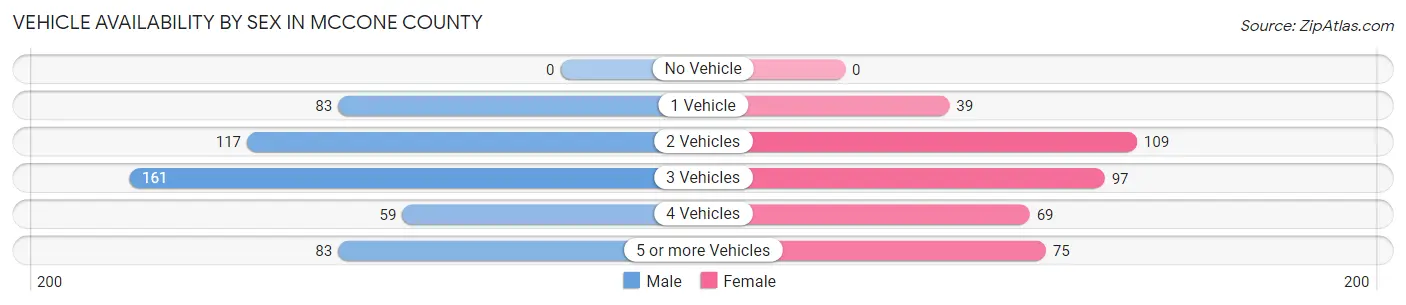
| Vehicles Available | Male | Female |
| No Vehicle | 0 (0.0%) | 0 (0.0%) |
| 1 Vehicle | 83 (16.5%) | 39 (10.0%) |
| 2 Vehicles | 117 (23.3%) | 109 (28.0%) |
| 3 Vehicles | 161 (32.0%) | 97 (24.9%) |
| 4 Vehicles | 59 (11.7%) | 69 (17.7%) |
| 5 or more Vehicles | 83 (16.5%) | 75 (19.3%) |
| Total | 503 (100.0%) | 389 (100.0%) |
Commute Time in McCone County
The most frequently occuring commute durations in McCone County are 5 to 9 minutes (171 commuters, 22.7%), 10 to 14 minutes (119 commuters, 15.8%), and 15 to 19 minutes (99 commuters, 13.1%).
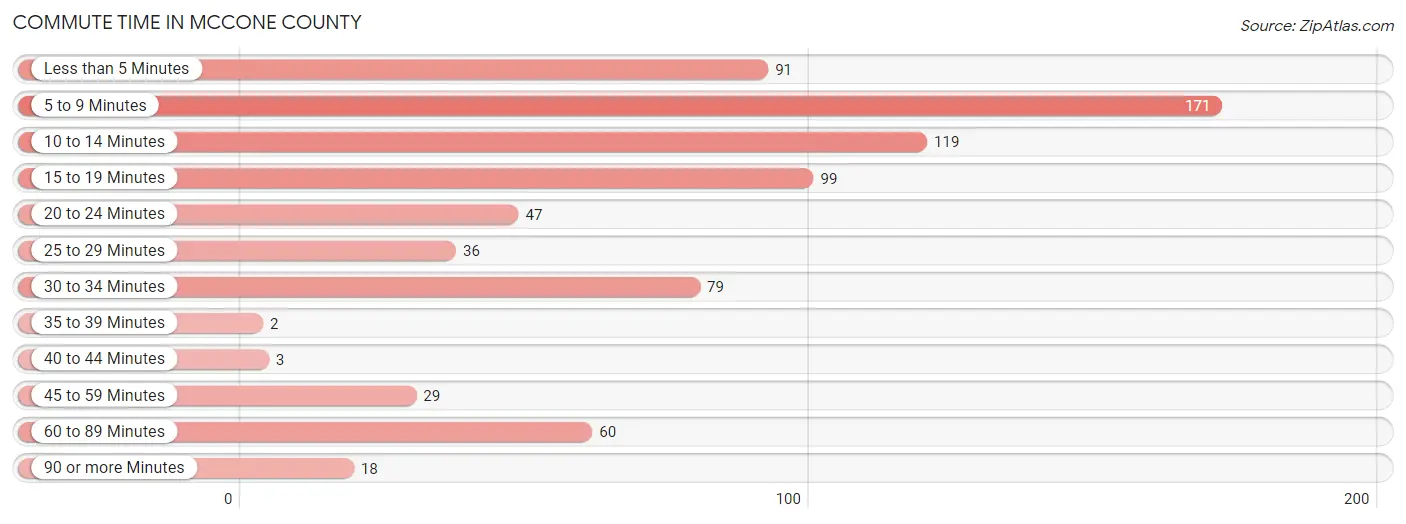
| Commute Time | # Commuters | % Commuters |
| Less than 5 Minutes | 91 | 12.1% |
| 5 to 9 Minutes | 171 | 22.7% |
| 10 to 14 Minutes | 119 | 15.8% |
| 15 to 19 Minutes | 99 | 13.1% |
| 20 to 24 Minutes | 47 | 6.2% |
| 25 to 29 Minutes | 36 | 4.8% |
| 30 to 34 Minutes | 79 | 10.5% |
| 35 to 39 Minutes | 2 | 0.3% |
| 40 to 44 Minutes | 3 | 0.4% |
| 45 to 59 Minutes | 29 | 3.8% |
| 60 to 89 Minutes | 60 | 8.0% |
| 90 or more Minutes | 18 | 2.4% |
Commute Time by Sex in McCone County
The most common commute times in McCone County are 5 to 9 minutes (123 commuters, 28.5%) for males and less than 5 minutes (64 commuters, 19.8%) for females.
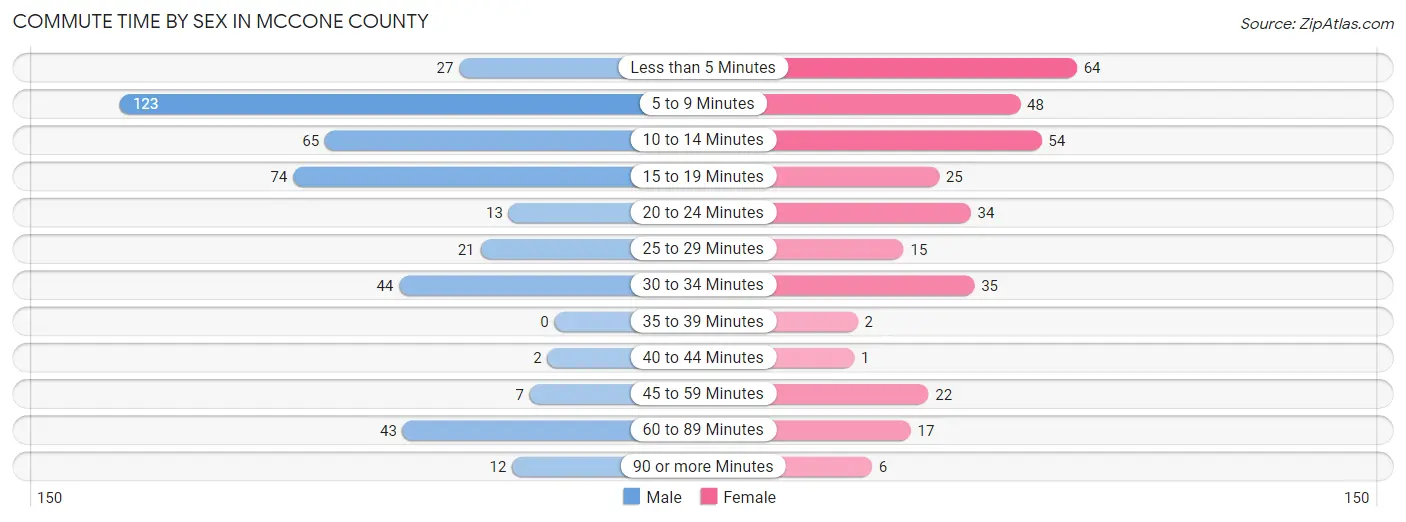
| Commute Time | Male | Female |
| Less than 5 Minutes | 27 (6.3%) | 64 (19.8%) |
| 5 to 9 Minutes | 123 (28.5%) | 48 (14.9%) |
| 10 to 14 Minutes | 65 (15.1%) | 54 (16.7%) |
| 15 to 19 Minutes | 74 (17.2%) | 25 (7.7%) |
| 20 to 24 Minutes | 13 (3.0%) | 34 (10.5%) |
| 25 to 29 Minutes | 21 (4.9%) | 15 (4.6%) |
| 30 to 34 Minutes | 44 (10.2%) | 35 (10.8%) |
| 35 to 39 Minutes | 0 (0.0%) | 2 (0.6%) |
| 40 to 44 Minutes | 2 (0.5%) | 1 (0.3%) |
| 45 to 59 Minutes | 7 (1.6%) | 22 (6.8%) |
| 60 to 89 Minutes | 43 (10.0%) | 17 (5.3%) |
| 90 or more Minutes | 12 (2.8%) | 6 (1.9%) |
Time of Departure to Work by Sex in McCone County
The most frequent times of departure to work in McCone County are 7:00 AM to 7:29 AM (130, 30.2%) for males and 7:30 AM to 7:59 AM (78, 24.1%) for females.
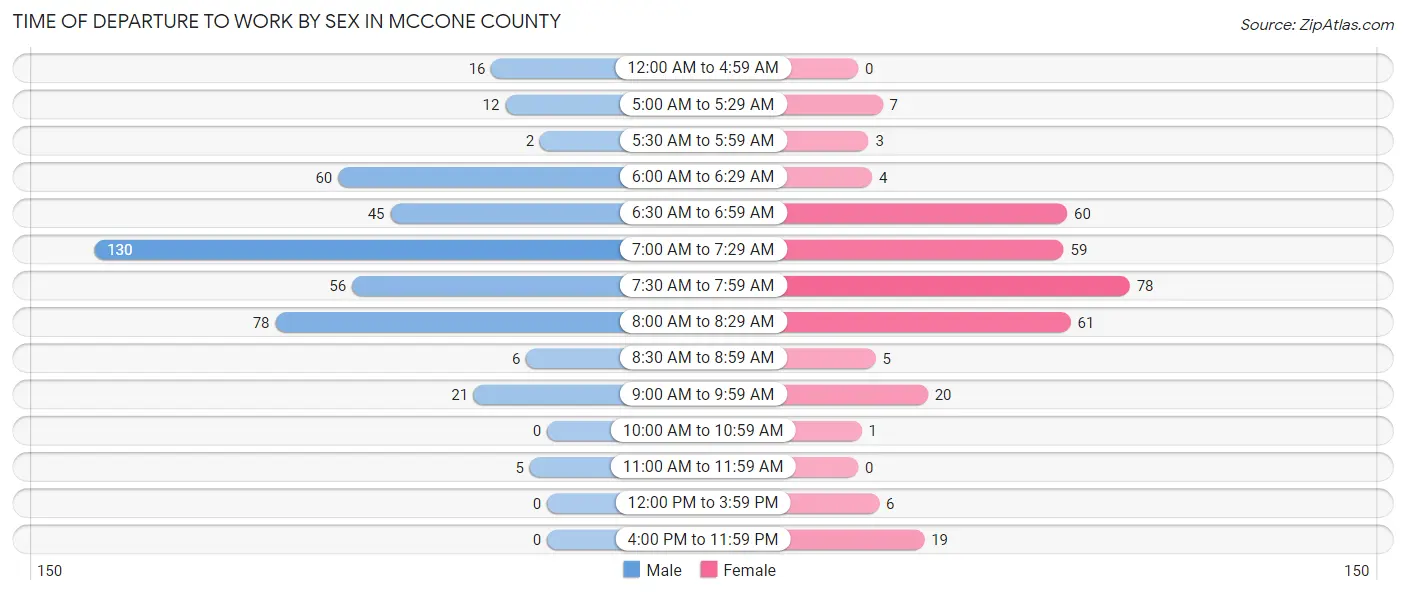
| Time of Departure | Male | Female |
| 12:00 AM to 4:59 AM | 16 (3.7%) | 0 (0.0%) |
| 5:00 AM to 5:29 AM | 12 (2.8%) | 7 (2.2%) |
| 5:30 AM to 5:59 AM | 2 (0.5%) | 3 (0.9%) |
| 6:00 AM to 6:29 AM | 60 (13.9%) | 4 (1.2%) |
| 6:30 AM to 6:59 AM | 45 (10.4%) | 60 (18.6%) |
| 7:00 AM to 7:29 AM | 130 (30.2%) | 59 (18.3%) |
| 7:30 AM to 7:59 AM | 56 (13.0%) | 78 (24.1%) |
| 8:00 AM to 8:29 AM | 78 (18.1%) | 61 (18.9%) |
| 8:30 AM to 8:59 AM | 6 (1.4%) | 5 (1.5%) |
| 9:00 AM to 9:59 AM | 21 (4.9%) | 20 (6.2%) |
| 10:00 AM to 10:59 AM | 0 (0.0%) | 1 (0.3%) |
| 11:00 AM to 11:59 AM | 5 (1.2%) | 0 (0.0%) |
| 12:00 PM to 3:59 PM | 0 (0.0%) | 6 (1.9%) |
| 4:00 PM to 11:59 PM | 0 (0.0%) | 19 (5.9%) |
| Total | 431 (100.0%) | 323 (100.0%) |
Housing Occupancy in McCone County
Occupancy by Ownership in McCone County
Of the total 782 dwellings in McCone County, owner-occupied units account for 697 (89.1%), while renter-occupied units make up 85 (10.9%).
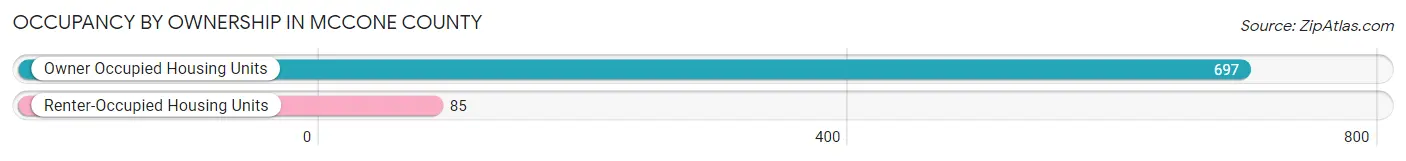
| Occupancy | # Housing Units | % Housing Units |
| Owner Occupied Housing Units | 697 | 89.1% |
| Renter-Occupied Housing Units | 85 | 10.9% |
| Total Occupied Housing Units | 782 | 100.0% |
Occupancy by Household Size in McCone County
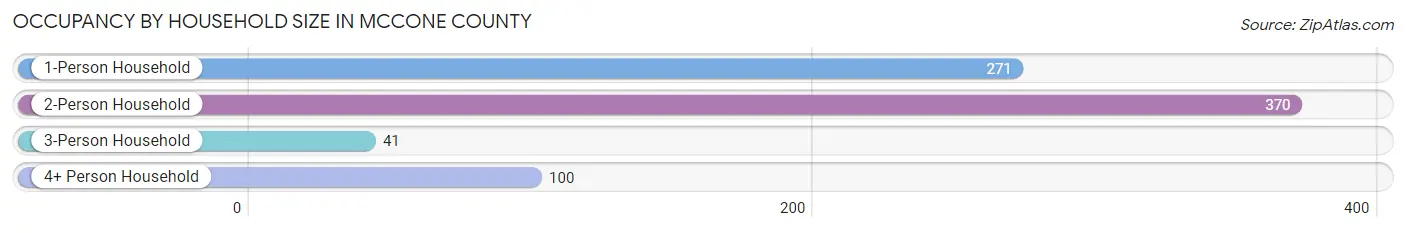
| Household Size | # Housing Units | % Housing Units |
| 1-Person Household | 271 | 34.6% |
| 2-Person Household | 370 | 47.3% |
| 3-Person Household | 41 | 5.2% |
| 4+ Person Household | 100 | 12.8% |
| Total Housing Units | 782 | 100.0% |
Occupancy by Ownership by Household Size in McCone County
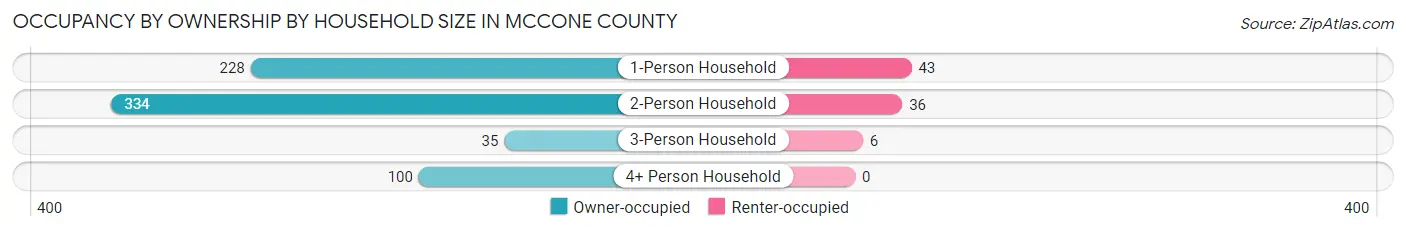
| Household Size | Owner-occupied | Renter-occupied |
| 1-Person Household | 228 (84.1%) | 43 (15.9%) |
| 2-Person Household | 334 (90.3%) | 36 (9.7%) |
| 3-Person Household | 35 (85.4%) | 6 (14.6%) |
| 4+ Person Household | 100 (100.0%) | 0 (0.0%) |
| Total Housing Units | 697 (89.1%) | 85 (10.9%) |
Occupancy by Educational Attainment in McCone County
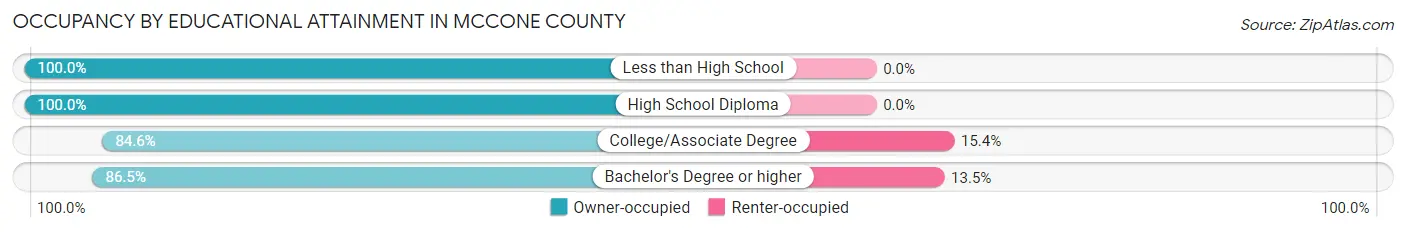
| Household Size | Owner-occupied | Renter-occupied |
| Less than High School | 30 (100.0%) | 0 (0.0%) |
| High School Diploma | 179 (100.0%) | 0 (0.0%) |
| College/Associate Degree | 334 (84.6%) | 61 (15.4%) |
| Bachelor's Degree or higher | 154 (86.5%) | 24 (13.5%) |
Occupancy by Age of Householder in McCone County
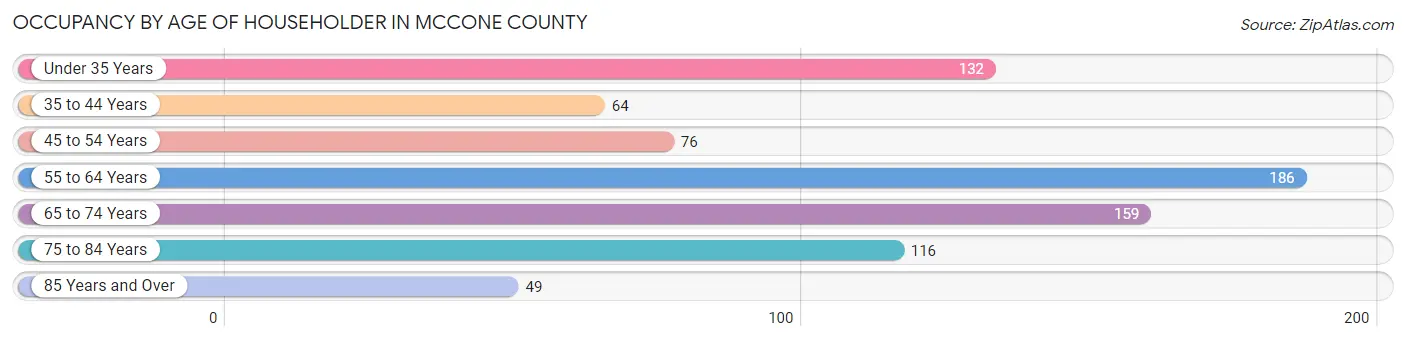
| Age Bracket | # Households | % Households |
| Under 35 Years | 132 | 16.9% |
| 35 to 44 Years | 64 | 8.2% |
| 45 to 54 Years | 76 | 9.7% |
| 55 to 64 Years | 186 | 23.8% |
| 65 to 74 Years | 159 | 20.3% |
| 75 to 84 Years | 116 | 14.8% |
| 85 Years and Over | 49 | 6.3% |
| Total | 782 | 100.0% |
Housing Finances in McCone County
Median Income by Occupancy in McCone County
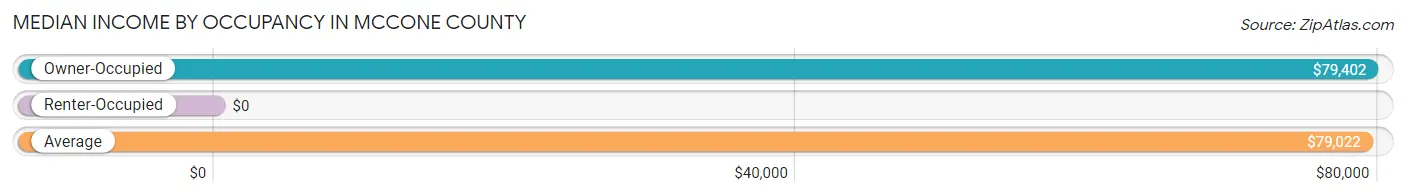
| Occupancy Type | # Households | Median Income |
| Owner-Occupied | 697 (89.1%) | $79,402 |
| Renter-Occupied | 85 (10.9%) | $0 |
| Average | 782 (100.0%) | $79,022 |
Occupancy by Householder Income Bracket in McCone County
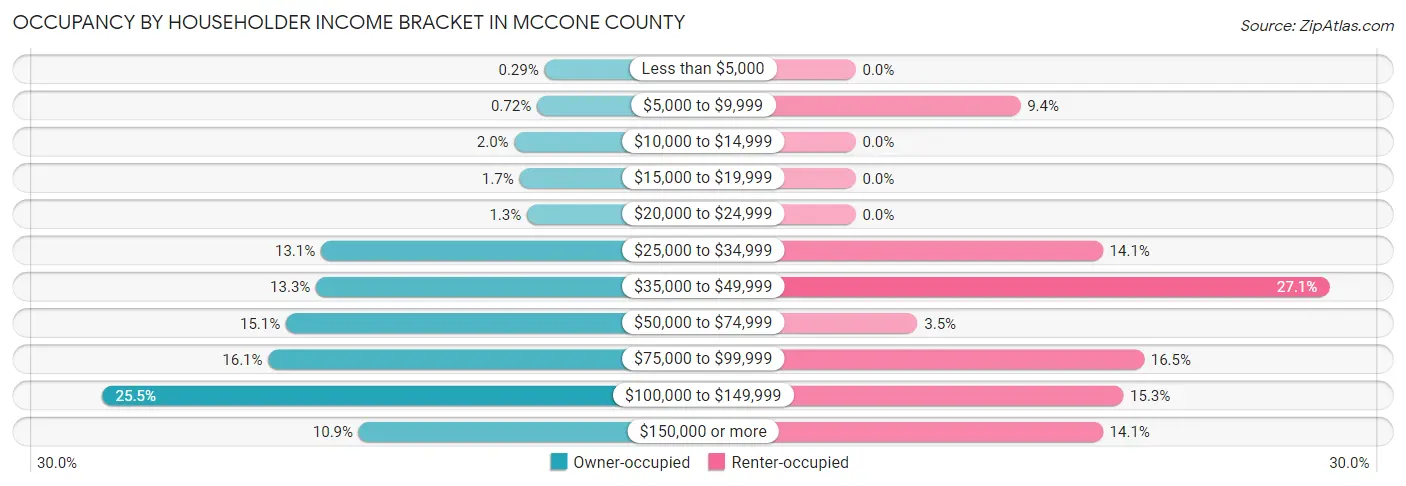
| Income Bracket | Owner-occupied | Renter-occupied |
| Less than $5,000 | 2 (0.3%) | 0 (0.0%) |
| $5,000 to $9,999 | 5 (0.7%) | 8 (9.4%) |
| $10,000 to $14,999 | 14 (2.0%) | 0 (0.0%) |
| $15,000 to $19,999 | 12 (1.7%) | 0 (0.0%) |
| $20,000 to $24,999 | 9 (1.3%) | 0 (0.0%) |
| $25,000 to $34,999 | 91 (13.1%) | 12 (14.1%) |
| $35,000 to $49,999 | 93 (13.3%) | 23 (27.1%) |
| $50,000 to $74,999 | 105 (15.1%) | 3 (3.5%) |
| $75,000 to $99,999 | 112 (16.1%) | 14 (16.5%) |
| $100,000 to $149,999 | 178 (25.5%) | 13 (15.3%) |
| $150,000 or more | 76 (10.9%) | 12 (14.1%) |
| Total | 697 (100.0%) | 85 (100.0%) |
Monthly Housing Cost Tiers in McCone County
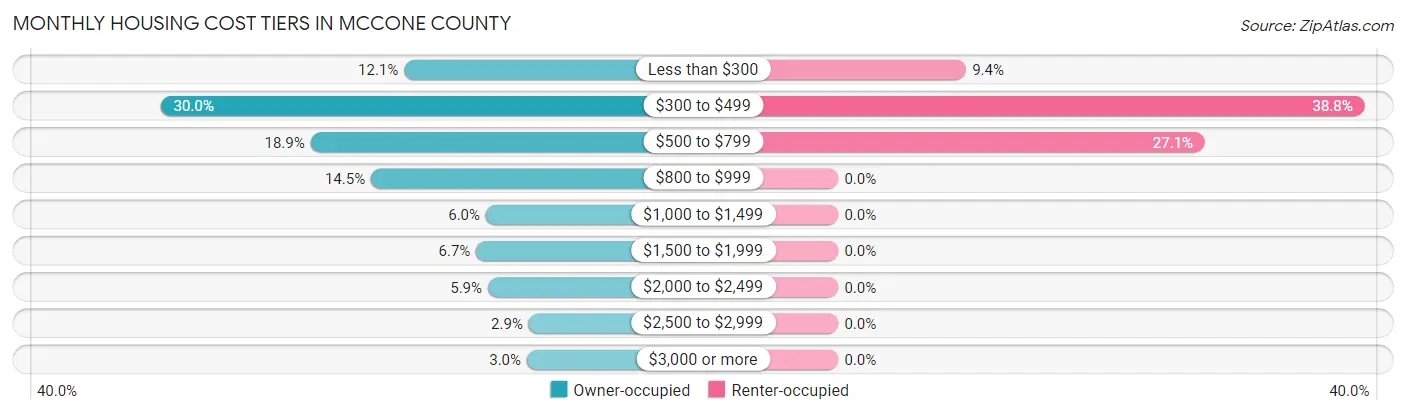
| Monthly Cost | Owner-occupied | Renter-occupied |
| Less than $300 | 84 (12.0%) | 8 (9.4%) |
| $300 to $499 | 209 (30.0%) | 33 (38.8%) |
| $500 to $799 | 132 (18.9%) | 23 (27.1%) |
| $800 to $999 | 101 (14.5%) | 0 (0.0%) |
| $1,000 to $1,499 | 42 (6.0%) | 0 (0.0%) |
| $1,500 to $1,999 | 47 (6.7%) | 0 (0.0%) |
| $2,000 to $2,499 | 41 (5.9%) | 0 (0.0%) |
| $2,500 to $2,999 | 20 (2.9%) | 0 (0.0%) |
| $3,000 or more | 21 (3.0%) | 0 (0.0%) |
| Total | 697 (100.0%) | 85 (100.0%) |
Physical Housing Characteristics in McCone County
Housing Structures in McCone County
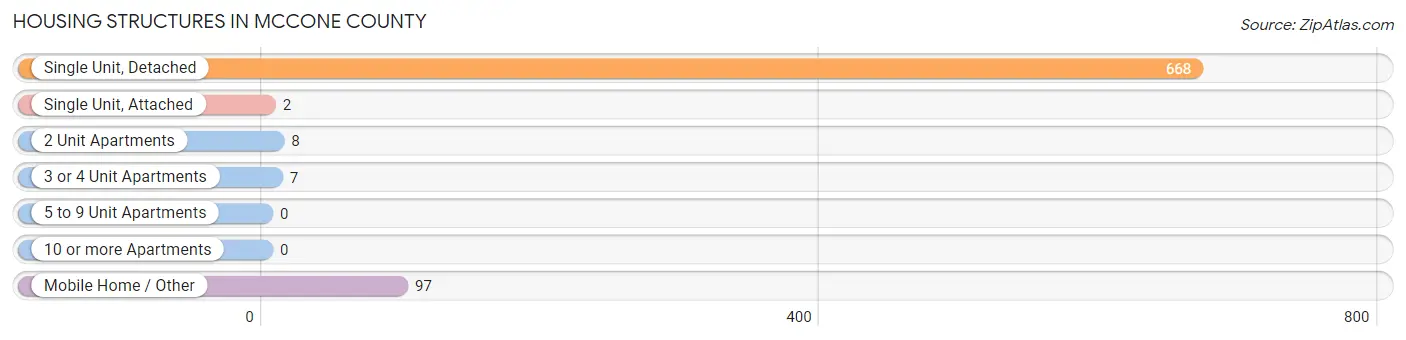
| Structure Type | # Housing Units | % Housing Units |
| Single Unit, Detached | 668 | 85.4% |
| Single Unit, Attached | 2 | 0.3% |
| 2 Unit Apartments | 8 | 1.0% |
| 3 or 4 Unit Apartments | 7 | 0.9% |
| 5 to 9 Unit Apartments | 0 | 0.0% |
| 10 or more Apartments | 0 | 0.0% |
| Mobile Home / Other | 97 | 12.4% |
| Total | 782 | 100.0% |
Housing Structures by Occupancy in McCone County
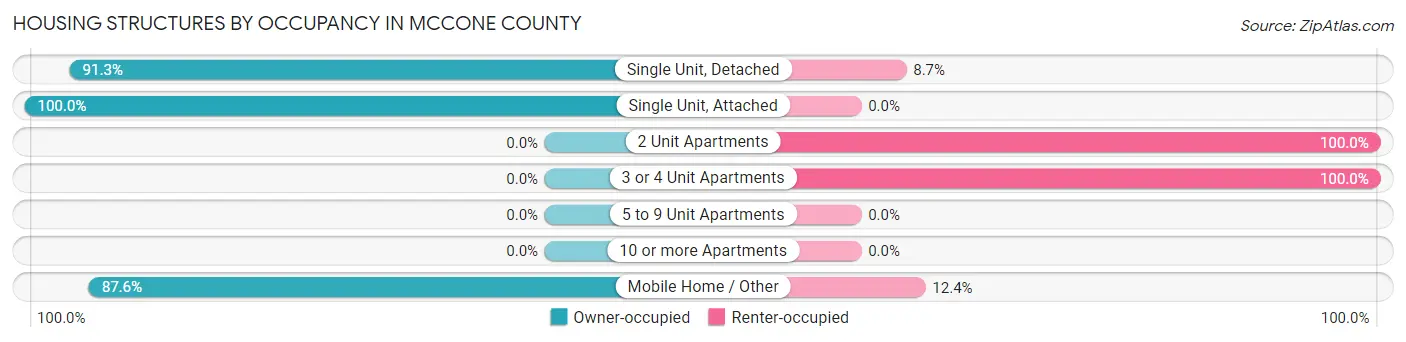
| Structure Type | Owner-occupied | Renter-occupied |
| Single Unit, Detached | 610 (91.3%) | 58 (8.7%) |
| Single Unit, Attached | 2 (100.0%) | 0 (0.0%) |
| 2 Unit Apartments | 0 (0.0%) | 8 (100.0%) |
| 3 or 4 Unit Apartments | 0 (0.0%) | 7 (100.0%) |
| 5 to 9 Unit Apartments | 0 (0.0%) | 0 (0.0%) |
| 10 or more Apartments | 0 (0.0%) | 0 (0.0%) |
| Mobile Home / Other | 85 (87.6%) | 12 (12.4%) |
| Total | 697 (89.1%) | 85 (10.9%) |
Housing Structures by Number of Rooms in McCone County
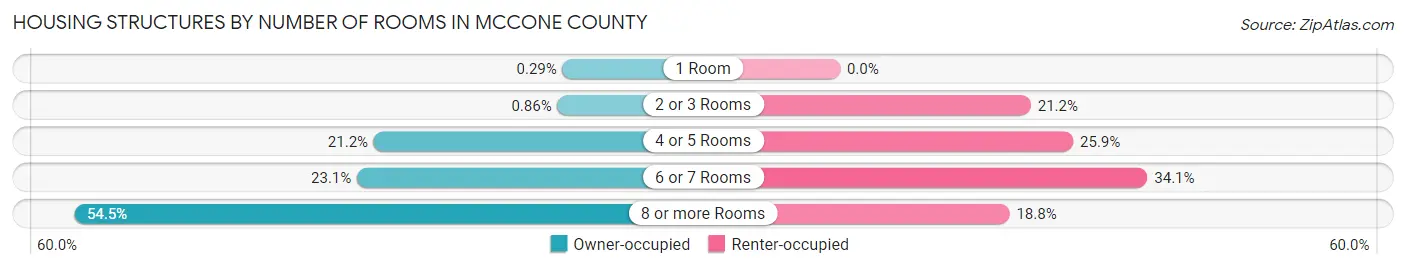
| Number of Rooms | Owner-occupied | Renter-occupied |
| 1 Room | 2 (0.3%) | 0 (0.0%) |
| 2 or 3 Rooms | 6 (0.9%) | 18 (21.2%) |
| 4 or 5 Rooms | 148 (21.2%) | 22 (25.9%) |
| 6 or 7 Rooms | 161 (23.1%) | 29 (34.1%) |
| 8 or more Rooms | 380 (54.5%) | 16 (18.8%) |
| Total | 697 (100.0%) | 85 (100.0%) |
Housing Structure by Heating Type in McCone County
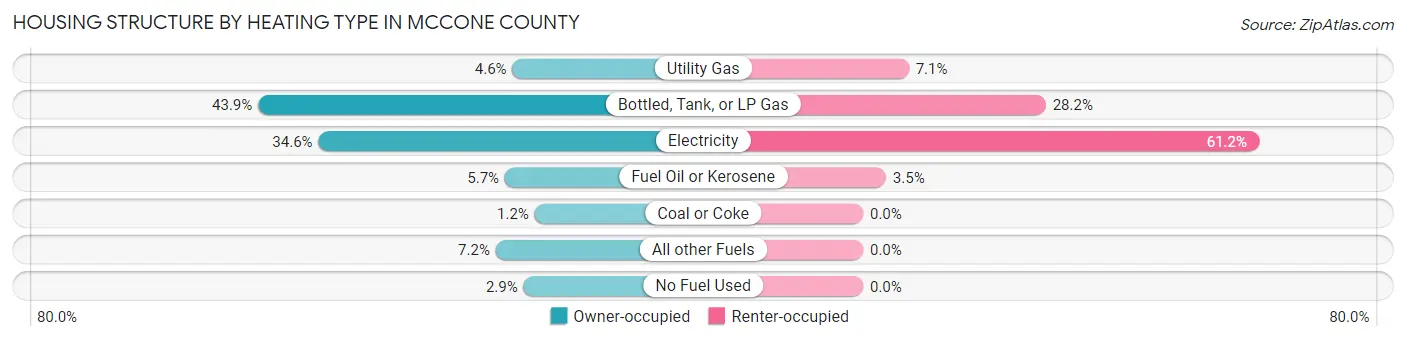
| Heating Type | Owner-occupied | Renter-occupied |
| Utility Gas | 32 (4.6%) | 6 (7.1%) |
| Bottled, Tank, or LP Gas | 306 (43.9%) | 24 (28.2%) |
| Electricity | 241 (34.6%) | 52 (61.2%) |
| Fuel Oil or Kerosene | 40 (5.7%) | 3 (3.5%) |
| Coal or Coke | 8 (1.1%) | 0 (0.0%) |
| All other Fuels | 50 (7.2%) | 0 (0.0%) |
| No Fuel Used | 20 (2.9%) | 0 (0.0%) |
| Total | 697 (100.0%) | 85 (100.0%) |
Household Vehicle Usage in McCone County
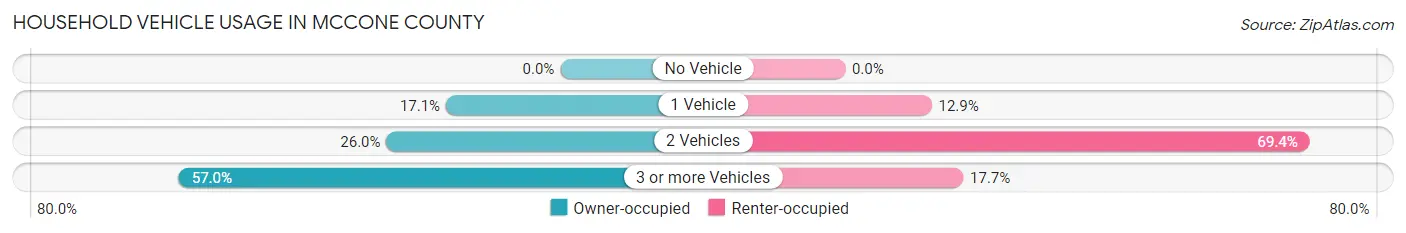
| Vehicles per Household | Owner-occupied | Renter-occupied |
| No Vehicle | 0 (0.0%) | 0 (0.0%) |
| 1 Vehicle | 119 (17.1%) | 11 (12.9%) |
| 2 Vehicles | 181 (26.0%) | 59 (69.4%) |
| 3 or more Vehicles | 397 (57.0%) | 15 (17.6%) |
| Total | 697 (100.0%) | 85 (100.0%) |
Real Estate & Mortgages in McCone County
Real Estate and Mortgage Overview in McCone County
| Characteristic | Without Mortgage | With Mortgage |
| Housing Units | 511 | 186 |
| Median Property Value | $157,500 | $238,700 |
| Median Household Income | $65,481 | $11 |
| Monthly Housing Costs | $471 | $21 |
| Real Estate Taxes | $995 | $0 |
Property Value by Mortgage Status in McCone County
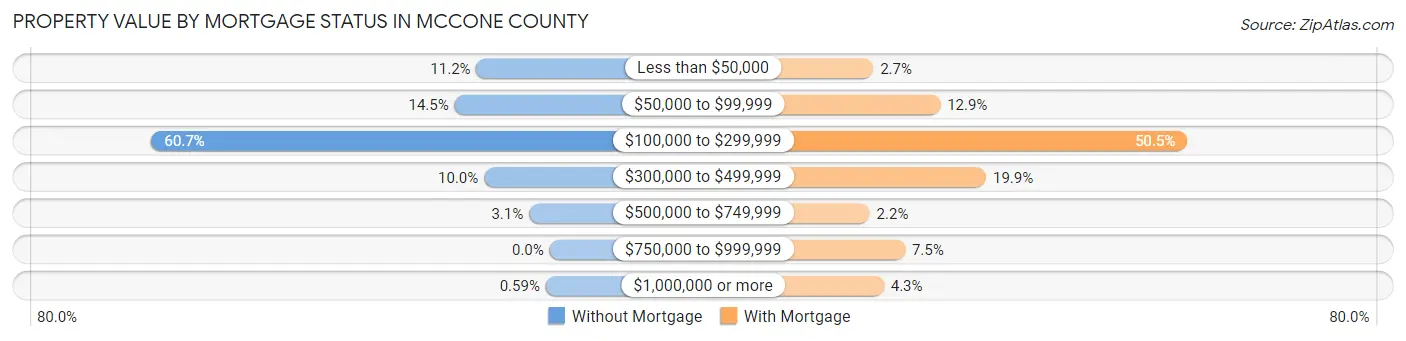
| Property Value | Without Mortgage | With Mortgage |
| Less than $50,000 | 57 (11.2%) | 5 (2.7%) |
| $50,000 to $99,999 | 74 (14.5%) | 24 (12.9%) |
| $100,000 to $299,999 | 310 (60.7%) | 94 (50.5%) |
| $300,000 to $499,999 | 51 (10.0%) | 37 (19.9%) |
| $500,000 to $749,999 | 16 (3.1%) | 4 (2.1%) |
| $750,000 to $999,999 | 0 (0.0%) | 14 (7.5%) |
| $1,000,000 or more | 3 (0.6%) | 8 (4.3%) |
| Total | 511 (100.0%) | 186 (100.0%) |
Household Income by Mortgage Status in McCone County
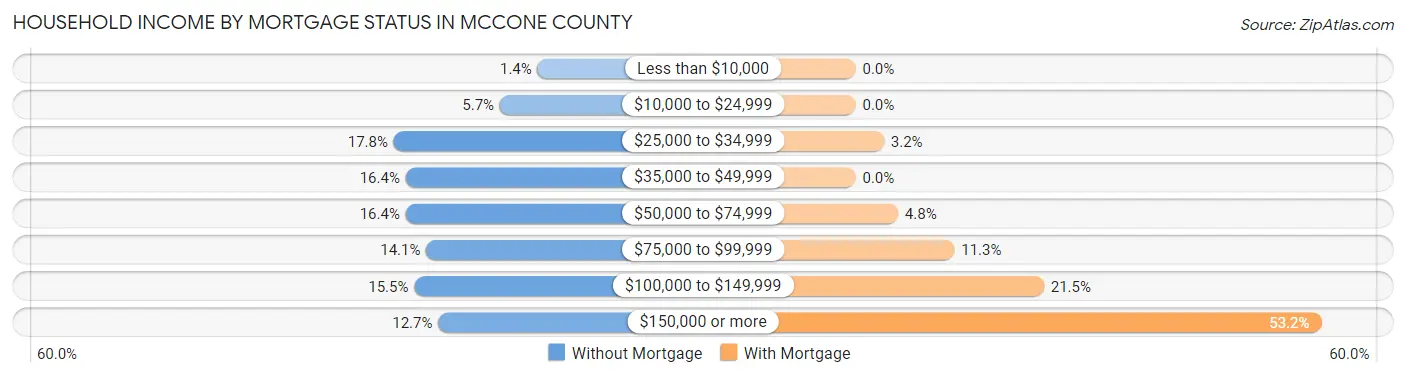
| Household Income | Without Mortgage | With Mortgage |
| Less than $10,000 | 7 (1.4%) | 0 (0.0%) |
| $10,000 to $24,999 | 29 (5.7%) | 0 (0.0%) |
| $25,000 to $34,999 | 91 (17.8%) | 6 (3.2%) |
| $35,000 to $49,999 | 84 (16.4%) | 0 (0.0%) |
| $50,000 to $74,999 | 84 (16.4%) | 9 (4.8%) |
| $75,000 to $99,999 | 72 (14.1%) | 21 (11.3%) |
| $100,000 to $149,999 | 79 (15.5%) | 40 (21.5%) |
| $150,000 or more | 65 (12.7%) | 99 (53.2%) |
| Total | 511 (100.0%) | 186 (100.0%) |
Property Value to Household Income Ratio in McCone County
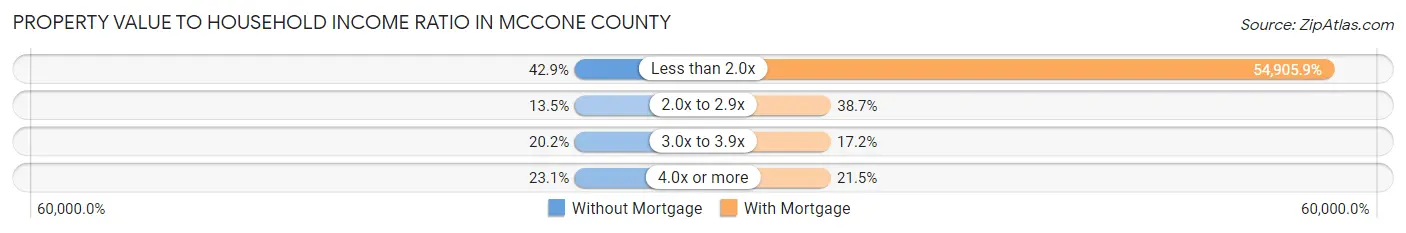
| Value-to-Income Ratio | Without Mortgage | With Mortgage |
| Less than 2.0x | 219 (42.9%) | 102,125 (54,905.9%) |
| 2.0x to 2.9x | 69 (13.5%) | 72 (38.7%) |
| 3.0x to 3.9x | 103 (20.2%) | 32 (17.2%) |
| 4.0x or more | 118 (23.1%) | 40 (21.5%) |
| Total | 511 (100.0%) | 186 (100.0%) |
Real Estate Taxes by Mortgage Status in McCone County
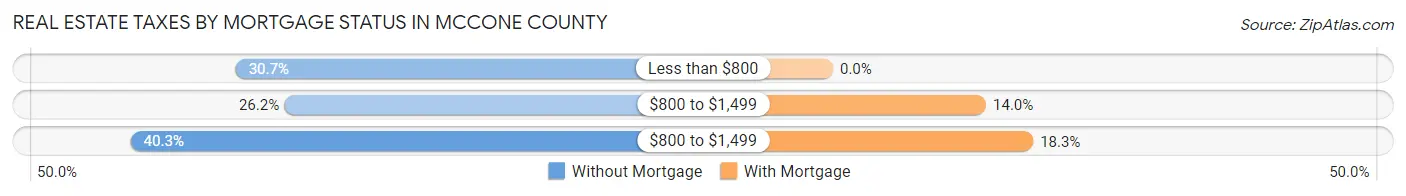
| Property Taxes | Without Mortgage | With Mortgage |
| Less than $800 | 157 (30.7%) | 0 (0.0%) |
| $800 to $1,499 | 134 (26.2%) | 26 (14.0%) |
| $800 to $1,499 | 206 (40.3%) | 34 (18.3%) |
| Total | 511 (100.0%) | 186 (100.0%) |
Health & Disability in McCone County
Health Insurance Coverage by Age in McCone County
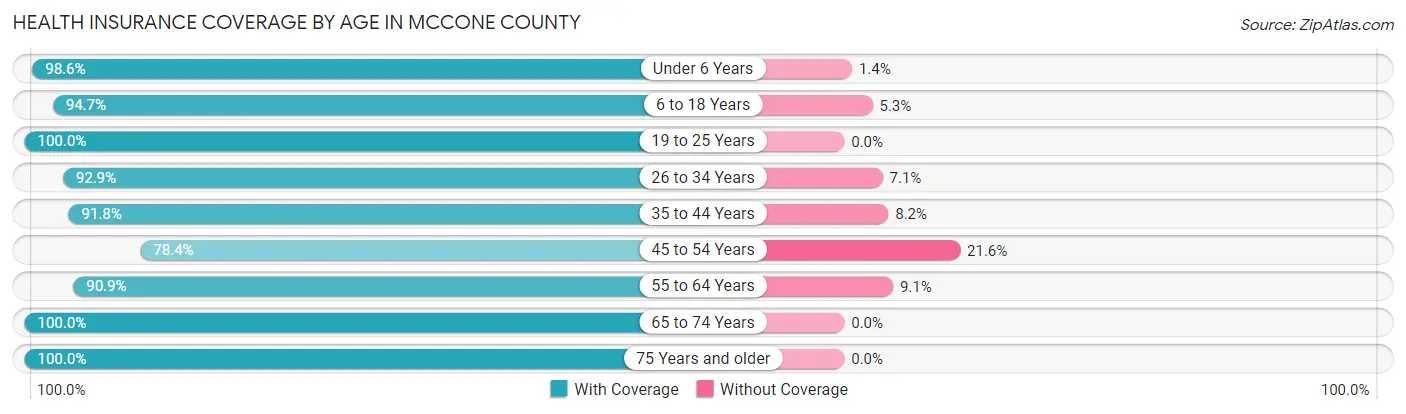
| Age Bracket | With Coverage | Without Coverage |
| Under 6 Years | 137 (98.6%) | 2 (1.4%) |
| 6 to 18 Years | 162 (94.7%) | 9 (5.3%) |
| 19 to 25 Years | 120 (100.0%) | 0 (0.0%) |
| 26 to 34 Years | 117 (92.9%) | 9 (7.1%) |
| 35 to 44 Years | 168 (91.8%) | 15 (8.2%) |
| 45 to 54 Years | 127 (78.4%) | 35 (21.6%) |
| 55 to 64 Years | 300 (90.9%) | 30 (9.1%) |
| 65 to 74 Years | 274 (100.0%) | 0 (0.0%) |
| 75 Years and older | 221 (100.0%) | 0 (0.0%) |
| Total | 1,626 (94.2%) | 100 (5.8%) |
Health Insurance Coverage by Citizenship Status in McCone County
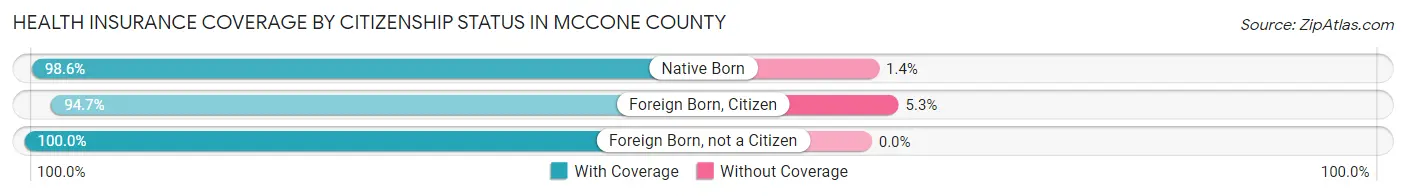
| Citizenship Status | With Coverage | Without Coverage |
| Native Born | 137 (98.6%) | 2 (1.4%) |
| Foreign Born, Citizen | 162 (94.7%) | 9 (5.3%) |
| Foreign Born, not a Citizen | 120 (100.0%) | 0 (0.0%) |
Health Insurance Coverage by Household Income in McCone County
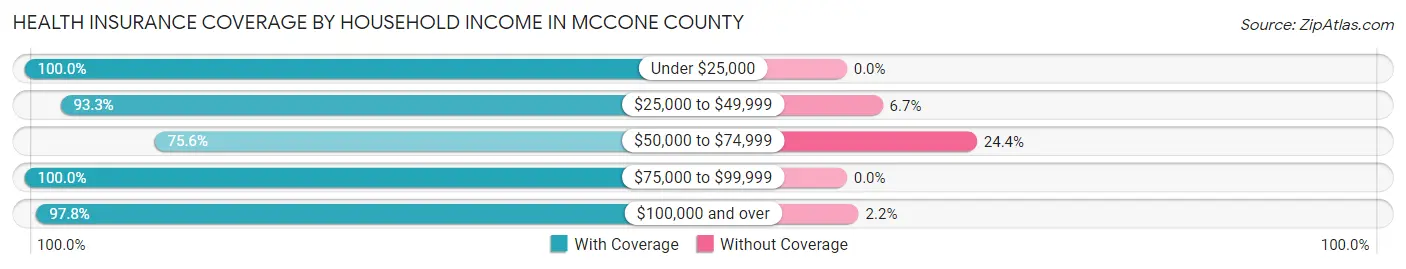
| Household Income | With Coverage | Without Coverage |
| Under $25,000 | 67 (100.0%) | 0 (0.0%) |
| $25,000 to $49,999 | 347 (93.3%) | 25 (6.7%) |
| $50,000 to $74,999 | 180 (75.6%) | 58 (24.4%) |
| $75,000 to $99,999 | 271 (100.0%) | 0 (0.0%) |
| $100,000 and over | 749 (97.8%) | 17 (2.2%) |
Public vs Private Health Insurance Coverage by Age in McCone County
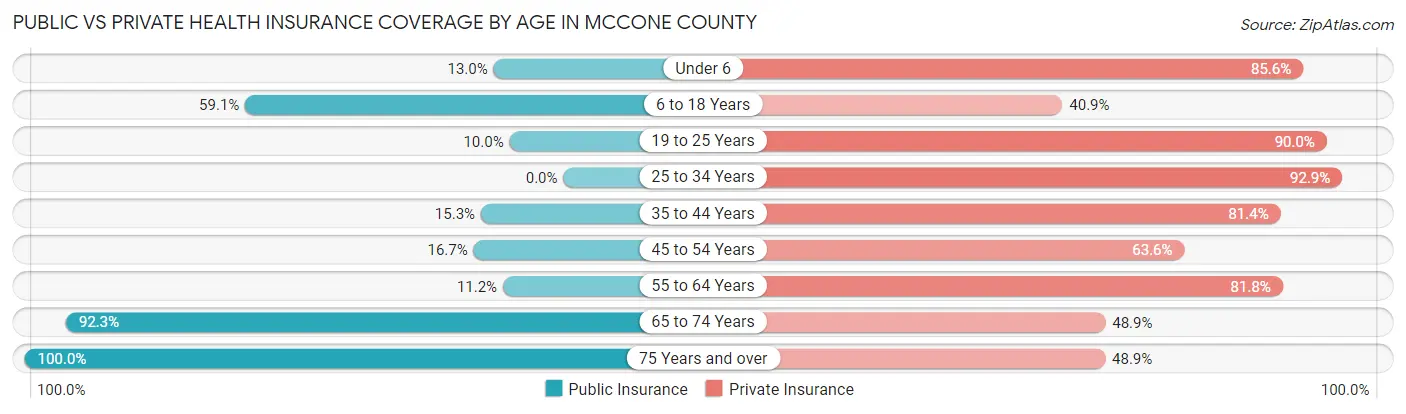
| Age Bracket | Public Insurance | Private Insurance |
| Under 6 | 18 (13.0%) | 119 (85.6%) |
| 6 to 18 Years | 101 (59.1%) | 70 (40.9%) |
| 19 to 25 Years | 12 (10.0%) | 108 (90.0%) |
| 25 to 34 Years | 0 (0.0%) | 117 (92.9%) |
| 35 to 44 Years | 28 (15.3%) | 149 (81.4%) |
| 45 to 54 Years | 27 (16.7%) | 103 (63.6%) |
| 55 to 64 Years | 37 (11.2%) | 270 (81.8%) |
| 65 to 74 Years | 253 (92.3%) | 134 (48.9%) |
| 75 Years and over | 221 (100.0%) | 108 (48.9%) |
| Total | 697 (40.4%) | 1,178 (68.2%) |
Disability Status by Sex by Age in McCone County
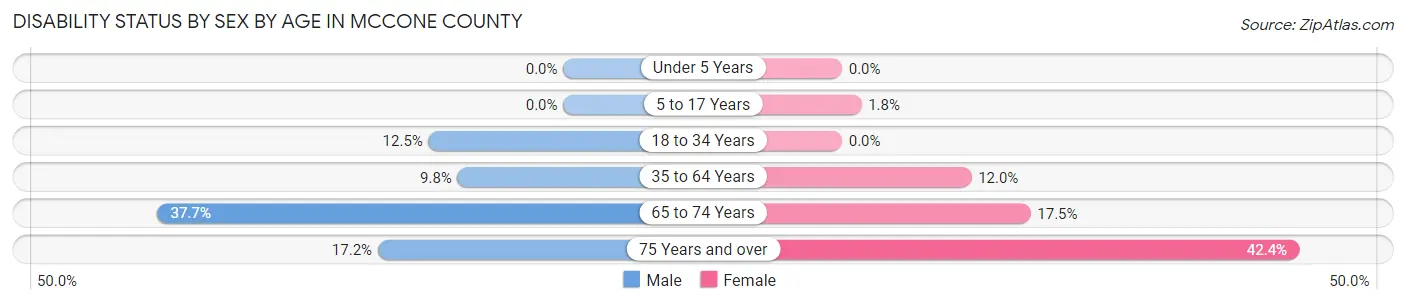
| Age Bracket | Male | Female |
| Under 5 Years | 0 (0.0%) | 0 (0.0%) |
| 5 to 17 Years | 0 (0.0%) | 2 (1.8%) |
| 18 to 34 Years | 16 (12.5%) | 0 (0.0%) |
| 35 to 64 Years | 36 (9.8%) | 37 (12.0%) |
| 65 to 74 Years | 58 (37.7%) | 21 (17.5%) |
| 75 Years and over | 21 (17.2%) | 42 (42.4%) |
Disability Class by Sex by Age in McCone County
Disability Class: Hearing Difficulty
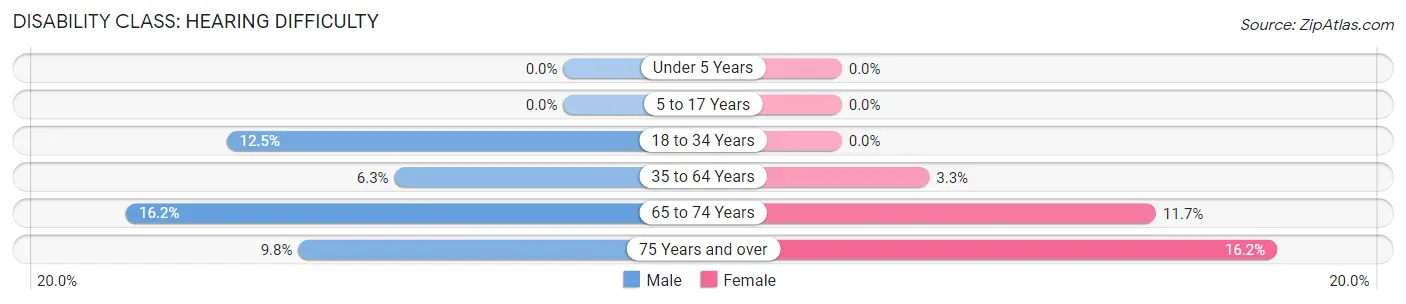
| Age Bracket | Male | Female |
| Under 5 Years | 0 (0.0%) | 0 (0.0%) |
| 5 to 17 Years | 0 (0.0%) | 0 (0.0%) |
| 18 to 34 Years | 16 (12.5%) | 0 (0.0%) |
| 35 to 64 Years | 23 (6.3%) | 10 (3.3%) |
| 65 to 74 Years | 25 (16.2%) | 14 (11.7%) |
| 75 Years and over | 12 (9.8%) | 16 (16.2%) |
Disability Class: Vision Difficulty
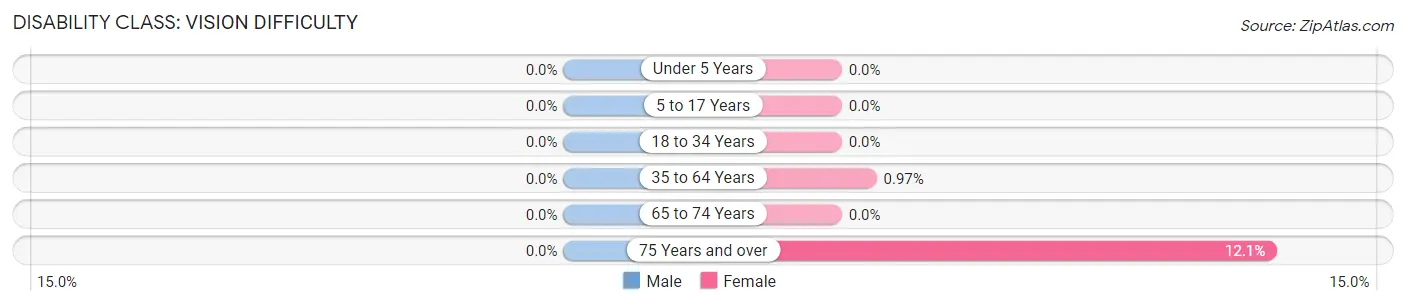
| Age Bracket | Male | Female |
| Under 5 Years | 0 (0.0%) | 0 (0.0%) |
| 5 to 17 Years | 0 (0.0%) | 0 (0.0%) |
| 18 to 34 Years | 0 (0.0%) | 0 (0.0%) |
| 35 to 64 Years | 0 (0.0%) | 3 (1.0%) |
| 65 to 74 Years | 0 (0.0%) | 0 (0.0%) |
| 75 Years and over | 0 (0.0%) | 12 (12.1%) |
Disability Class: Cognitive Difficulty
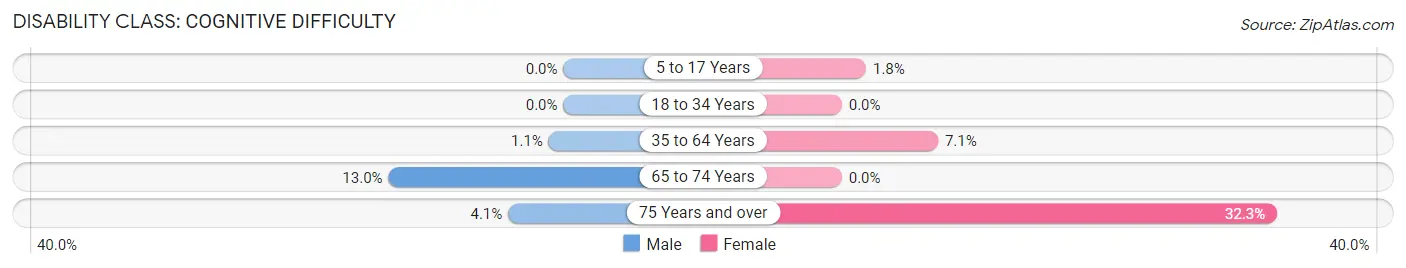
| Age Bracket | Male | Female |
| 5 to 17 Years | 0 (0.0%) | 2 (1.8%) |
| 18 to 34 Years | 0 (0.0%) | 0 (0.0%) |
| 35 to 64 Years | 4 (1.1%) | 22 (7.1%) |
| 65 to 74 Years | 20 (13.0%) | 0 (0.0%) |
| 75 Years and over | 5 (4.1%) | 32 (32.3%) |
Disability Class: Ambulatory Difficulty
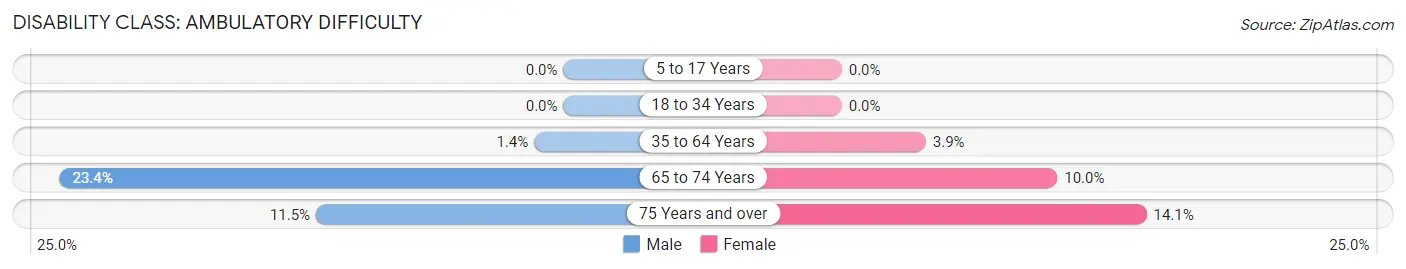
| Age Bracket | Male | Female |
| 5 to 17 Years | 0 (0.0%) | 0 (0.0%) |
| 18 to 34 Years | 0 (0.0%) | 0 (0.0%) |
| 35 to 64 Years | 5 (1.4%) | 12 (3.9%) |
| 65 to 74 Years | 36 (23.4%) | 12 (10.0%) |
| 75 Years and over | 14 (11.5%) | 14 (14.1%) |
Disability Class: Self-Care Difficulty
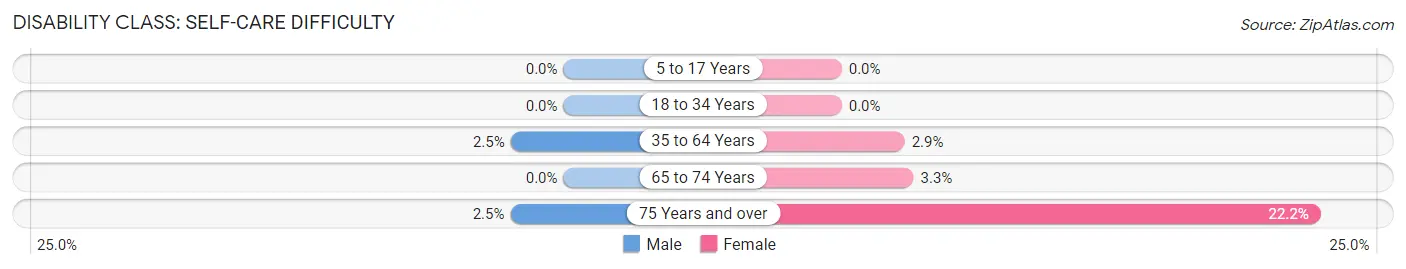
| Age Bracket | Male | Female |
| 5 to 17 Years | 0 (0.0%) | 0 (0.0%) |
| 18 to 34 Years | 0 (0.0%) | 0 (0.0%) |
| 35 to 64 Years | 9 (2.5%) | 9 (2.9%) |
| 65 to 74 Years | 0 (0.0%) | 4 (3.3%) |
| 75 Years and over | 3 (2.5%) | 22 (22.2%) |
Technology Access in McCone County
Computing Device Access in McCone County
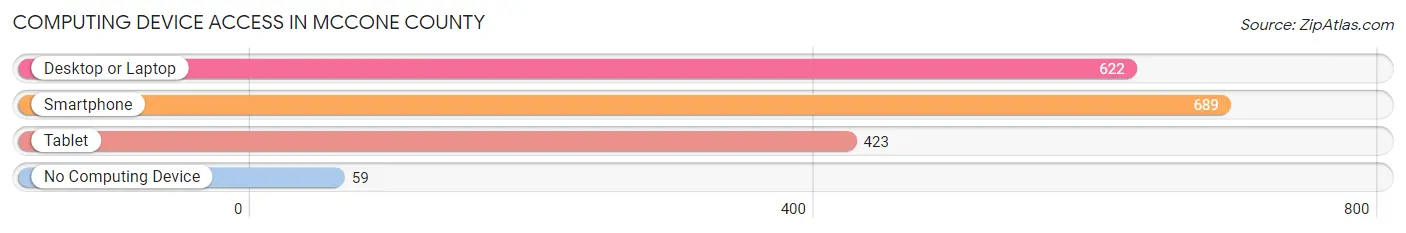
| Device Type | # Households | % Households |
| Desktop or Laptop | 622 | 79.5% |
| Smartphone | 689 | 88.1% |
| Tablet | 423 | 54.1% |
| No Computing Device | 59 | 7.5% |
| Total | 782 | 100.0% |
Internet Access in McCone County
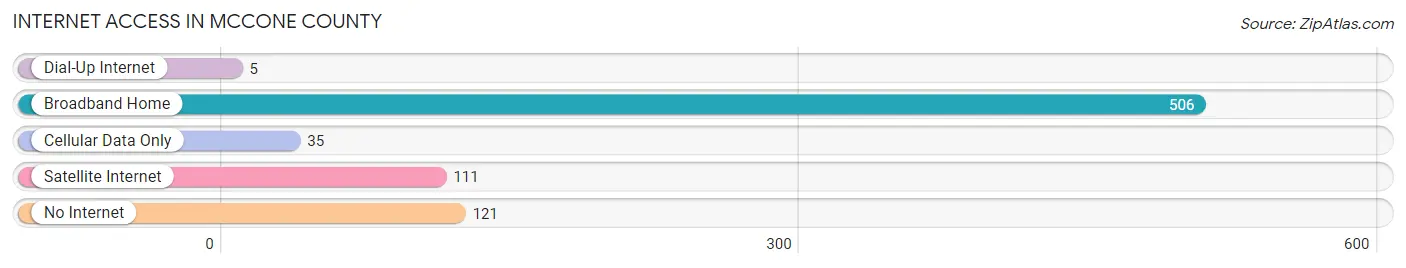
| Internet Type | # Households | % Households |
| Dial-Up Internet | 5 | 0.6% |
| Broadband Home | 506 | 64.7% |
| Cellular Data Only | 35 | 4.5% |
| Satellite Internet | 111 | 14.2% |
| No Internet | 121 | 15.5% |
| Total | 782 | 100.0% |
McCone County Summary
Mccone County, Montana is located in the northeastern part of the state, and is bordered by Richland County to the north, Dawson County to the east, Garfield County to the south, and Wibaux County to the west. The county seat is Circle, and the largest city is Circle. The county was established in 1919 and named after Alexander Mccone, a prominent rancher in the area.
Geography
Mccone County is located in the northeastern part of Montana, and is bordered by Richland County to the north, Dawson County to the east, Garfield County to the south, and Wibaux County to the west. The county has a total area of 1,845 square miles, of which 1,843 square miles is land and 2 square miles is water. The county is mostly flat, with rolling hills in the east and south. The highest point in the county is located in the northwest corner, at an elevation of 3,845 feet. The county is home to several rivers, including the Yellowstone, Missouri, and Musselshell.
Demographics
As of the 2010 census, there were 1,845 people, 745 households, and 517 families residing in the county. The population density was 1 person per square mile. The racial makeup of the county was 97.3% White, 0.2% African American, 0.7% Native American, 0.2% Asian, 0.1% Pacific Islander, 0.3% from other races, and 1.2% from two or more races. Hispanic or Latino of any race were 1.2% of the population.
The median income for a household in the county was $37,917, and the median income for a family was $45,000. Males had a median income of $31,250 versus $20,000 for females. The per capita income for the county was $17,845. About 11.2% of families and 14.2% of the population were below the poverty line, including 17.2% of those under age 18 and 11.2% of those age 65 or over.
Economy
Mccone County is primarily an agricultural county, with the majority of the population employed in farming and ranching. The county is home to several large ranches, including the Mccone Ranch, which is the largest in the state. The county also has a strong tourism industry, with many visitors coming to the area to hunt, fish, and enjoy the outdoors. The county is also home to several oil and gas wells, which provide jobs and revenue for the county.
History
Mccone County was established in 1919 and named after Alexander Mccone, a prominent rancher in the area. The county was originally part of Dawson County, but was split off in 1919 due to its large size. The county seat was originally located in Circle, but was moved to Circle in 1921.
The county has a long history of ranching and farming, and the area was home to several large ranches, including the Mccone Ranch. The county was also home to several oil and gas wells, which provided jobs and revenue for the county.
In recent years, the county has seen an influx of new residents, as people move to the area for its rural lifestyle and outdoor recreation opportunities. The county has also seen an increase in tourism, as people come to the area to hunt, fish, and enjoy the outdoors.
Common Questions
What is the Total Population of McCone County?
Total Population of McCone County is 1,746.
What is the Total Male Population of McCone County?
Total Male Population of McCone County is 913.
What is the Total Female Population of McCone County?
Total Female Population of McCone County is 833.
What is the Ratio of Males per 100 Females in McCone County?
There are 109.60 Males per 100 Females in McCone County.
What is the Ratio of Females per 100 Males in McCone County?
There are 91.24 Females per 100 Males in McCone County.
What is the Median Population Age in McCone County?
Median Population Age in McCone County is 54.0 Years.
What is the Average Family Size in McCone County
Average Family Size in McCone County is 2.9 People.
What is the Average Household Size in McCone County
Average Household Size in McCone County is 2.2 People.
What is Per Capita Income in McCone County?
Per Capita income in McCone County is $39,284.
What is the Median Family Income in McCone County?
Median Family Income in McCone County is $85,417.
What is the Median Household income in McCone County?
Median Household Income in McCone County is $79,022.
What is Income or Wage Gap in McCone County?
Income or Wage Gap in McCone County is 13.0%.
Women in McCone County earn 87.0 cents for every dollar earned by a man.
What is Family Income Deficit in McCone County?
Family Income Deficit in McCone County is $9,500.
Families that are below poverty line in McCone County earn $9,500 less on average than the poverty threshold level.
What is Inequality or Gini Index in McCone County?
Inequality or Gini Index in McCone County is 0.36.
How Large is the Labor Force in McCone County?
There are 938 People in the Labor Forcein in McCone County.
What is the Percentage of People in the Labor Force in McCone County?
63.4% of People are in the Labor Force in McCone County.
What is the Unemployment Rate in McCone County?
Unemployment Rate in McCone County is 2.5%.