Judith Basin County, MT
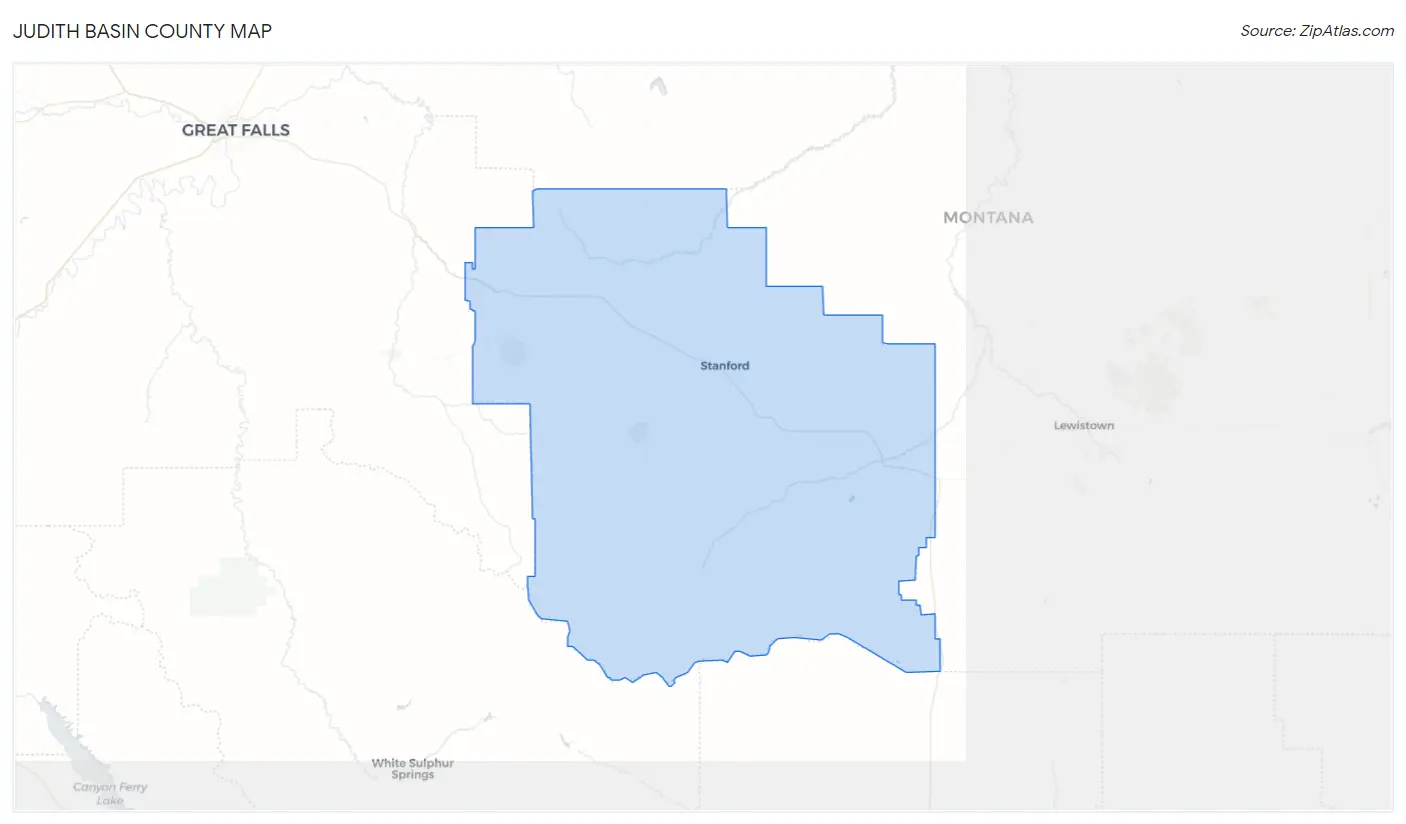
Judith Basin County Map
Judith Basin County Overview
2,039
TOTAL POPULATION
1,131
MALE POPULATION
908
FEMALE POPULATION
124.56
MALES / 100 FEMALES
80.28
FEMALES / 100 MALES
50.2
MEDIAN AGE
2.9
AVG FAMILY SIZE
2.3
AVG HOUSEHOLD SIZE
$36,713
PER CAPITA INCOME
$76,406
AVG FAMILY INCOME
$58,750
AVG HOUSEHOLD INCOME
22.6%
WAGE / INCOME GAP [ % ]
77.4¢/ $1
WAGE / INCOME GAP [ $ ]
0.50
INEQUALITY / GINI INDEX
1,020
LABOR FORCE [ PEOPLE ]
62.6%
PERCENT IN LABOR FORCE
2.4%
UNEMPLOYMENT RATE
Judith Basin County Area Codes
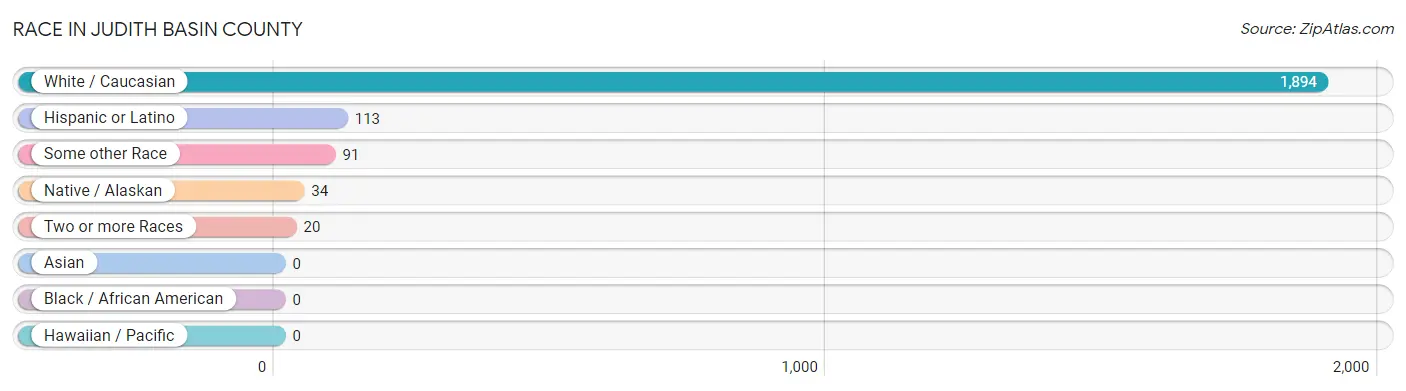
Race in Judith Basin County
The most populous races in Judith Basin County are White / Caucasian (1,894 | 92.9%), Hispanic or Latino (113 | 5.5%), and Some other Race (91 | 4.5%).
| Race | # Population | % Population |
| Asian | 0 | 0.0% |
| Black / African American | 0 | 0.0% |
| Hawaiian / Pacific | 0 | 0.0% |
| Hispanic or Latino | 113 | 5.5% |
| Native / Alaskan | 34 | 1.7% |
| White / Caucasian | 1,894 | 92.9% |
| Two or more Races | 20 | 1.0% |
| Some other Race | 91 | 4.5% |
| Total | 2,039 | 100.0% |
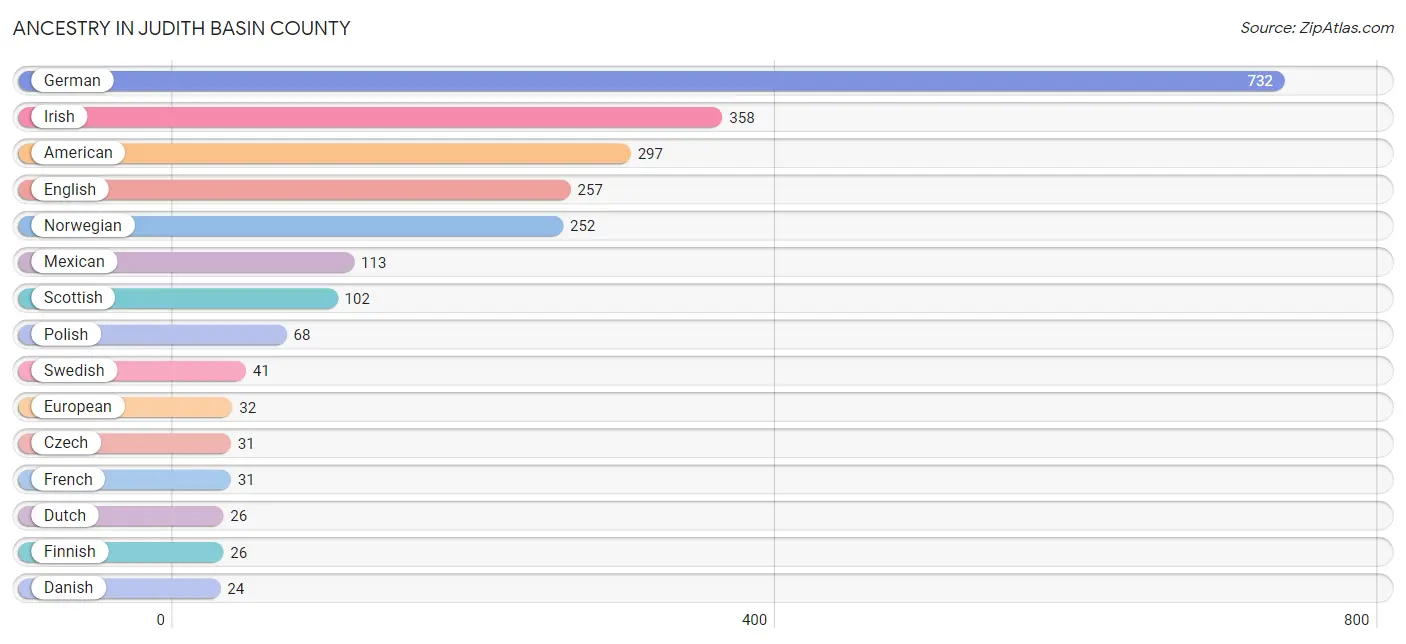
Ancestry in Judith Basin County
The most populous ancestries reported in Judith Basin County are German (732 | 35.9%), Irish (358 | 17.6%), American (297 | 14.6%), English (257 | 12.6%), and Norwegian (252 | 12.4%), together accounting for 93.0% of all Judith Basin County residents.
| Ancestry | # Population | % Population |
| American | 297 | 14.6% |
| Armenian | 1 | 0.1% |
| Austrian | 12 | 0.6% |
| Basque | 2 | 0.1% |
| Blackfeet | 1 | 0.1% |
| British | 4 | 0.2% |
| Canadian | 2 | 0.1% |
| Cherokee | 1 | 0.1% |
| Cheyenne | 2 | 0.1% |
| Choctaw | 5 | 0.3% |
| Croatian | 17 | 0.8% |
| Czech | 31 | 1.5% |
| Czechoslovakian | 4 | 0.2% |
| Danish | 24 | 1.2% |
| Dutch | 26 | 1.3% |
| English | 257 | 12.6% |
| European | 32 | 1.6% |
| Finnish | 26 | 1.3% |
| French | 31 | 1.5% |
| French Canadian | 8 | 0.4% |
| German | 732 | 35.9% |
| Irish | 358 | 17.6% |
| Italian | 23 | 1.1% |
| Lithuanian | 2 | 0.1% |
| Mexican | 113 | 5.5% |
| Mexican American Indian | 19 | 0.9% |
| New Zealander | 1 | 0.1% |
| Norwegian | 252 | 12.4% |
| Polish | 68 | 3.3% |
| Portuguese | 6 | 0.3% |
| Russian | 13 | 0.6% |
| Scandinavian | 2 | 0.1% |
| Scotch-Irish | 17 | 0.8% |
| Scottish | 102 | 5.0% |
| Sioux | 1 | 0.1% |
| Slavic | 4 | 0.2% |
| Slovak | 3 | 0.2% |
| Slovene | 2 | 0.1% |
| Swedish | 41 | 2.0% |
| Ukrainian | 13 | 0.6% |
| Welsh | 11 | 0.5% |
| Yugoslavian | 3 | 0.2% | View All 42 Rows |
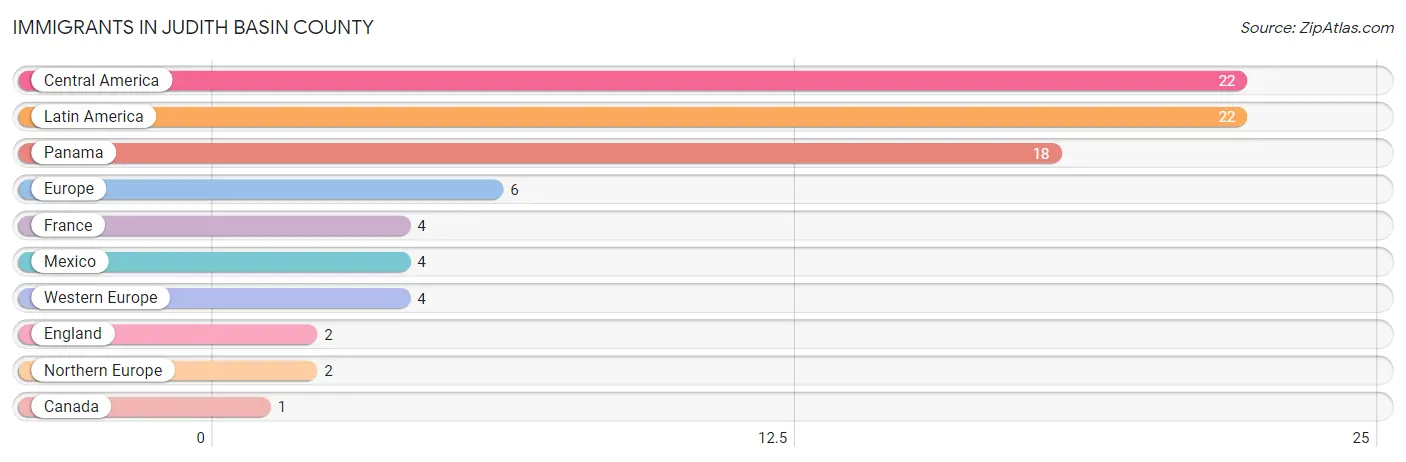
Immigrants in Judith Basin County
The most numerous immigrant groups reported in Judith Basin County came from Central America (22 | 1.1%), Latin America (22 | 1.1%), Panama (18 | 0.9%), Europe (6 | 0.3%), and France (4 | 0.2%), together accounting for 3.5% of all Judith Basin County residents.
| Immigration Origin | # Population | % Population |
| Canada | 1 | 0.1% |
| Central America | 22 | 1.1% |
| England | 2 | 0.1% |
| Europe | 6 | 0.3% |
| France | 4 | 0.2% |
| Latin America | 22 | 1.1% |
| Mexico | 4 | 0.2% |
| Northern Europe | 2 | 0.1% |
| Panama | 18 | 0.9% |
| Western Europe | 4 | 0.2% | View All 10 Rows |
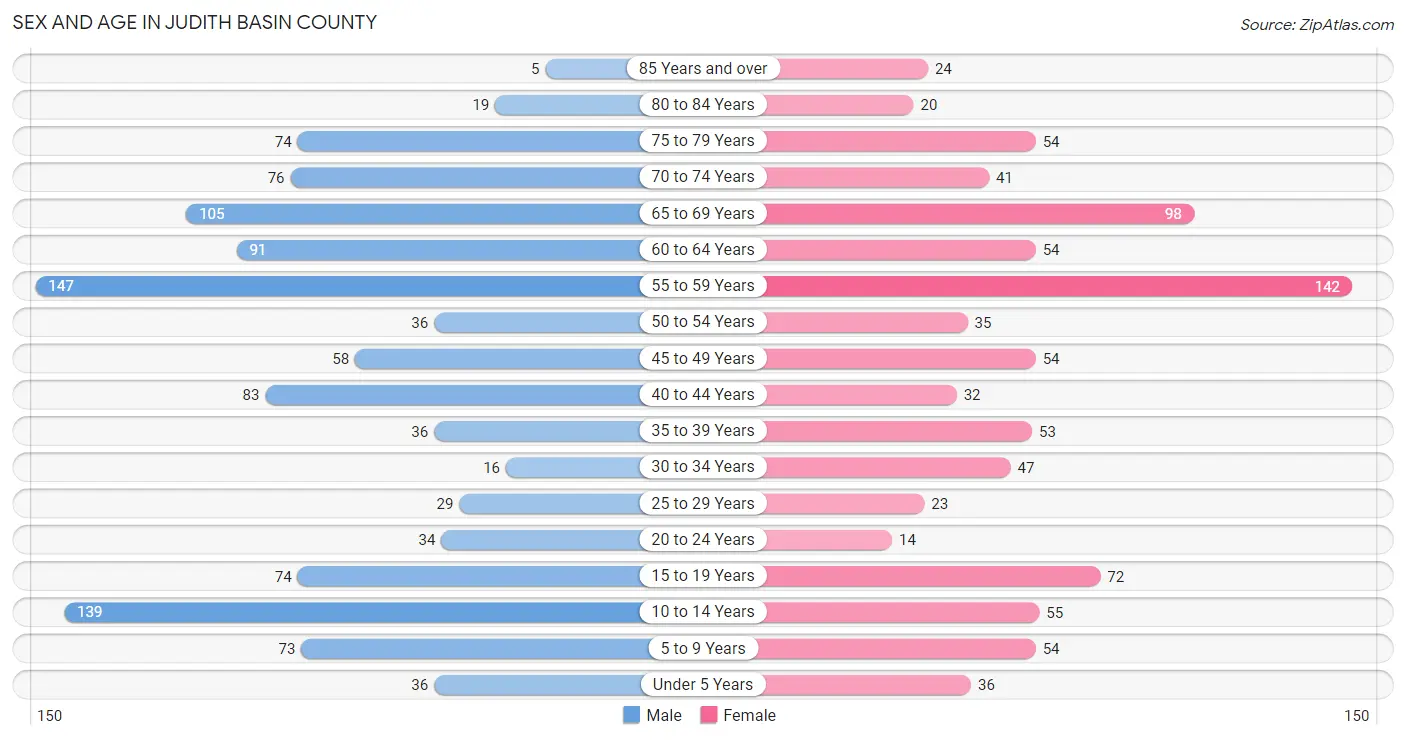
Sex and Age in Judith Basin County
Sex and Age in Judith Basin County
The most populous age groups in Judith Basin County are 55 to 59 Years (147 | 13.0%) for men and 55 to 59 Years (142 | 15.6%) for women.
| Age Bracket | Male | Female |
| Under 5 Years | 36 (3.2%) | 36 (4.0%) |
| 5 to 9 Years | 73 (6.5%) | 54 (5.9%) |
| 10 to 14 Years | 139 (12.3%) | 55 (6.1%) |
| 15 to 19 Years | 74 (6.5%) | 72 (7.9%) |
| 20 to 24 Years | 34 (3.0%) | 14 (1.5%) |
| 25 to 29 Years | 29 (2.6%) | 23 (2.5%) |
| 30 to 34 Years | 16 (1.4%) | 47 (5.2%) |
| 35 to 39 Years | 36 (3.2%) | 53 (5.8%) |
| 40 to 44 Years | 83 (7.3%) | 32 (3.5%) |
| 45 to 49 Years | 58 (5.1%) | 54 (5.9%) |
| 50 to 54 Years | 36 (3.2%) | 35 (3.8%) |
| 55 to 59 Years | 147 (13.0%) | 142 (15.6%) |
| 60 to 64 Years | 91 (8.1%) | 54 (5.9%) |
| 65 to 69 Years | 105 (9.3%) | 98 (10.8%) |
| 70 to 74 Years | 76 (6.7%) | 41 (4.5%) |
| 75 to 79 Years | 74 (6.5%) | 54 (5.9%) |
| 80 to 84 Years | 19 (1.7%) | 20 (2.2%) |
| 85 Years and over | 5 (0.4%) | 24 (2.6%) |
| Total | 1,131 (100.0%) | 908 (100.0%) |
Families and Households in Judith Basin County
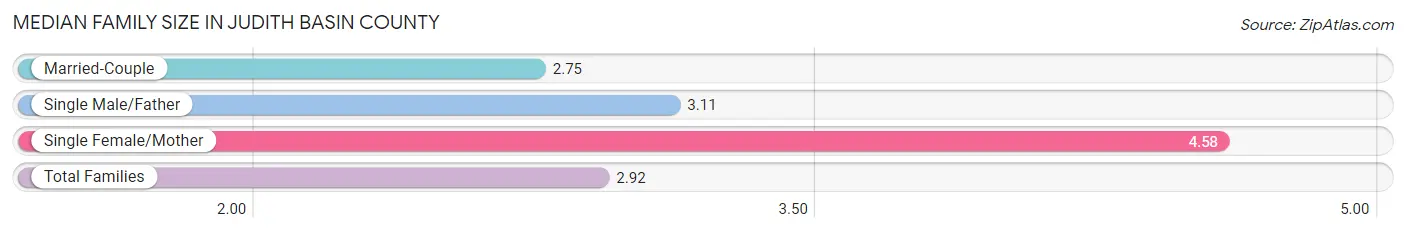
Median Family Size in Judith Basin County
The median family size in Judith Basin County is 2.92 persons per family, with single female/mother families (50 | 8.7%) accounting for the largest median family size of 4.58 persons per family. On the other hand, married-couple families (508 | 88.0%) represent the smallest median family size with 2.75 persons per family.
| Family Type | # Families | Family Size |
| Married-Couple | 508 (88.0%) | 2.75 |
| Single Male/Father | 19 (3.3%) | 3.11 |
| Single Female/Mother | 50 (8.7%) | 4.58 |
| Total Families | 577 (100.0%) | 2.92 |
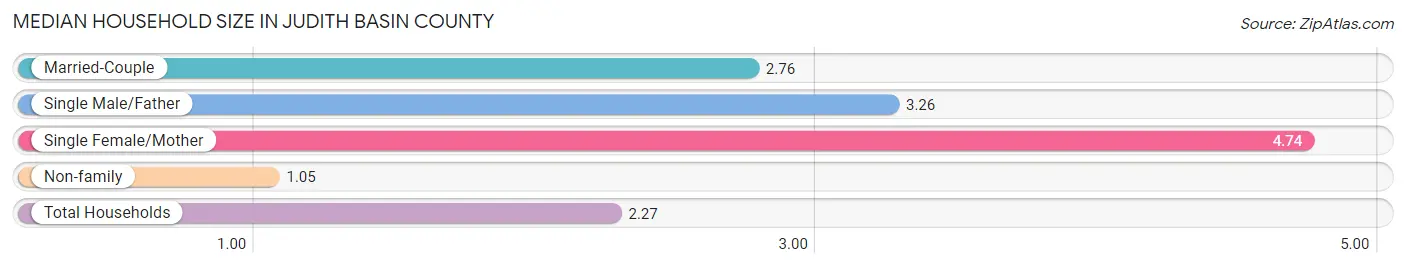
Median Household Size in Judith Basin County
The median household size in Judith Basin County is 2.27 persons per household, with single female/mother households (50 | 5.6%) accounting for the largest median household size of 4.74 persons per household. non-family households (321 | 35.7%) represent the smallest median household size with 1.05 persons per household.
| Household Type | # Households | Household Size |
| Married-Couple | 508 (56.6%) | 2.76 |
| Single Male/Father | 19 (2.1%) | 3.26 |
| Single Female/Mother | 50 (5.6%) | 4.74 |
| Non-family | 321 (35.7%) | 1.05 |
| Total Households | 898 (100.0%) | 2.27 |
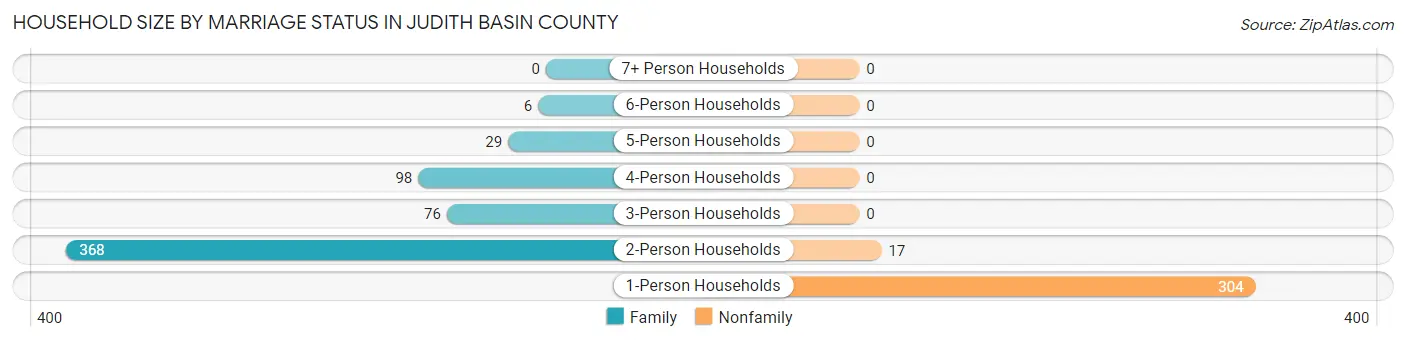
Household Size by Marriage Status in Judith Basin County
Out of a total of 898 households in Judith Basin County, 577 (64.2%) are family households, while 321 (35.7%) are nonfamily households. The most numerous type of family households are 2-person households, comprising 368, and the most common type of nonfamily households are 1-person households, comprising 304.
| Household Size | Family Households | Nonfamily Households |
| 1-Person Households | - | 304 (33.9%) |
| 2-Person Households | 368 (41.0%) | 17 (1.9%) |
| 3-Person Households | 76 (8.5%) | 0 (0.0%) |
| 4-Person Households | 98 (10.9%) | 0 (0.0%) |
| 5-Person Households | 29 (3.2%) | 0 (0.0%) |
| 6-Person Households | 6 (0.7%) | 0 (0.0%) |
| 7+ Person Households | 0 (0.0%) | 0 (0.0%) |
| Total | 577 (64.2%) | 321 (35.7%) |
Female Fertility in Judith Basin County
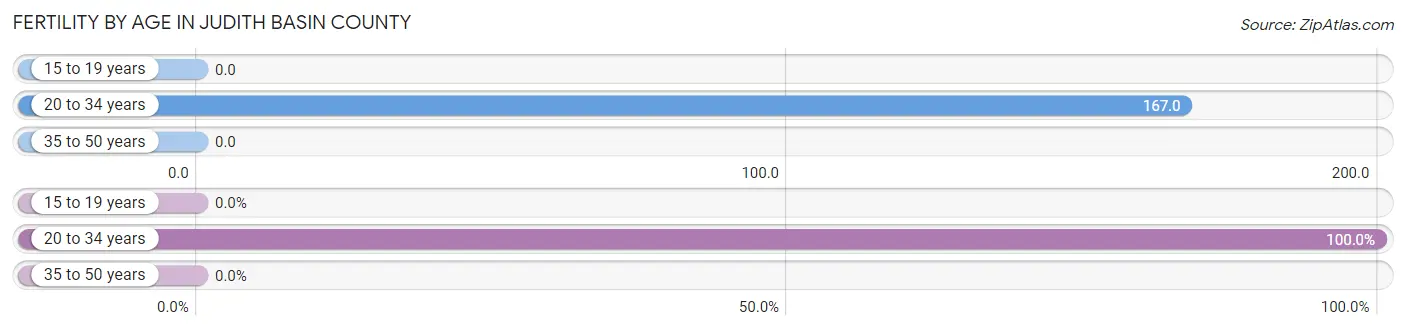
Fertility by Age in Judith Basin County
Average fertility rate in Judith Basin County is 47.0 births per 1,000 women. Women in the age bracket of 20 to 34 years have the highest fertility rate with 167.0 births per 1,000 women. Women in the age bracket of 20 to 34 years acount for 100.0% of all women with births.
| Age Bracket | Women with Births | Births / 1,000 Women |
| 15 to 19 years | 0 (0.0%) | 0.0 |
| 20 to 34 years | 14 (100.0%) | 167.0 |
| 35 to 50 years | 0 (0.0%) | 0.0 |
| Total | 14 (100.0%) | 47.0 |
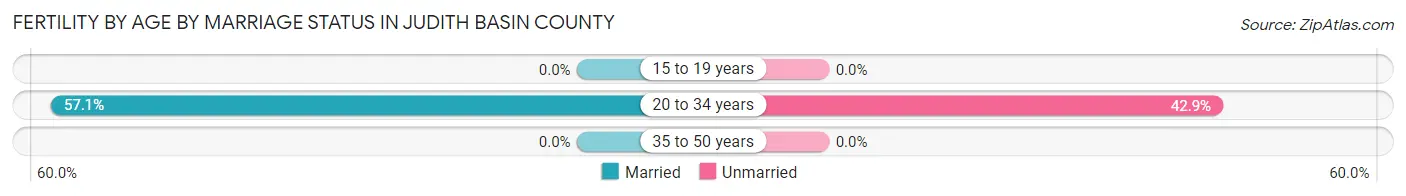
Fertility by Age by Marriage Status in Judith Basin County
57.1% of women with births (14) in Judith Basin County are married. The highest percentage of unmarried women with births falls into 20 to 34 years age bracket with 42.9% of them unmarried at the time of birth, while the lowest percentage of unmarried women with births belong to 20 to 34 years age bracket with 42.9% of them unmarried.
| Age Bracket | Married | Unmarried |
| 15 to 19 years | 0 (0.0%) | 0 (0.0%) |
| 20 to 34 years | 8 (57.1%) | 6 (42.9%) |
| 35 to 50 years | 0 (0.0%) | 0 (0.0%) |
| Total | 8 (57.1%) | 6 (42.9%) |
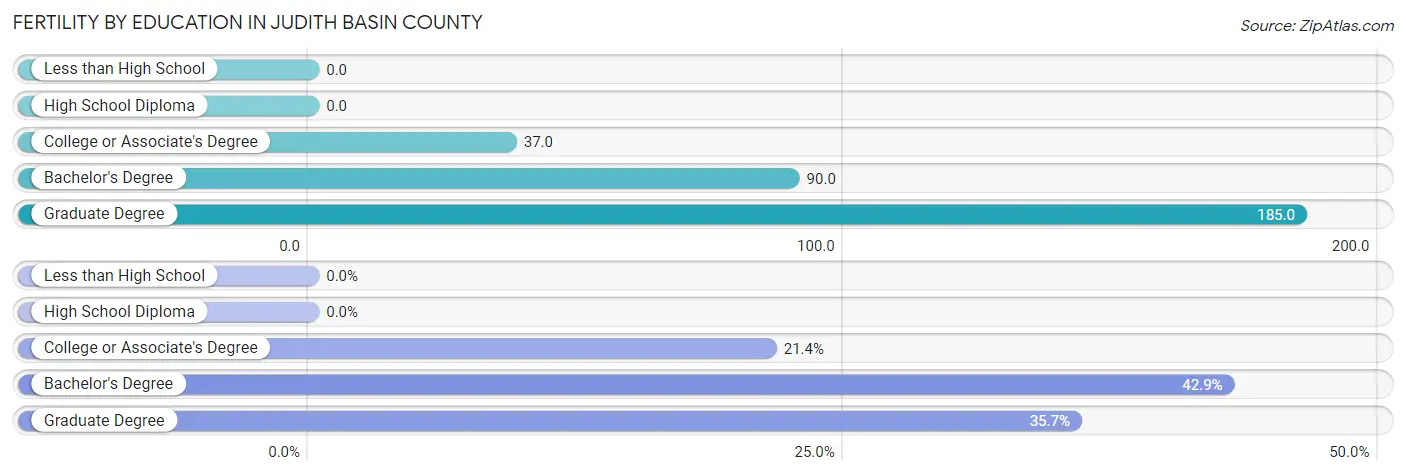
Fertility by Education in Judith Basin County
| Educational Attainment | Women with Births | Births / 1,000 Women |
| Less than High School | 0 (0.0%) | 0.0 |
| High School Diploma | 0 (0.0%) | 0.0 |
| College or Associate's Degree | 3 (21.4%) | 37.0 |
| Bachelor's Degree | 6 (42.9%) | 90.0 |
| Graduate Degree | 5 (35.7%) | 185.0 |
| Total | 14 (100.0%) | 47.0 |
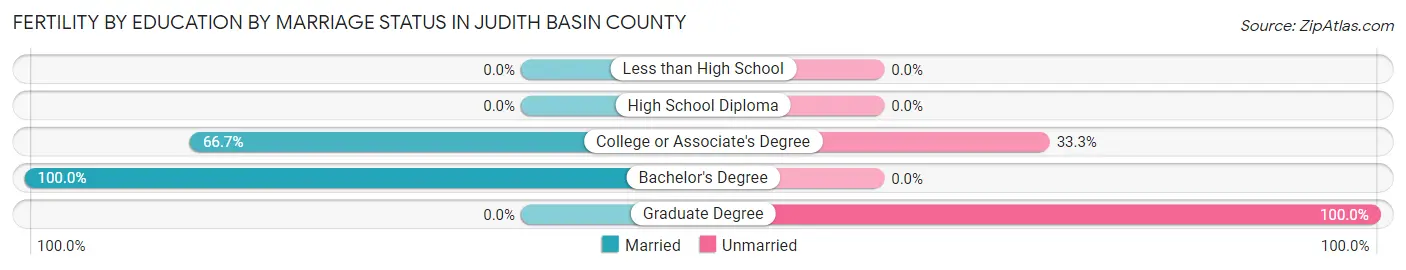
Fertility by Education by Marriage Status in Judith Basin County
42.9% of women with births in Judith Basin County are unmarried. Women with the educational attainment of bachelor's degree are most likely to be married with 100.0% of them married at childbirth, while women with the educational attainment of graduate degree are least likely to be married with 100.0% of them unmarried at childbirth.
| Educational Attainment | Married | Unmarried |
| Less than High School | 0 (0.0%) | 0 (0.0%) |
| High School Diploma | 0 (0.0%) | 0 (0.0%) |
| College or Associate's Degree | 2 (66.7%) | 1 (33.3%) |
| Bachelor's Degree | 6 (100.0%) | 0 (0.0%) |
| Graduate Degree | 0 (0.0%) | 5 (100.0%) |
| Total | 8 (57.1%) | 6 (42.9%) |
Income in Judith Basin County
Income Overview in Judith Basin County
Per Capita Income in Judith Basin County is $36,713, while median incomes of families and households are $76,406 and $58,750 respectively.
| Characteristic | Number | Measure |
| Per Capita Income | 2,039 | $36,713 |
| Median Family Income | 577 | $76,406 |
| Mean Family Income | 577 | $100,593 |
| Median Household Income | 898 | $58,750 |
| Mean Household Income | 898 | $83,987 |
| Income Deficit | 577 | $0 |
| Wage / Income Gap (%) | 2,039 | 22.62% |
| Wage / Income Gap ($) | 2,039 | 77.38¢ per $1 |
| Gini / Inequality Index | 2,039 | 0.50 |
Earnings by Sex in Judith Basin County
Average Earnings in Judith Basin County are $33,114, $36,726 for men and $28,417 for women, a difference of 22.6%.
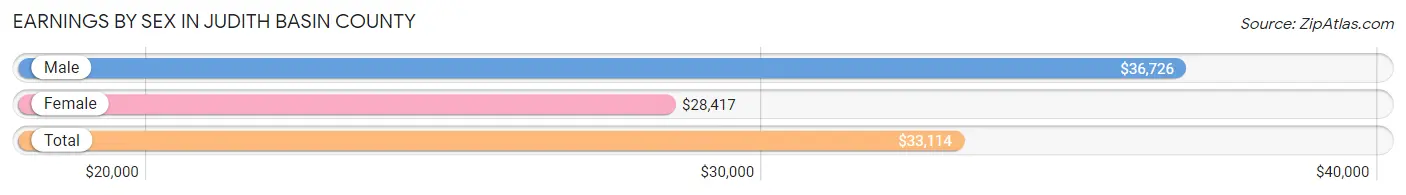
| Sex | Number | Average Earnings |
| Male | 651 (56.9%) | $36,726 |
| Female | 493 (43.1%) | $28,417 |
| Total | 1,144 (100.0%) | $33,114 |
Earnings by Sex by Income Bracket in Judith Basin County
The most common earnings brackets in Judith Basin County are $100,000+ for men (104 | 16.0%) and $30,000 to $34,999 for women (88 | 17.8%).
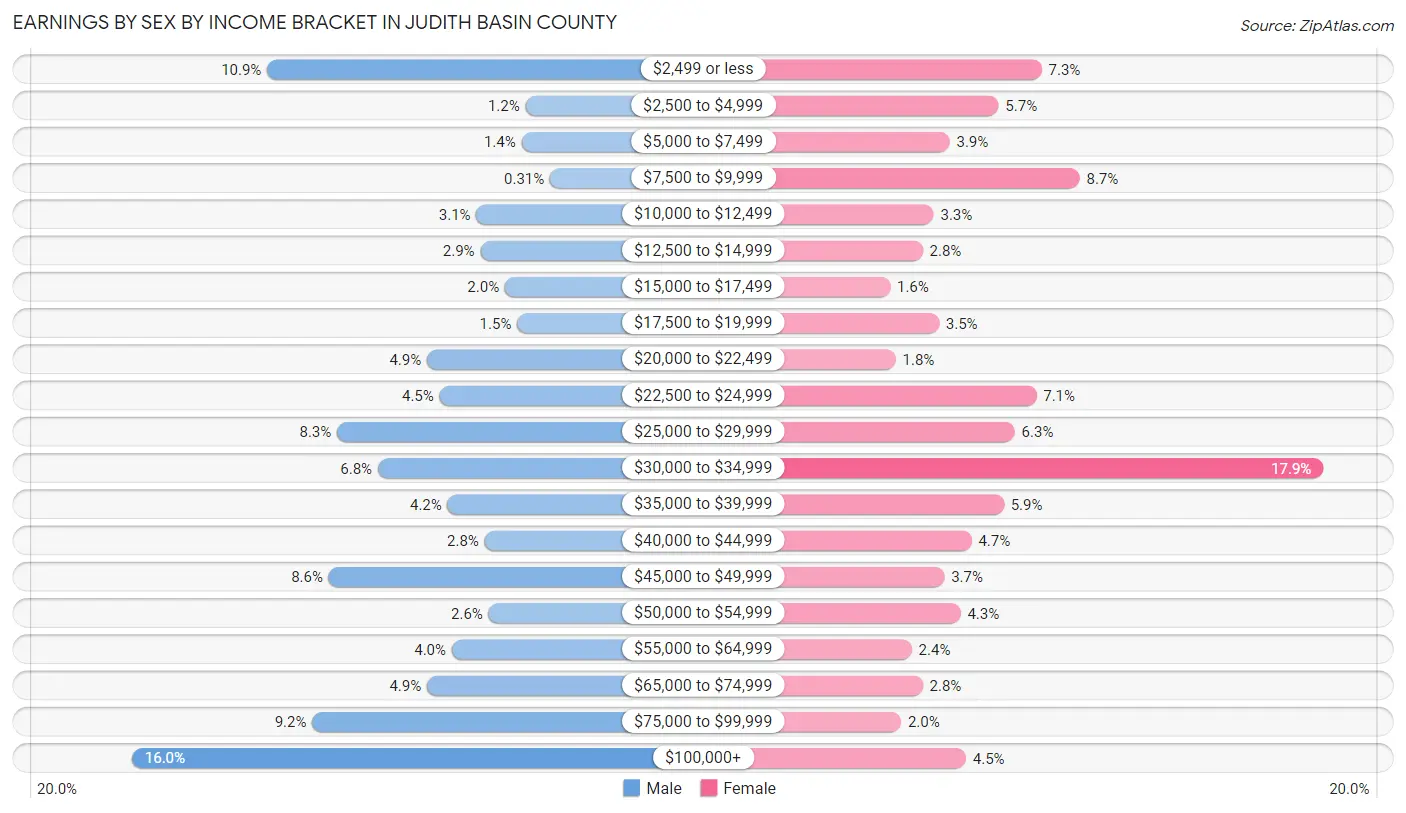
| Income | Male | Female |
| $2,499 or less | 71 (10.9%) | 36 (7.3%) |
| $2,500 to $4,999 | 8 (1.2%) | 28 (5.7%) |
| $5,000 to $7,499 | 9 (1.4%) | 19 (3.8%) |
| $7,500 to $9,999 | 2 (0.3%) | 43 (8.7%) |
| $10,000 to $12,499 | 20 (3.1%) | 16 (3.3%) |
| $12,500 to $14,999 | 19 (2.9%) | 14 (2.8%) |
| $15,000 to $17,499 | 13 (2.0%) | 8 (1.6%) |
| $17,500 to $19,999 | 10 (1.5%) | 17 (3.5%) |
| $20,000 to $22,499 | 32 (4.9%) | 9 (1.8%) |
| $22,500 to $24,999 | 29 (4.4%) | 35 (7.1%) |
| $25,000 to $29,999 | 54 (8.3%) | 31 (6.3%) |
| $30,000 to $34,999 | 44 (6.8%) | 88 (17.8%) |
| $35,000 to $39,999 | 27 (4.2%) | 29 (5.9%) |
| $40,000 to $44,999 | 18 (2.8%) | 23 (4.7%) |
| $45,000 to $49,999 | 56 (8.6%) | 18 (3.6%) |
| $50,000 to $54,999 | 17 (2.6%) | 21 (4.3%) |
| $55,000 to $64,999 | 26 (4.0%) | 12 (2.4%) |
| $65,000 to $74,999 | 32 (4.9%) | 14 (2.8%) |
| $75,000 to $99,999 | 60 (9.2%) | 10 (2.0%) |
| $100,000+ | 104 (16.0%) | 22 (4.5%) |
| Total | 651 (100.0%) | 493 (100.0%) |
Earnings by Sex by Educational Attainment in Judith Basin County
Average earnings in Judith Basin County are $44,583 for men and $32,844 for women, a difference of 26.3%. Men with an educational attainment of college or associate's degree enjoy the highest average annual earnings of $54,107, while those with high school diploma education earn the least with $30,568. Women with an educational attainment of college or associate's degree earn the most with the average annual earnings of $33,295, while those with high school diploma education have the smallest earnings of $23,958.
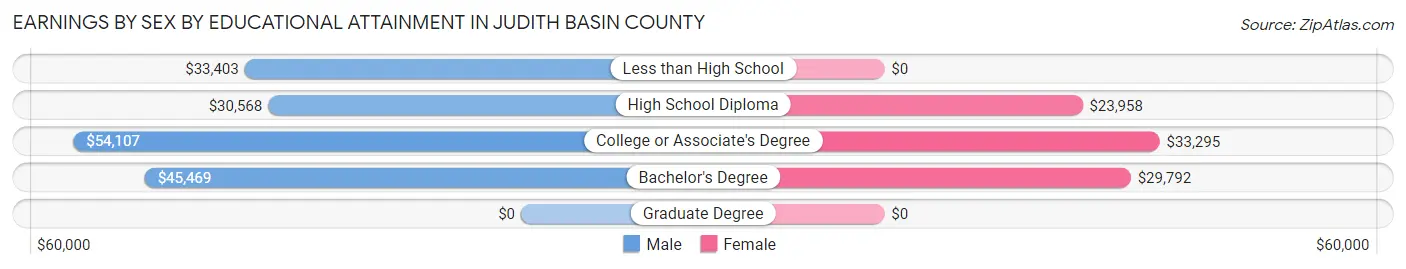
| Educational Attainment | Male Income | Female Income |
| Less than High School | $33,403 | $0 |
| High School Diploma | $30,568 | $23,958 |
| College or Associate's Degree | $54,107 | $33,295 |
| Bachelor's Degree | $45,469 | $29,792 |
| Graduate Degree | - | - |
| Total | $44,583 | $32,844 |
Family Income in Judith Basin County
Family Income Brackets in Judith Basin County
According to the Judith Basin County family income data, there are 112 families falling into the $50,000 to $74,999 income range, which is the most common income bracket and makes up 19.4% of all families. Conversely, the $10,000 to $14,999 income bracket is the least frequent group with only 10 families (1.7%) belonging to this category.
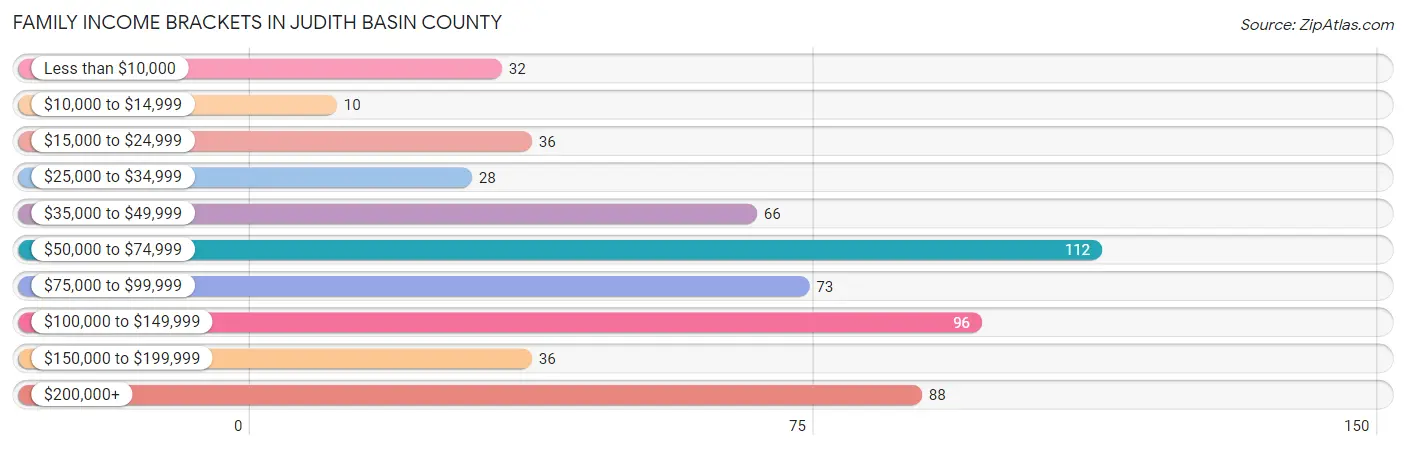
| Income Bracket | # Families | % Families |
| Less than $10,000 | 32 | 5.5% |
| $10,000 to $14,999 | 10 | 1.7% |
| $15,000 to $24,999 | 36 | 6.2% |
| $25,000 to $34,999 | 28 | 4.9% |
| $35,000 to $49,999 | 66 | 11.4% |
| $50,000 to $74,999 | 112 | 19.4% |
| $75,000 to $99,999 | 73 | 12.7% |
| $100,000 to $149,999 | 96 | 16.6% |
| $150,000 to $199,999 | 36 | 6.2% |
| $200,000+ | 88 | 15.3% |
Family Income by Famaliy Size in Judith Basin County
6-person families (6 | 1.0%) account for the highest median family income in Judith Basin County with $133,750 per family, while 2-person families (385 | 66.7%) have the highest median income of $36,762 per family member.
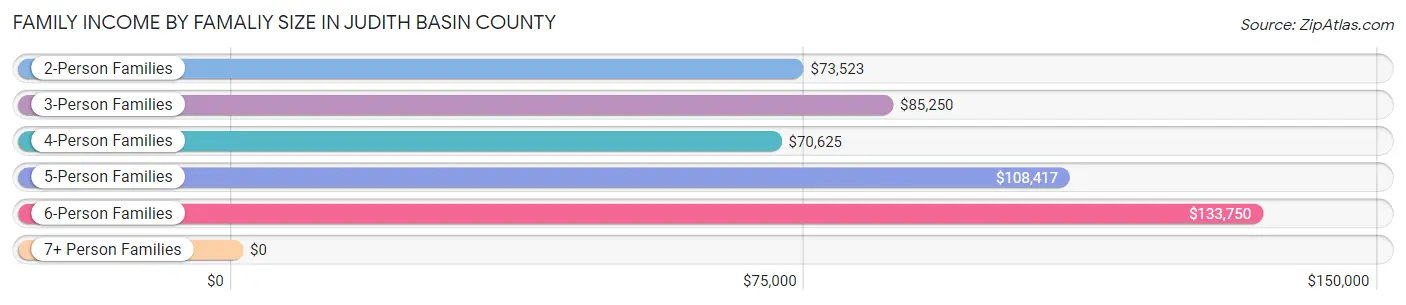
| Income Bracket | # Families | Median Income |
| 2-Person Families | 385 (66.7%) | $73,523 |
| 3-Person Families | 63 (10.9%) | $85,250 |
| 4-Person Families | 94 (16.3%) | $70,625 |
| 5-Person Families | 29 (5.0%) | $108,417 |
| 6-Person Families | 6 (1.0%) | $133,750 |
| 7+ Person Families | 0 (0.0%) | $0 |
| Total | 577 (100.0%) | $76,406 |
Family Income by Number of Earners in Judith Basin County
The median family income in Judith Basin County is $76,406, with families comprising 3+ earners (45) having the highest median family income of $105,417, while families with no earners (98) have the lowest median family income of $48,750, accounting for 7.8% and 17.0% of families, respectively.
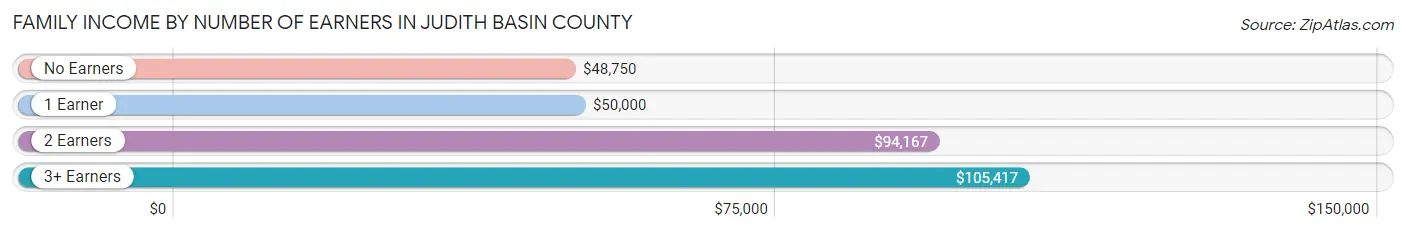
| Number of Earners | # Families | Median Income |
| No Earners | 98 (17.0%) | $48,750 |
| 1 Earner | 134 (23.2%) | $50,000 |
| 2 Earners | 300 (52.0%) | $94,167 |
| 3+ Earners | 45 (7.8%) | $105,417 |
| Total | 577 (100.0%) | $76,406 |
Household Income in Judith Basin County
Household Income Brackets in Judith Basin County
With 152 households falling in the category, the $50,000 to $74,999 income range is the most frequent in Judith Basin County, accounting for 16.9% of all households. In contrast, only 37 households (4.1%) fall into the $150,000 to $199,999 income bracket, making it the least populous group.
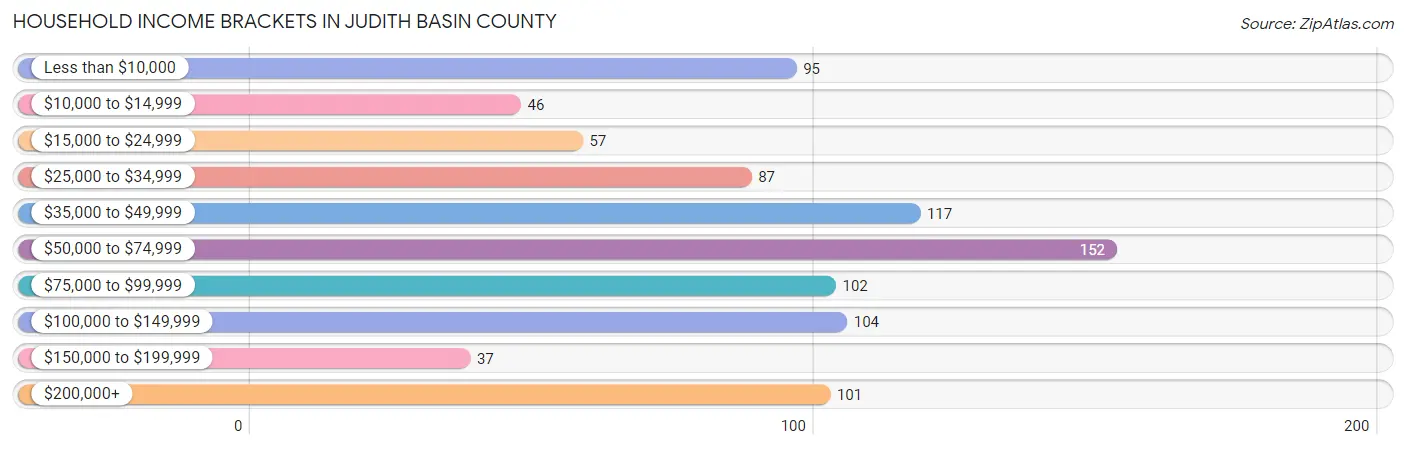
| Income Bracket | # Households | % Households |
| Less than $10,000 | 95 | 10.6% |
| $10,000 to $14,999 | 46 | 5.1% |
| $15,000 to $24,999 | 57 | 6.3% |
| $25,000 to $34,999 | 87 | 9.7% |
| $35,000 to $49,999 | 117 | 13.0% |
| $50,000 to $74,999 | 152 | 16.9% |
| $75,000 to $99,999 | 102 | 11.4% |
| $100,000 to $149,999 | 104 | 11.6% |
| $150,000 to $199,999 | 37 | 4.1% |
| $200,000+ | 101 | 11.2% |
Household Income by Householder Age in Judith Basin County
The median household income in Judith Basin County is $58,750, with the highest median household income of $74,107 found in the 45 to 64 years age bracket for the primary householder. A total of 379 households (42.2%) fall into this category. Meanwhile, the 65+ years age bracket for the primary householder has the lowest median household income of $46,250, with 335 households (37.3%) in this group.
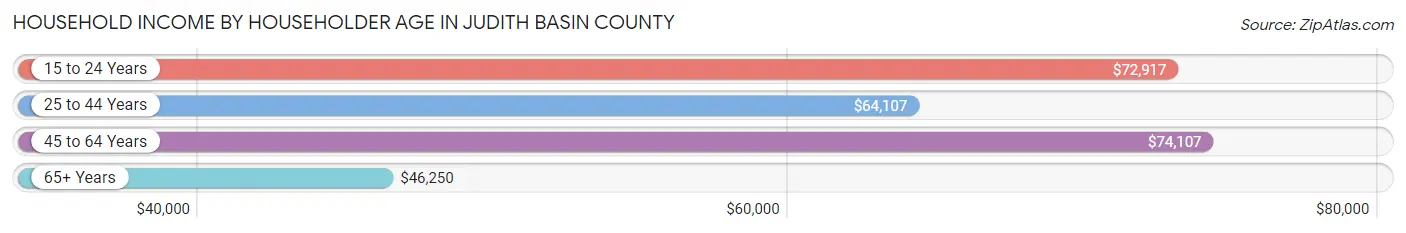
| Income Bracket | # Households | Median Income |
| 15 to 24 Years | 9 (1.0%) | $72,917 |
| 25 to 44 Years | 175 (19.5%) | $64,107 |
| 45 to 64 Years | 379 (42.2%) | $74,107 |
| 65+ Years | 335 (37.3%) | $46,250 |
| Total | 898 (100.0%) | $58,750 |
Poverty in Judith Basin County
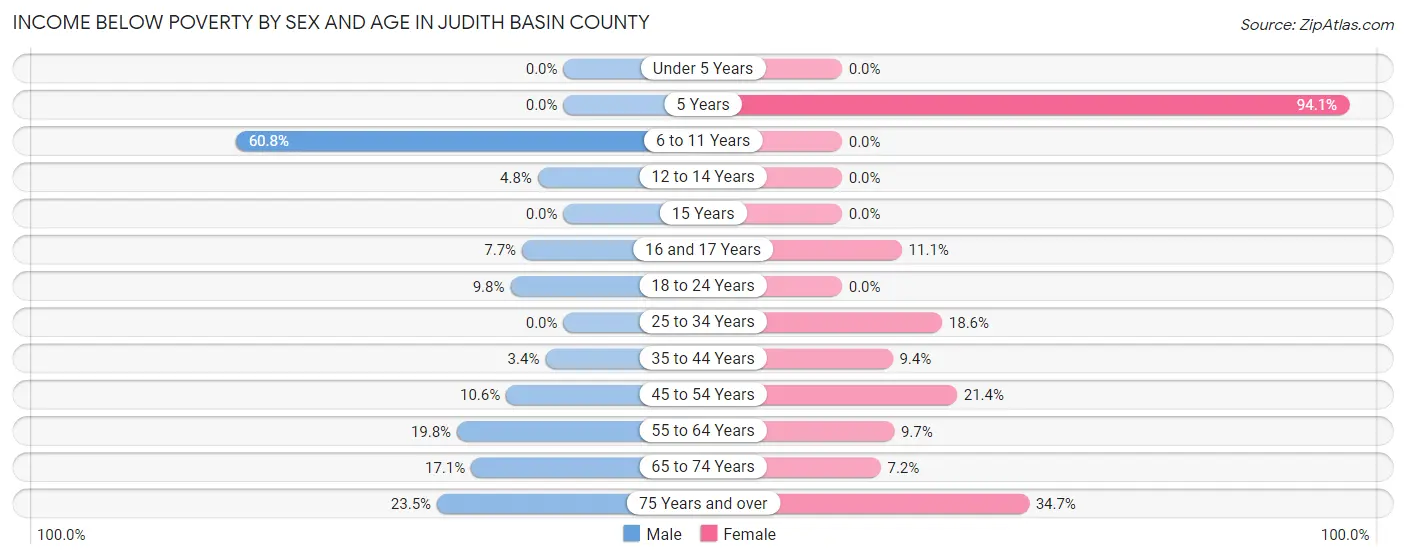
Income Below Poverty by Sex and Age in Judith Basin County
With 19.2% poverty level for males and 15.4% for females among the residents of Judith Basin County, 6 to 11 year old males and 5 year old females are the most vulnerable to poverty, with 90 males (60.8%) and 32 females (94.1%) in their respective age groups living below the poverty level.
| Age Bracket | Male | Female |
| Under 5 Years | 0 (0.0%) | 0 (0.0%) |
| 5 Years | 0 (0.0%) | 32 (94.1%) |
| 6 to 11 Years | 90 (60.8%) | 0 (0.0%) |
| 12 to 14 Years | 3 (4.8%) | 0 (0.0%) |
| 15 Years | 0 (0.0%) | 0 (0.0%) |
| 16 and 17 Years | 3 (7.7%) | 5 (11.1%) |
| 18 to 24 Years | 6 (9.8%) | 0 (0.0%) |
| 25 to 34 Years | 0 (0.0%) | 13 (18.6%) |
| 35 to 44 Years | 4 (3.4%) | 8 (9.4%) |
| 45 to 54 Years | 10 (10.6%) | 19 (21.3%) |
| 55 to 64 Years | 47 (19.8%) | 19 (9.7%) |
| 65 to 74 Years | 31 (17.1%) | 10 (7.2%) |
| 75 Years and over | 23 (23.5%) | 34 (34.7%) |
| Total | 217 (19.2%) | 140 (15.4%) |
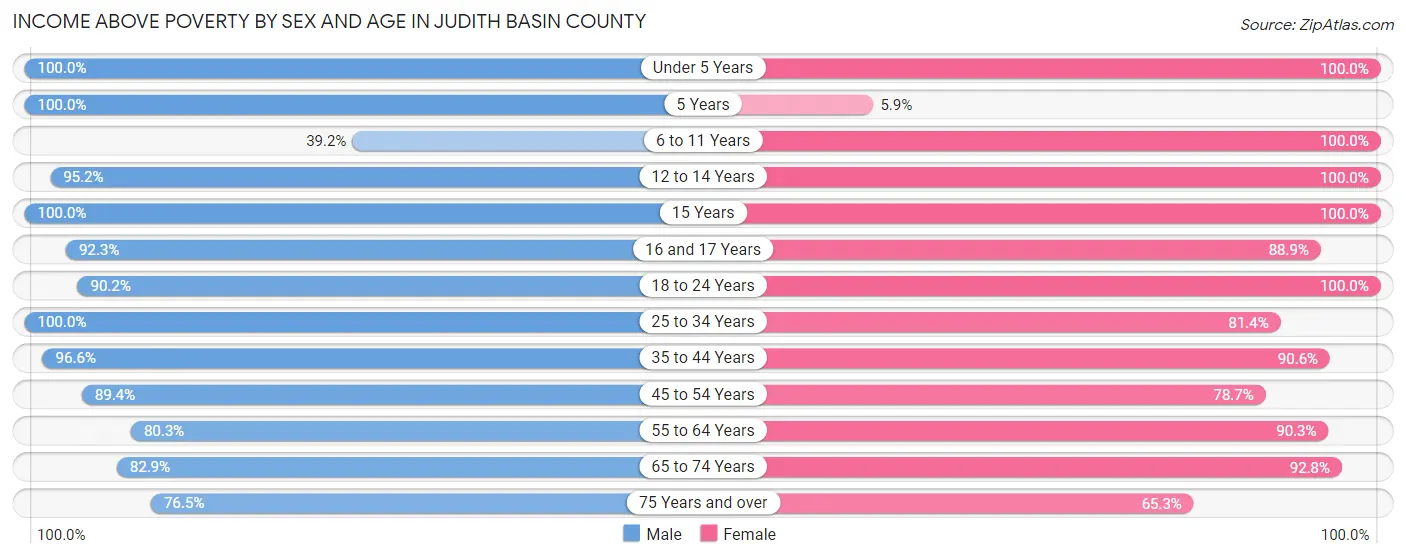
Income Above Poverty by Sex and Age in Judith Basin County
According to the poverty statistics in Judith Basin County, males aged under 5 years and females aged under 5 years are the age groups that are most secure financially, with 100.0% of males and 100.0% of females in these age groups living above the poverty line.
| Age Bracket | Male | Female |
| Under 5 Years | 36 (100.0%) | 36 (100.0%) |
| 5 Years | 1 (100.0%) | 2 (5.9%) |
| 6 to 11 Years | 58 (39.2%) | 36 (100.0%) |
| 12 to 14 Years | 60 (95.2%) | 39 (100.0%) |
| 15 Years | 8 (100.0%) | 9 (100.0%) |
| 16 and 17 Years | 36 (92.3%) | 40 (88.9%) |
| 18 to 24 Years | 55 (90.2%) | 32 (100.0%) |
| 25 to 34 Years | 45 (100.0%) | 57 (81.4%) |
| 35 to 44 Years | 115 (96.6%) | 77 (90.6%) |
| 45 to 54 Years | 84 (89.4%) | 70 (78.6%) |
| 55 to 64 Years | 191 (80.2%) | 177 (90.3%) |
| 65 to 74 Years | 150 (82.9%) | 129 (92.8%) |
| 75 Years and over | 75 (76.5%) | 64 (65.3%) |
| Total | 914 (80.8%) | 768 (84.6%) |
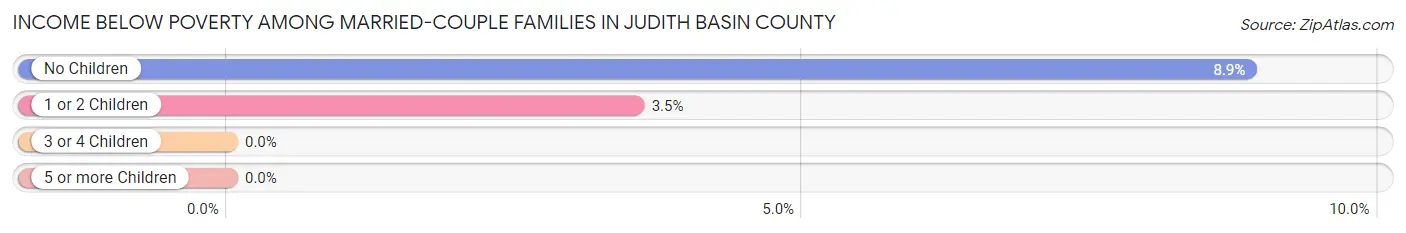
Income Below Poverty Among Married-Couple Families in Judith Basin County
The poverty statistics for married-couple families in Judith Basin County show that 7.3% or 37 of the total 508 families live below the poverty line. Families with no children have the highest poverty rate of 8.9%, comprising of 33 families. On the other hand, families with 3 or 4 children have the lowest poverty rate of 0.0%, which includes 0 families.
| Children | Above Poverty | Below Poverty |
| No Children | 339 (91.1%) | 33 (8.9%) |
| 1 or 2 Children | 109 (96.5%) | 4 (3.5%) |
| 3 or 4 Children | 23 (100.0%) | 0 (0.0%) |
| 5 or more Children | 0 (0.0%) | 0 (0.0%) |
| Total | 471 (92.7%) | 37 (7.3%) |
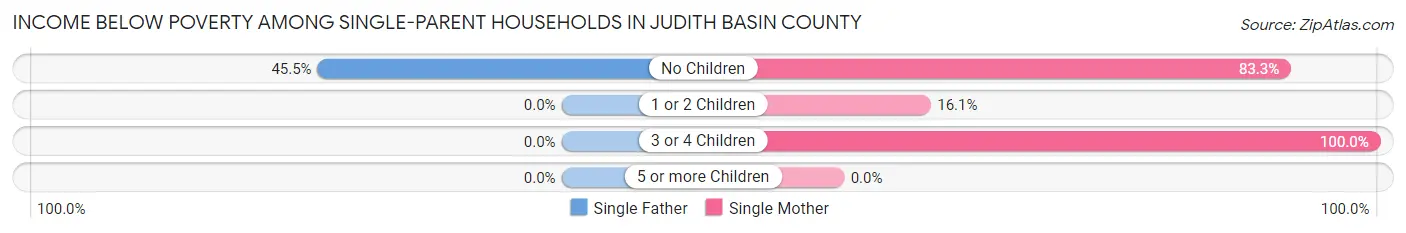
Income Below Poverty Among Single-Parent Households in Judith Basin County
According to the poverty data in Judith Basin County, 26.3% or 5 single-father households and 46.0% or 23 single-mother households are living below the poverty line. Among single-father households, those with no children have the highest poverty rate, with 5 households (45.5%) experiencing poverty. Likewise, among single-mother households, those with 3 or 4 children have the highest poverty rate, with 13 households (100.0%) falling below the poverty line.
| Children | Single Father | Single Mother |
| No Children | 5 (45.5%) | 5 (83.3%) |
| 1 or 2 Children | 0 (0.0%) | 5 (16.1%) |
| 3 or 4 Children | 0 (0.0%) | 13 (100.0%) |
| 5 or more Children | 0 (0.0%) | 0 (0.0%) |
| Total | 5 (26.3%) | 23 (46.0%) |
Income Below Poverty Among Married-Couple vs Single-Parent Households in Judith Basin County
The poverty data for Judith Basin County shows that 37 of the married-couple family households (7.3%) and 28 of the single-parent households (40.6%) are living below the poverty level. Within the married-couple family households, those with no children have the highest poverty rate, with 33 households (8.9%) falling below the poverty line. Among the single-parent households, those with 3 or 4 children have the highest poverty rate, with 13 household (100.0%) living below poverty.
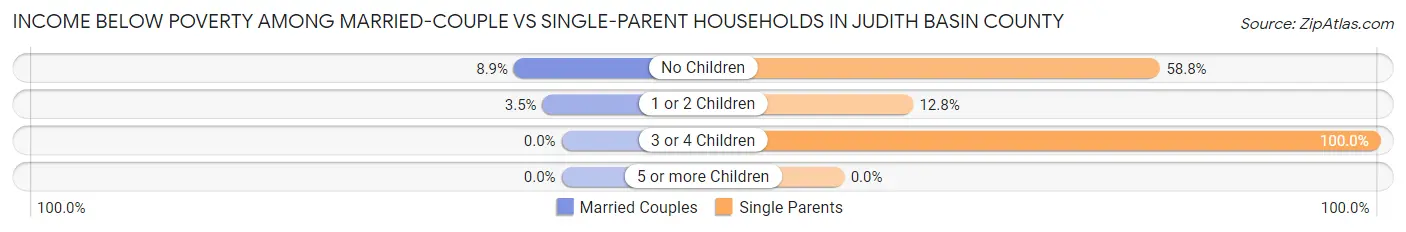
| Children | Married-Couple Families | Single-Parent Households |
| No Children | 33 (8.9%) | 10 (58.8%) |
| 1 or 2 Children | 4 (3.5%) | 5 (12.8%) |
| 3 or 4 Children | 0 (0.0%) | 13 (100.0%) |
| 5 or more Children | 0 (0.0%) | 0 (0.0%) |
| Total | 37 (7.3%) | 28 (40.6%) |
Employment Characteristics in Judith Basin County
Employment by Class of Employer in Judith Basin County
Among the 971 employed individuals in Judith Basin County, private company employees (432 | 44.5%), self-employed (not incorporated) (270 | 27.8%), and local government employees (109 | 11.2%) make up the most common classes of employment.
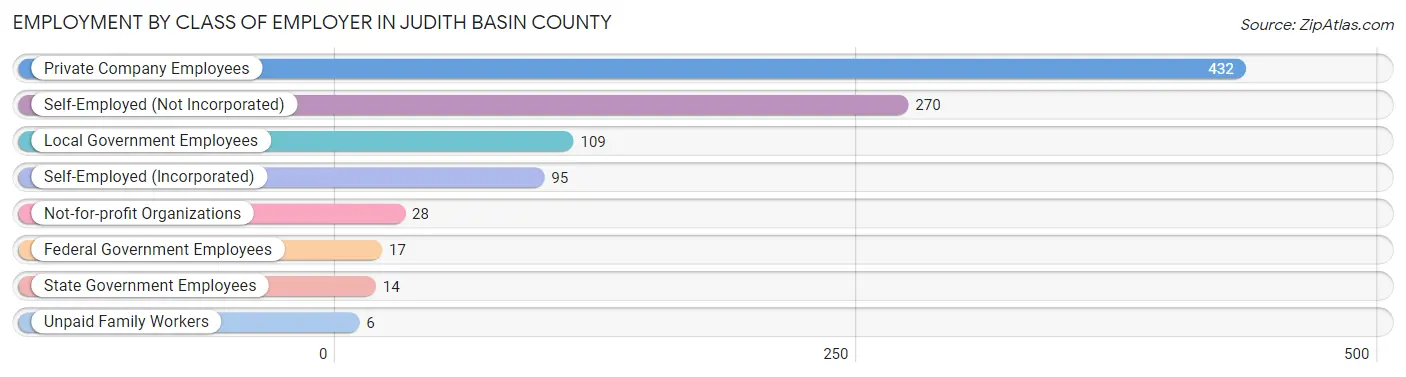
| Employer Class | # Employees | % Employees |
| Private Company Employees | 432 | 44.5% |
| Self-Employed (Incorporated) | 95 | 9.8% |
| Self-Employed (Not Incorporated) | 270 | 27.8% |
| Not-for-profit Organizations | 28 | 2.9% |
| Local Government Employees | 109 | 11.2% |
| State Government Employees | 14 | 1.4% |
| Federal Government Employees | 17 | 1.8% |
| Unpaid Family Workers | 6 | 0.6% |
| Total | 971 | 100.0% |
Employment Status by Age in Judith Basin County
According to the labor force statistics for Judith Basin County, out of the total population over 16 years of age (1,629), 62.6% or 1,020 individuals are in the labor force, with 2.4% or 24 of them unemployed. The age group with the highest labor force participation rate is 25 to 29 years, with 92.3% or 48 individuals in the labor force. Within the labor force, the 45 to 54 years age range has the highest percentage of unemployed individuals, with 5.3% or 9 of them being unemployed.
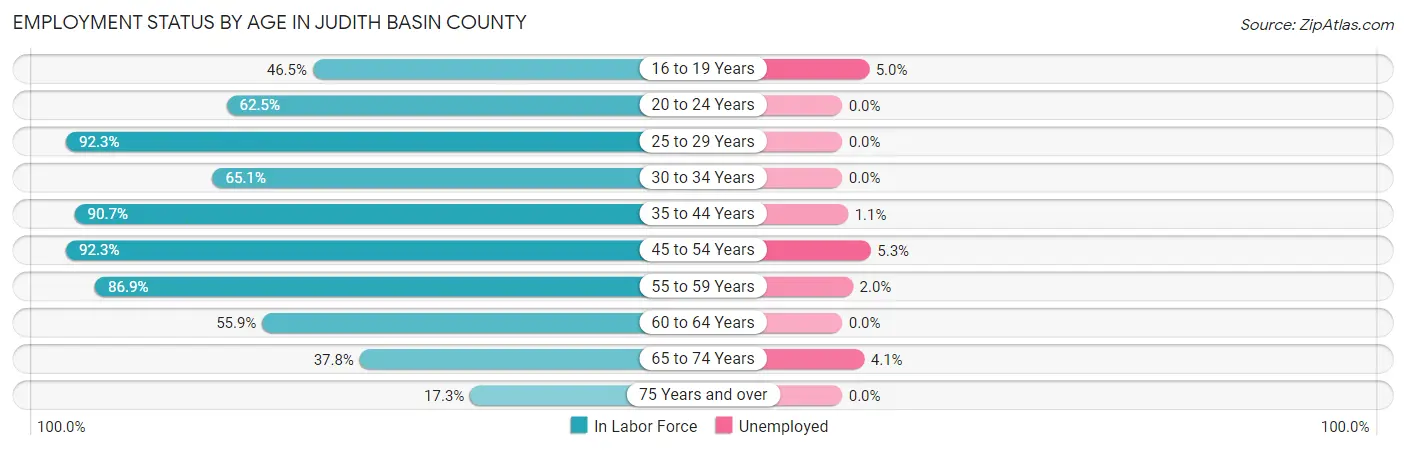
| Age Bracket | In Labor Force | Unemployed |
| 16 to 19 Years | 60 (46.5%) | 3 (5.0%) |
| 20 to 24 Years | 30 (62.5%) | 0 (0.0%) |
| 25 to 29 Years | 48 (92.3%) | 0 (0.0%) |
| 30 to 34 Years | 41 (65.1%) | 0 (0.0%) |
| 35 to 44 Years | 185 (90.7%) | 2 (1.1%) |
| 45 to 54 Years | 169 (92.3%) | 9 (5.3%) |
| 55 to 59 Years | 251 (86.9%) | 5 (2.0%) |
| 60 to 64 Years | 81 (55.9%) | 0 (0.0%) |
| 65 to 74 Years | 121 (37.8%) | 5 (4.1%) |
| 75 Years and over | 34 (17.3%) | 0 (0.0%) |
| Total | 1,020 (62.6%) | 24 (2.4%) |
Employment Status by Educational Attainment in Judith Basin County
According to labor force statistics for Judith Basin County, 82.8% of individuals (775) out of the total population between 25 and 64 years of age (936) are in the labor force, with 2.1% or 16 of them being unemployed. The group with the highest labor force participation rate are those with the educational attainment of bachelor's degree or higher, with 89.7% or 234 individuals in the labor force. Within the labor force, individuals with less than high school education have the highest percentage of unemployment, with 6.8% or 3 of them being unemployed.
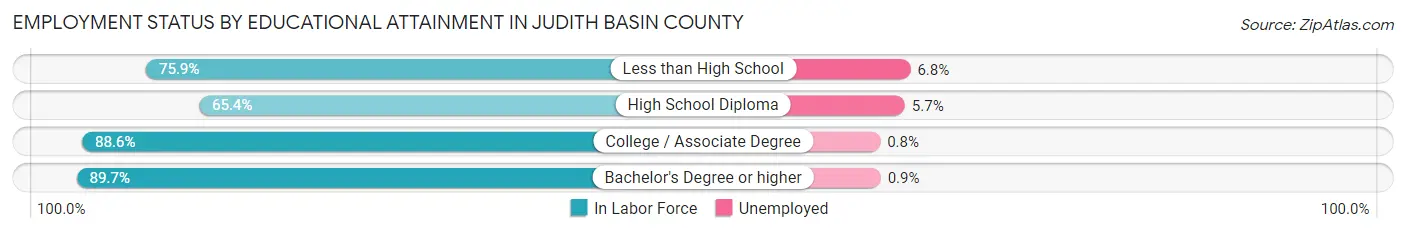
| Educational Attainment | In Labor Force | Unemployed |
| Less than High School | 44 (75.9%) | 4 (6.8%) |
| High School Diploma | 140 (65.4%) | 12 (5.7%) |
| College / Associate Degree | 357 (88.6%) | 3 (0.8%) |
| Bachelor's Degree or higher | 234 (89.7%) | 2 (0.9%) |
| Total | 775 (82.8%) | 20 (2.1%) |
Employment Occupations by Sex in Judith Basin County
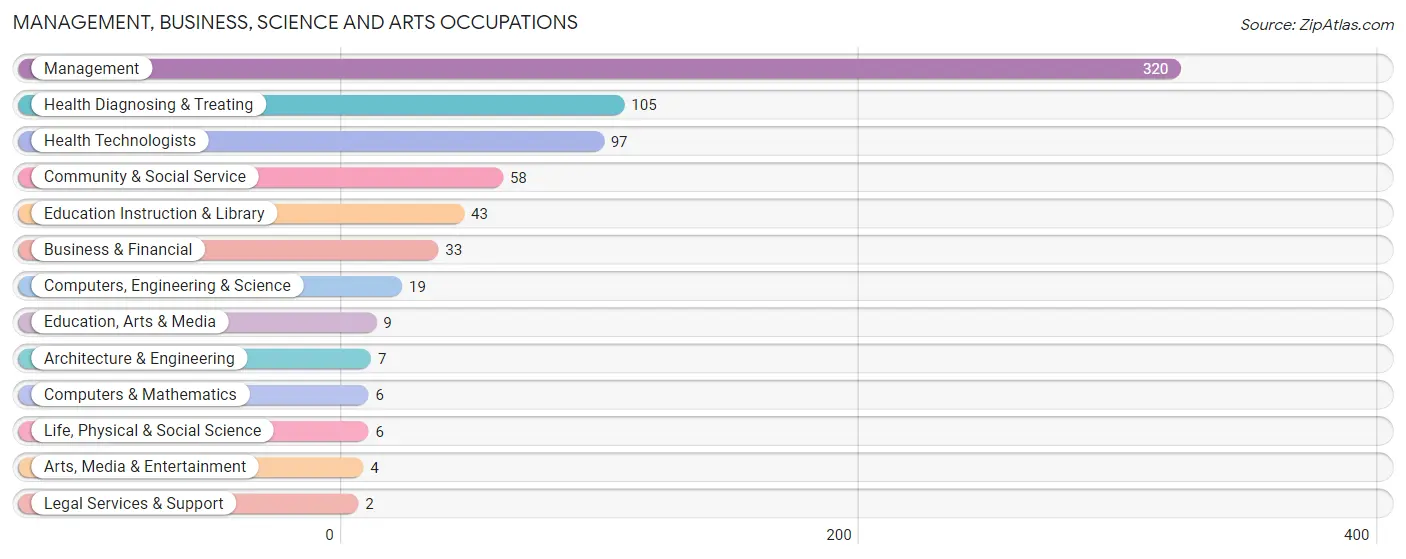
Management, Business, Science and Arts Occupations
The most common Management, Business, Science and Arts occupations in Judith Basin County are Management (320 | 32.1%), Health Diagnosing & Treating (105 | 10.5%), Health Technologists (97 | 9.7%), Community & Social Service (58 | 5.8%), and Education Instruction & Library (43 | 4.3%).
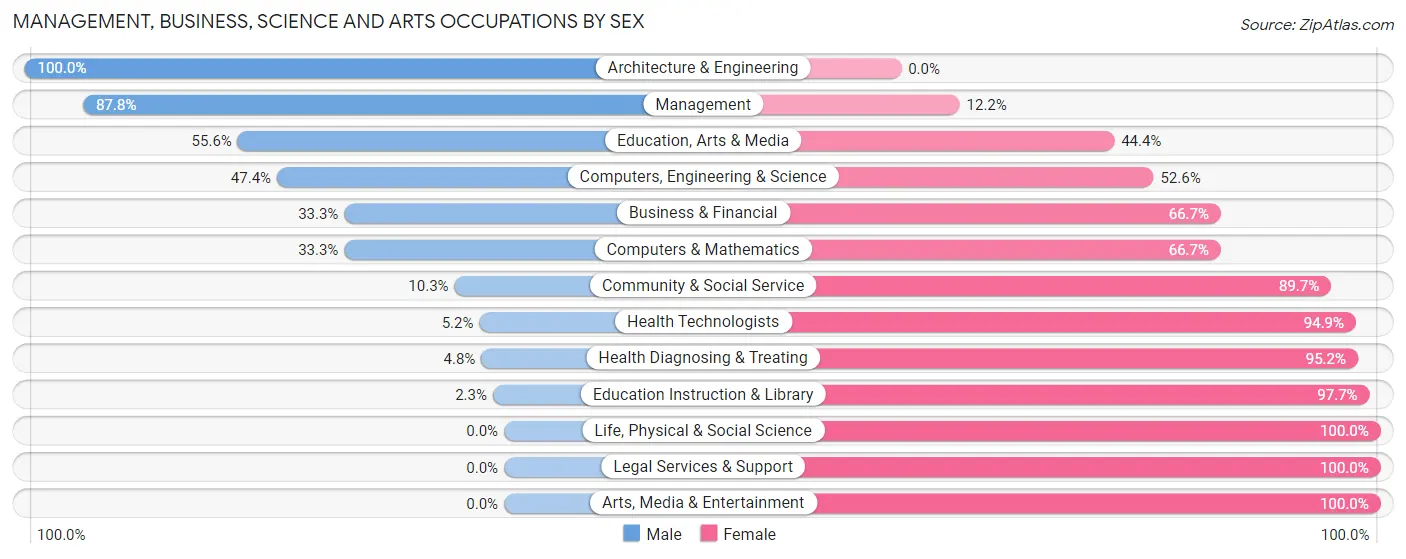
Management, Business, Science and Arts Occupations by Sex
Within the Management, Business, Science and Arts occupations in Judith Basin County, the most male-oriented occupations are Architecture & Engineering (100.0%), Management (87.8%), and Education, Arts & Media (55.6%), while the most female-oriented occupations are Life, Physical & Social Science (100.0%), Legal Services & Support (100.0%), and Arts, Media & Entertainment (100.0%).
| Occupation | Male | Female |
| Management | 281 (87.8%) | 39 (12.2%) |
| Business & Financial | 11 (33.3%) | 22 (66.7%) |
| Computers, Engineering & Science | 9 (47.4%) | 10 (52.6%) |
| Computers & Mathematics | 2 (33.3%) | 4 (66.7%) |
| Architecture & Engineering | 7 (100.0%) | 0 (0.0%) |
| Life, Physical & Social Science | 0 (0.0%) | 6 (100.0%) |
| Community & Social Service | 6 (10.3%) | 52 (89.7%) |
| Education, Arts & Media | 5 (55.6%) | 4 (44.4%) |
| Legal Services & Support | 0 (0.0%) | 2 (100.0%) |
| Education Instruction & Library | 1 (2.3%) | 42 (97.7%) |
| Arts, Media & Entertainment | 0 (0.0%) | 4 (100.0%) |
| Health Diagnosing & Treating | 5 (4.8%) | 100 (95.2%) |
| Health Technologists | 5 (5.1%) | 92 (94.9%) |
| Total (Category) | 312 (58.3%) | 223 (41.7%) |
| Total (Overall) | 550 (55.2%) | 446 (44.8%) |
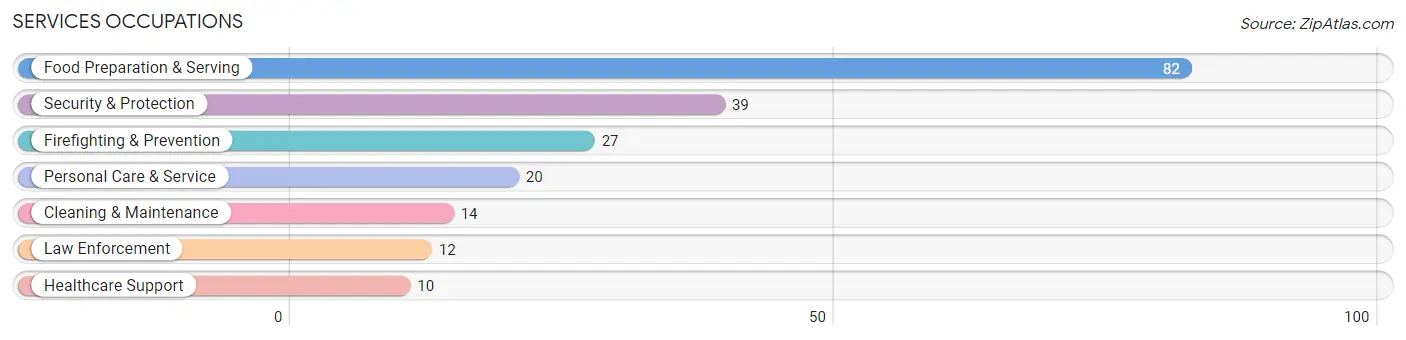
Services Occupations
The most common Services occupations in Judith Basin County are Food Preparation & Serving (82 | 8.2%), Security & Protection (39 | 3.9%), Firefighting & Prevention (27 | 2.7%), Personal Care & Service (20 | 2.0%), and Cleaning & Maintenance (14 | 1.4%).
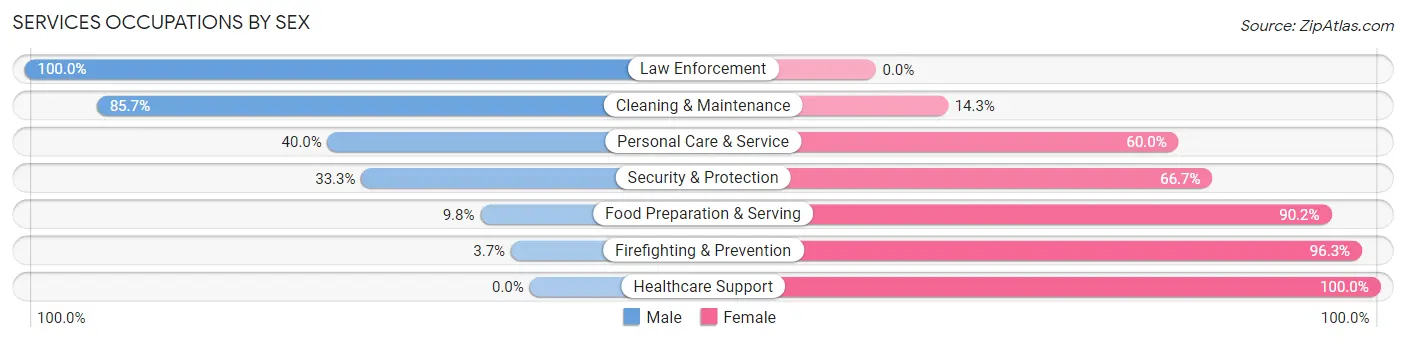
Services Occupations by Sex
Within the Services occupations in Judith Basin County, the most male-oriented occupations are Law Enforcement (100.0%), Cleaning & Maintenance (85.7%), and Personal Care & Service (40.0%), while the most female-oriented occupations are Healthcare Support (100.0%), Firefighting & Prevention (96.3%), and Food Preparation & Serving (90.2%).
| Occupation | Male | Female |
| Healthcare Support | 0 (0.0%) | 10 (100.0%) |
| Security & Protection | 13 (33.3%) | 26 (66.7%) |
| Firefighting & Prevention | 1 (3.7%) | 26 (96.3%) |
| Law Enforcement | 12 (100.0%) | 0 (0.0%) |
| Food Preparation & Serving | 8 (9.8%) | 74 (90.2%) |
| Cleaning & Maintenance | 12 (85.7%) | 2 (14.3%) |
| Personal Care & Service | 8 (40.0%) | 12 (60.0%) |
| Total (Category) | 41 (24.8%) | 124 (75.1%) |
| Total (Overall) | 550 (55.2%) | 446 (44.8%) |
Sales and Office Occupations
The most common Sales and Office occupations in Judith Basin County are Office & Administration (57 | 5.7%), and Sales & Related (43 | 4.3%).
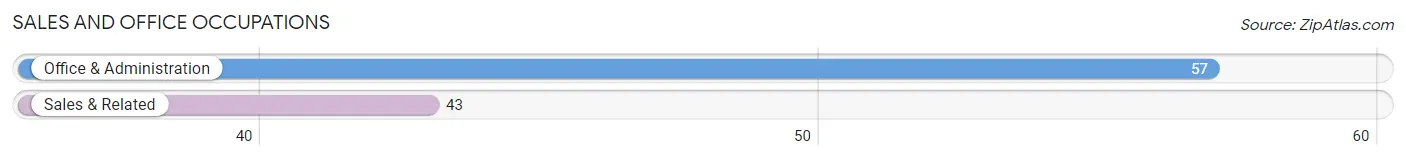
Sales and Office Occupations by Sex
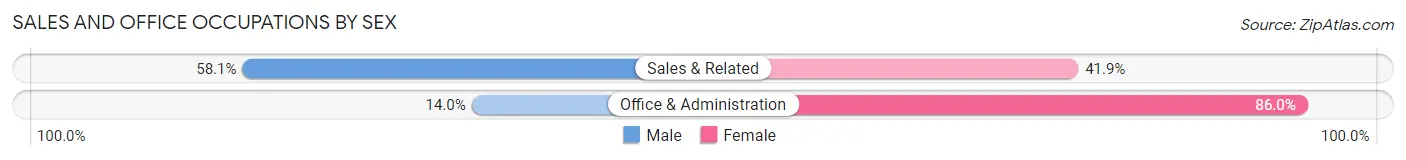
| Occupation | Male | Female |
| Sales & Related | 25 (58.1%) | 18 (41.9%) |
| Office & Administration | 8 (14.0%) | 49 (86.0%) |
| Total (Category) | 33 (33.0%) | 67 (67.0%) |
| Total (Overall) | 550 (55.2%) | 446 (44.8%) |
Natural Resources, Construction and Maintenance Occupations
The most common Natural Resources, Construction and Maintenance occupations in Judith Basin County are Farming, Fishing & Forestry (69 | 6.9%), Construction & Extraction (49 | 4.9%), and Installation, Maintenance & Repair (20 | 2.0%).

Natural Resources, Construction and Maintenance Occupations by Sex
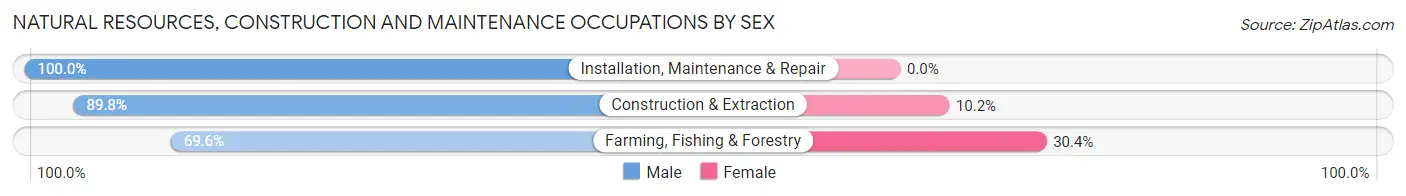
| Occupation | Male | Female |
| Farming, Fishing & Forestry | 48 (69.6%) | 21 (30.4%) |
| Construction & Extraction | 44 (89.8%) | 5 (10.2%) |
| Installation, Maintenance & Repair | 20 (100.0%) | 0 (0.0%) |
| Total (Category) | 112 (81.2%) | 26 (18.8%) |
| Total (Overall) | 550 (55.2%) | 446 (44.8%) |
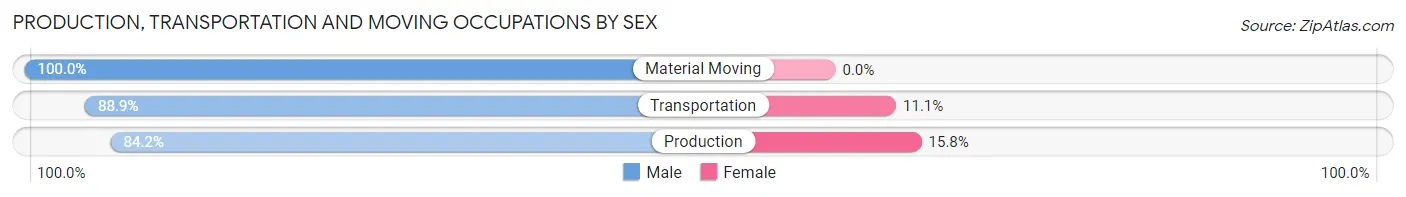
Production, Transportation and Moving Occupations
The most common Production, Transportation and Moving occupations in Judith Basin County are Transportation (27 | 2.7%), Production (19 | 1.9%), and Material Moving (12 | 1.2%).
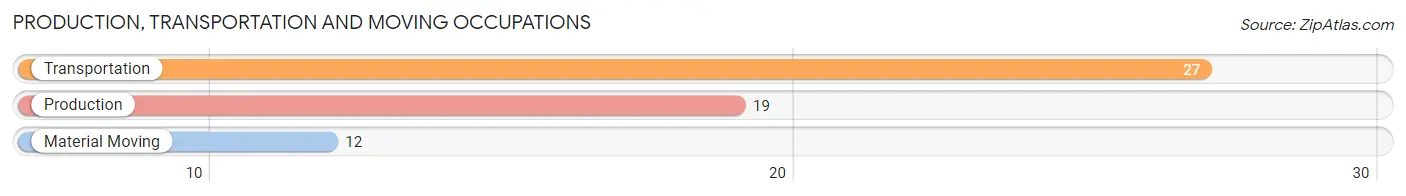
Production, Transportation and Moving Occupations by Sex
| Occupation | Male | Female |
| Production | 16 (84.2%) | 3 (15.8%) |
| Transportation | 24 (88.9%) | 3 (11.1%) |
| Material Moving | 12 (100.0%) | 0 (0.0%) |
| Total (Category) | 52 (89.7%) | 6 (10.3%) |
| Total (Overall) | 550 (55.2%) | 446 (44.8%) |
Employment Industries by Sex in Judith Basin County
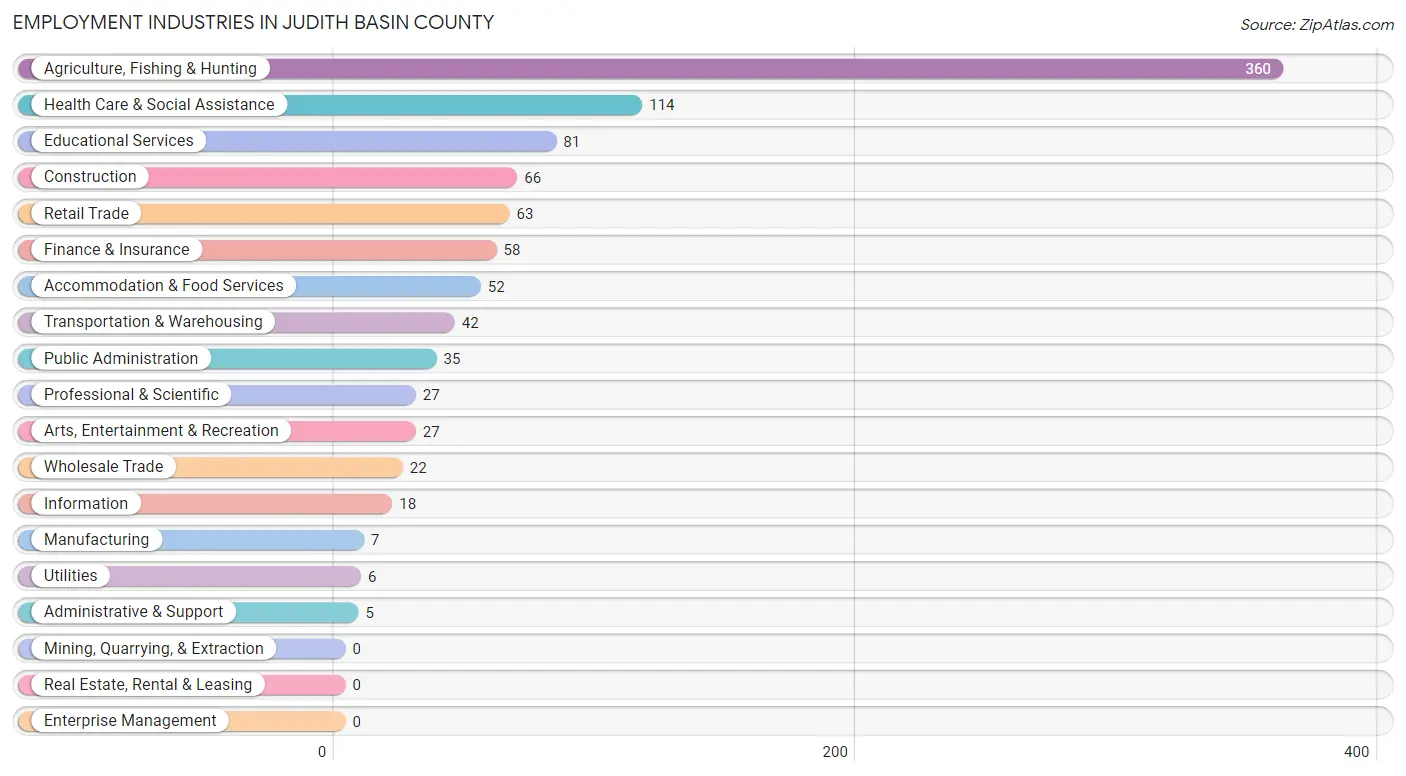
Employment Industries in Judith Basin County
The major employment industries in Judith Basin County include Agriculture, Fishing & Hunting (360 | 36.1%), Health Care & Social Assistance (114 | 11.5%), Educational Services (81 | 8.1%), Construction (66 | 6.6%), and Retail Trade (63 | 6.3%).
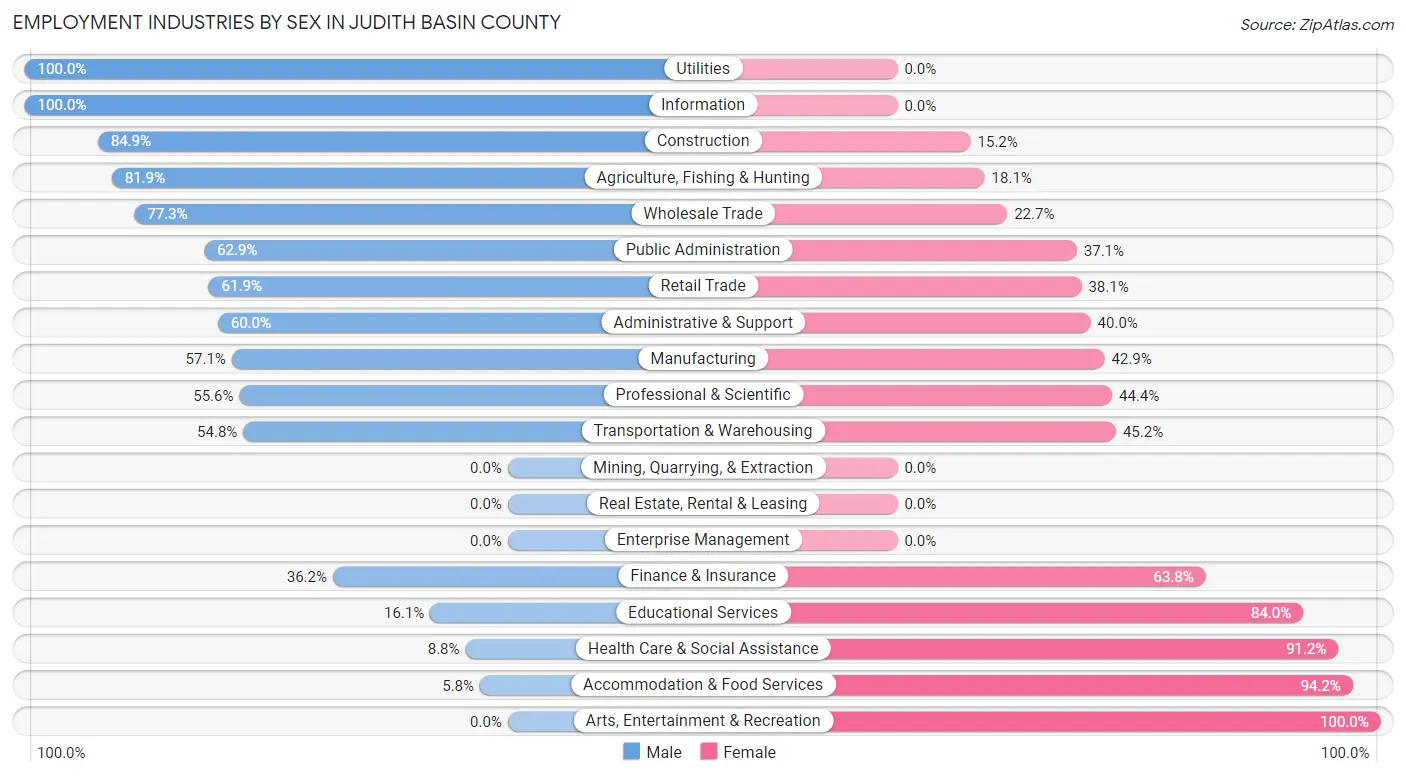
Employment Industries by Sex in Judith Basin County
The Judith Basin County industries that see more men than women are Utilities (100.0%), Information (100.0%), and Construction (84.9%), whereas the industries that tend to have a higher number of women are Arts, Entertainment & Recreation (100.0%), Accommodation & Food Services (94.2%), and Health Care & Social Assistance (91.2%).
| Industry | Male | Female |
| Agriculture, Fishing & Hunting | 295 (81.9%) | 65 (18.1%) |
| Mining, Quarrying, & Extraction | 0 (0.0%) | 0 (0.0%) |
| Construction | 56 (84.9%) | 10 (15.1%) |
| Manufacturing | 4 (57.1%) | 3 (42.9%) |
| Wholesale Trade | 17 (77.3%) | 5 (22.7%) |
| Retail Trade | 39 (61.9%) | 24 (38.1%) |
| Transportation & Warehousing | 23 (54.8%) | 19 (45.2%) |
| Utilities | 6 (100.0%) | 0 (0.0%) |
| Information | 18 (100.0%) | 0 (0.0%) |
| Finance & Insurance | 21 (36.2%) | 37 (63.8%) |
| Real Estate, Rental & Leasing | 0 (0.0%) | 0 (0.0%) |
| Professional & Scientific | 15 (55.6%) | 12 (44.4%) |
| Enterprise Management | 0 (0.0%) | 0 (0.0%) |
| Administrative & Support | 3 (60.0%) | 2 (40.0%) |
| Educational Services | 13 (16.1%) | 68 (84.0%) |
| Health Care & Social Assistance | 10 (8.8%) | 104 (91.2%) |
| Arts, Entertainment & Recreation | 0 (0.0%) | 27 (100.0%) |
| Accommodation & Food Services | 3 (5.8%) | 49 (94.2%) |
| Public Administration | 22 (62.9%) | 13 (37.1%) |
| Total | 550 (55.2%) | 446 (44.8%) |
Education in Judith Basin County
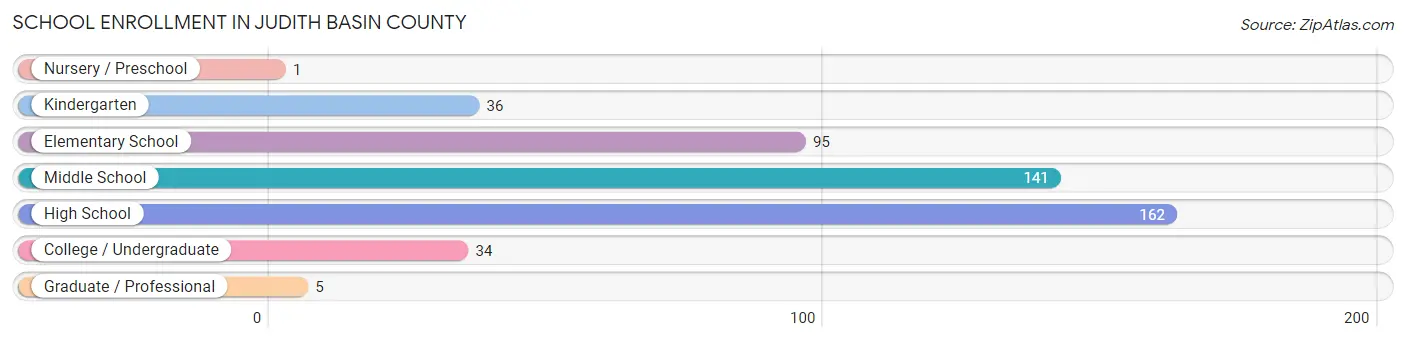
School Enrollment in Judith Basin County
The most common levels of schooling among the 474 students in Judith Basin County are high school (162 | 34.2%), middle school (141 | 29.7%), and elementary school (95 | 20.0%).
| School Level | # Students | % Students |
| Nursery / Preschool | 1 | 0.2% |
| Kindergarten | 36 | 7.6% |
| Elementary School | 95 | 20.0% |
| Middle School | 141 | 29.7% |
| High School | 162 | 34.2% |
| College / Undergraduate | 34 | 7.2% |
| Graduate / Professional | 5 | 1.1% |
| Total | 474 | 100.0% |
School Enrollment by Age by Funding Source in Judith Basin County
Out of a total of 474 students who are enrolled in schools in Judith Basin County, 22 (4.6%) attend a private institution, while the remaining 452 (95.4%) are enrolled in public schools. The age group of 35 years and over has the highest likelihood of being enrolled in private schools, with 5 (62.5% in the age bracket) enrolled. Conversely, the age group of 5 to 9 year old has the lowest likelihood of being enrolled in a private school, with 123 (100.0% in the age bracket) attending a public institution.
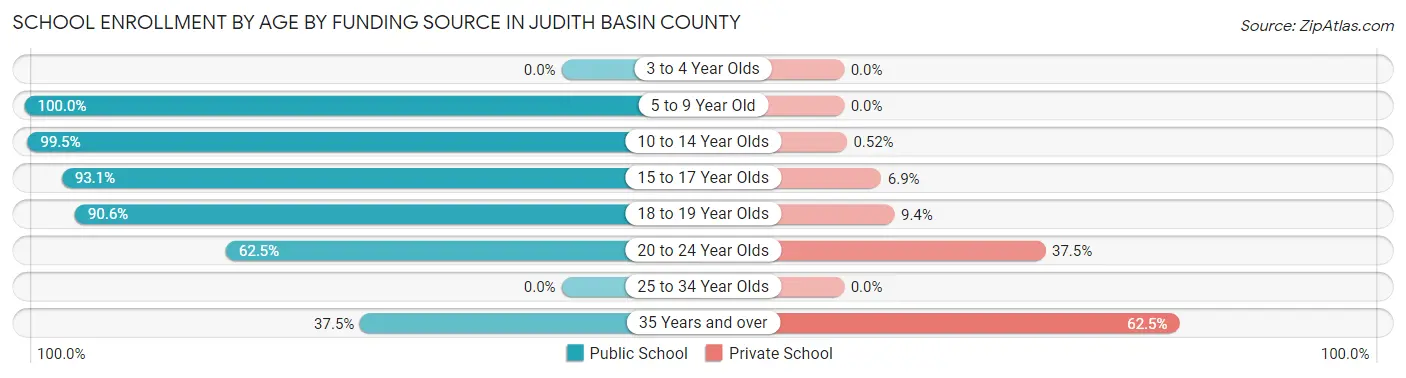
| Age Bracket | Public School | Private School |
| 3 to 4 Year Olds | 0 (0.0%) | 0 (0.0%) |
| 5 to 9 Year Old | 123 (100.0%) | 0 (0.0%) |
| 10 to 14 Year Olds | 193 (99.5%) | 1 (0.5%) |
| 15 to 17 Year Olds | 94 (93.1%) | 7 (6.9%) |
| 18 to 19 Year Olds | 29 (90.6%) | 3 (9.4%) |
| 20 to 24 Year Olds | 10 (62.5%) | 6 (37.5%) |
| 25 to 34 Year Olds | 0 (0.0%) | 0 (0.0%) |
| 35 Years and over | 3 (37.5%) | 5 (62.5%) |
| Total | 452 (95.4%) | 22 (4.6%) |
Educational Attainment by Field of Study in Judith Basin County
Bio, nature & agricultural (126 | 30.1%), education (92 | 22.0%), business (52 | 12.4%), science & technology (42 | 10.0%), and social sciences (19 | 4.5%) are the most common fields of study among 419 individuals in Judith Basin County who have obtained a bachelor's degree or higher.
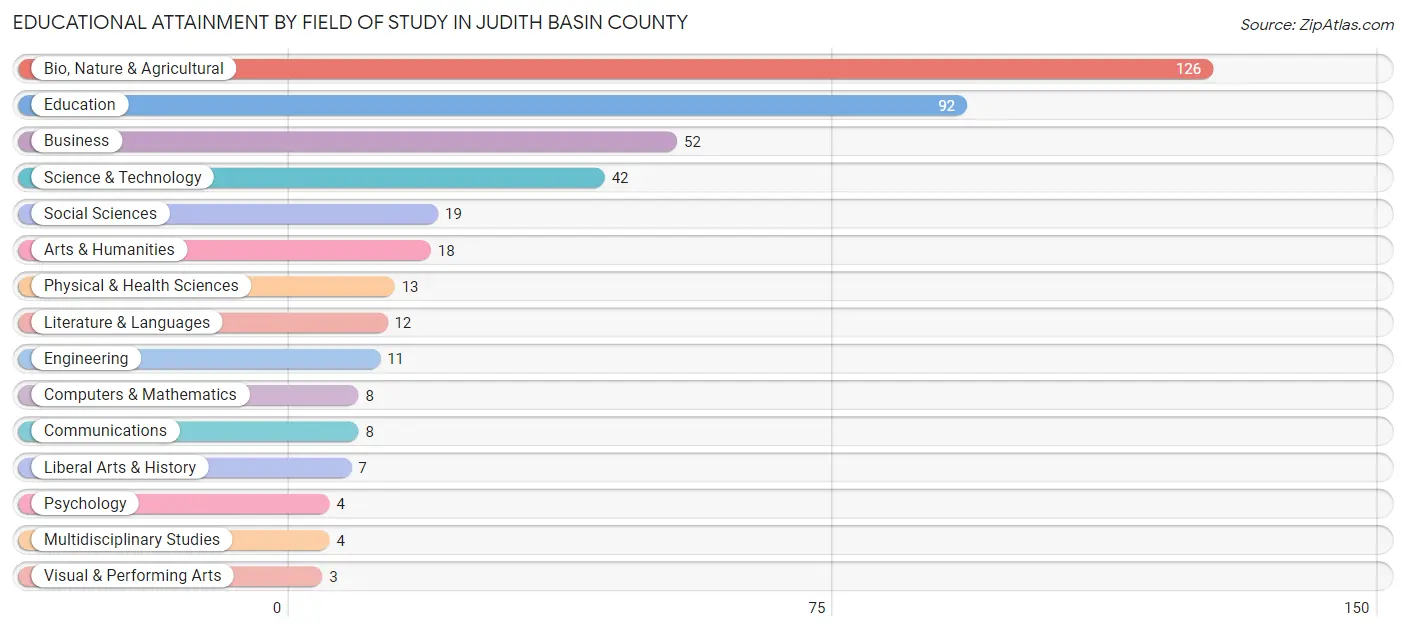
| Field of Study | # Graduates | % Graduates |
| Computers & Mathematics | 8 | 1.9% |
| Bio, Nature & Agricultural | 126 | 30.1% |
| Physical & Health Sciences | 13 | 3.1% |
| Psychology | 4 | 0.9% |
| Social Sciences | 19 | 4.5% |
| Engineering | 11 | 2.6% |
| Multidisciplinary Studies | 4 | 0.9% |
| Science & Technology | 42 | 10.0% |
| Business | 52 | 12.4% |
| Education | 92 | 22.0% |
| Literature & Languages | 12 | 2.9% |
| Liberal Arts & History | 7 | 1.7% |
| Visual & Performing Arts | 3 | 0.7% |
| Communications | 8 | 1.9% |
| Arts & Humanities | 18 | 4.3% |
| Total | 419 | 100.0% |
Transportation & Commute in Judith Basin County
Vehicle Availability by Sex in Judith Basin County
The most prevalent vehicle ownership categories in Judith Basin County are males with 5 or more vehicles (134, accounting for 25.6%) and females with 5 or more vehicles (130, making up 30.2%).
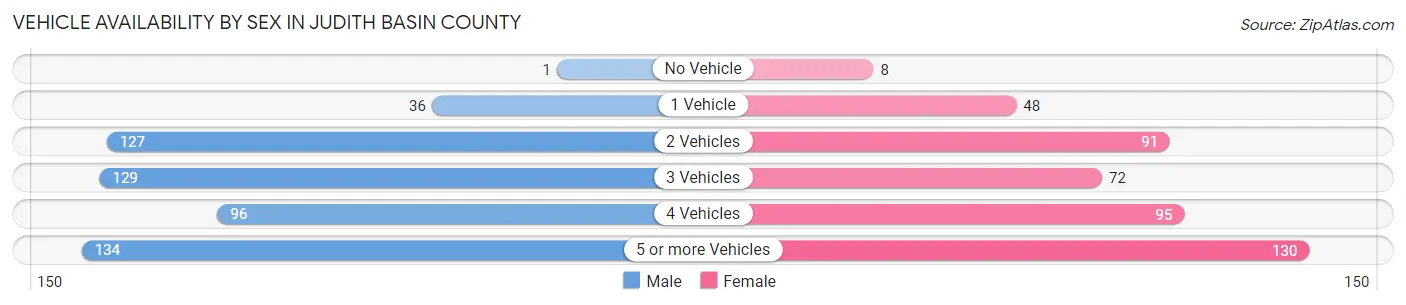
| Vehicles Available | Male | Female |
| No Vehicle | 1 (0.2%) | 8 (1.8%) |
| 1 Vehicle | 36 (6.9%) | 48 (10.8%) |
| 2 Vehicles | 127 (24.3%) | 91 (20.5%) |
| 3 Vehicles | 129 (24.7%) | 72 (16.2%) |
| 4 Vehicles | 96 (18.4%) | 95 (21.4%) |
| 5 or more Vehicles | 134 (25.6%) | 130 (29.3%) |
| Total | 523 (100.0%) | 444 (100.0%) |
Commute Time in Judith Basin County
The most frequently occuring commute durations in Judith Basin County are 5 to 9 minutes (176 commuters, 24.0%), less than 5 minutes (121 commuters, 16.5%), and 45 to 59 minutes (102 commuters, 13.9%).
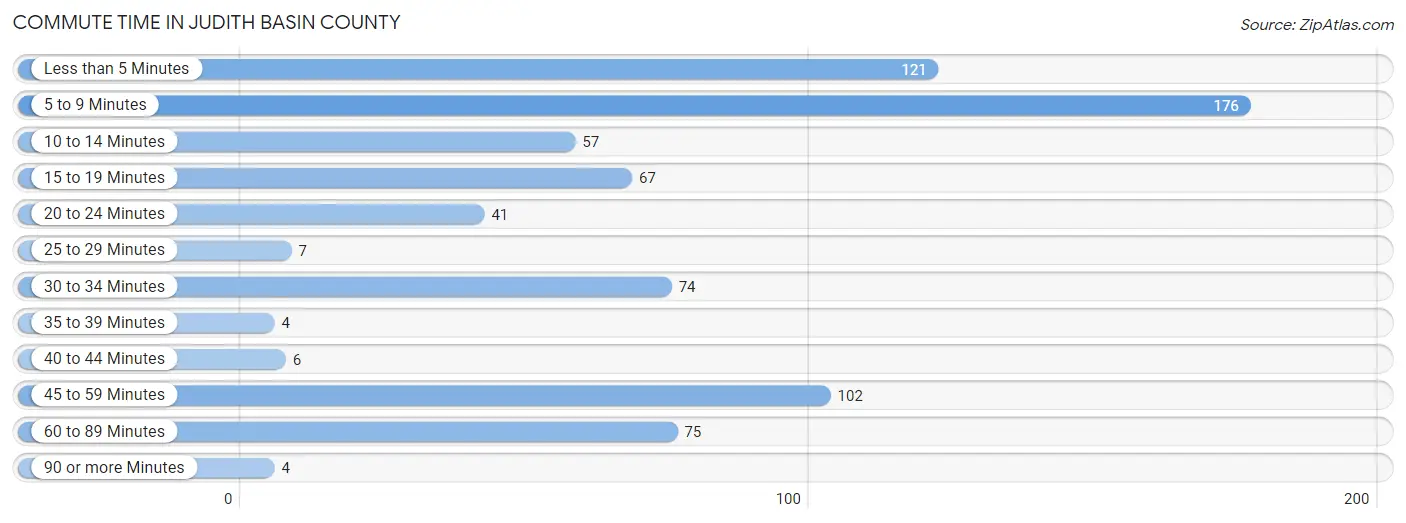
| Commute Time | # Commuters | % Commuters |
| Less than 5 Minutes | 121 | 16.5% |
| 5 to 9 Minutes | 176 | 24.0% |
| 10 to 14 Minutes | 57 | 7.8% |
| 15 to 19 Minutes | 67 | 9.1% |
| 20 to 24 Minutes | 41 | 5.6% |
| 25 to 29 Minutes | 7 | 0.9% |
| 30 to 34 Minutes | 74 | 10.1% |
| 35 to 39 Minutes | 4 | 0.5% |
| 40 to 44 Minutes | 6 | 0.8% |
| 45 to 59 Minutes | 102 | 13.9% |
| 60 to 89 Minutes | 75 | 10.2% |
| 90 or more Minutes | 4 | 0.5% |
Commute Time by Sex in Judith Basin County
The most common commute times in Judith Basin County are 5 to 9 minutes (83 commuters, 22.9%) for males and 5 to 9 minutes (93 commuters, 25.1%) for females.
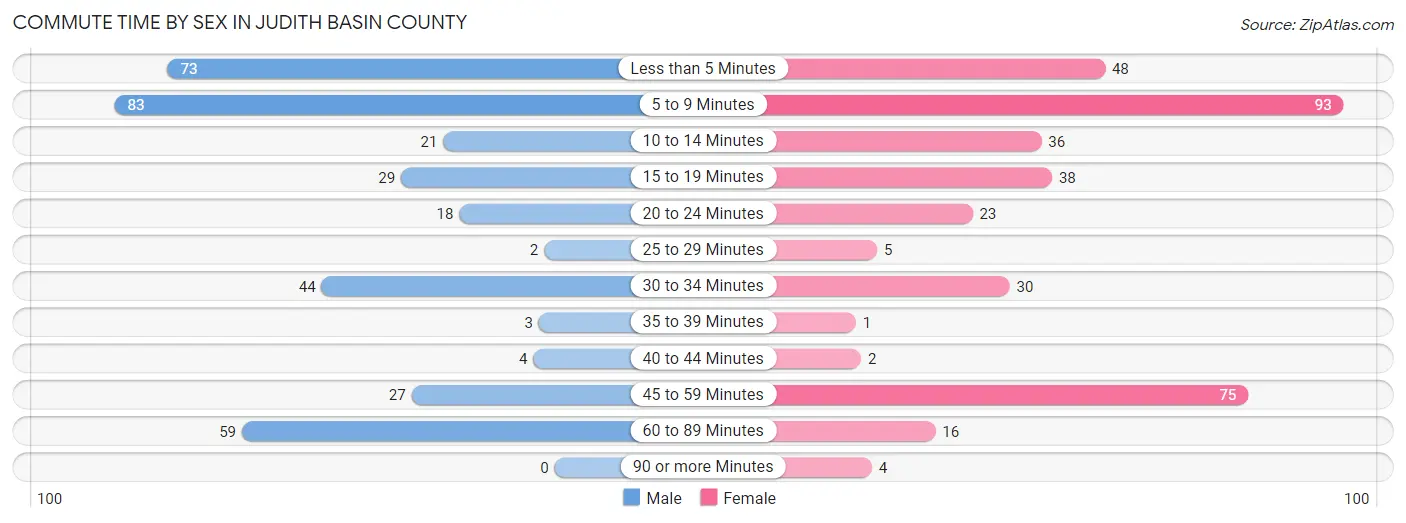
| Commute Time | Male | Female |
| Less than 5 Minutes | 73 (20.1%) | 48 (12.9%) |
| 5 to 9 Minutes | 83 (22.9%) | 93 (25.1%) |
| 10 to 14 Minutes | 21 (5.8%) | 36 (9.7%) |
| 15 to 19 Minutes | 29 (8.0%) | 38 (10.2%) |
| 20 to 24 Minutes | 18 (5.0%) | 23 (6.2%) |
| 25 to 29 Minutes | 2 (0.5%) | 5 (1.3%) |
| 30 to 34 Minutes | 44 (12.1%) | 30 (8.1%) |
| 35 to 39 Minutes | 3 (0.8%) | 1 (0.3%) |
| 40 to 44 Minutes | 4 (1.1%) | 2 (0.5%) |
| 45 to 59 Minutes | 27 (7.4%) | 75 (20.2%) |
| 60 to 89 Minutes | 59 (16.3%) | 16 (4.3%) |
| 90 or more Minutes | 0 (0.0%) | 4 (1.1%) |
Time of Departure to Work by Sex in Judith Basin County
The most frequent times of departure to work in Judith Basin County are 7:30 AM to 7:59 AM (79, 21.8%) for males and 7:30 AM to 7:59 AM (69, 18.6%) for females.
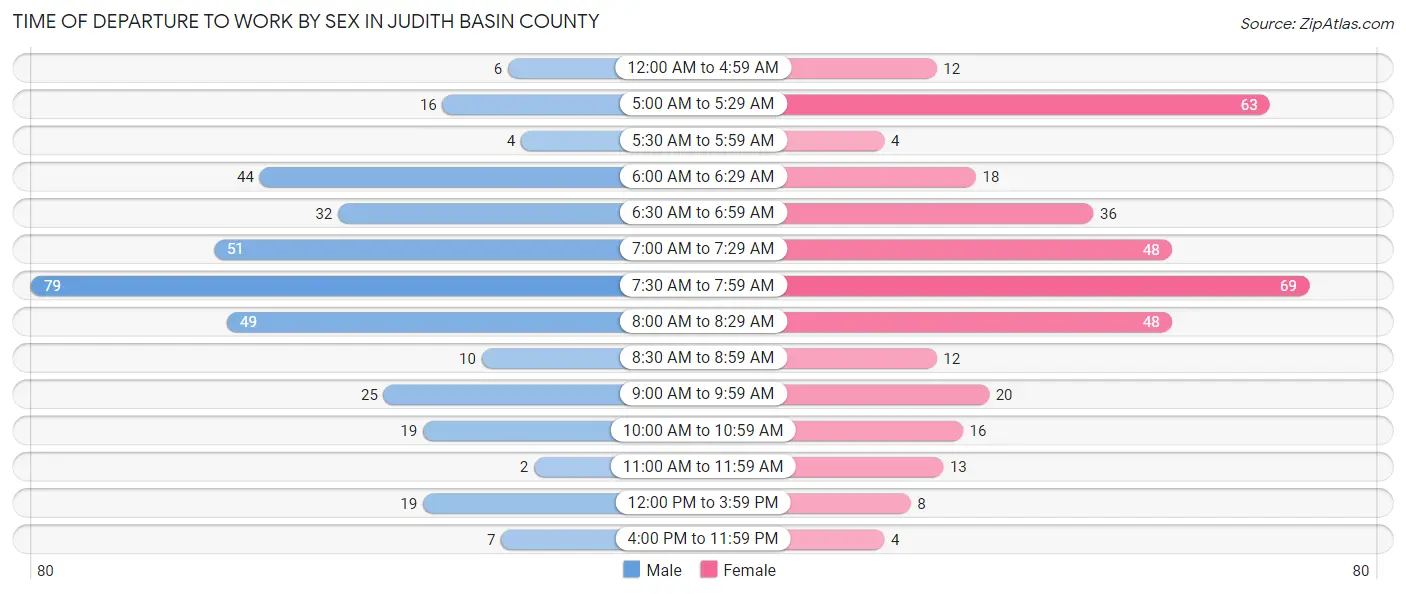
| Time of Departure | Male | Female |
| 12:00 AM to 4:59 AM | 6 (1.7%) | 12 (3.2%) |
| 5:00 AM to 5:29 AM | 16 (4.4%) | 63 (17.0%) |
| 5:30 AM to 5:59 AM | 4 (1.1%) | 4 (1.1%) |
| 6:00 AM to 6:29 AM | 44 (12.1%) | 18 (4.9%) |
| 6:30 AM to 6:59 AM | 32 (8.8%) | 36 (9.7%) |
| 7:00 AM to 7:29 AM | 51 (14.1%) | 48 (12.9%) |
| 7:30 AM to 7:59 AM | 79 (21.8%) | 69 (18.6%) |
| 8:00 AM to 8:29 AM | 49 (13.5%) | 48 (12.9%) |
| 8:30 AM to 8:59 AM | 10 (2.8%) | 12 (3.2%) |
| 9:00 AM to 9:59 AM | 25 (6.9%) | 20 (5.4%) |
| 10:00 AM to 10:59 AM | 19 (5.2%) | 16 (4.3%) |
| 11:00 AM to 11:59 AM | 2 (0.5%) | 13 (3.5%) |
| 12:00 PM to 3:59 PM | 19 (5.2%) | 8 (2.2%) |
| 4:00 PM to 11:59 PM | 7 (1.9%) | 4 (1.1%) |
| Total | 363 (100.0%) | 371 (100.0%) |
Housing Occupancy in Judith Basin County
Occupancy by Ownership in Judith Basin County
Of the total 898 dwellings in Judith Basin County, owner-occupied units account for 690 (76.8%), while renter-occupied units make up 208 (23.2%).
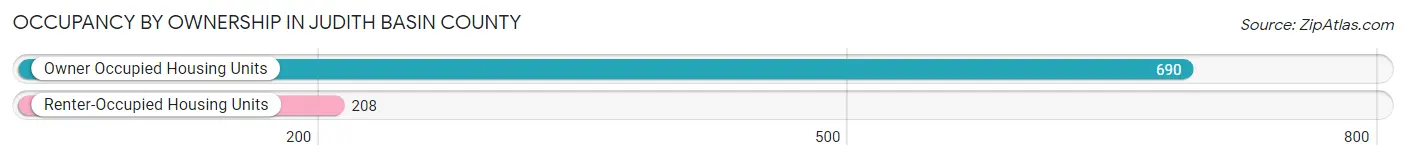
| Occupancy | # Housing Units | % Housing Units |
| Owner Occupied Housing Units | 690 | 76.8% |
| Renter-Occupied Housing Units | 208 | 23.2% |
| Total Occupied Housing Units | 898 | 100.0% |
Occupancy by Household Size in Judith Basin County
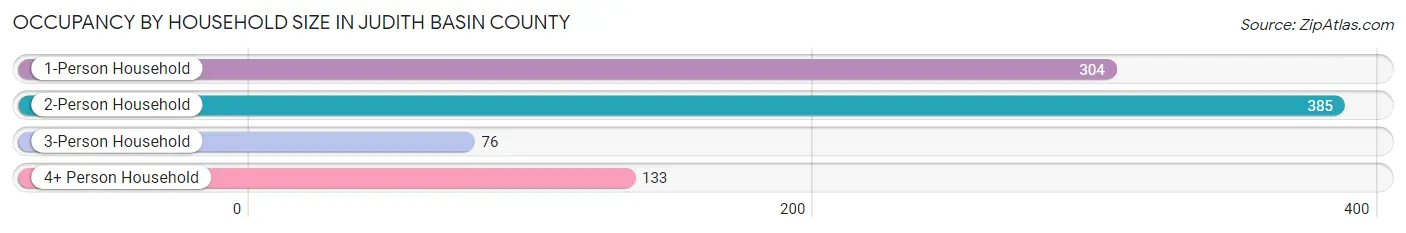
| Household Size | # Housing Units | % Housing Units |
| 1-Person Household | 304 | 33.9% |
| 2-Person Household | 385 | 42.9% |
| 3-Person Household | 76 | 8.5% |
| 4+ Person Household | 133 | 14.8% |
| Total Housing Units | 898 | 100.0% |
Occupancy by Ownership by Household Size in Judith Basin County
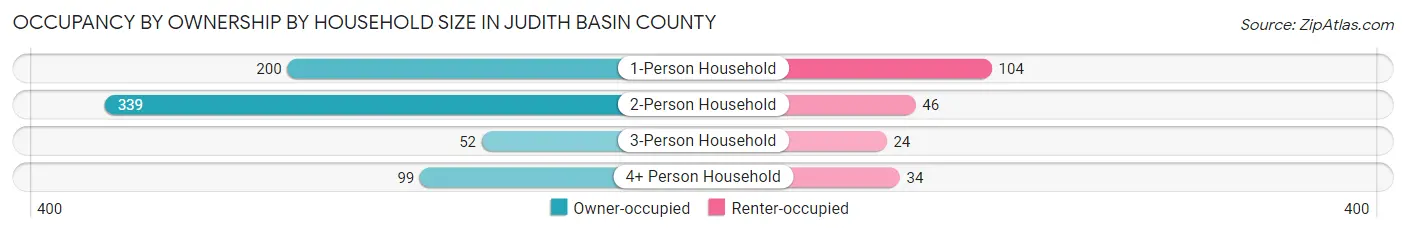
| Household Size | Owner-occupied | Renter-occupied |
| 1-Person Household | 200 (65.8%) | 104 (34.2%) |
| 2-Person Household | 339 (88.0%) | 46 (11.9%) |
| 3-Person Household | 52 (68.4%) | 24 (31.6%) |
| 4+ Person Household | 99 (74.4%) | 34 (25.6%) |
| Total Housing Units | 690 (76.8%) | 208 (23.2%) |
Occupancy by Educational Attainment in Judith Basin County
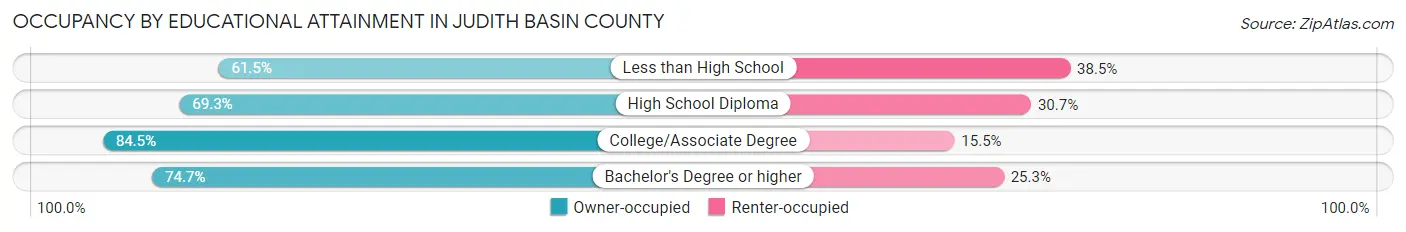
| Household Size | Owner-occupied | Renter-occupied |
| Less than High School | 24 (61.5%) | 15 (38.5%) |
| High School Diploma | 158 (69.3%) | 70 (30.7%) |
| College/Associate Degree | 316 (84.5%) | 58 (15.5%) |
| Bachelor's Degree or higher | 192 (74.7%) | 65 (25.3%) |
Occupancy by Age of Householder in Judith Basin County
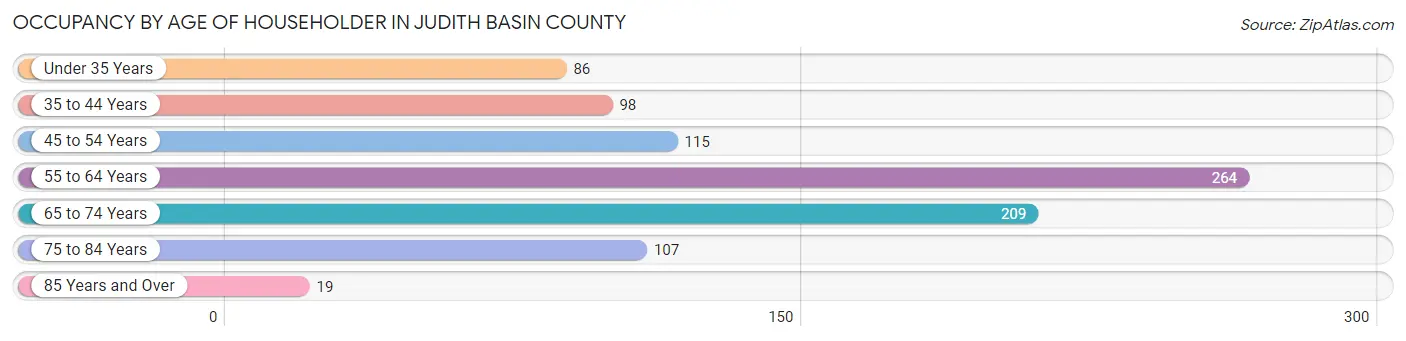
| Age Bracket | # Households | % Households |
| Under 35 Years | 86 | 9.6% |
| 35 to 44 Years | 98 | 10.9% |
| 45 to 54 Years | 115 | 12.8% |
| 55 to 64 Years | 264 | 29.4% |
| 65 to 74 Years | 209 | 23.3% |
| 75 to 84 Years | 107 | 11.9% |
| 85 Years and Over | 19 | 2.1% |
| Total | 898 | 100.0% |
Housing Finances in Judith Basin County
Median Income by Occupancy in Judith Basin County
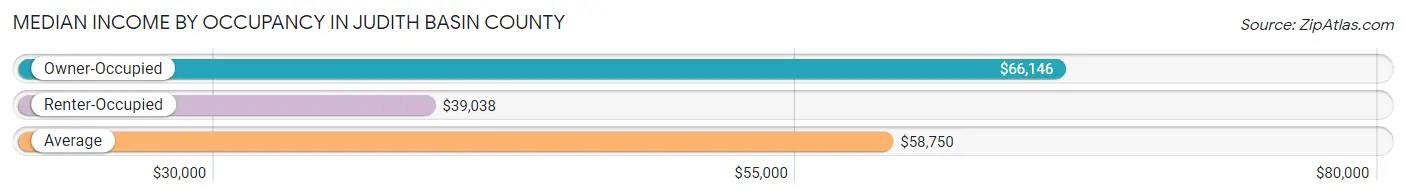
| Occupancy Type | # Households | Median Income |
| Owner-Occupied | 690 (76.8%) | $66,146 |
| Renter-Occupied | 208 (23.2%) | $39,038 |
| Average | 898 (100.0%) | $58,750 |
Occupancy by Householder Income Bracket in Judith Basin County
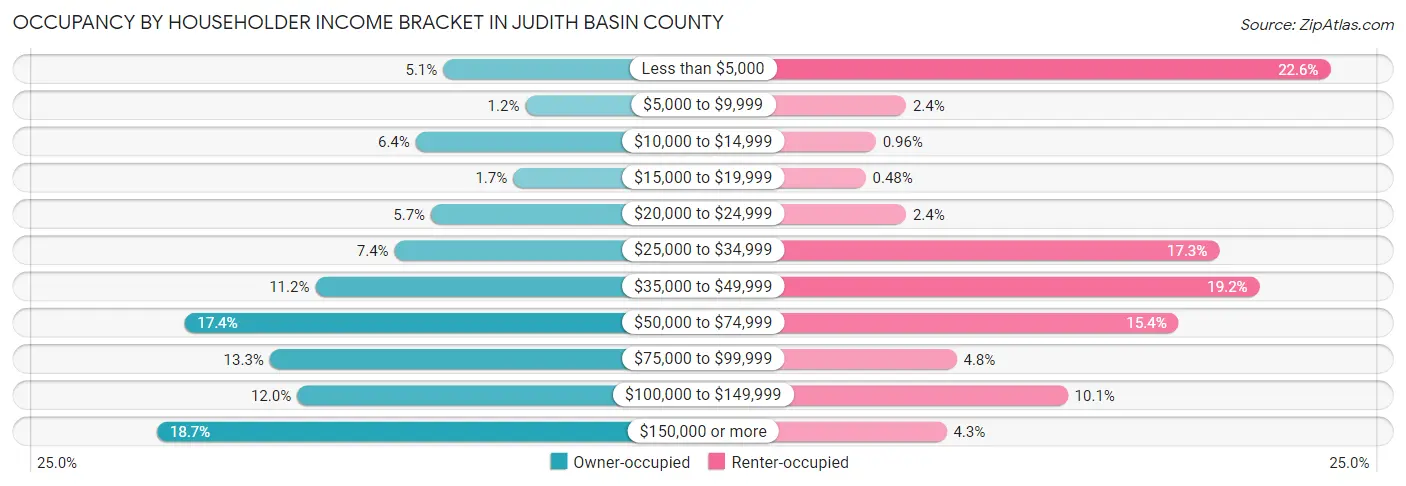
| Income Bracket | Owner-occupied | Renter-occupied |
| Less than $5,000 | 35 (5.1%) | 47 (22.6%) |
| $5,000 to $9,999 | 8 (1.2%) | 5 (2.4%) |
| $10,000 to $14,999 | 44 (6.4%) | 2 (1.0%) |
| $15,000 to $19,999 | 12 (1.7%) | 1 (0.5%) |
| $20,000 to $24,999 | 39 (5.7%) | 5 (2.4%) |
| $25,000 to $34,999 | 51 (7.4%) | 36 (17.3%) |
| $35,000 to $49,999 | 77 (11.2%) | 40 (19.2%) |
| $50,000 to $74,999 | 120 (17.4%) | 32 (15.4%) |
| $75,000 to $99,999 | 92 (13.3%) | 10 (4.8%) |
| $100,000 to $149,999 | 83 (12.0%) | 21 (10.1%) |
| $150,000 or more | 129 (18.7%) | 9 (4.3%) |
| Total | 690 (100.0%) | 208 (100.0%) |
Monthly Housing Cost Tiers in Judith Basin County
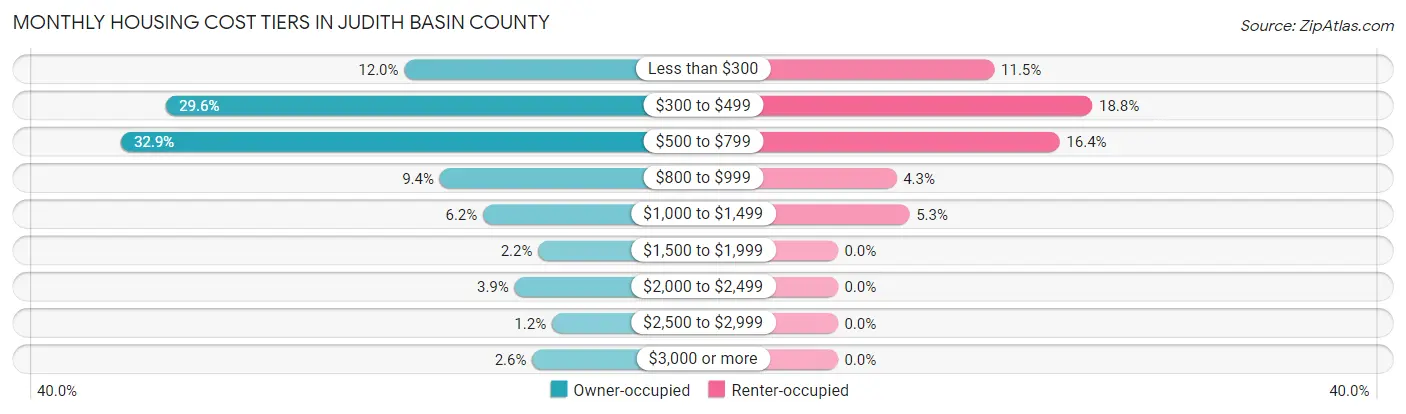
| Monthly Cost | Owner-occupied | Renter-occupied |
| Less than $300 | 83 (12.0%) | 24 (11.5%) |
| $300 to $499 | 204 (29.6%) | 39 (18.8%) |
| $500 to $799 | 227 (32.9%) | 34 (16.4%) |
| $800 to $999 | 65 (9.4%) | 9 (4.3%) |
| $1,000 to $1,499 | 43 (6.2%) | 11 (5.3%) |
| $1,500 to $1,999 | 15 (2.2%) | 0 (0.0%) |
| $2,000 to $2,499 | 27 (3.9%) | 0 (0.0%) |
| $2,500 to $2,999 | 8 (1.2%) | 0 (0.0%) |
| $3,000 or more | 18 (2.6%) | 0 (0.0%) |
| Total | 690 (100.0%) | 208 (100.0%) |
Physical Housing Characteristics in Judith Basin County
Housing Structures in Judith Basin County
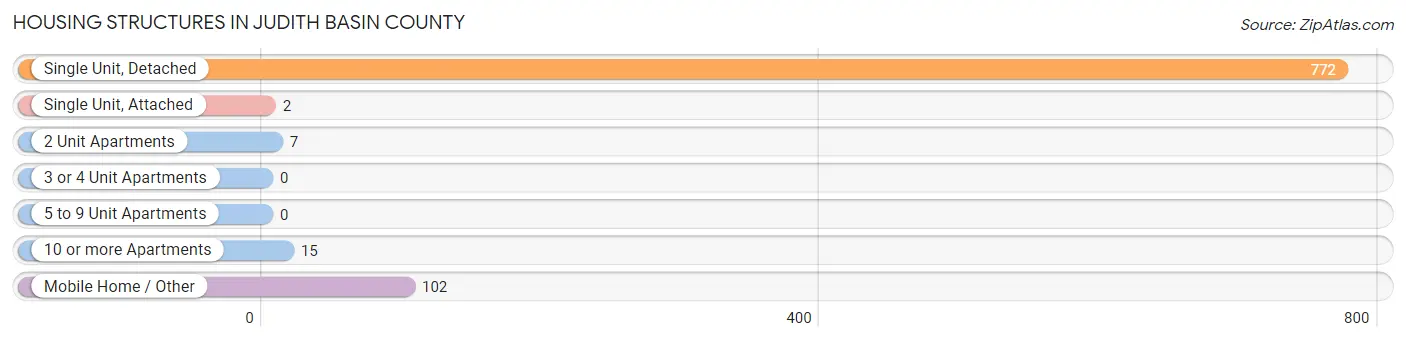
| Structure Type | # Housing Units | % Housing Units |
| Single Unit, Detached | 772 | 86.0% |
| Single Unit, Attached | 2 | 0.2% |
| 2 Unit Apartments | 7 | 0.8% |
| 3 or 4 Unit Apartments | 0 | 0.0% |
| 5 to 9 Unit Apartments | 0 | 0.0% |
| 10 or more Apartments | 15 | 1.7% |
| Mobile Home / Other | 102 | 11.4% |
| Total | 898 | 100.0% |
Housing Structures by Occupancy in Judith Basin County
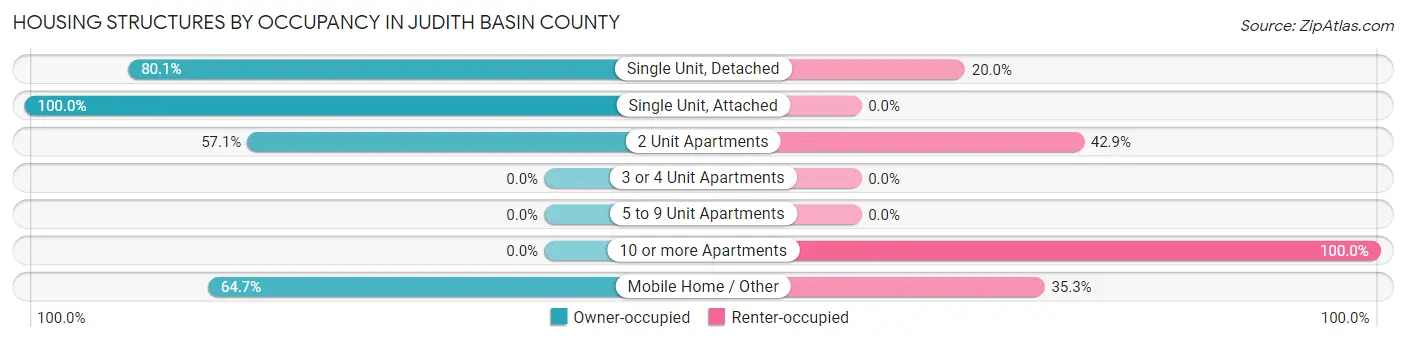
| Structure Type | Owner-occupied | Renter-occupied |
| Single Unit, Detached | 618 (80.0%) | 154 (20.0%) |
| Single Unit, Attached | 2 (100.0%) | 0 (0.0%) |
| 2 Unit Apartments | 4 (57.1%) | 3 (42.9%) |
| 3 or 4 Unit Apartments | 0 (0.0%) | 0 (0.0%) |
| 5 to 9 Unit Apartments | 0 (0.0%) | 0 (0.0%) |
| 10 or more Apartments | 0 (0.0%) | 15 (100.0%) |
| Mobile Home / Other | 66 (64.7%) | 36 (35.3%) |
| Total | 690 (76.8%) | 208 (23.2%) |
Housing Structures by Number of Rooms in Judith Basin County
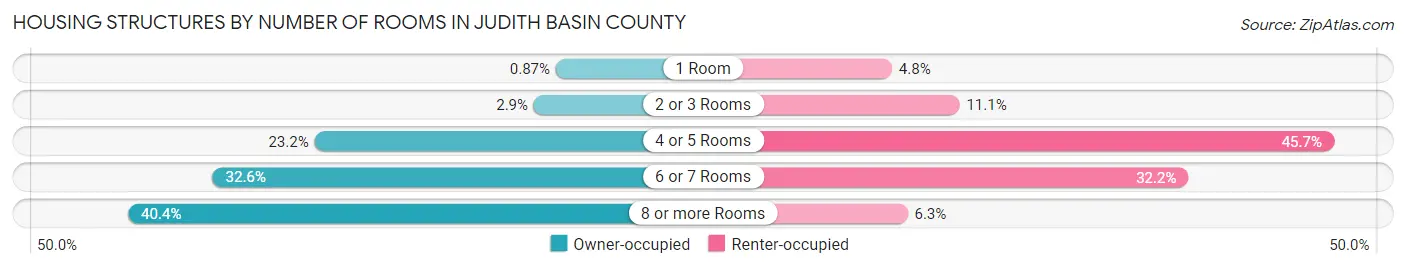
| Number of Rooms | Owner-occupied | Renter-occupied |
| 1 Room | 6 (0.9%) | 10 (4.8%) |
| 2 or 3 Rooms | 20 (2.9%) | 23 (11.1%) |
| 4 or 5 Rooms | 160 (23.2%) | 95 (45.7%) |
| 6 or 7 Rooms | 225 (32.6%) | 67 (32.2%) |
| 8 or more Rooms | 279 (40.4%) | 13 (6.2%) |
| Total | 690 (100.0%) | 208 (100.0%) |
Housing Structure by Heating Type in Judith Basin County
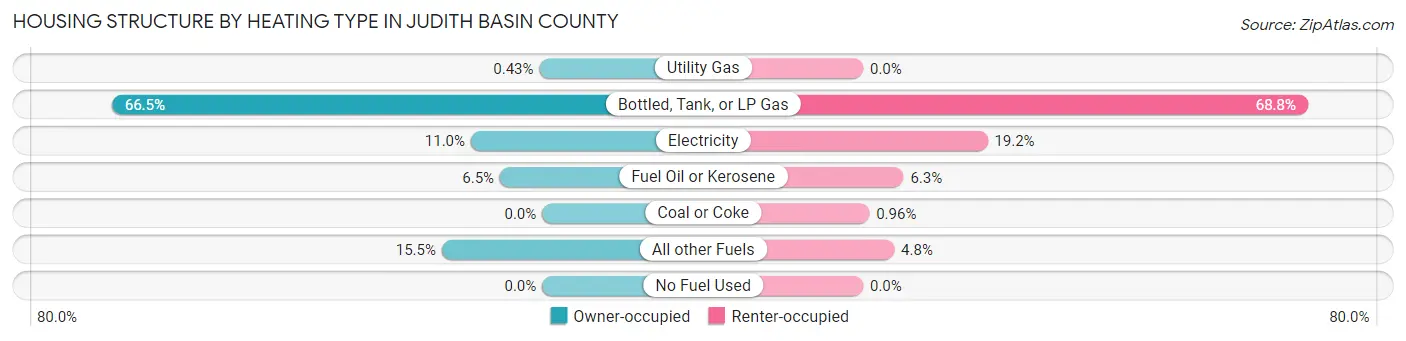
| Heating Type | Owner-occupied | Renter-occupied |
| Utility Gas | 3 (0.4%) | 0 (0.0%) |
| Bottled, Tank, or LP Gas | 459 (66.5%) | 143 (68.8%) |
| Electricity | 76 (11.0%) | 40 (19.2%) |
| Fuel Oil or Kerosene | 45 (6.5%) | 13 (6.2%) |
| Coal or Coke | 0 (0.0%) | 2 (1.0%) |
| All other Fuels | 107 (15.5%) | 10 (4.8%) |
| No Fuel Used | 0 (0.0%) | 0 (0.0%) |
| Total | 690 (100.0%) | 208 (100.0%) |
Household Vehicle Usage in Judith Basin County
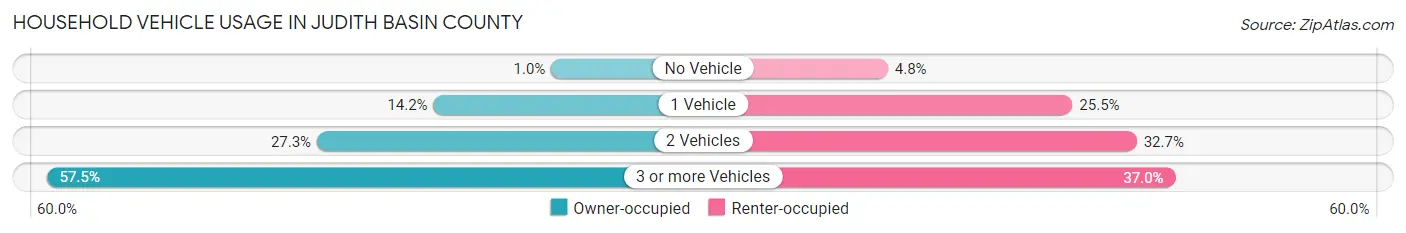
| Vehicles per Household | Owner-occupied | Renter-occupied |
| No Vehicle | 7 (1.0%) | 10 (4.8%) |
| 1 Vehicle | 98 (14.2%) | 53 (25.5%) |
| 2 Vehicles | 188 (27.3%) | 68 (32.7%) |
| 3 or more Vehicles | 397 (57.5%) | 77 (37.0%) |
| Total | 690 (100.0%) | 208 (100.0%) |
Real Estate & Mortgages in Judith Basin County
Real Estate and Mortgage Overview in Judith Basin County
| Characteristic | Without Mortgage | With Mortgage |
| Housing Units | 523 | 167 |
| Median Property Value | $199,500 | $237,000 |
| Median Household Income | $64,519 | $20 |
| Monthly Housing Costs | $476 | $18 |
| Real Estate Taxes | $956 | $3 |
Property Value by Mortgage Status in Judith Basin County
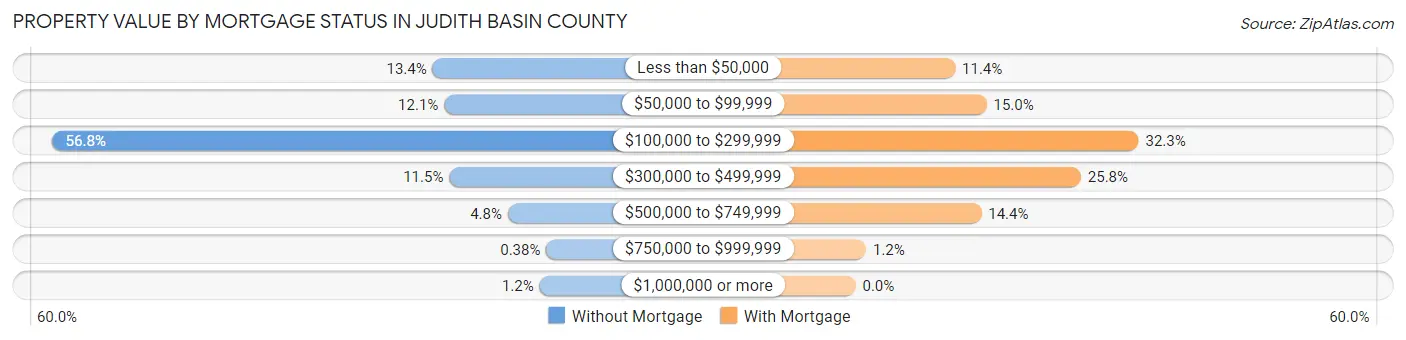
| Property Value | Without Mortgage | With Mortgage |
| Less than $50,000 | 70 (13.4%) | 19 (11.4%) |
| $50,000 to $99,999 | 63 (12.0%) | 25 (15.0%) |
| $100,000 to $299,999 | 297 (56.8%) | 54 (32.3%) |
| $300,000 to $499,999 | 60 (11.5%) | 43 (25.8%) |
| $500,000 to $749,999 | 25 (4.8%) | 24 (14.4%) |
| $750,000 to $999,999 | 2 (0.4%) | 2 (1.2%) |
| $1,000,000 or more | 6 (1.1%) | 0 (0.0%) |
| Total | 523 (100.0%) | 167 (100.0%) |
Household Income by Mortgage Status in Judith Basin County
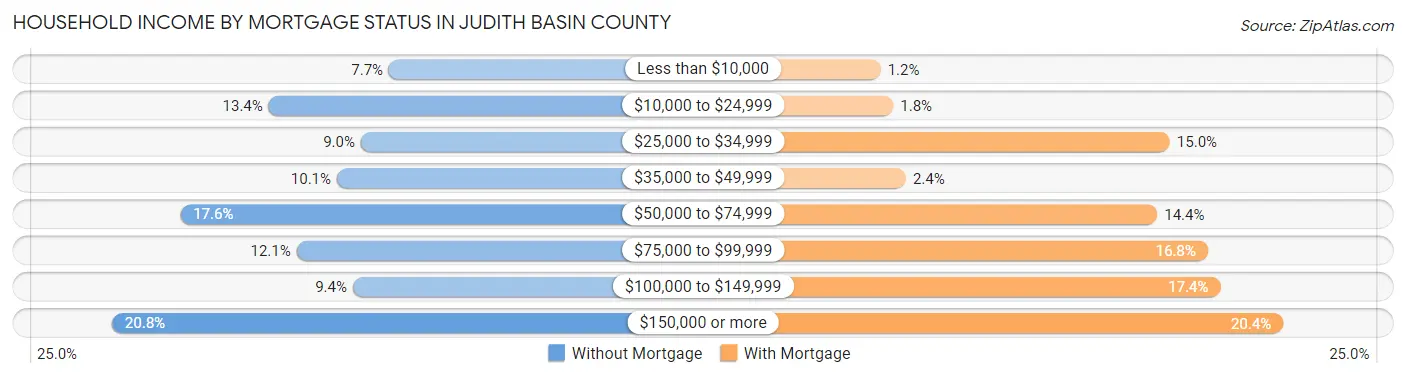
| Household Income | Without Mortgage | With Mortgage |
| Less than $10,000 | 40 (7.6%) | 2 (1.2%) |
| $10,000 to $24,999 | 70 (13.4%) | 3 (1.8%) |
| $25,000 to $34,999 | 47 (9.0%) | 25 (15.0%) |
| $35,000 to $49,999 | 53 (10.1%) | 4 (2.4%) |
| $50,000 to $74,999 | 92 (17.6%) | 24 (14.4%) |
| $75,000 to $99,999 | 63 (12.0%) | 28 (16.8%) |
| $100,000 to $149,999 | 49 (9.4%) | 29 (17.4%) |
| $150,000 or more | 109 (20.8%) | 34 (20.4%) |
| Total | 523 (100.0%) | 167 (100.0%) |
Property Value to Household Income Ratio in Judith Basin County
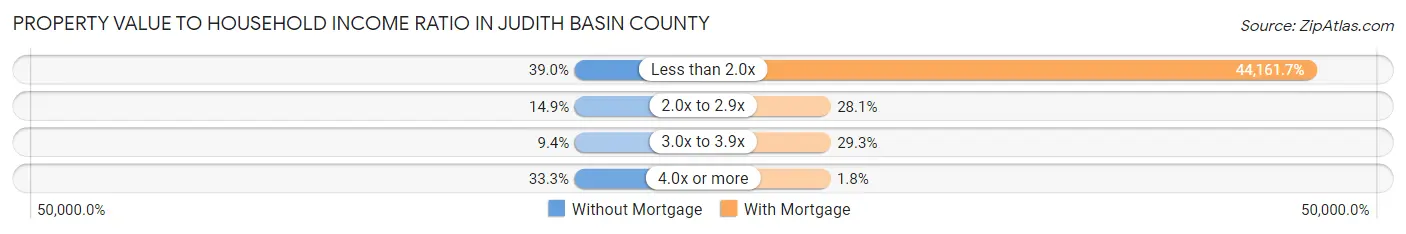
| Value-to-Income Ratio | Without Mortgage | With Mortgage |
| Less than 2.0x | 204 (39.0%) | 73,750 (44,161.7%) |
| 2.0x to 2.9x | 78 (14.9%) | 47 (28.1%) |
| 3.0x to 3.9x | 49 (9.4%) | 49 (29.3%) |
| 4.0x or more | 174 (33.3%) | 3 (1.8%) |
| Total | 523 (100.0%) | 167 (100.0%) |
Real Estate Taxes by Mortgage Status in Judith Basin County
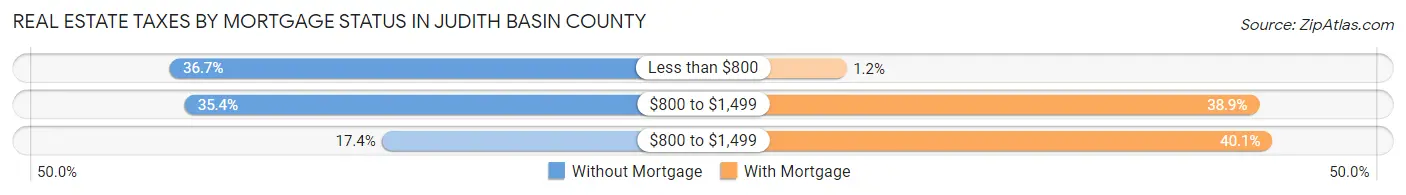
| Property Taxes | Without Mortgage | With Mortgage |
| Less than $800 | 192 (36.7%) | 2 (1.2%) |
| $800 to $1,499 | 185 (35.4%) | 65 (38.9%) |
| $800 to $1,499 | 91 (17.4%) | 67 (40.1%) |
| Total | 523 (100.0%) | 167 (100.0%) |
Health & Disability in Judith Basin County
Health Insurance Coverage by Age in Judith Basin County
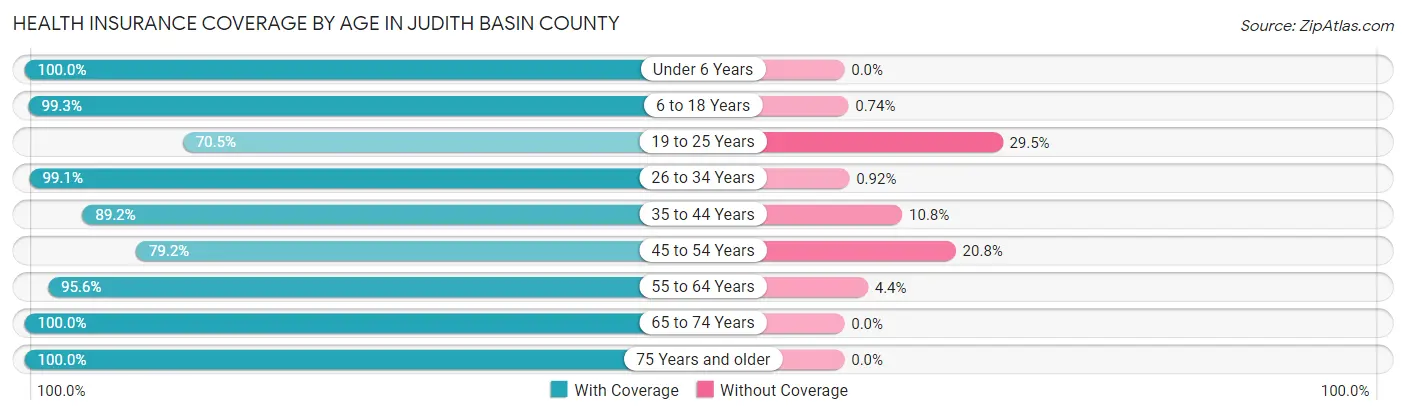
| Age Bracket | With Coverage | Without Coverage |
| Under 6 Years | 107 (100.0%) | 0 (0.0%) |
| 6 to 18 Years | 405 (99.3%) | 3 (0.7%) |
| 19 to 25 Years | 55 (70.5%) | 23 (29.5%) |
| 26 to 34 Years | 108 (99.1%) | 1 (0.9%) |
| 35 to 44 Years | 182 (89.2%) | 22 (10.8%) |
| 45 to 54 Years | 145 (79.2%) | 38 (20.8%) |
| 55 to 64 Years | 415 (95.6%) | 19 (4.4%) |
| 65 to 74 Years | 320 (100.0%) | 0 (0.0%) |
| 75 Years and older | 196 (100.0%) | 0 (0.0%) |
| Total | 1,933 (94.8%) | 106 (5.2%) |
Health Insurance Coverage by Citizenship Status in Judith Basin County
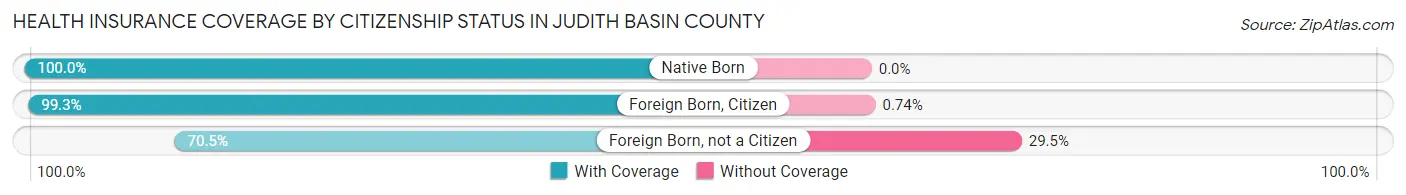
| Citizenship Status | With Coverage | Without Coverage |
| Native Born | 107 (100.0%) | 0 (0.0%) |
| Foreign Born, Citizen | 405 (99.3%) | 3 (0.7%) |
| Foreign Born, not a Citizen | 55 (70.5%) | 23 (29.5%) |
Health Insurance Coverage by Household Income in Judith Basin County
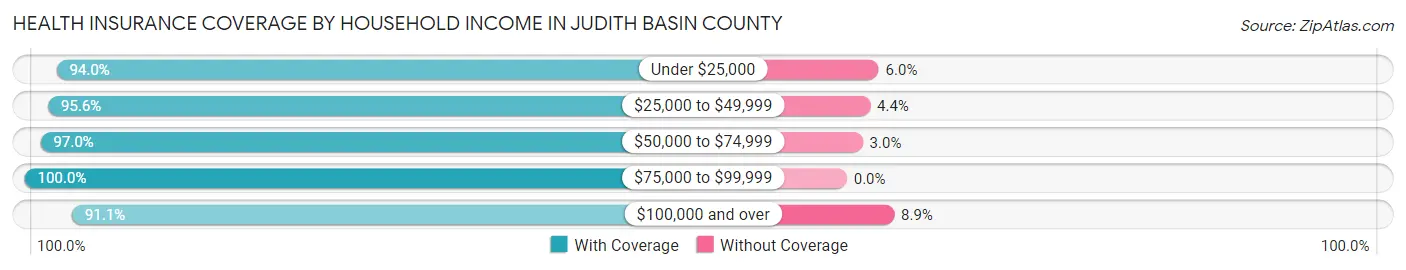
| Household Income | With Coverage | Without Coverage |
| Under $25,000 | 362 (94.0%) | 23 (6.0%) |
| $25,000 to $49,999 | 350 (95.6%) | 16 (4.4%) |
| $50,000 to $74,999 | 359 (97.0%) | 11 (3.0%) |
| $75,000 to $99,999 | 283 (100.0%) | 0 (0.0%) |
| $100,000 and over | 575 (91.1%) | 56 (8.9%) |
Public vs Private Health Insurance Coverage by Age in Judith Basin County
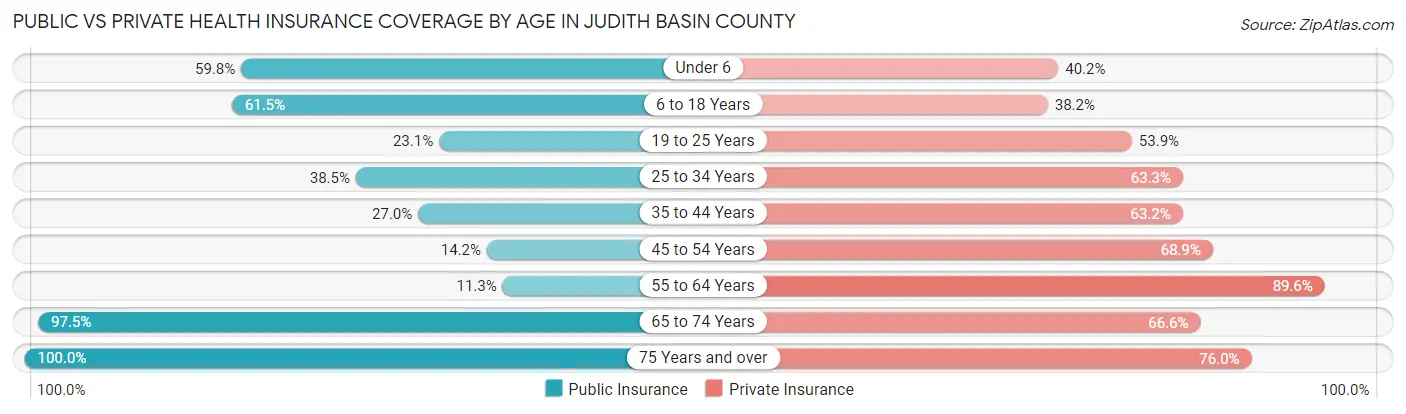
| Age Bracket | Public Insurance | Private Insurance |
| Under 6 | 64 (59.8%) | 43 (40.2%) |
| 6 to 18 Years | 251 (61.5%) | 156 (38.2%) |
| 19 to 25 Years | 18 (23.1%) | 42 (53.8%) |
| 25 to 34 Years | 42 (38.5%) | 69 (63.3%) |
| 35 to 44 Years | 55 (27.0%) | 129 (63.2%) |
| 45 to 54 Years | 26 (14.2%) | 126 (68.9%) |
| 55 to 64 Years | 49 (11.3%) | 389 (89.6%) |
| 65 to 74 Years | 312 (97.5%) | 213 (66.6%) |
| 75 Years and over | 196 (100.0%) | 149 (76.0%) |
| Total | 1,013 (49.7%) | 1,316 (64.5%) |
Disability Status by Sex by Age in Judith Basin County
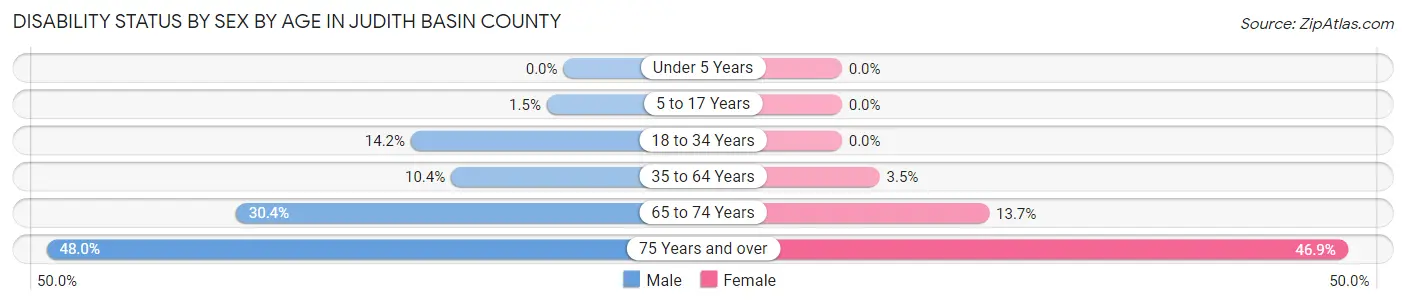
| Age Bracket | Male | Female |
| Under 5 Years | 0 (0.0%) | 0 (0.0%) |
| 5 to 17 Years | 4 (1.5%) | 0 (0.0%) |
| 18 to 34 Years | 15 (14.1%) | 0 (0.0%) |
| 35 to 64 Years | 47 (10.4%) | 13 (3.5%) |
| 65 to 74 Years | 55 (30.4%) | 19 (13.7%) |
| 75 Years and over | 47 (48.0%) | 46 (46.9%) |
Disability Class by Sex by Age in Judith Basin County
Disability Class: Hearing Difficulty
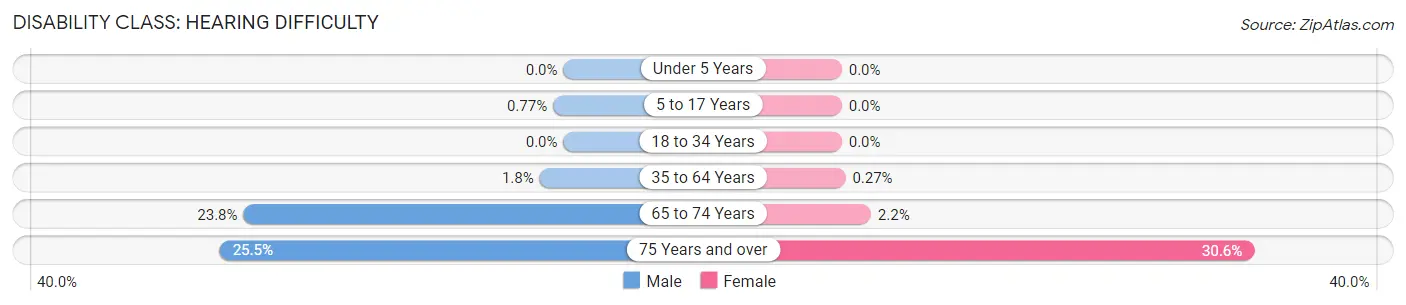
| Age Bracket | Male | Female |
| Under 5 Years | 0 (0.0%) | 0 (0.0%) |
| 5 to 17 Years | 2 (0.8%) | 0 (0.0%) |
| 18 to 34 Years | 0 (0.0%) | 0 (0.0%) |
| 35 to 64 Years | 8 (1.8%) | 1 (0.3%) |
| 65 to 74 Years | 43 (23.8%) | 3 (2.2%) |
| 75 Years and over | 25 (25.5%) | 30 (30.6%) |
Disability Class: Vision Difficulty
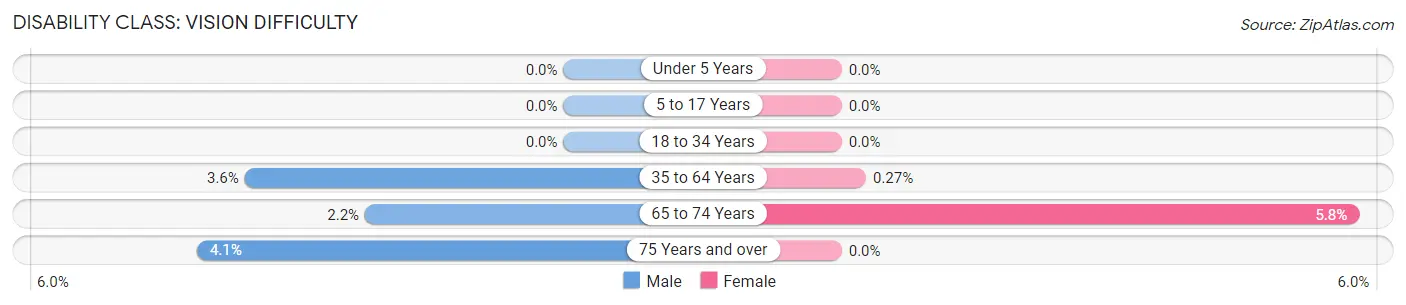
| Age Bracket | Male | Female |
| Under 5 Years | 0 (0.0%) | 0 (0.0%) |
| 5 to 17 Years | 0 (0.0%) | 0 (0.0%) |
| 18 to 34 Years | 0 (0.0%) | 0 (0.0%) |
| 35 to 64 Years | 16 (3.5%) | 1 (0.3%) |
| 65 to 74 Years | 4 (2.2%) | 8 (5.8%) |
| 75 Years and over | 4 (4.1%) | 0 (0.0%) |
Disability Class: Cognitive Difficulty
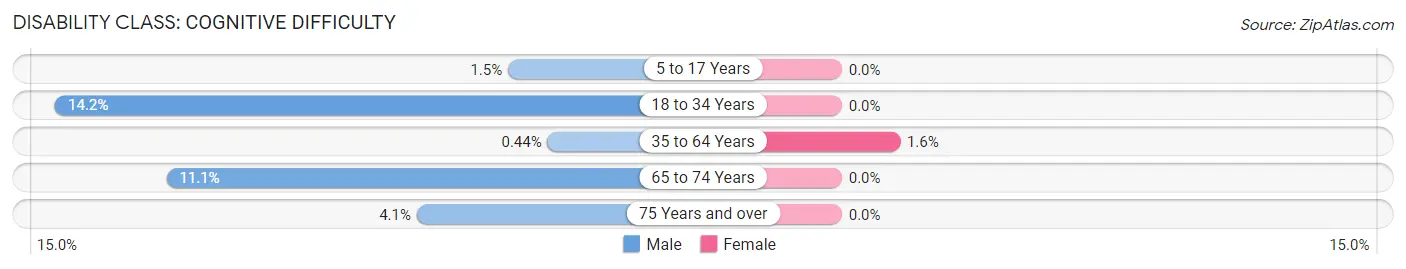
| Age Bracket | Male | Female |
| 5 to 17 Years | 4 (1.5%) | 0 (0.0%) |
| 18 to 34 Years | 15 (14.1%) | 0 (0.0%) |
| 35 to 64 Years | 2 (0.4%) | 6 (1.6%) |
| 65 to 74 Years | 20 (11.1%) | 0 (0.0%) |
| 75 Years and over | 4 (4.1%) | 0 (0.0%) |
Disability Class: Ambulatory Difficulty
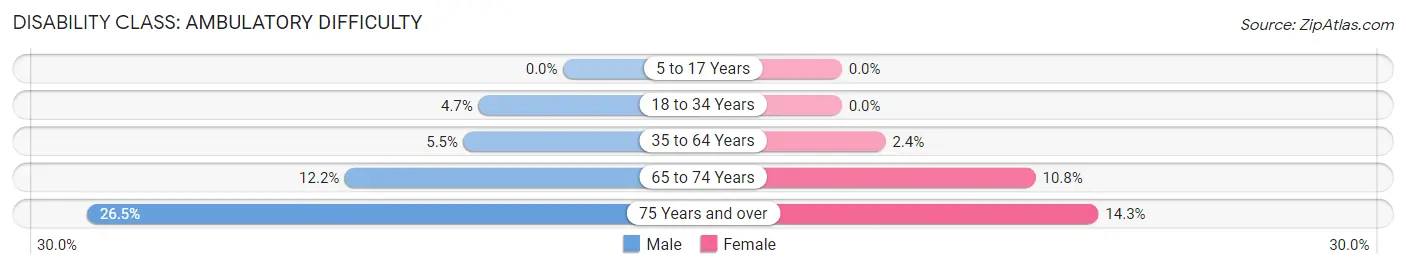
| Age Bracket | Male | Female |
| 5 to 17 Years | 0 (0.0%) | 0 (0.0%) |
| 18 to 34 Years | 5 (4.7%) | 0 (0.0%) |
| 35 to 64 Years | 25 (5.5%) | 9 (2.4%) |
| 65 to 74 Years | 22 (12.1%) | 15 (10.8%) |
| 75 Years and over | 26 (26.5%) | 14 (14.3%) |
Disability Class: Self-Care Difficulty
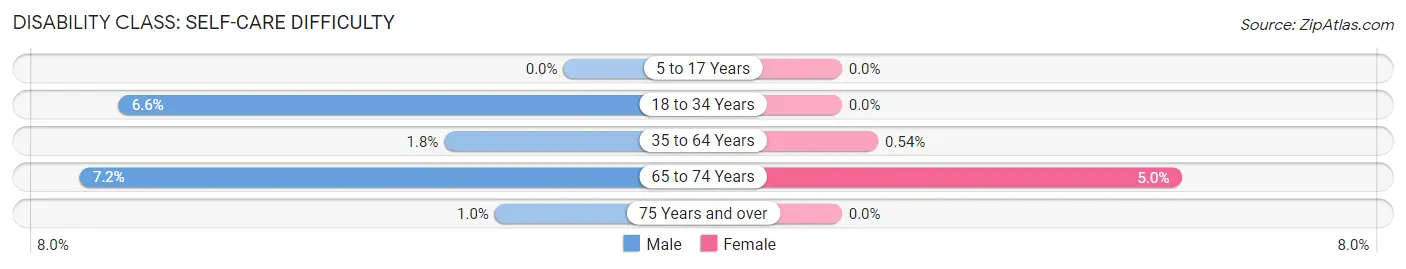
| Age Bracket | Male | Female |
| 5 to 17 Years | 0 (0.0%) | 0 (0.0%) |
| 18 to 34 Years | 7 (6.6%) | 0 (0.0%) |
| 35 to 64 Years | 8 (1.8%) | 2 (0.5%) |
| 65 to 74 Years | 13 (7.2%) | 7 (5.0%) |
| 75 Years and over | 1 (1.0%) | 0 (0.0%) |
Technology Access in Judith Basin County
Computing Device Access in Judith Basin County
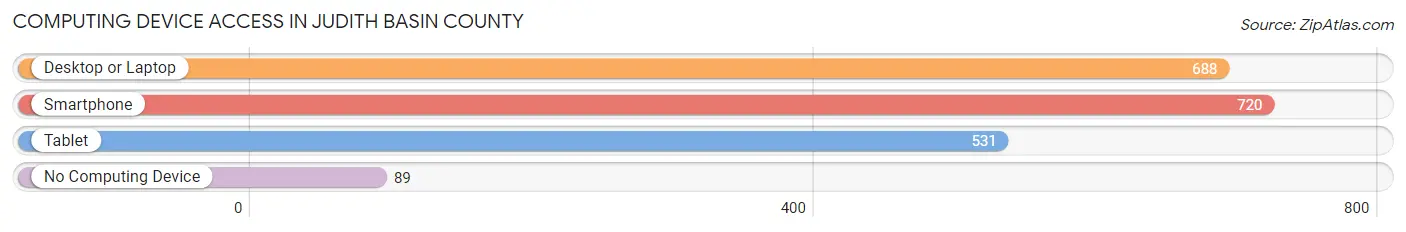
| Device Type | # Households | % Households |
| Desktop or Laptop | 688 | 76.6% |
| Smartphone | 720 | 80.2% |
| Tablet | 531 | 59.1% |
| No Computing Device | 89 | 9.9% |
| Total | 898 | 100.0% |
Internet Access in Judith Basin County
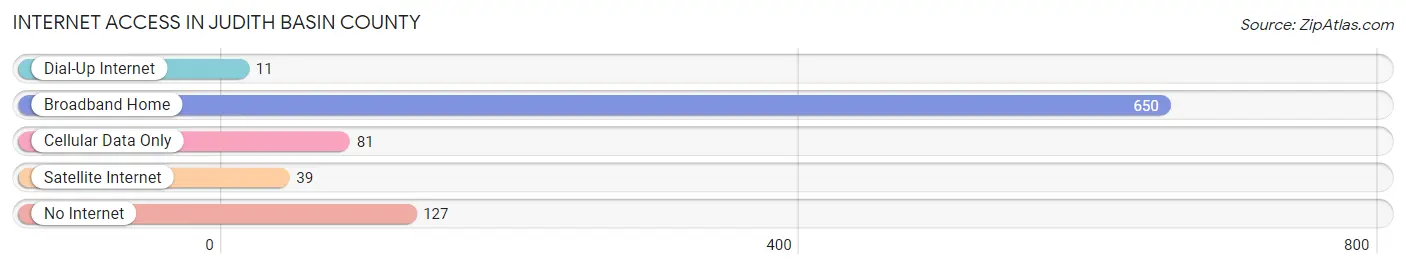
| Internet Type | # Households | % Households |
| Dial-Up Internet | 11 | 1.2% |
| Broadband Home | 650 | 72.4% |
| Cellular Data Only | 81 | 9.0% |
| Satellite Internet | 39 | 4.3% |
| No Internet | 127 | 14.1% |
| Total | 898 | 100.0% |
Judith Basin County Summary
Judith Basin County is located in the central part of Montana, in the United States. It is bordered by Fergus County to the north, Musselshell County to the east, Wheatland County to the south, and Cascade County to the west. The county seat is Stanford, and the largest city is Hobson. The county was created in 1919 from parts of Fergus and Musselshell counties.
Geography
Judith Basin County covers an area of 1,845 square miles, making it the fourth-largest county in Montana. The county is located in the Central Plains region of Montana, and is mostly flat with rolling hills. The Judith River runs through the county, and the Judith Mountains are located in the western part of the county. The county is home to several lakes, including Lake Elwell, Lake Elmo, and Lake Francis.
The climate of Judith Basin County is semi-arid, with hot summers and cold winters. The average annual precipitation is 12.5 inches, and the average annual snowfall is 24.5 inches.
Demographics
As of the 2010 census, Judith Basin County had a population of 1,945. The racial makeup of the county was 95.2% White, 0.2% African American, 1.2% Native American, 0.2% Asian, 0.1% Pacific Islander, 0.7% from other races, and 2.0% from two or more races. Hispanic or Latino of any race were 2.2% of the population.
The median income for a household in the county was $35,938, and the median income for a family was $41,250. The per capita income for the county was $17,845. About 11.2% of families and 14.2% of the population were below the poverty line, including 17.2% of those under age 18 and 8.2% of those age 65 or over.
Economy
Agriculture is the main economic activity in Judith Basin County. The county is home to several large ranches, and the main crops grown in the county are wheat, barley, and hay. Cattle ranching is also an important part of the economy.
The county is also home to several small businesses, including a few restaurants, a grocery store, and a few gas stations. The county is also home to a few tourist attractions, including the Judith Mountains Scenic Byway and the Judith River Wildlife Management Area.
History
The area that is now Judith Basin County was first inhabited by the Blackfeet and Gros Ventre tribes. The first white settlers arrived in the area in the late 1800s, and the county was officially established in 1919.
The county was named after the Judith River, which was named by the Lewis and Clark Expedition in 1805. The county seat of Stanford was named after the railroad tycoon Leland Stanford.
In the early 1900s, the county was home to several large ranches, and the economy was largely based on agriculture. The county was also home to several small towns, including Hobson, Stanford, and Utica.
In the 1950s, the county began to experience a population decline as people moved away to larger cities. The population of the county has remained relatively stable since then, and the economy is still largely based on agriculture.
Common Questions
What is the Total Population of Judith Basin County?
Total Population of Judith Basin County is 2,039.
What is the Total Male Population of Judith Basin County?
Total Male Population of Judith Basin County is 1,131.
What is the Total Female Population of Judith Basin County?
Total Female Population of Judith Basin County is 908.
What is the Ratio of Males per 100 Females in Judith Basin County?
There are 124.56 Males per 100 Females in Judith Basin County.
What is the Ratio of Females per 100 Males in Judith Basin County?
There are 80.28 Females per 100 Males in Judith Basin County.
What is the Median Population Age in Judith Basin County?
Median Population Age in Judith Basin County is 50.2 Years.
What is the Average Family Size in Judith Basin County
Average Family Size in Judith Basin County is 2.9 People.
What is the Average Household Size in Judith Basin County
Average Household Size in Judith Basin County is 2.3 People.
What is Per Capita Income in Judith Basin County?
Per Capita income in Judith Basin County is $36,713.
What is the Median Family Income in Judith Basin County?
Median Family Income in Judith Basin County is $76,406.
What is the Median Household income in Judith Basin County?
Median Household Income in Judith Basin County is $58,750.
What is Income or Wage Gap in Judith Basin County?
Income or Wage Gap in Judith Basin County is 22.6%.
Women in Judith Basin County earn 77.4 cents for every dollar earned by a man.
What is Inequality or Gini Index in Judith Basin County?
Inequality or Gini Index in Judith Basin County is 0.50.
How Large is the Labor Force in Judith Basin County?
There are 1,020 People in the Labor Forcein in Judith Basin County.
What is the Percentage of People in the Labor Force in Judith Basin County?
62.6% of People are in the Labor Force in Judith Basin County.
What is the Unemployment Rate in Judith Basin County?
Unemployment Rate in Judith Basin County is 2.4%.