Granite County, MT
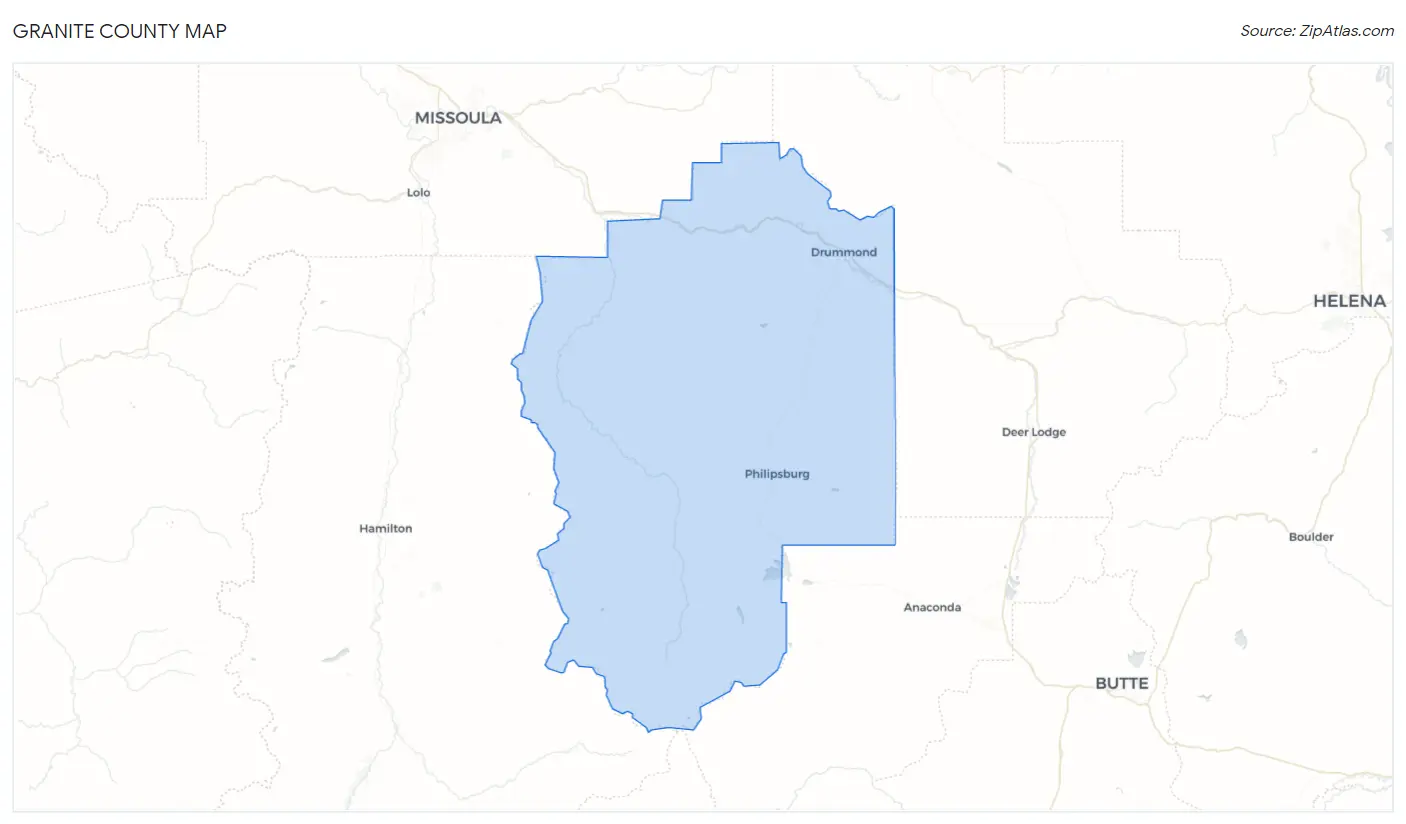
Granite County Map
Granite County Overview
3,368
TOTAL POPULATION
1,724
MALE POPULATION
1,644
FEMALE POPULATION
104.87
MALES / 100 FEMALES
95.36
FEMALES / 100 MALES
54.7
MEDIAN AGE
2.9
AVG FAMILY SIZE
2.4
AVG HOUSEHOLD SIZE
$33,776
PER CAPITA INCOME
$65,885
AVG FAMILY INCOME
$53,917
AVG HOUSEHOLD INCOME
12.4%
WAGE / INCOME GAP [ % ]
87.6¢/ $1
WAGE / INCOME GAP [ $ ]
0.49
INEQUALITY / GINI INDEX
1,398
LABOR FORCE [ PEOPLE ]
47.9%
PERCENT IN LABOR FORCE
5.7%
UNEMPLOYMENT RATE
Granite County Area Codes
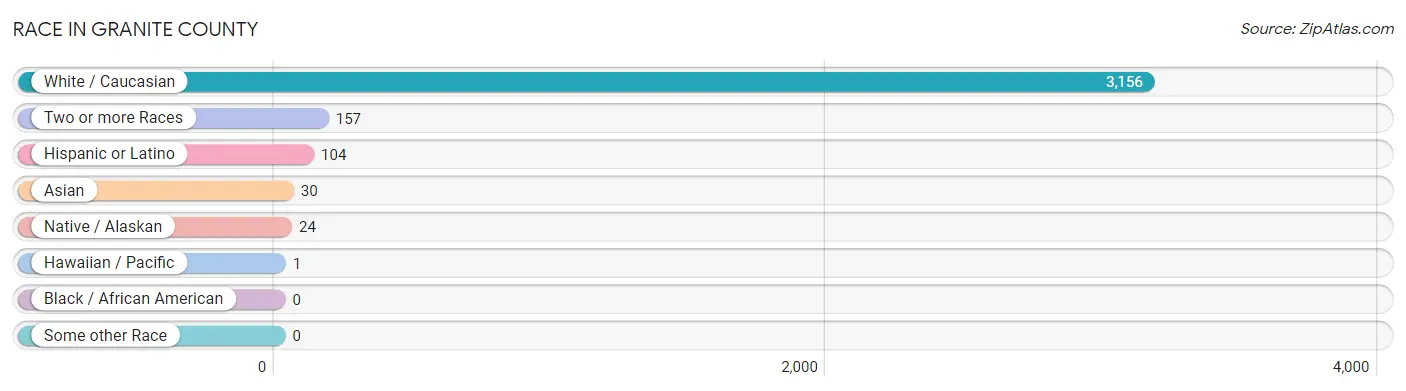
Race in Granite County
The most populous races in Granite County are White / Caucasian (3,156 | 93.7%), Two or more Races (157 | 4.7%), and Hispanic or Latino (104 | 3.1%).
| Race | # Population | % Population |
| Asian | 30 | 0.9% |
| Black / African American | 0 | 0.0% |
| Hawaiian / Pacific | 1 | 0.0% |
| Hispanic or Latino | 104 | 3.1% |
| Native / Alaskan | 24 | 0.7% |
| White / Caucasian | 3,156 | 93.7% |
| Two or more Races | 157 | 4.7% |
| Some other Race | 0 | 0.0% |
| Total | 3,368 | 100.0% |
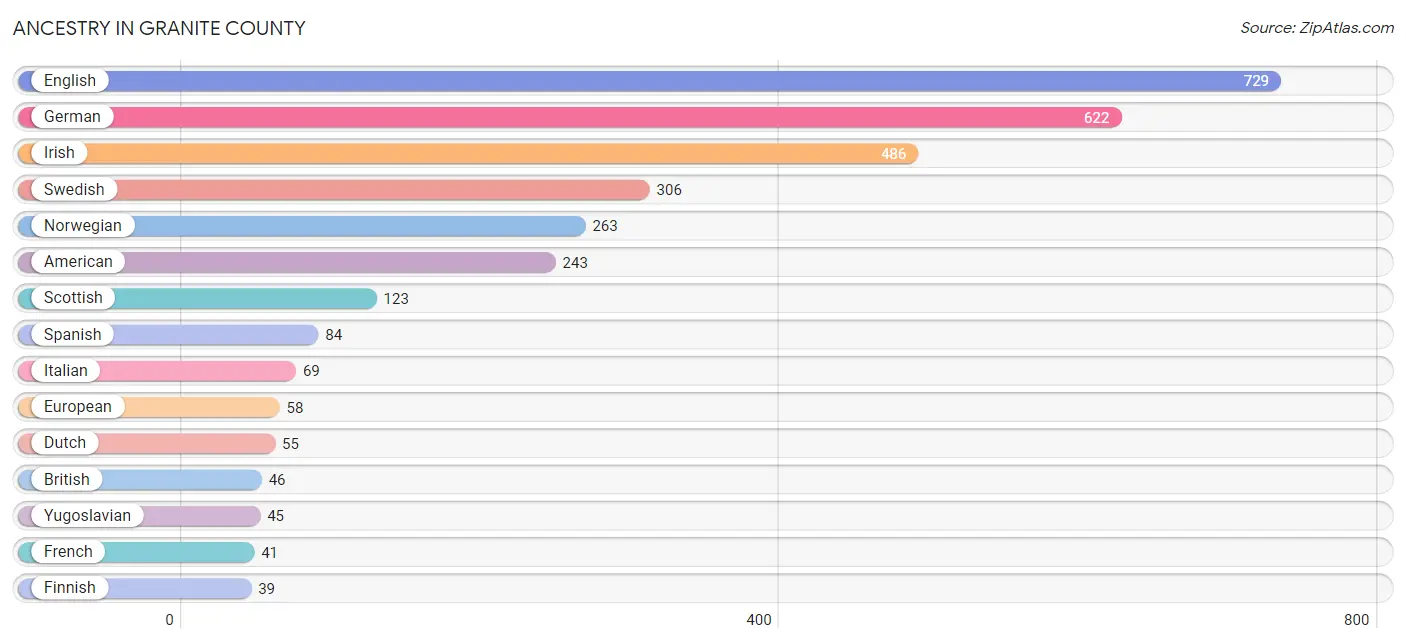
Ancestry in Granite County
The most populous ancestries reported in Granite County are English (729 | 21.6%), German (622 | 18.5%), Irish (486 | 14.4%), Swedish (306 | 9.1%), and Norwegian (263 | 7.8%), together accounting for 71.4% of all Granite County residents.
| Ancestry | # Population | % Population |
| American | 243 | 7.2% |
| Belgian | 11 | 0.3% |
| Blackfeet | 6 | 0.2% |
| British | 46 | 1.4% |
| Burmese | 8 | 0.2% |
| Cheyenne | 6 | 0.2% |
| Chippewa | 13 | 0.4% |
| Crow | 1 | 0.0% |
| Czech | 16 | 0.5% |
| Czechoslovakian | 2 | 0.1% |
| Danish | 15 | 0.4% |
| Dutch | 55 | 1.6% |
| English | 729 | 21.6% |
| European | 58 | 1.7% |
| Finnish | 39 | 1.2% |
| French | 41 | 1.2% |
| French Canadian | 19 | 0.6% |
| German | 622 | 18.5% |
| Hungarian | 7 | 0.2% |
| Indian (Asian) | 22 | 0.6% |
| Iranian | 1 | 0.0% |
| Irish | 486 | 14.4% |
| Italian | 69 | 2.1% |
| Kiowa | 9 | 0.3% |
| Mexican | 4 | 0.1% |
| Native Hawaiian | 1 | 0.0% |
| Northern European | 31 | 0.9% |
| Norwegian | 263 | 7.8% |
| Pennsylvania German | 5 | 0.2% |
| Polish | 34 | 1.0% |
| Portuguese | 4 | 0.1% |
| Puerto Rican | 12 | 0.4% |
| Russian | 2 | 0.1% |
| Scandinavian | 13 | 0.4% |
| Scotch-Irish | 8 | 0.2% |
| Scottish | 123 | 3.6% |
| Slovak | 5 | 0.2% |
| Slovene | 2 | 0.1% |
| Spanish | 84 | 2.5% |
| Swedish | 306 | 9.1% |
| Swiss | 16 | 0.5% |
| Welsh | 15 | 0.4% |
| Yugoslavian | 45 | 1.3% | View All 43 Rows |
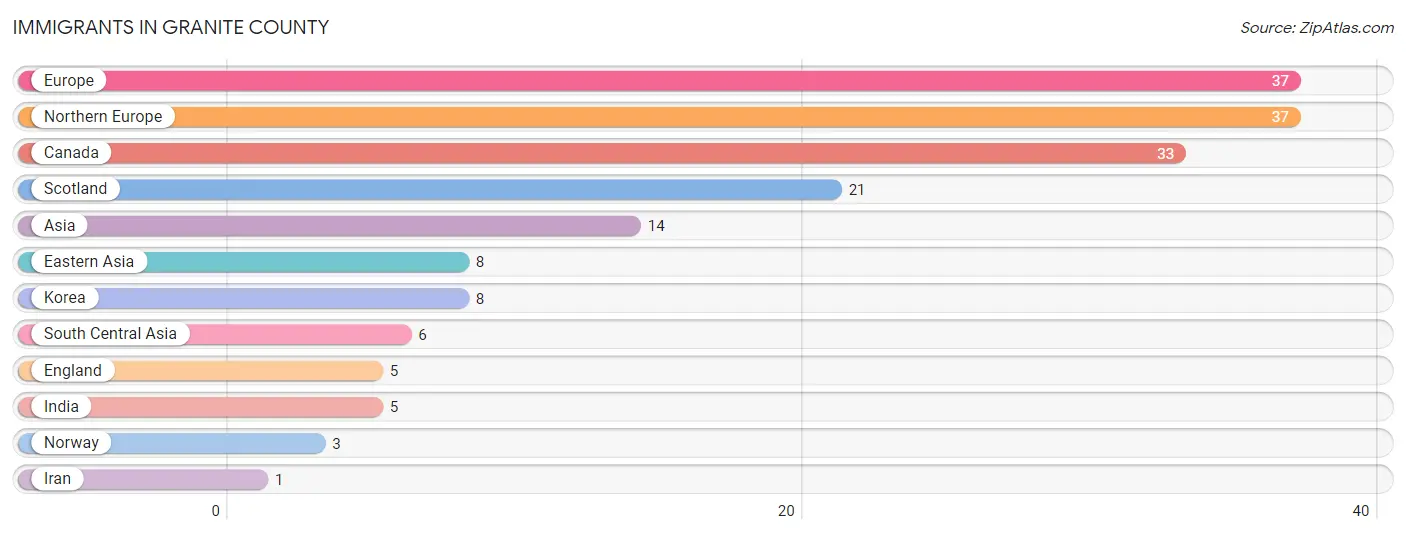
Immigrants in Granite County
The most numerous immigrant groups reported in Granite County came from Europe (37 | 1.1%), Northern Europe (37 | 1.1%), Canada (33 | 1.0%), Scotland (21 | 0.6%), and Asia (14 | 0.4%), together accounting for 4.2% of all Granite County residents.
| Immigration Origin | # Population | % Population |
| Asia | 14 | 0.4% |
| Canada | 33 | 1.0% |
| Eastern Asia | 8 | 0.2% |
| England | 5 | 0.2% |
| Europe | 37 | 1.1% |
| India | 5 | 0.2% |
| Iran | 1 | 0.0% |
| Korea | 8 | 0.2% |
| Northern Europe | 37 | 1.1% |
| Norway | 3 | 0.1% |
| Scotland | 21 | 0.6% |
| South Central Asia | 6 | 0.2% | View All 12 Rows |
Sex and Age in Granite County
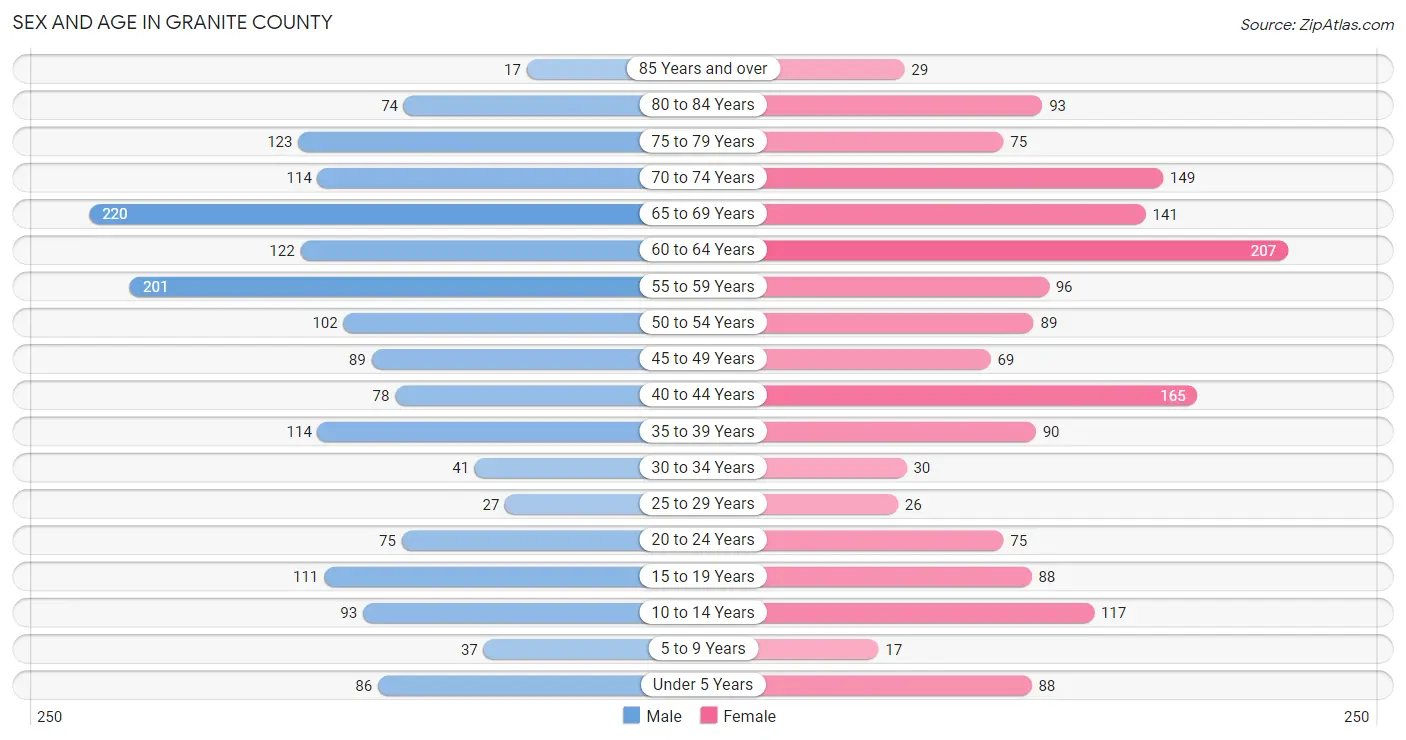
Sex and Age in Granite County
The most populous age groups in Granite County are 65 to 69 Years (220 | 12.8%) for men and 60 to 64 Years (207 | 12.6%) for women.
| Age Bracket | Male | Female |
| Under 5 Years | 86 (5.0%) | 88 (5.3%) |
| 5 to 9 Years | 37 (2.1%) | 17 (1.0%) |
| 10 to 14 Years | 93 (5.4%) | 117 (7.1%) |
| 15 to 19 Years | 111 (6.4%) | 88 (5.3%) |
| 20 to 24 Years | 75 (4.3%) | 75 (4.6%) |
| 25 to 29 Years | 27 (1.6%) | 26 (1.6%) |
| 30 to 34 Years | 41 (2.4%) | 30 (1.8%) |
| 35 to 39 Years | 114 (6.6%) | 90 (5.5%) |
| 40 to 44 Years | 78 (4.5%) | 165 (10.0%) |
| 45 to 49 Years | 89 (5.2%) | 69 (4.2%) |
| 50 to 54 Years | 102 (5.9%) | 89 (5.4%) |
| 55 to 59 Years | 201 (11.7%) | 96 (5.8%) |
| 60 to 64 Years | 122 (7.1%) | 207 (12.6%) |
| 65 to 69 Years | 220 (12.8%) | 141 (8.6%) |
| 70 to 74 Years | 114 (6.6%) | 149 (9.1%) |
| 75 to 79 Years | 123 (7.1%) | 75 (4.6%) |
| 80 to 84 Years | 74 (4.3%) | 93 (5.7%) |
| 85 Years and over | 17 (1.0%) | 29 (1.8%) |
| Total | 1,724 (100.0%) | 1,644 (100.0%) |
Families and Households in Granite County
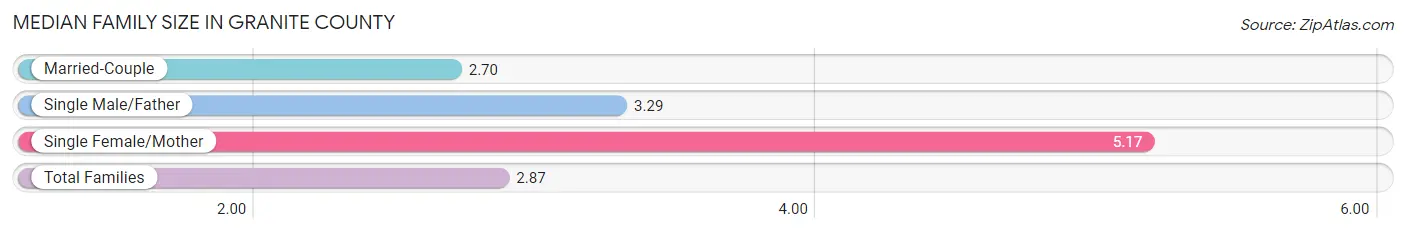
Median Family Size in Granite County
The median family size in Granite County is 2.87 persons per family, with single female/mother families (47 | 5.4%) accounting for the largest median family size of 5.17 persons per family. On the other hand, married-couple families (778 | 89.1%) represent the smallest median family size with 2.70 persons per family.
| Family Type | # Families | Family Size |
| Married-Couple | 778 (89.1%) | 2.70 |
| Single Male/Father | 48 (5.5%) | 3.29 |
| Single Female/Mother | 47 (5.4%) | 5.17 |
| Total Families | 873 (100.0%) | 2.87 |
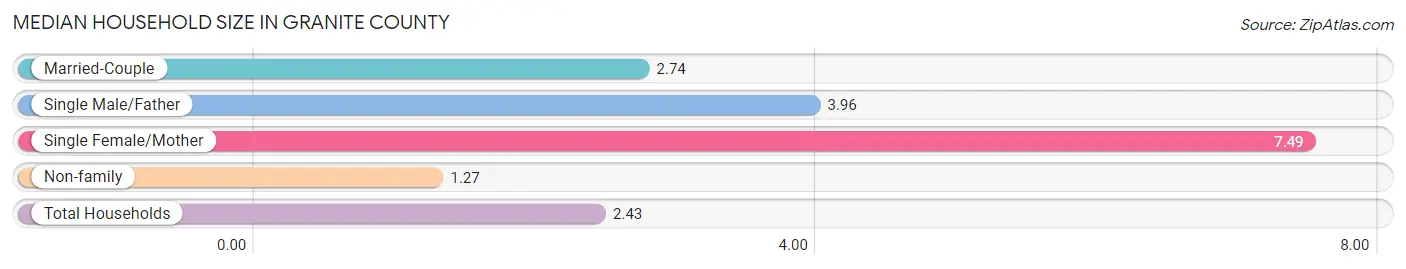
Median Household Size in Granite County
The median household size in Granite County is 2.43 persons per household, with single female/mother households (47 | 3.5%) accounting for the largest median household size of 7.49 persons per household. non-family households (470 | 35.0%) represent the smallest median household size with 1.27 persons per household.
| Household Type | # Households | Household Size |
| Married-Couple | 778 (57.9%) | 2.74 |
| Single Male/Father | 48 (3.6%) | 3.96 |
| Single Female/Mother | 47 (3.5%) | 7.49 |
| Non-family | 470 (35.0%) | 1.27 |
| Total Households | 1,343 (100.0%) | 2.43 |
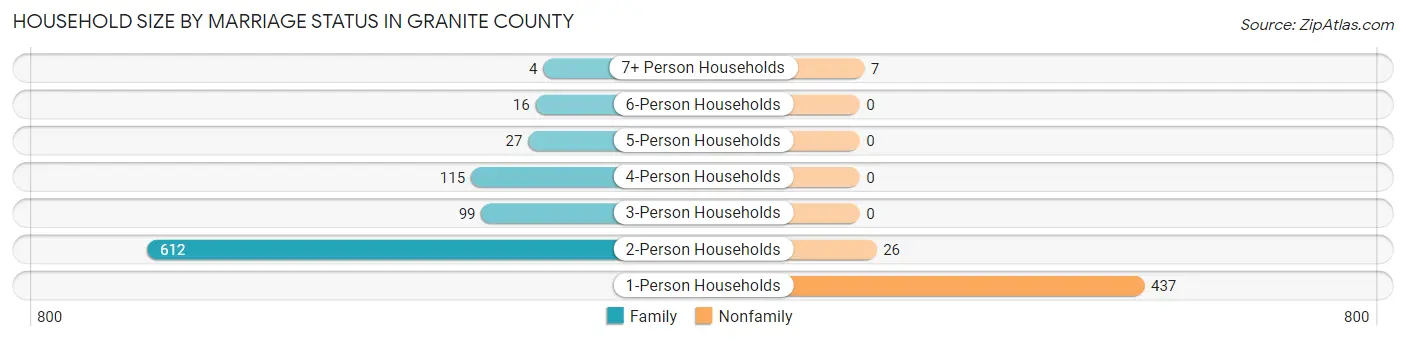
Household Size by Marriage Status in Granite County
Out of a total of 1,343 households in Granite County, 873 (65.0%) are family households, while 470 (35.0%) are nonfamily households. The most numerous type of family households are 2-person households, comprising 612, and the most common type of nonfamily households are 1-person households, comprising 437.
| Household Size | Family Households | Nonfamily Households |
| 1-Person Households | - | 437 (32.5%) |
| 2-Person Households | 612 (45.6%) | 26 (1.9%) |
| 3-Person Households | 99 (7.4%) | 0 (0.0%) |
| 4-Person Households | 115 (8.6%) | 0 (0.0%) |
| 5-Person Households | 27 (2.0%) | 0 (0.0%) |
| 6-Person Households | 16 (1.2%) | 0 (0.0%) |
| 7+ Person Households | 4 (0.3%) | 7 (0.5%) |
| Total | 873 (65.0%) | 470 (35.0%) |
Female Fertility in Granite County
Fertility by Age in Granite County
Average fertility rate in Granite County is 7.0 births per 1,000 women. Women in the age bracket of 35 to 50 years have the highest fertility rate with 11.0 births per 1,000 women. Women in the age bracket of 35 to 50 years acount for 100.0% of all women with births.
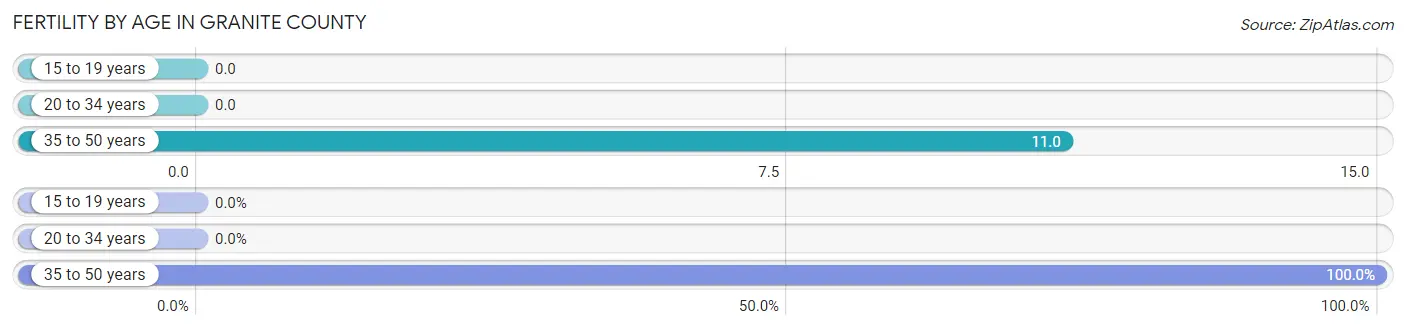
| Age Bracket | Women with Births | Births / 1,000 Women |
| 15 to 19 years | 0 (0.0%) | 0.0 |
| 20 to 34 years | 0 (0.0%) | 0.0 |
| 35 to 50 years | 4 (100.0%) | 11.0 |
| Total | 4 (100.0%) | 7.0 |
Fertility by Age by Marriage Status in Granite County
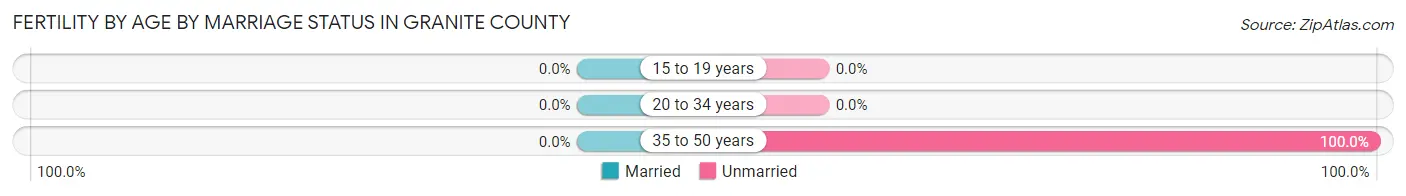
| Age Bracket | Married | Unmarried |
| 15 to 19 years | 0 (0.0%) | 0 (0.0%) |
| 20 to 34 years | 0 (0.0%) | 0 (0.0%) |
| 35 to 50 years | 0 (0.0%) | 4 (100.0%) |
| Total | 0 (0.0%) | 4 (100.0%) |
Fertility by Education in Granite County
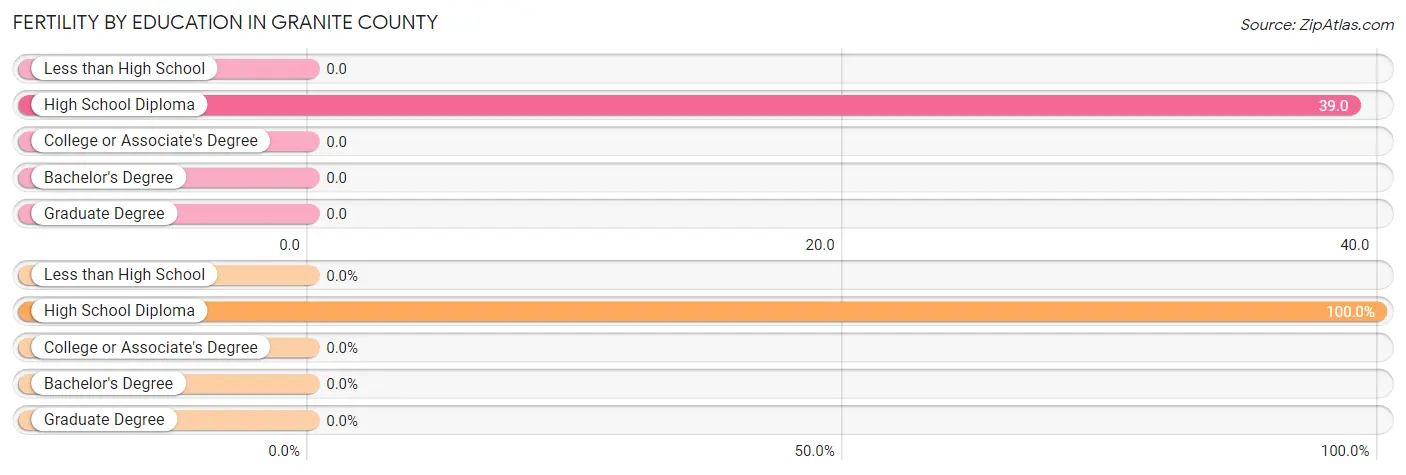
| Educational Attainment | Women with Births | Births / 1,000 Women |
| Less than High School | 0 (0.0%) | 0.0 |
| High School Diploma | 4 (100.0%) | 39.0 |
| College or Associate's Degree | 0 (0.0%) | 0.0 |
| Bachelor's Degree | 0 (0.0%) | 0.0 |
| Graduate Degree | 0 (0.0%) | 0.0 |
| Total | 4 (100.0%) | 7.0 |
Fertility by Education by Marriage Status in Granite County
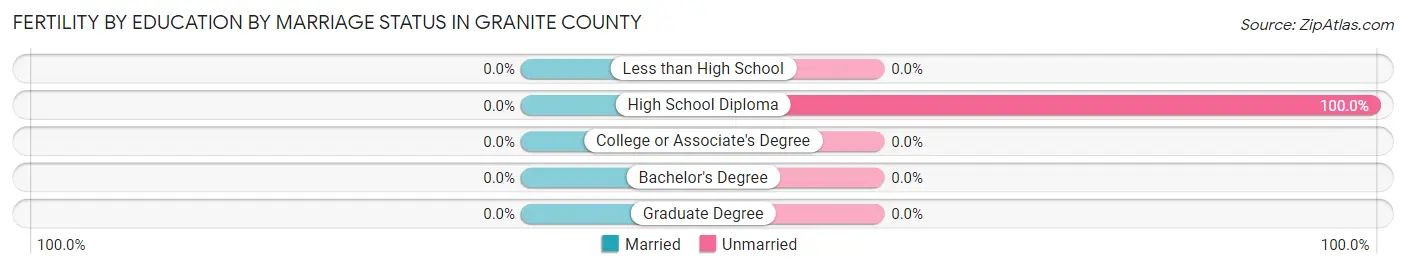
| Educational Attainment | Married | Unmarried |
| Less than High School | 0 (0.0%) | 0 (0.0%) |
| High School Diploma | 0 (0.0%) | 4 (100.0%) |
| College or Associate's Degree | 0 (0.0%) | 0 (0.0%) |
| Bachelor's Degree | 0 (0.0%) | 0 (0.0%) |
| Graduate Degree | 0 (0.0%) | 0 (0.0%) |
| Total | 0 (0.0%) | 4 (100.0%) |
Income in Granite County
Income Overview in Granite County
Per Capita Income in Granite County is $33,776, while median incomes of families and households are $65,885 and $53,917 respectively.
| Characteristic | Number | Measure |
| Per Capita Income | 3,368 | $33,776 |
| Median Family Income | 873 | $65,885 |
| Mean Family Income | 873 | $94,420 |
| Median Household Income | 1,343 | $53,917 |
| Mean Household Income | 1,343 | $79,413 |
| Income Deficit | 873 | $0 |
| Wage / Income Gap (%) | 3,368 | 12.43% |
| Wage / Income Gap ($) | 3,368 | 87.57¢ per $1 |
| Gini / Inequality Index | 3,368 | 0.49 |
Earnings by Sex in Granite County
Average Earnings in Granite County are $29,563, $31,518 for men and $27,599 for women, a difference of 12.4%.
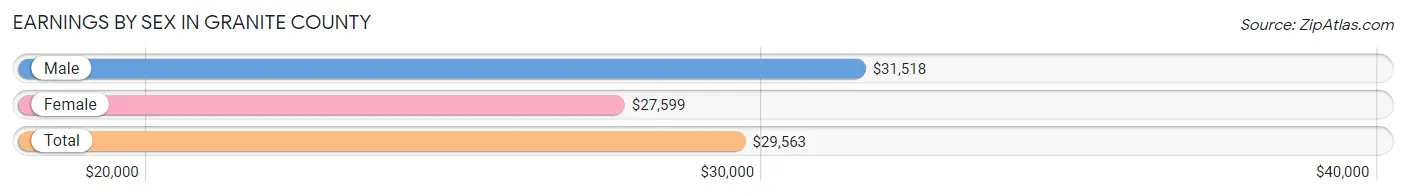
| Sex | Number | Average Earnings |
| Male | 763 (51.4%) | $31,518 |
| Female | 721 (48.6%) | $27,599 |
| Total | 1,484 (100.0%) | $29,563 |
Earnings by Sex by Income Bracket in Granite County
The most common earnings brackets in Granite County are $100,000+ for men (98 | 12.8%) and $55,000 to $64,999 for women (102 | 14.1%).
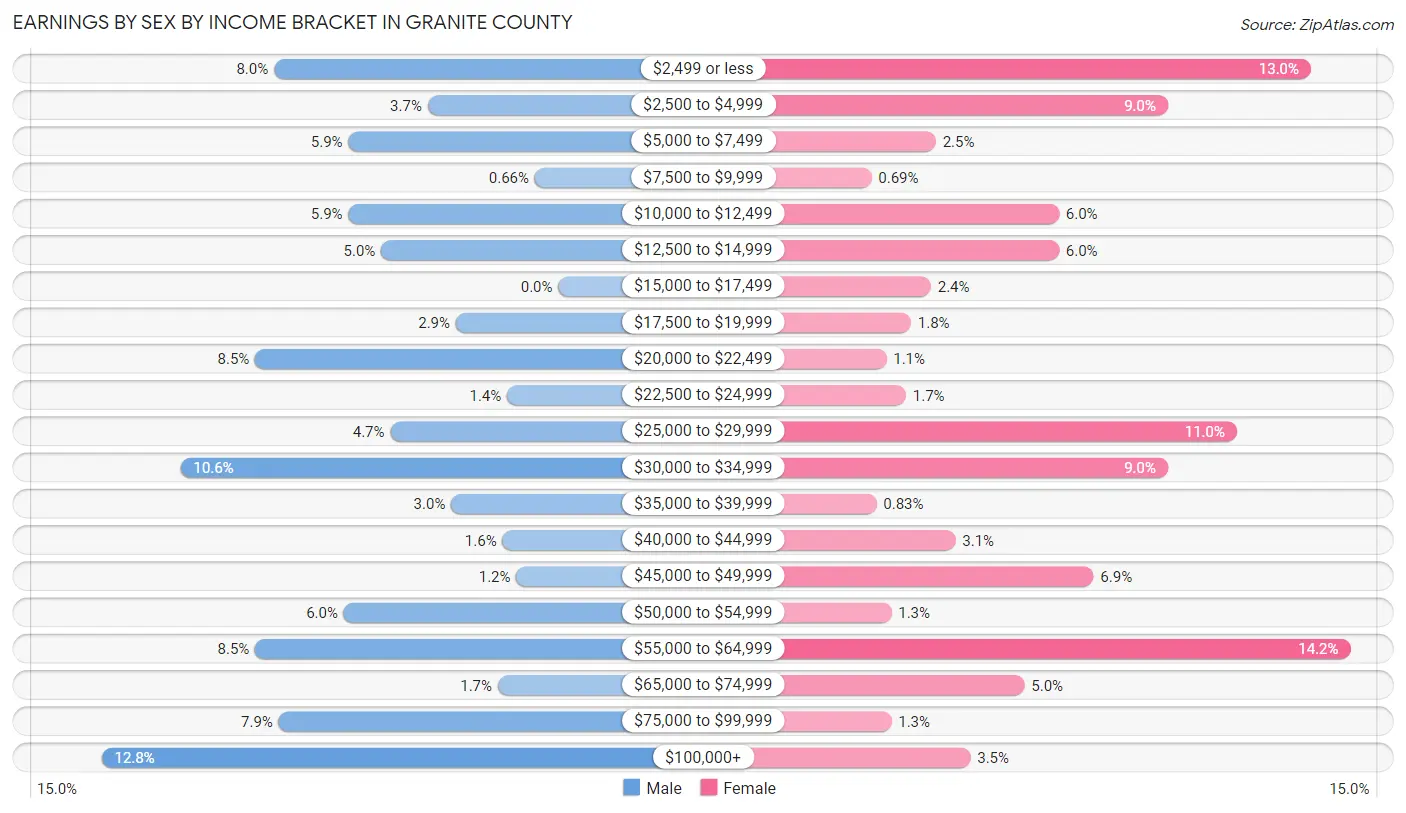
| Income | Male | Female |
| $2,499 or less | 61 (8.0%) | 94 (13.0%) |
| $2,500 to $4,999 | 28 (3.7%) | 65 (9.0%) |
| $5,000 to $7,499 | 45 (5.9%) | 18 (2.5%) |
| $7,500 to $9,999 | 5 (0.7%) | 5 (0.7%) |
| $10,000 to $12,499 | 45 (5.9%) | 43 (6.0%) |
| $12,500 to $14,999 | 38 (5.0%) | 43 (6.0%) |
| $15,000 to $17,499 | 0 (0.0%) | 17 (2.4%) |
| $17,500 to $19,999 | 22 (2.9%) | 13 (1.8%) |
| $20,000 to $22,499 | 65 (8.5%) | 8 (1.1%) |
| $22,500 to $24,999 | 11 (1.4%) | 12 (1.7%) |
| $25,000 to $29,999 | 36 (4.7%) | 79 (11.0%) |
| $30,000 to $34,999 | 81 (10.6%) | 65 (9.0%) |
| $35,000 to $39,999 | 23 (3.0%) | 6 (0.8%) |
| $40,000 to $44,999 | 12 (1.6%) | 22 (3.0%) |
| $45,000 to $49,999 | 9 (1.2%) | 50 (6.9%) |
| $50,000 to $54,999 | 46 (6.0%) | 9 (1.3%) |
| $55,000 to $64,999 | 65 (8.5%) | 102 (14.1%) |
| $65,000 to $74,999 | 13 (1.7%) | 36 (5.0%) |
| $75,000 to $99,999 | 60 (7.9%) | 9 (1.3%) |
| $100,000+ | 98 (12.8%) | 25 (3.5%) |
| Total | 763 (100.0%) | 721 (100.0%) |
Earnings by Sex by Educational Attainment in Granite County
Average earnings in Granite County are $36,806 for men and $32,159 for women, a difference of 12.6%. Men with an educational attainment of college or associate's degree enjoy the highest average annual earnings of $39,750, while those with bachelor's degree education earn the least with $31,875. Women with an educational attainment of less than high school earn the most with the average annual earnings of $58,021, while those with college or associate's degree education have the smallest earnings of $27,009.
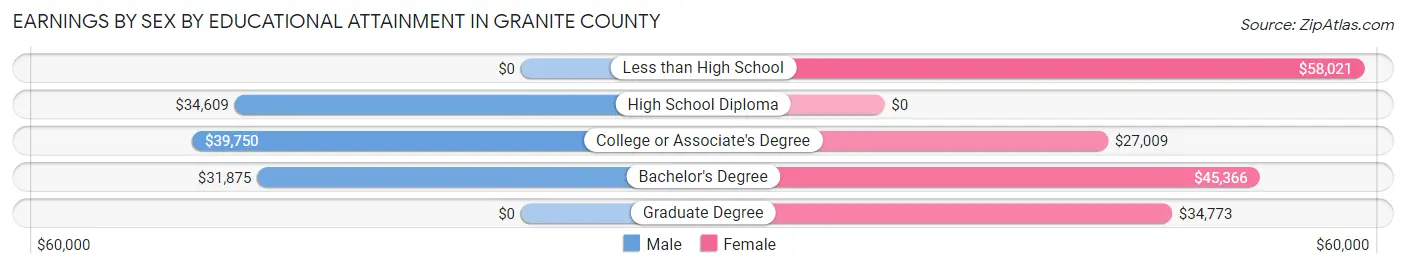
| Educational Attainment | Male Income | Female Income |
| Less than High School | - | - |
| High School Diploma | $34,609 | $0 |
| College or Associate's Degree | $39,750 | $27,009 |
| Bachelor's Degree | $31,875 | $45,366 |
| Graduate Degree | - | - |
| Total | $36,806 | $32,159 |
Family Income in Granite County
Family Income Brackets in Granite County
According to the Granite County family income data, there are 281 families falling into the $50,000 to $74,999 income range, which is the most common income bracket and makes up 32.2% of all families. Conversely, the $10,000 to $14,999 income bracket is the least frequent group with only 15 families (1.7%) belonging to this category.
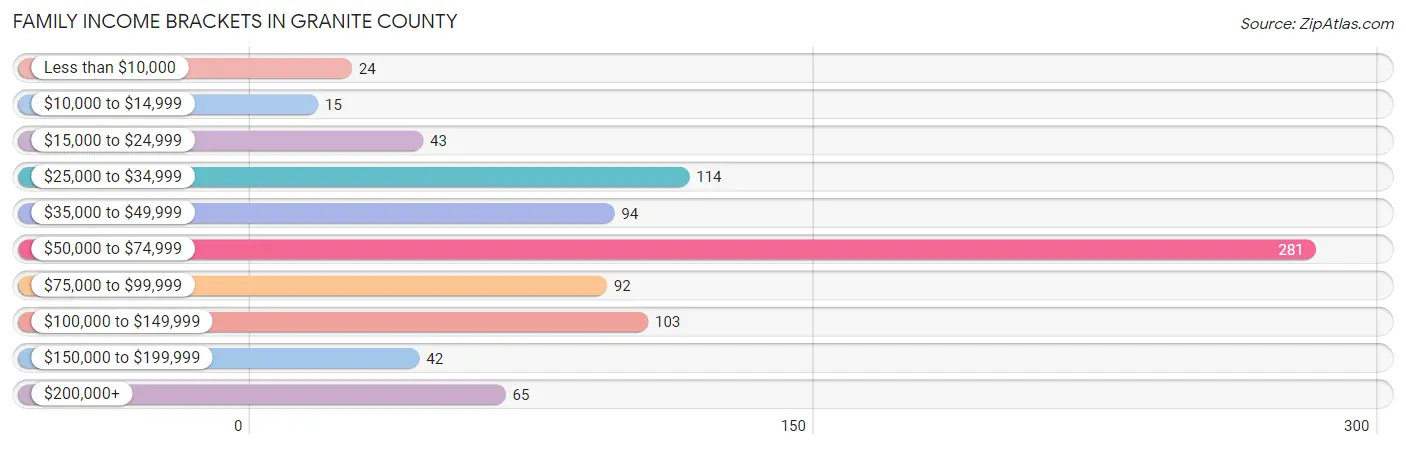
| Income Bracket | # Families | % Families |
| Less than $10,000 | 24 | 2.7% |
| $10,000 to $14,999 | 15 | 1.7% |
| $15,000 to $24,999 | 43 | 4.9% |
| $25,000 to $34,999 | 114 | 13.1% |
| $35,000 to $49,999 | 94 | 10.8% |
| $50,000 to $74,999 | 281 | 32.2% |
| $75,000 to $99,999 | 92 | 10.5% |
| $100,000 to $149,999 | 103 | 11.8% |
| $150,000 to $199,999 | 42 | 4.8% |
| $200,000+ | 65 | 7.4% |
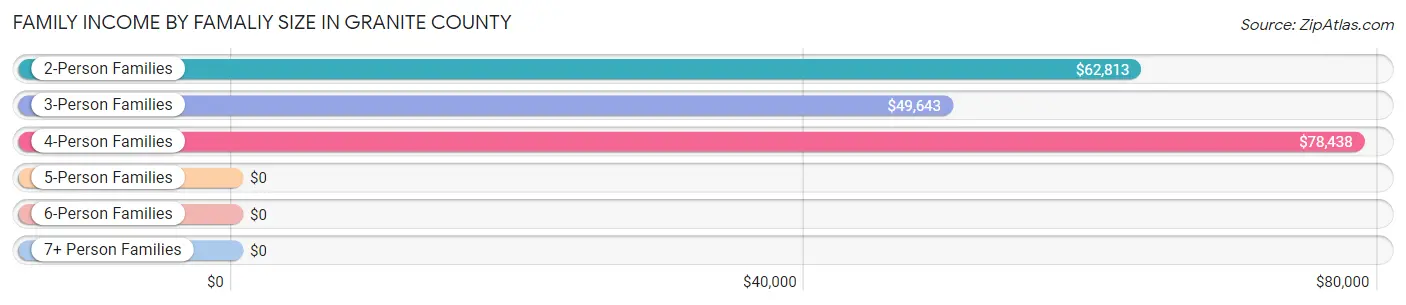
Family Income by Famaliy Size in Granite County
4-person families (89 | 10.2%) account for the highest median family income in Granite County with $78,438 per family, while 2-person families (643 | 73.7%) have the highest median income of $31,406 per family member.
| Income Bracket | # Families | Median Income |
| 2-Person Families | 643 (73.7%) | $62,813 |
| 3-Person Families | 94 (10.8%) | $49,643 |
| 4-Person Families | 89 (10.2%) | $78,438 |
| 5-Person Families | 40 (4.6%) | $0 |
| 6-Person Families | 7 (0.8%) | $0 |
| 7+ Person Families | 0 (0.0%) | $0 |
| Total | 873 (100.0%) | $65,885 |
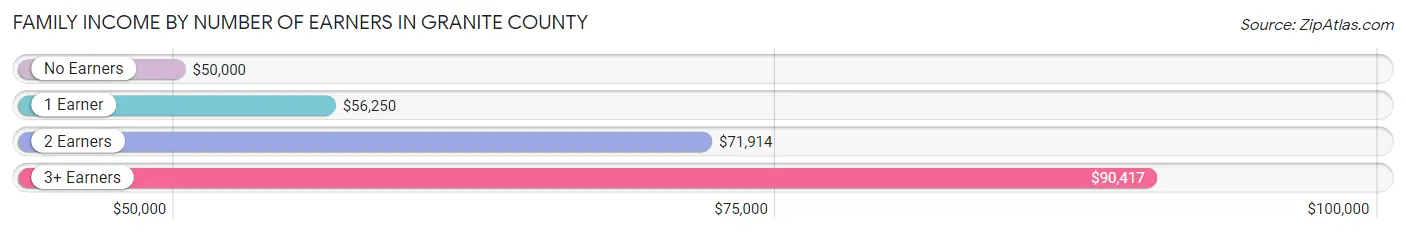
Family Income by Number of Earners in Granite County
The median family income in Granite County is $65,885, with families comprising 3+ earners (59) having the highest median family income of $90,417, while families with no earners (292) have the lowest median family income of $50,000, accounting for 6.8% and 33.5% of families, respectively.
| Number of Earners | # Families | Median Income |
| No Earners | 292 (33.5%) | $50,000 |
| 1 Earner | 265 (30.4%) | $56,250 |
| 2 Earners | 257 (29.4%) | $71,914 |
| 3+ Earners | 59 (6.8%) | $90,417 |
| Total | 873 (100.0%) | $65,885 |
Household Income in Granite County
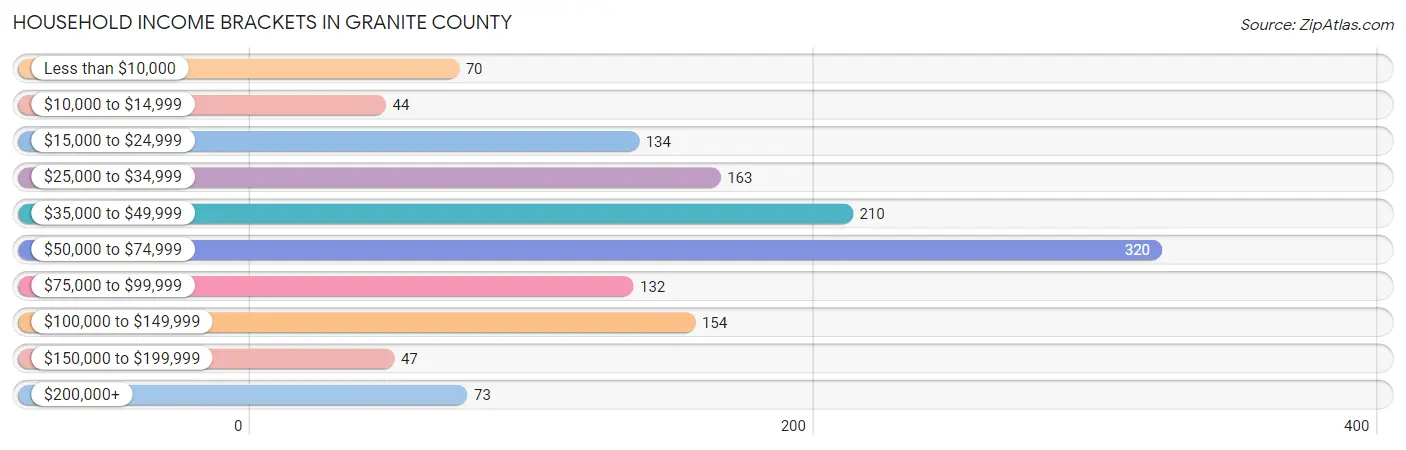
Household Income Brackets in Granite County
With 320 households falling in the category, the $50,000 to $74,999 income range is the most frequent in Granite County, accounting for 23.8% of all households. In contrast, only 44 households (3.3%) fall into the $10,000 to $14,999 income bracket, making it the least populous group.
| Income Bracket | # Households | % Households |
| Less than $10,000 | 70 | 5.2% |
| $10,000 to $14,999 | 44 | 3.3% |
| $15,000 to $24,999 | 134 | 10.0% |
| $25,000 to $34,999 | 163 | 12.1% |
| $35,000 to $49,999 | 210 | 15.6% |
| $50,000 to $74,999 | 320 | 23.8% |
| $75,000 to $99,999 | 132 | 9.8% |
| $100,000 to $149,999 | 154 | 11.5% |
| $150,000 to $199,999 | 47 | 3.5% |
| $200,000+ | 73 | 5.4% |
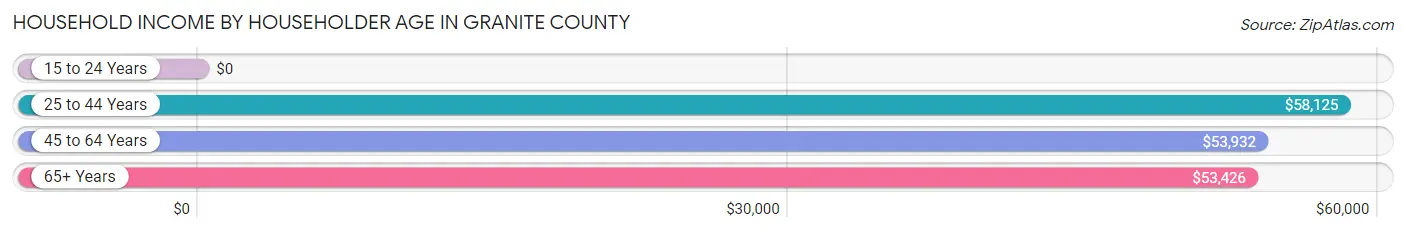
Household Income by Householder Age in Granite County
The median household income in Granite County is $53,917, with the highest median household income of $58,125 found in the 25 to 44 years age bracket for the primary householder. A total of 253 households (18.8%) fall into this category. Meanwhile, the 15 to 24 years age bracket for the primary householder has the lowest median household income of $0, with 5 households (0.4%) in this group.
| Income Bracket | # Households | Median Income |
| 15 to 24 Years | 5 (0.4%) | $0 |
| 25 to 44 Years | 253 (18.8%) | $58,125 |
| 45 to 64 Years | 481 (35.8%) | $53,932 |
| 65+ Years | 604 (45.0%) | $53,426 |
| Total | 1,343 (100.0%) | $53,917 |
Poverty in Granite County
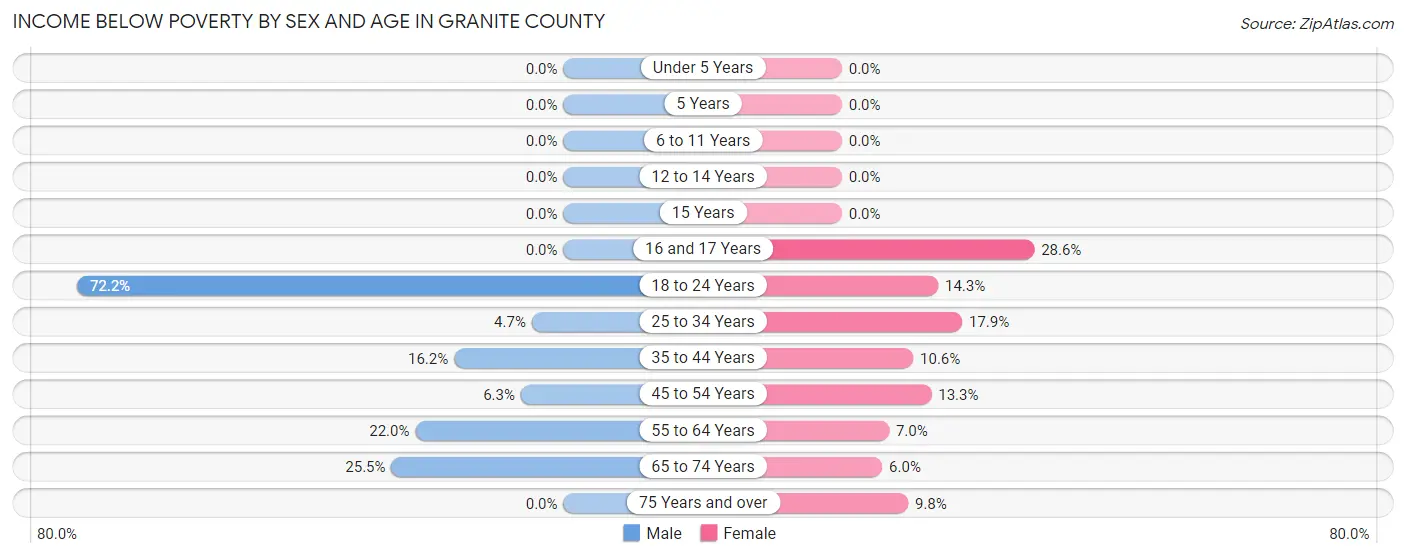
Income Below Poverty by Sex and Age in Granite County
With 17.3% poverty level for males and 8.7% for females among the residents of Granite County, 18 to 24 year old males and 16 and 17 year old females are the most vulnerable to poverty, with 91 males (72.2%) and 10 females (28.6%) in their respective age groups living below the poverty level.
| Age Bracket | Male | Female |
| Under 5 Years | 0 (0.0%) | 0 (0.0%) |
| 5 Years | 0 (0.0%) | 0 (0.0%) |
| 6 to 11 Years | 0 (0.0%) | 0 (0.0%) |
| 12 to 14 Years | 0 (0.0%) | 0 (0.0%) |
| 15 Years | 0 (0.0%) | 0 (0.0%) |
| 16 and 17 Years | 0 (0.0%) | 10 (28.6%) |
| 18 to 24 Years | 91 (72.2%) | 16 (14.3%) |
| 25 to 34 Years | 3 (4.7%) | 10 (17.9%) |
| 35 to 44 Years | 31 (16.2%) | 27 (10.6%) |
| 45 to 54 Years | 12 (6.3%) | 21 (13.3%) |
| 55 to 64 Years | 71 (22.0%) | 21 (7.0%) |
| 65 to 74 Years | 83 (25.5%) | 17 (6.0%) |
| 75 Years and over | 0 (0.0%) | 18 (9.8%) |
| Total | 291 (17.3%) | 140 (8.7%) |
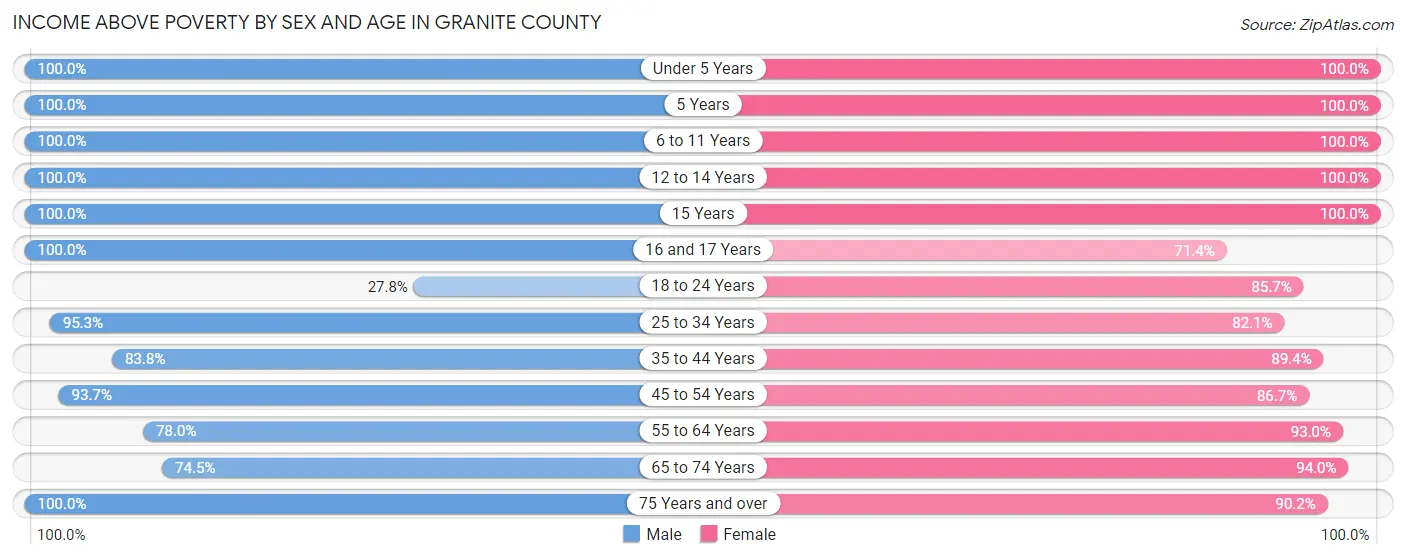
Income Above Poverty by Sex and Age in Granite County
According to the poverty statistics in Granite County, males aged under 5 years and females aged under 5 years are the age groups that are most secure financially, with 100.0% of males and 100.0% of females in these age groups living above the poverty line.
| Age Bracket | Male | Female |
| Under 5 Years | 86 (100.0%) | 88 (100.0%) |
| 5 Years | 6 (100.0%) | 3 (100.0%) |
| 6 to 11 Years | 31 (100.0%) | 59 (100.0%) |
| 12 to 14 Years | 72 (100.0%) | 67 (100.0%) |
| 15 Years | 8 (100.0%) | 4 (100.0%) |
| 16 and 17 Years | 45 (100.0%) | 25 (71.4%) |
| 18 to 24 Years | 35 (27.8%) | 96 (85.7%) |
| 25 to 34 Years | 61 (95.3%) | 46 (82.1%) |
| 35 to 44 Years | 160 (83.8%) | 228 (89.4%) |
| 45 to 54 Years | 178 (93.7%) | 137 (86.7%) |
| 55 to 64 Years | 252 (78.0%) | 279 (93.0%) |
| 65 to 74 Years | 242 (74.5%) | 267 (94.0%) |
| 75 Years and over | 214 (100.0%) | 165 (90.2%) |
| Total | 1,390 (82.7%) | 1,464 (91.3%) |
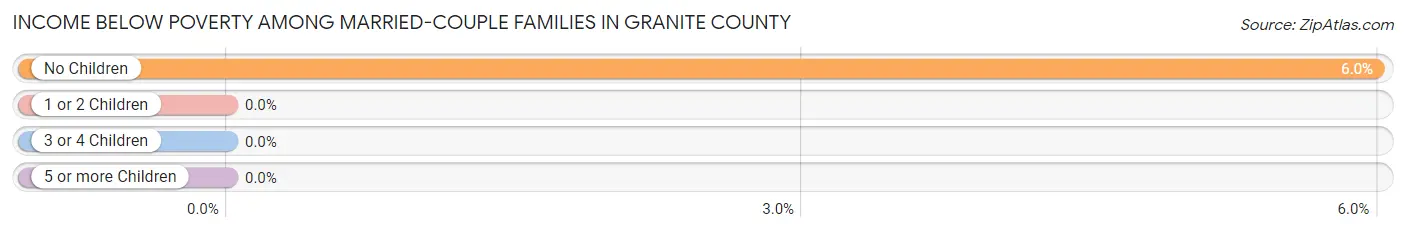
Income Below Poverty Among Married-Couple Families in Granite County
The poverty statistics for married-couple families in Granite County show that 4.8% or 37 of the total 778 families live below the poverty line. Families with no children have the highest poverty rate of 6.0%, comprising of 37 families. On the other hand, families with 1 or 2 children have the lowest poverty rate of 0.0%, which includes 0 families.
| Children | Above Poverty | Below Poverty |
| No Children | 581 (94.0%) | 37 (6.0%) |
| 1 or 2 Children | 137 (100.0%) | 0 (0.0%) |
| 3 or 4 Children | 23 (100.0%) | 0 (0.0%) |
| 5 or more Children | 0 (0.0%) | 0 (0.0%) |
| Total | 741 (95.2%) | 37 (4.8%) |
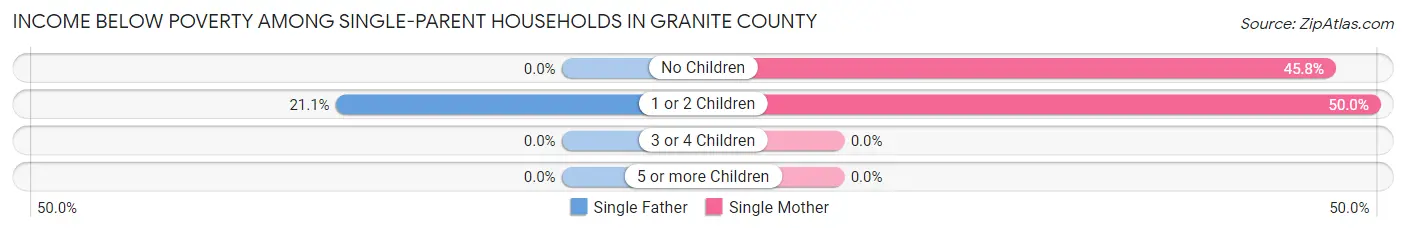
Income Below Poverty Among Single-Parent Households in Granite County
According to the poverty data in Granite County, 8.3% or 4 single-father households and 34.0% or 16 single-mother households are living below the poverty line. Among single-father households, those with 1 or 2 children have the highest poverty rate, with 4 households (21.0%) experiencing poverty. Likewise, among single-mother households, those with 1 or 2 children have the highest poverty rate, with 5 households (50.0%) falling below the poverty line.
| Children | Single Father | Single Mother |
| No Children | 0 (0.0%) | 11 (45.8%) |
| 1 or 2 Children | 4 (21.0%) | 5 (50.0%) |
| 3 or 4 Children | 0 (0.0%) | 0 (0.0%) |
| 5 or more Children | 0 (0.0%) | 0 (0.0%) |
| Total | 4 (8.3%) | 16 (34.0%) |
Income Below Poverty Among Married-Couple vs Single-Parent Households in Granite County
The poverty data for Granite County shows that 37 of the married-couple family households (4.8%) and 20 of the single-parent households (21.0%) are living below the poverty level. Within the married-couple family households, those with no children have the highest poverty rate, with 37 households (6.0%) falling below the poverty line. Among the single-parent households, those with 1 or 2 children have the highest poverty rate, with 9 household (31.0%) living below poverty.
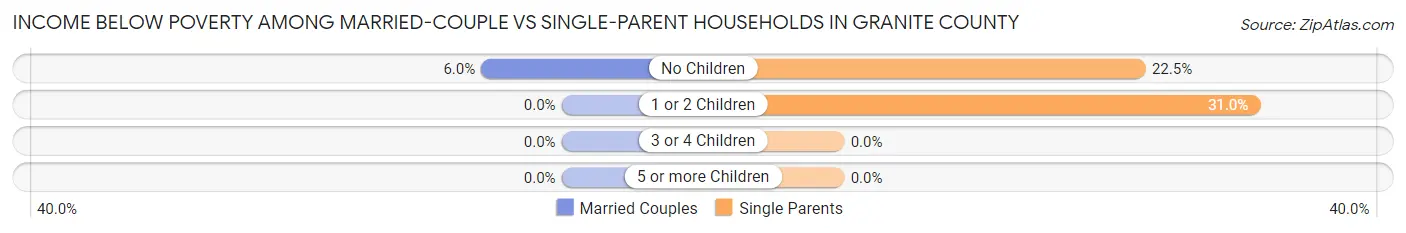
| Children | Married-Couple Families | Single-Parent Households |
| No Children | 37 (6.0%) | 11 (22.5%) |
| 1 or 2 Children | 0 (0.0%) | 9 (31.0%) |
| 3 or 4 Children | 0 (0.0%) | 0 (0.0%) |
| 5 or more Children | 0 (0.0%) | 0 (0.0%) |
| Total | 37 (4.8%) | 20 (21.0%) |
Employment Characteristics in Granite County
Employment by Class of Employer in Granite County
Among the 1,282 employed individuals in Granite County, private company employees (768 | 59.9%), self-employed (incorporated) (154 | 12.0%), and self-employed (not incorporated) (150 | 11.7%) make up the most common classes of employment.
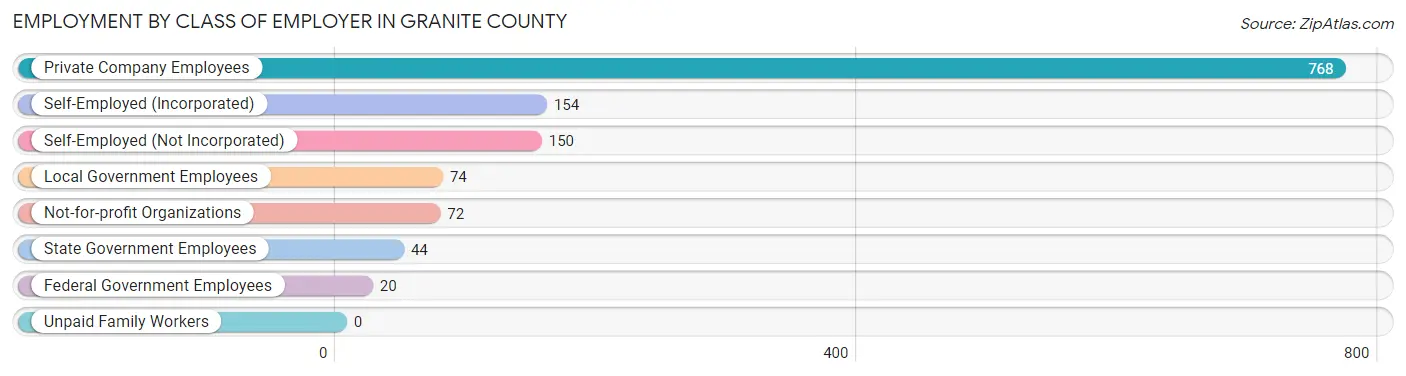
| Employer Class | # Employees | % Employees |
| Private Company Employees | 768 | 59.9% |
| Self-Employed (Incorporated) | 154 | 12.0% |
| Self-Employed (Not Incorporated) | 150 | 11.7% |
| Not-for-profit Organizations | 72 | 5.6% |
| Local Government Employees | 74 | 5.8% |
| State Government Employees | 44 | 3.4% |
| Federal Government Employees | 20 | 1.6% |
| Unpaid Family Workers | 0 | 0.0% |
| Total | 1,282 | 100.0% |
Employment Status by Age in Granite County
According to the labor force statistics for Granite County, out of the total population over 16 years of age (2,918), 47.9% or 1,398 individuals are in the labor force, with 5.7% or 80 of them unemployed. The age group with the highest labor force participation rate is 30 to 34 years, with 98.6% or 70 individuals in the labor force. Within the labor force, the 16 to 19 years age range has the highest percentage of unemployed individuals, with 23.9% or 16 of them being unemployed.
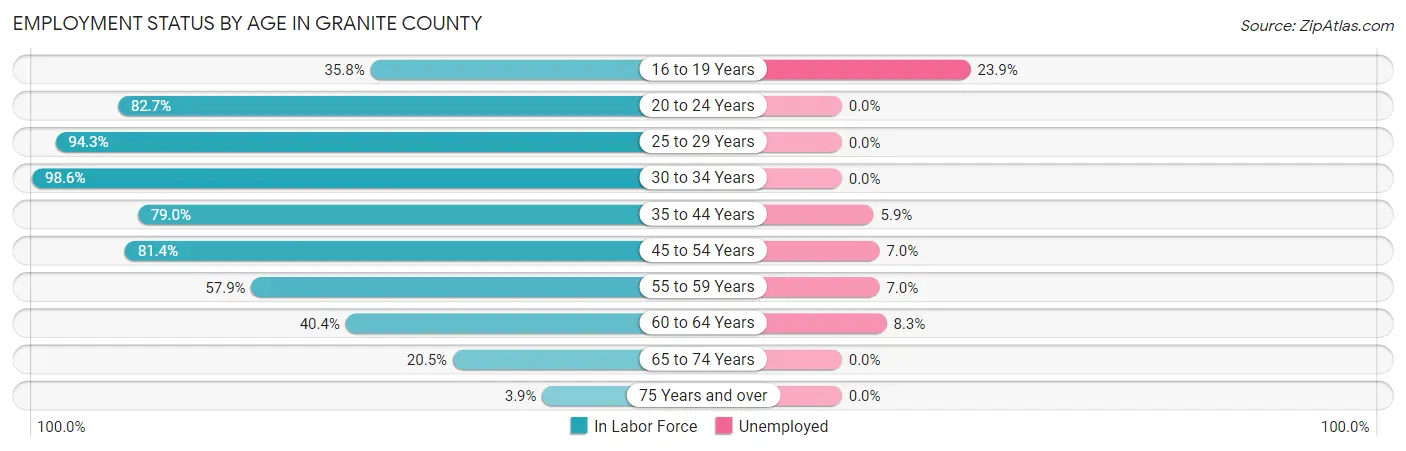
| Age Bracket | In Labor Force | Unemployed |
| 16 to 19 Years | 67 (35.8%) | 16 (23.9%) |
| 20 to 24 Years | 124 (82.7%) | 0 (0.0%) |
| 25 to 29 Years | 50 (94.3%) | 0 (0.0%) |
| 30 to 34 Years | 70 (98.6%) | 0 (0.0%) |
| 35 to 44 Years | 353 (79.0%) | 21 (5.9%) |
| 45 to 54 Years | 284 (81.4%) | 20 (7.0%) |
| 55 to 59 Years | 172 (57.9%) | 12 (7.0%) |
| 60 to 64 Years | 133 (40.4%) | 11 (8.3%) |
| 65 to 74 Years | 128 (20.5%) | 0 (0.0%) |
| 75 Years and over | 16 (3.9%) | 0 (0.0%) |
| Total | 1,398 (47.9%) | 80 (5.7%) |
Employment Status by Educational Attainment in Granite County
According to labor force statistics for Granite County, 68.7% of individuals (1,062) out of the total population between 25 and 64 years of age (1,546) are in the labor force, with 6.0% or 64 of them being unemployed. The group with the highest labor force participation rate are those with the educational attainment of bachelor's degree or higher, with 84.3% or 354 individuals in the labor force. Within the labor force, individuals with high school diploma education have the highest percentage of unemployment, with 14.2% or 33 of them being unemployed.
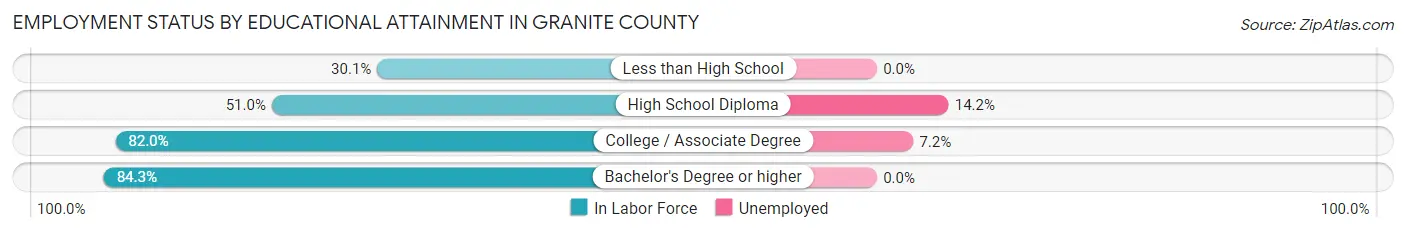
| Educational Attainment | In Labor Force | Unemployed |
| Less than High School | 43 (30.1%) | 0 (0.0%) |
| High School Diploma | 232 (51.0%) | 65 (14.2%) |
| College / Associate Degree | 433 (82.0%) | 38 (7.2%) |
| Bachelor's Degree or higher | 354 (84.3%) | 0 (0.0%) |
| Total | 1,062 (68.7%) | 93 (6.0%) |
Employment Occupations by Sex in Granite County
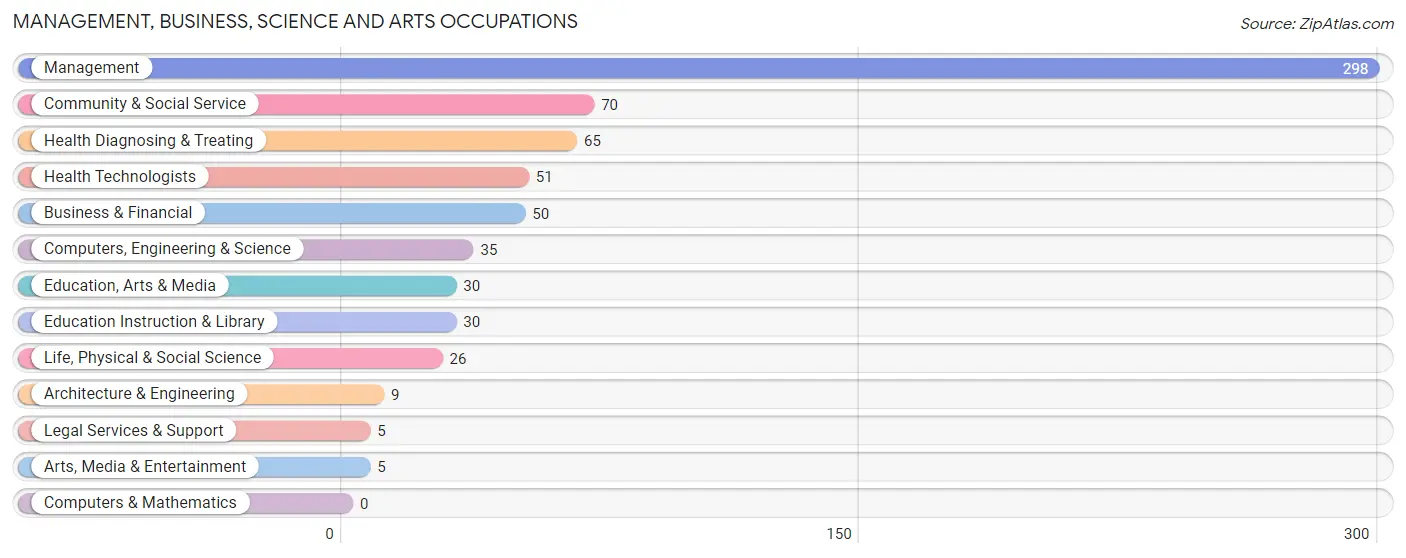
Management, Business, Science and Arts Occupations
The most common Management, Business, Science and Arts occupations in Granite County are Management (298 | 22.6%), Community & Social Service (70 | 5.3%), Health Diagnosing & Treating (65 | 4.9%), Health Technologists (51 | 3.9%), and Business & Financial (50 | 3.8%).
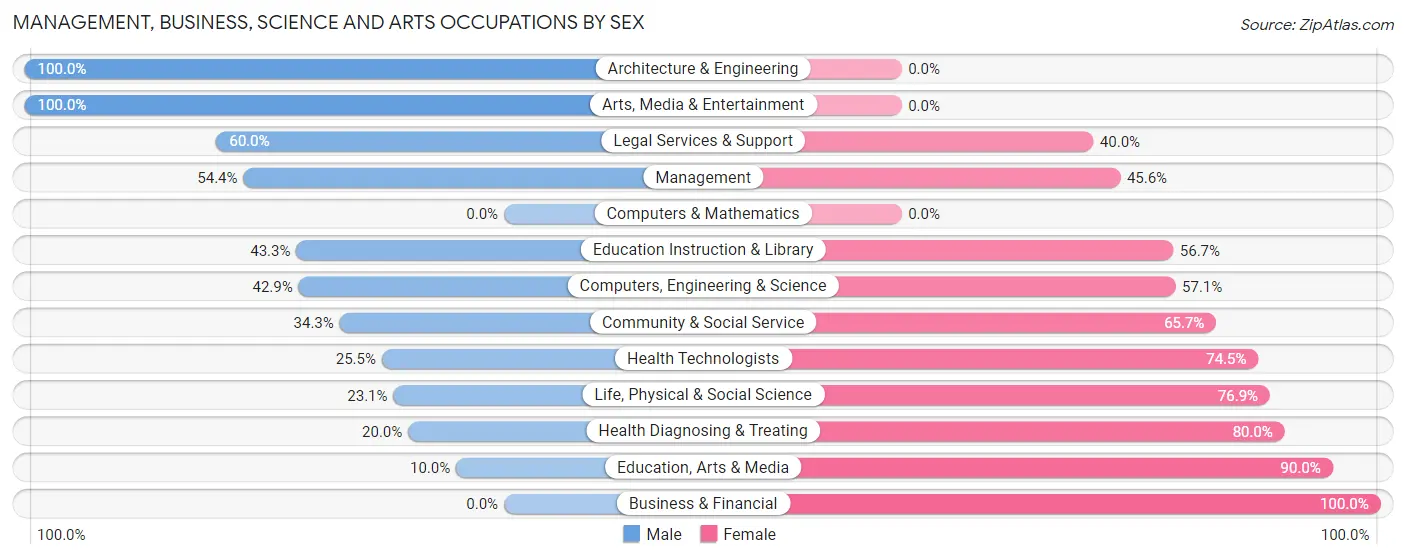
Management, Business, Science and Arts Occupations by Sex
Within the Management, Business, Science and Arts occupations in Granite County, the most male-oriented occupations are Architecture & Engineering (100.0%), Arts, Media & Entertainment (100.0%), and Legal Services & Support (60.0%), while the most female-oriented occupations are Business & Financial (100.0%), Education, Arts & Media (90.0%), and Health Diagnosing & Treating (80.0%).
| Occupation | Male | Female |
| Management | 162 (54.4%) | 136 (45.6%) |
| Business & Financial | 0 (0.0%) | 50 (100.0%) |
| Computers, Engineering & Science | 15 (42.9%) | 20 (57.1%) |
| Computers & Mathematics | 0 (0.0%) | 0 (0.0%) |
| Architecture & Engineering | 9 (100.0%) | 0 (0.0%) |
| Life, Physical & Social Science | 6 (23.1%) | 20 (76.9%) |
| Community & Social Service | 24 (34.3%) | 46 (65.7%) |
| Education, Arts & Media | 3 (10.0%) | 27 (90.0%) |
| Legal Services & Support | 3 (60.0%) | 2 (40.0%) |
| Education Instruction & Library | 13 (43.3%) | 17 (56.7%) |
| Arts, Media & Entertainment | 5 (100.0%) | 0 (0.0%) |
| Health Diagnosing & Treating | 13 (20.0%) | 52 (80.0%) |
| Health Technologists | 13 (25.5%) | 38 (74.5%) |
| Total (Category) | 214 (41.3%) | 304 (58.7%) |
| Total (Overall) | 672 (51.0%) | 645 (49.0%) |
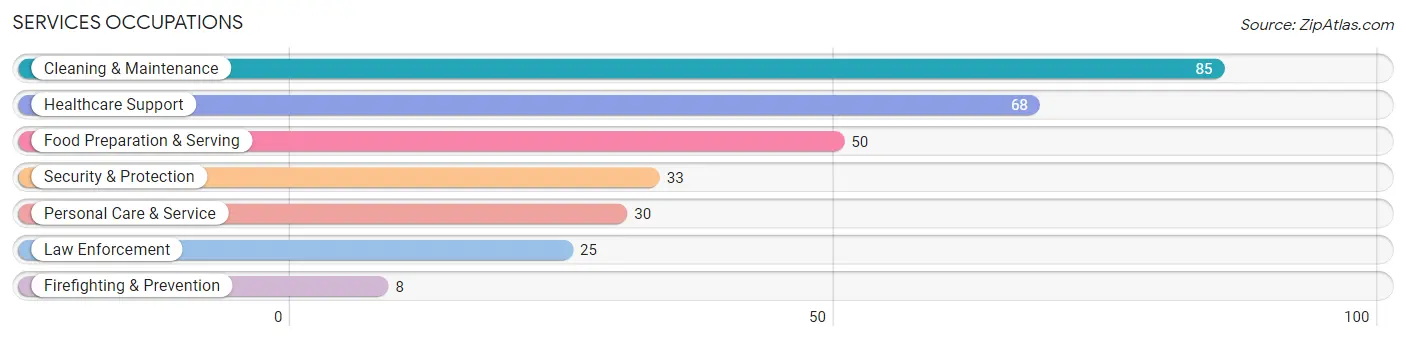
Services Occupations
The most common Services occupations in Granite County are Cleaning & Maintenance (85 | 6.5%), Healthcare Support (68 | 5.2%), Food Preparation & Serving (50 | 3.8%), Security & Protection (33 | 2.5%), and Personal Care & Service (30 | 2.3%).
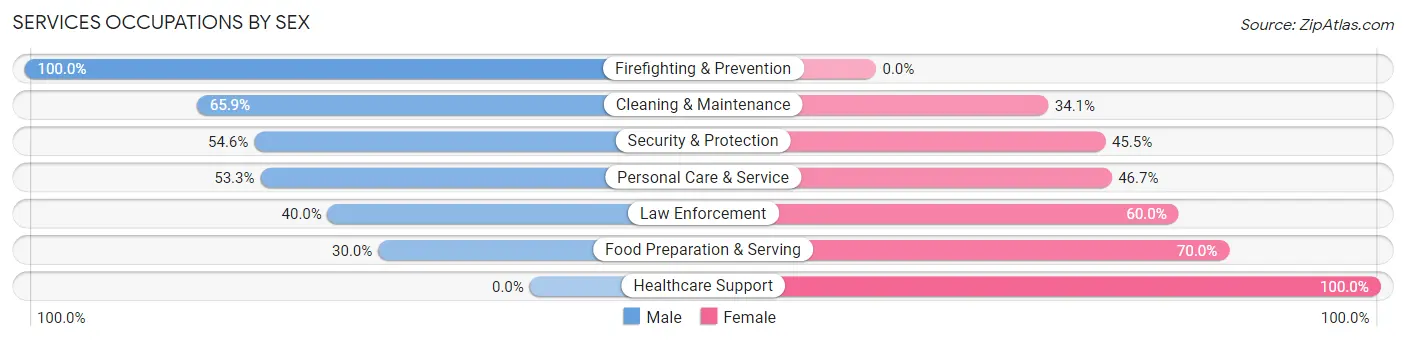
Services Occupations by Sex
Within the Services occupations in Granite County, the most male-oriented occupations are Firefighting & Prevention (100.0%), Cleaning & Maintenance (65.9%), and Security & Protection (54.5%), while the most female-oriented occupations are Healthcare Support (100.0%), Food Preparation & Serving (70.0%), and Law Enforcement (60.0%).
| Occupation | Male | Female |
| Healthcare Support | 0 (0.0%) | 68 (100.0%) |
| Security & Protection | 18 (54.5%) | 15 (45.5%) |
| Firefighting & Prevention | 8 (100.0%) | 0 (0.0%) |
| Law Enforcement | 10 (40.0%) | 15 (60.0%) |
| Food Preparation & Serving | 15 (30.0%) | 35 (70.0%) |
| Cleaning & Maintenance | 56 (65.9%) | 29 (34.1%) |
| Personal Care & Service | 16 (53.3%) | 14 (46.7%) |
| Total (Category) | 105 (39.5%) | 161 (60.5%) |
| Total (Overall) | 672 (51.0%) | 645 (49.0%) |
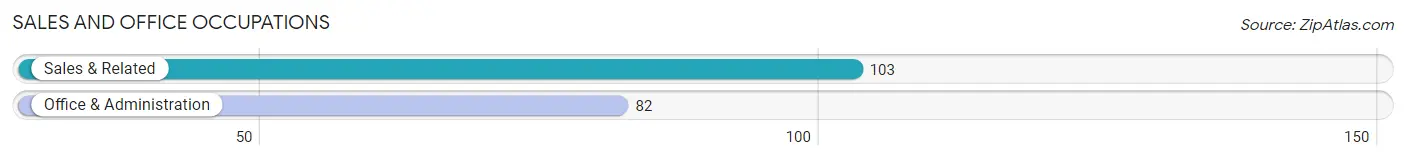
Sales and Office Occupations
The most common Sales and Office occupations in Granite County are Sales & Related (103 | 7.8%), and Office & Administration (82 | 6.2%).
Sales and Office Occupations by Sex
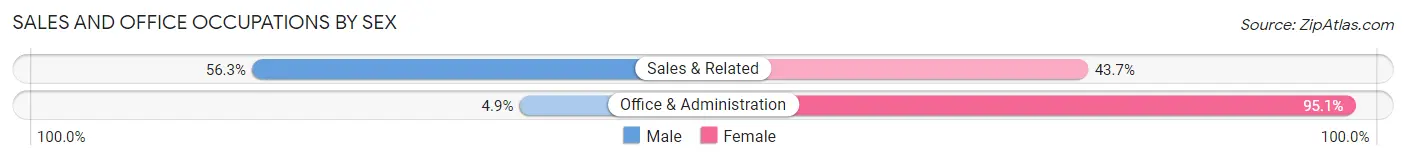
| Occupation | Male | Female |
| Sales & Related | 58 (56.3%) | 45 (43.7%) |
| Office & Administration | 4 (4.9%) | 78 (95.1%) |
| Total (Category) | 62 (33.5%) | 123 (66.5%) |
| Total (Overall) | 672 (51.0%) | 645 (49.0%) |
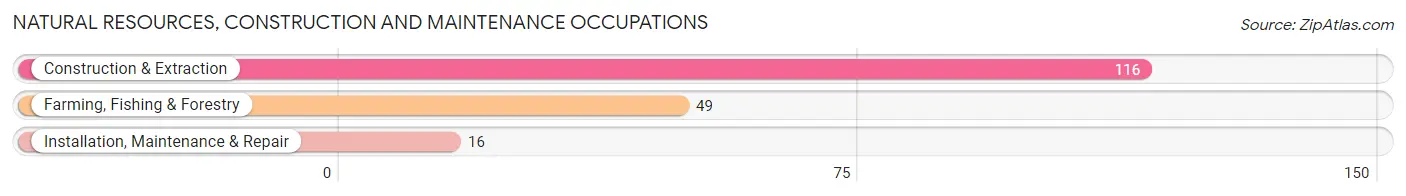
Natural Resources, Construction and Maintenance Occupations
The most common Natural Resources, Construction and Maintenance occupations in Granite County are Construction & Extraction (116 | 8.8%), Farming, Fishing & Forestry (49 | 3.7%), and Installation, Maintenance & Repair (16 | 1.2%).
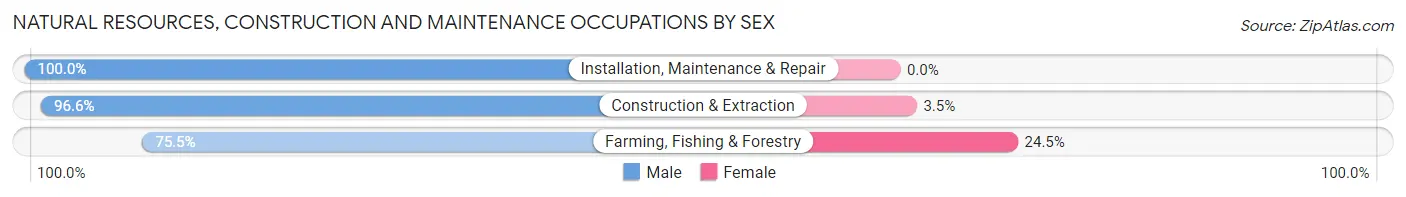
Natural Resources, Construction and Maintenance Occupations by Sex
| Occupation | Male | Female |
| Farming, Fishing & Forestry | 37 (75.5%) | 12 (24.5%) |
| Construction & Extraction | 112 (96.6%) | 4 (3.5%) |
| Installation, Maintenance & Repair | 16 (100.0%) | 0 (0.0%) |
| Total (Category) | 165 (91.2%) | 16 (8.8%) |
| Total (Overall) | 672 (51.0%) | 645 (49.0%) |
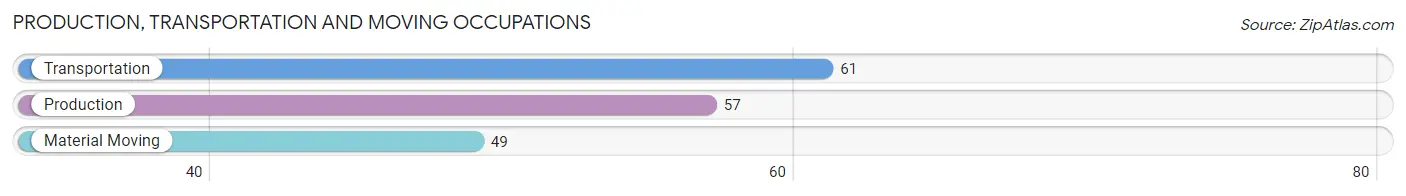
Production, Transportation and Moving Occupations
The most common Production, Transportation and Moving occupations in Granite County are Transportation (61 | 4.6%), Production (57 | 4.3%), and Material Moving (49 | 3.7%).
Production, Transportation and Moving Occupations by Sex
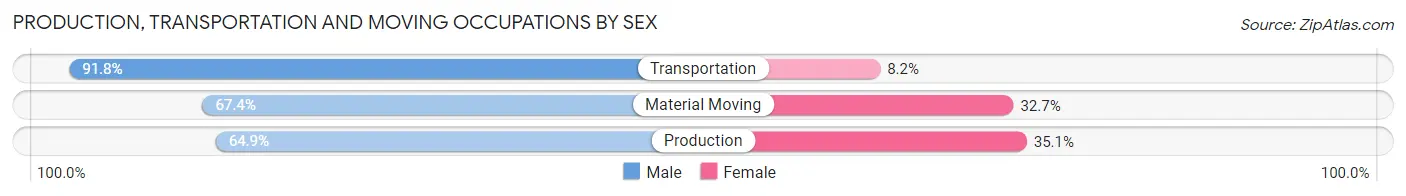
| Occupation | Male | Female |
| Production | 37 (64.9%) | 20 (35.1%) |
| Transportation | 56 (91.8%) | 5 (8.2%) |
| Material Moving | 33 (67.3%) | 16 (32.7%) |
| Total (Category) | 126 (75.4%) | 41 (24.5%) |
| Total (Overall) | 672 (51.0%) | 645 (49.0%) |
Employment Industries by Sex in Granite County
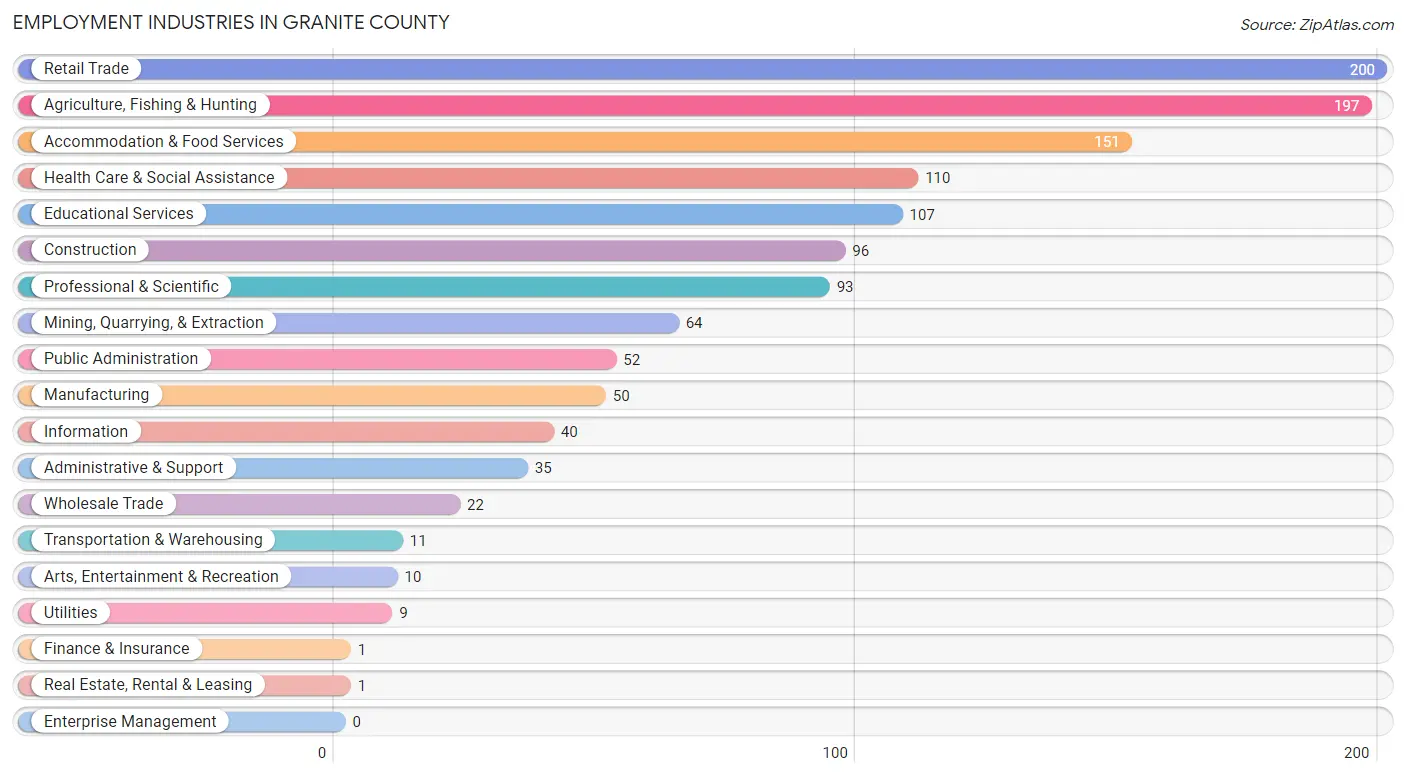
Employment Industries in Granite County
The major employment industries in Granite County include Retail Trade (200 | 15.2%), Agriculture, Fishing & Hunting (197 | 15.0%), Accommodation & Food Services (151 | 11.5%), Health Care & Social Assistance (110 | 8.4%), and Educational Services (107 | 8.1%).
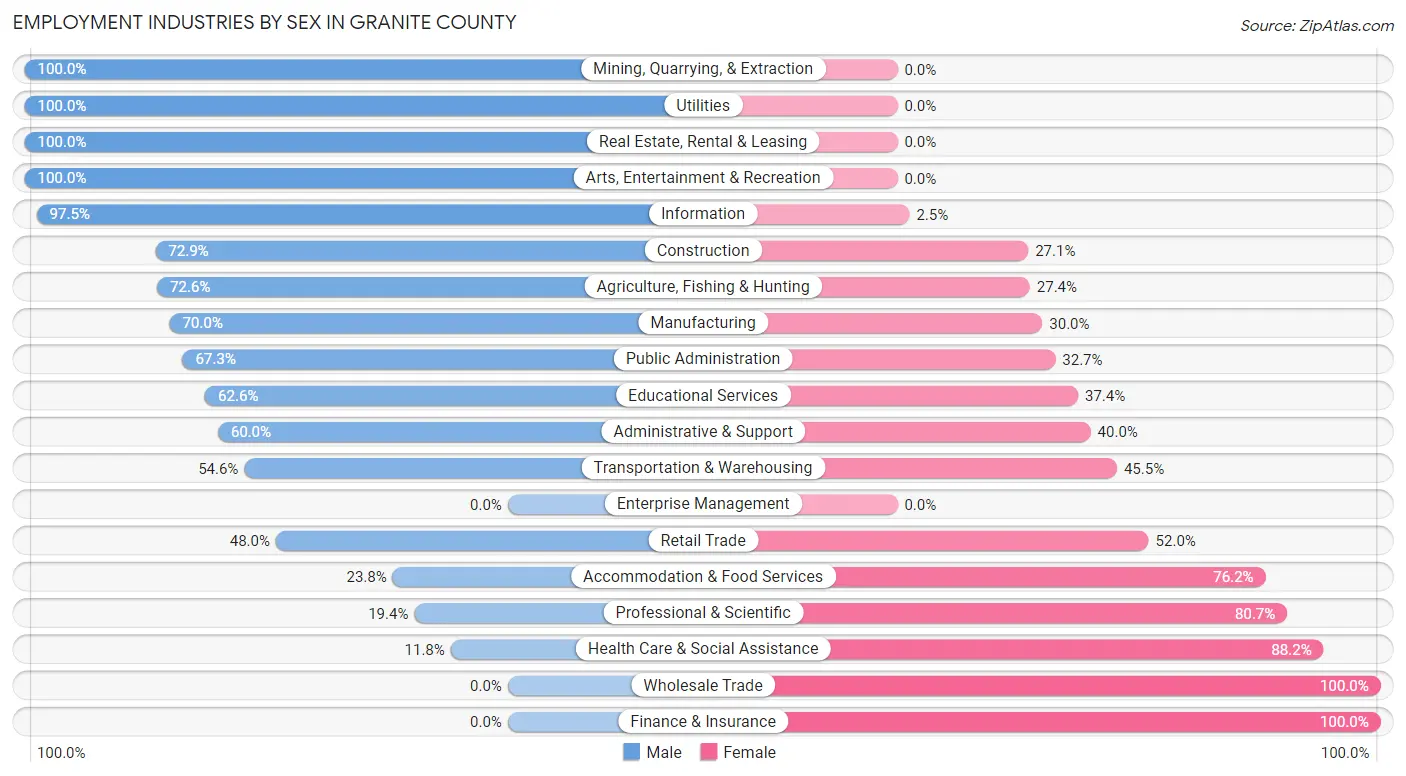
Employment Industries by Sex in Granite County
The Granite County industries that see more men than women are Mining, Quarrying, & Extraction (100.0%), Utilities (100.0%), and Real Estate, Rental & Leasing (100.0%), whereas the industries that tend to have a higher number of women are Wholesale Trade (100.0%), Finance & Insurance (100.0%), and Health Care & Social Assistance (88.2%).
| Industry | Male | Female |
| Agriculture, Fishing & Hunting | 143 (72.6%) | 54 (27.4%) |
| Mining, Quarrying, & Extraction | 64 (100.0%) | 0 (0.0%) |
| Construction | 70 (72.9%) | 26 (27.1%) |
| Manufacturing | 35 (70.0%) | 15 (30.0%) |
| Wholesale Trade | 0 (0.0%) | 22 (100.0%) |
| Retail Trade | 96 (48.0%) | 104 (52.0%) |
| Transportation & Warehousing | 6 (54.5%) | 5 (45.5%) |
| Utilities | 9 (100.0%) | 0 (0.0%) |
| Information | 39 (97.5%) | 1 (2.5%) |
| Finance & Insurance | 0 (0.0%) | 1 (100.0%) |
| Real Estate, Rental & Leasing | 1 (100.0%) | 0 (0.0%) |
| Professional & Scientific | 18 (19.4%) | 75 (80.6%) |
| Enterprise Management | 0 (0.0%) | 0 (0.0%) |
| Administrative & Support | 21 (60.0%) | 14 (40.0%) |
| Educational Services | 67 (62.6%) | 40 (37.4%) |
| Health Care & Social Assistance | 13 (11.8%) | 97 (88.2%) |
| Arts, Entertainment & Recreation | 10 (100.0%) | 0 (0.0%) |
| Accommodation & Food Services | 36 (23.8%) | 115 (76.2%) |
| Public Administration | 35 (67.3%) | 17 (32.7%) |
| Total | 672 (51.0%) | 645 (49.0%) |
Education in Granite County
School Enrollment in Granite County
The most common levels of schooling among the 572 students in Granite County are high school (185 | 32.3%), middle school (156 | 27.3%), and nursery / preschool (83 | 14.5%).
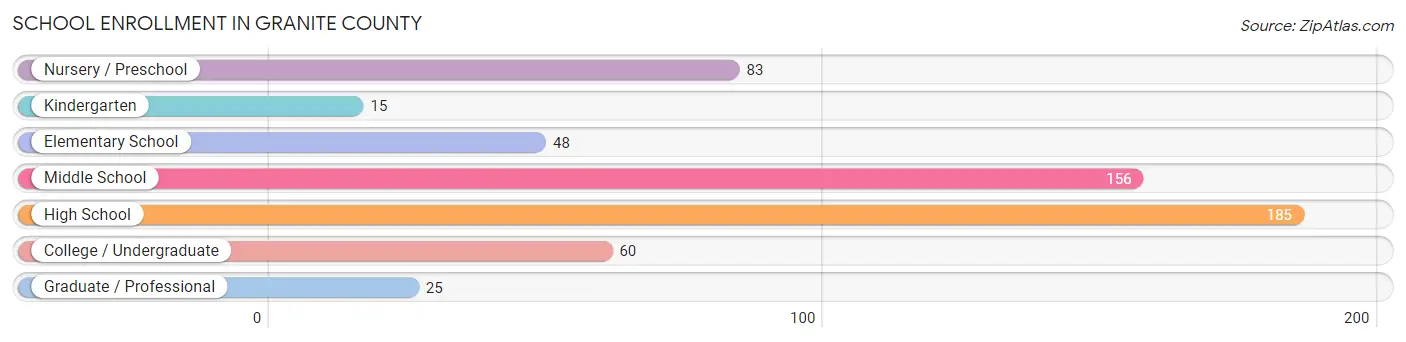
| School Level | # Students | % Students |
| Nursery / Preschool | 83 | 14.5% |
| Kindergarten | 15 | 2.6% |
| Elementary School | 48 | 8.4% |
| Middle School | 156 | 27.3% |
| High School | 185 | 32.3% |
| College / Undergraduate | 60 | 10.5% |
| Graduate / Professional | 25 | 4.4% |
| Total | 572 | 100.0% |
School Enrollment by Age by Funding Source in Granite County
Out of a total of 572 students who are enrolled in schools in Granite County, 101 (17.7%) attend a private institution, while the remaining 471 (82.3%) are enrolled in public schools. The age group of 25 to 34 year olds has the highest likelihood of being enrolled in private schools, with 1 (100.0% in the age bracket) enrolled. Conversely, the age group of 15 to 17 year olds has the lowest likelihood of being enrolled in a private school, with 87 (100.0% in the age bracket) attending a public institution.
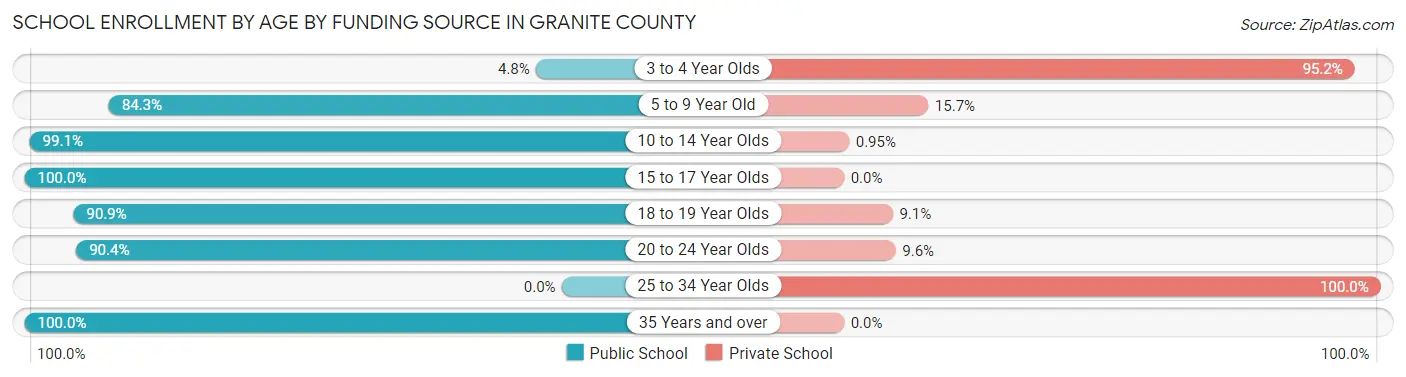
| Age Bracket | Public School | Private School |
| 3 to 4 Year Olds | 4 (4.8%) | 79 (95.2%) |
| 5 to 9 Year Old | 43 (84.3%) | 8 (15.7%) |
| 10 to 14 Year Olds | 208 (99.1%) | 2 (0.9%) |
| 15 to 17 Year Olds | 87 (100.0%) | 0 (0.0%) |
| 18 to 19 Year Olds | 60 (90.9%) | 6 (9.1%) |
| 20 to 24 Year Olds | 47 (90.4%) | 5 (9.6%) |
| 25 to 34 Year Olds | 0 (0.0%) | 1 (100.0%) |
| 35 Years and over | 22 (100.0%) | 0 (0.0%) |
| Total | 471 (82.3%) | 101 (17.7%) |
Educational Attainment by Field of Study in Granite County
Education (182 | 21.0%), business (150 | 17.3%), bio, nature & agricultural (108 | 12.5%), arts & humanities (81 | 9.4%), and communications (68 | 7.9%) are the most common fields of study among 865 individuals in Granite County who have obtained a bachelor's degree or higher.
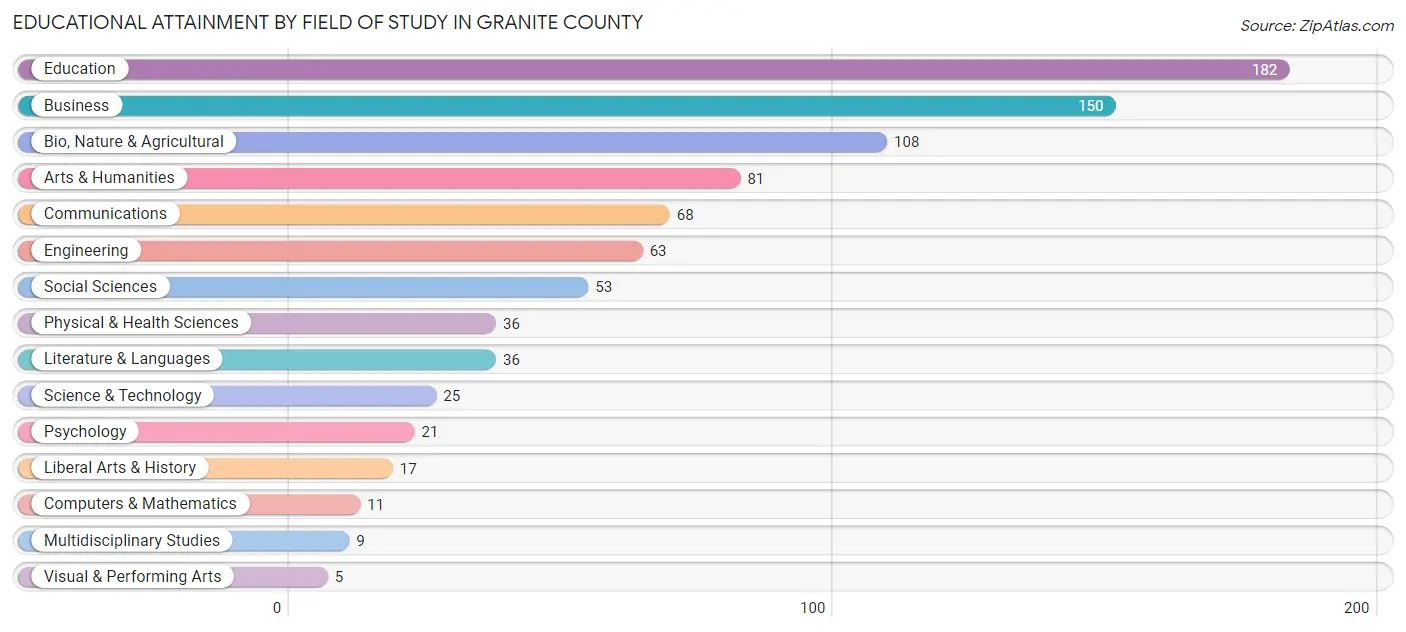
| Field of Study | # Graduates | % Graduates |
| Computers & Mathematics | 11 | 1.3% |
| Bio, Nature & Agricultural | 108 | 12.5% |
| Physical & Health Sciences | 36 | 4.2% |
| Psychology | 21 | 2.4% |
| Social Sciences | 53 | 6.1% |
| Engineering | 63 | 7.3% |
| Multidisciplinary Studies | 9 | 1.0% |
| Science & Technology | 25 | 2.9% |
| Business | 150 | 17.3% |
| Education | 182 | 21.0% |
| Literature & Languages | 36 | 4.2% |
| Liberal Arts & History | 17 | 2.0% |
| Visual & Performing Arts | 5 | 0.6% |
| Communications | 68 | 7.9% |
| Arts & Humanities | 81 | 9.4% |
| Total | 865 | 100.0% |
Transportation & Commute in Granite County
Vehicle Availability by Sex in Granite County
The most prevalent vehicle ownership categories in Granite County are males with 2 vehicles (216, accounting for 33.5%) and females with 2 vehicles (147, making up 36.7%).
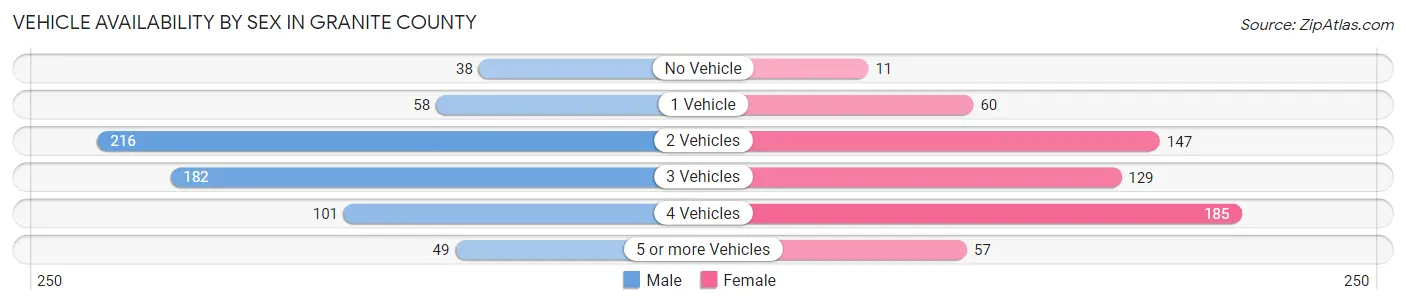
| Vehicles Available | Male | Female |
| No Vehicle | 38 (5.9%) | 11 (1.9%) |
| 1 Vehicle | 58 (9.0%) | 60 (10.2%) |
| 2 Vehicles | 216 (33.5%) | 147 (25.0%) |
| 3 Vehicles | 182 (28.3%) | 129 (21.9%) |
| 4 Vehicles | 101 (15.7%) | 185 (31.4%) |
| 5 or more Vehicles | 49 (7.6%) | 57 (9.7%) |
| Total | 644 (100.0%) | 589 (100.0%) |
Commute Time in Granite County
The most frequently occuring commute durations in Granite County are 5 to 9 minutes (241 commuters, 21.0%), 15 to 19 minutes (208 commuters, 18.1%), and 30 to 34 minutes (197 commuters, 17.2%).
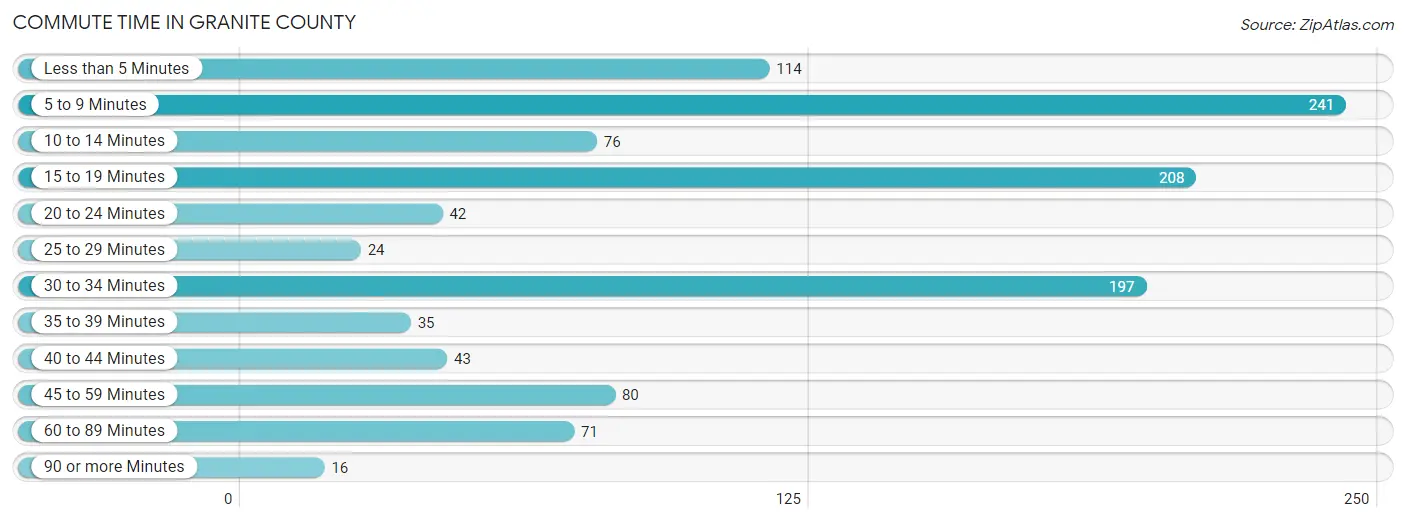
| Commute Time | # Commuters | % Commuters |
| Less than 5 Minutes | 114 | 9.9% |
| 5 to 9 Minutes | 241 | 21.0% |
| 10 to 14 Minutes | 76 | 6.6% |
| 15 to 19 Minutes | 208 | 18.1% |
| 20 to 24 Minutes | 42 | 3.7% |
| 25 to 29 Minutes | 24 | 2.1% |
| 30 to 34 Minutes | 197 | 17.2% |
| 35 to 39 Minutes | 35 | 3.0% |
| 40 to 44 Minutes | 43 | 3.7% |
| 45 to 59 Minutes | 80 | 7.0% |
| 60 to 89 Minutes | 71 | 6.2% |
| 90 or more Minutes | 16 | 1.4% |
Commute Time by Sex in Granite County
The most common commute times in Granite County are 5 to 9 minutes (126 commuters, 21.2%) for males and 5 to 9 minutes (115 commuters, 20.8%) for females.
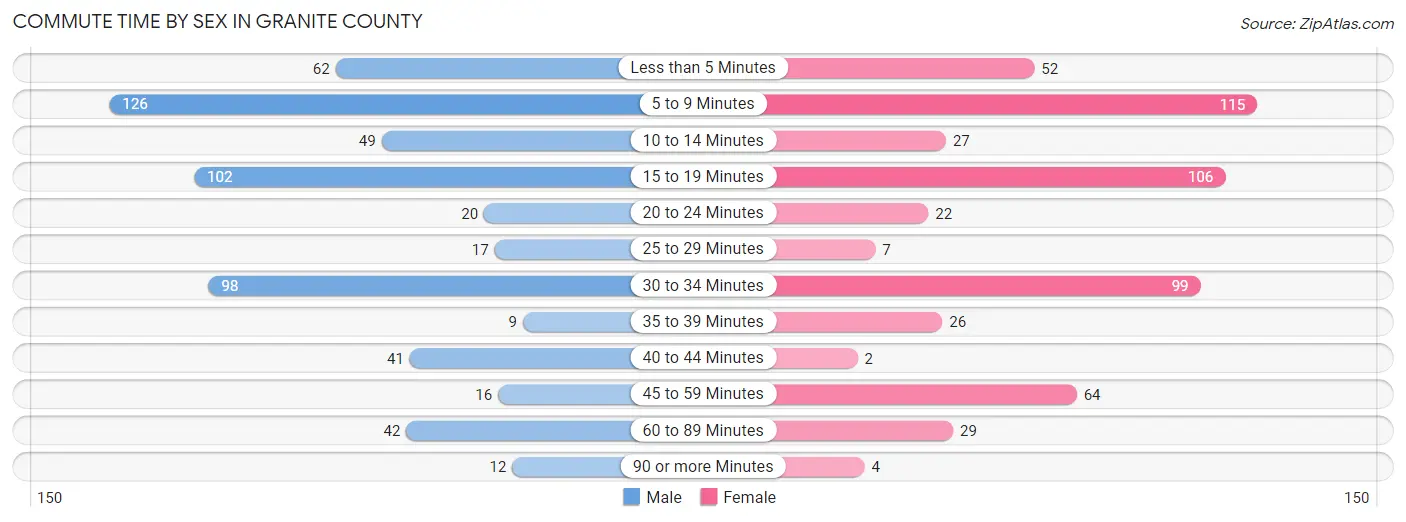
| Commute Time | Male | Female |
| Less than 5 Minutes | 62 (10.4%) | 52 (9.4%) |
| 5 to 9 Minutes | 126 (21.2%) | 115 (20.8%) |
| 10 to 14 Minutes | 49 (8.3%) | 27 (4.9%) |
| 15 to 19 Minutes | 102 (17.2%) | 106 (19.2%) |
| 20 to 24 Minutes | 20 (3.4%) | 22 (4.0%) |
| 25 to 29 Minutes | 17 (2.9%) | 7 (1.3%) |
| 30 to 34 Minutes | 98 (16.5%) | 99 (17.9%) |
| 35 to 39 Minutes | 9 (1.5%) | 26 (4.7%) |
| 40 to 44 Minutes | 41 (6.9%) | 2 (0.4%) |
| 45 to 59 Minutes | 16 (2.7%) | 64 (11.6%) |
| 60 to 89 Minutes | 42 (7.1%) | 29 (5.2%) |
| 90 or more Minutes | 12 (2.0%) | 4 (0.7%) |
Time of Departure to Work by Sex in Granite County
The most frequent times of departure to work in Granite County are 6:00 AM to 6:29 AM (88, 14.8%) for males and 7:00 AM to 7:29 AM (124, 22.4%) for females.
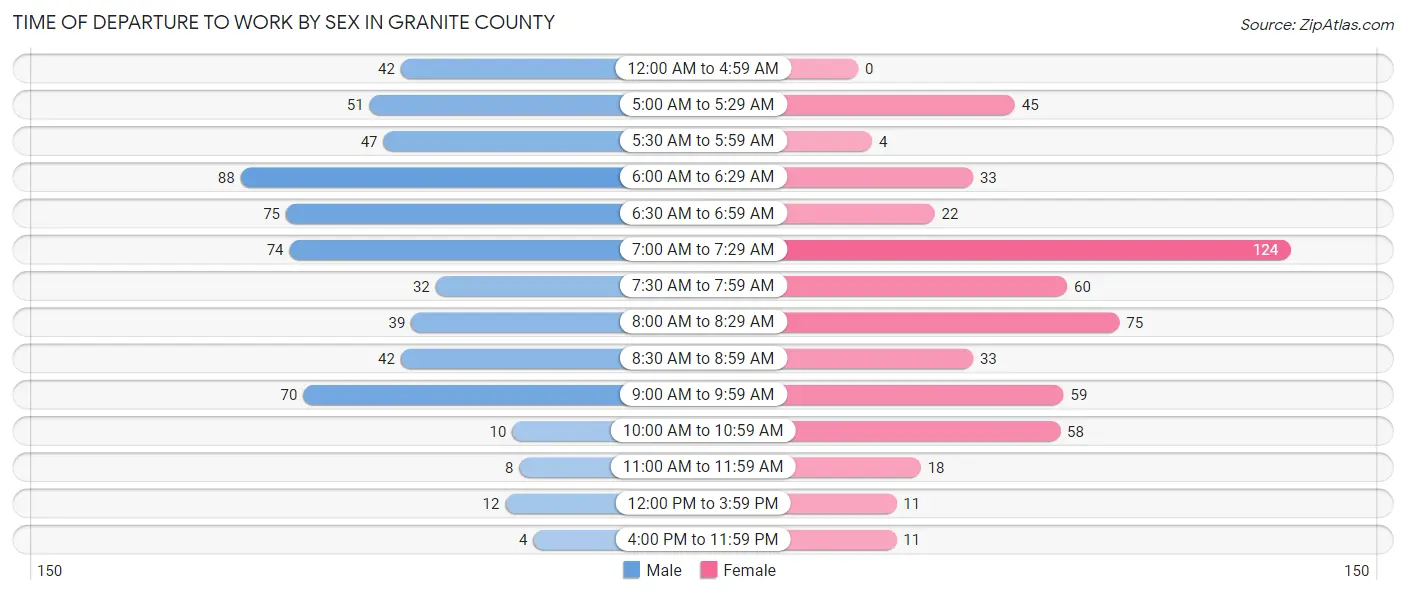
| Time of Departure | Male | Female |
| 12:00 AM to 4:59 AM | 42 (7.1%) | 0 (0.0%) |
| 5:00 AM to 5:29 AM | 51 (8.6%) | 45 (8.1%) |
| 5:30 AM to 5:59 AM | 47 (7.9%) | 4 (0.7%) |
| 6:00 AM to 6:29 AM | 88 (14.8%) | 33 (6.0%) |
| 6:30 AM to 6:59 AM | 75 (12.6%) | 22 (4.0%) |
| 7:00 AM to 7:29 AM | 74 (12.5%) | 124 (22.4%) |
| 7:30 AM to 7:59 AM | 32 (5.4%) | 60 (10.8%) |
| 8:00 AM to 8:29 AM | 39 (6.6%) | 75 (13.6%) |
| 8:30 AM to 8:59 AM | 42 (7.1%) | 33 (6.0%) |
| 9:00 AM to 9:59 AM | 70 (11.8%) | 59 (10.7%) |
| 10:00 AM to 10:59 AM | 10 (1.7%) | 58 (10.5%) |
| 11:00 AM to 11:59 AM | 8 (1.3%) | 18 (3.3%) |
| 12:00 PM to 3:59 PM | 12 (2.0%) | 11 (2.0%) |
| 4:00 PM to 11:59 PM | 4 (0.7%) | 11 (2.0%) |
| Total | 594 (100.0%) | 553 (100.0%) |
Housing Occupancy in Granite County
Occupancy by Ownership in Granite County
Of the total 1,343 dwellings in Granite County, owner-occupied units account for 1,028 (76.5%), while renter-occupied units make up 315 (23.4%).
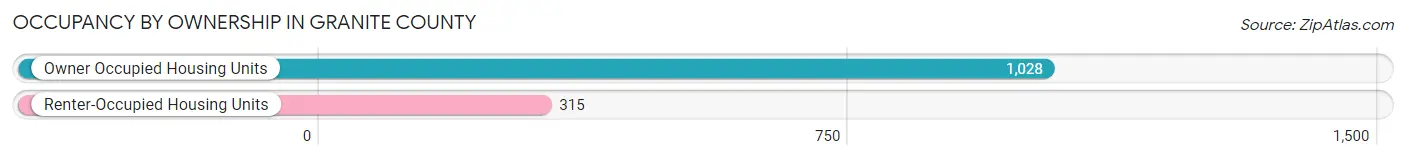
| Occupancy | # Housing Units | % Housing Units |
| Owner Occupied Housing Units | 1,028 | 76.5% |
| Renter-Occupied Housing Units | 315 | 23.4% |
| Total Occupied Housing Units | 1,343 | 100.0% |
Occupancy by Household Size in Granite County
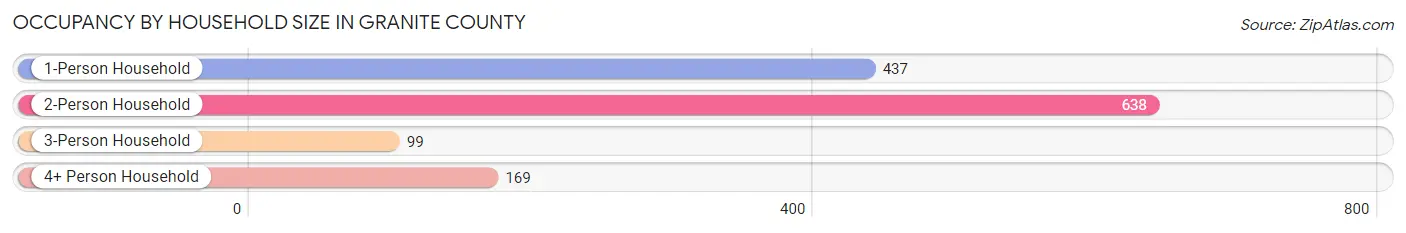
| Household Size | # Housing Units | % Housing Units |
| 1-Person Household | 437 | 32.5% |
| 2-Person Household | 638 | 47.5% |
| 3-Person Household | 99 | 7.4% |
| 4+ Person Household | 169 | 12.6% |
| Total Housing Units | 1,343 | 100.0% |
Occupancy by Ownership by Household Size in Granite County
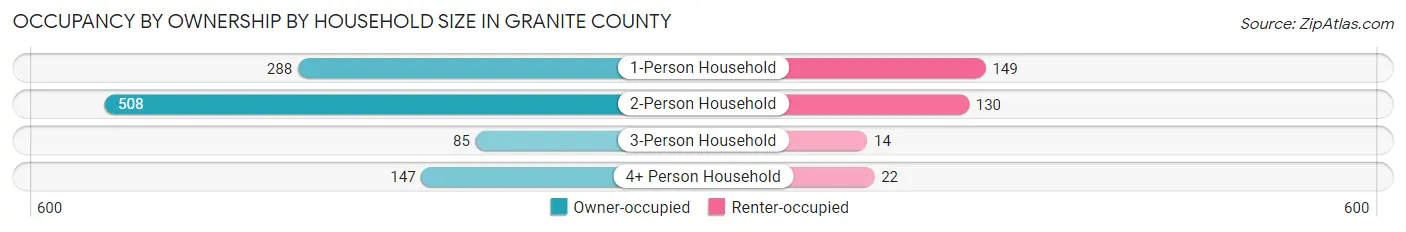
| Household Size | Owner-occupied | Renter-occupied |
| 1-Person Household | 288 (65.9%) | 149 (34.1%) |
| 2-Person Household | 508 (79.6%) | 130 (20.4%) |
| 3-Person Household | 85 (85.9%) | 14 (14.1%) |
| 4+ Person Household | 147 (87.0%) | 22 (13.0%) |
| Total Housing Units | 1,028 (76.5%) | 315 (23.4%) |
Occupancy by Educational Attainment in Granite County
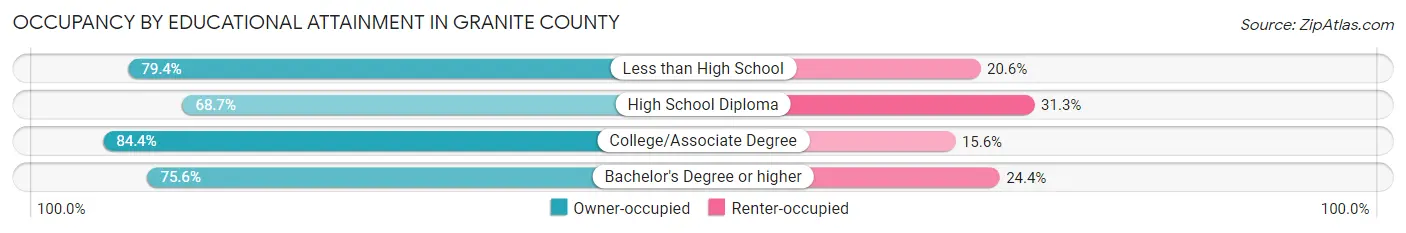
| Household Size | Owner-occupied | Renter-occupied |
| Less than High School | 27 (79.4%) | 7 (20.6%) |
| High School Diploma | 250 (68.7%) | 114 (31.3%) |
| College/Associate Degree | 351 (84.4%) | 65 (15.6%) |
| Bachelor's Degree or higher | 400 (75.6%) | 129 (24.4%) |
Occupancy by Age of Householder in Granite County
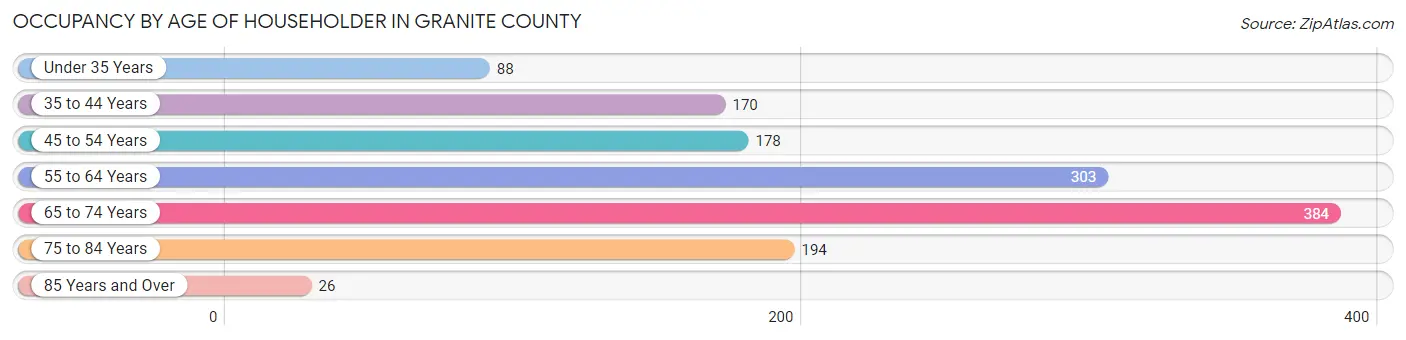
| Age Bracket | # Households | % Households |
| Under 35 Years | 88 | 6.6% |
| 35 to 44 Years | 170 | 12.7% |
| 45 to 54 Years | 178 | 13.3% |
| 55 to 64 Years | 303 | 22.6% |
| 65 to 74 Years | 384 | 28.6% |
| 75 to 84 Years | 194 | 14.4% |
| 85 Years and Over | 26 | 1.9% |
| Total | 1,343 | 100.0% |
Housing Finances in Granite County
Median Income by Occupancy in Granite County
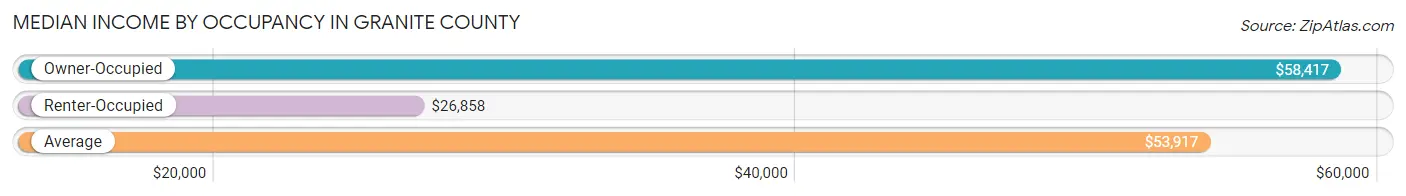
| Occupancy Type | # Households | Median Income |
| Owner-Occupied | 1,028 (76.5%) | $58,417 |
| Renter-Occupied | 315 (23.4%) | $26,858 |
| Average | 1,343 (100.0%) | $53,917 |
Occupancy by Householder Income Bracket in Granite County
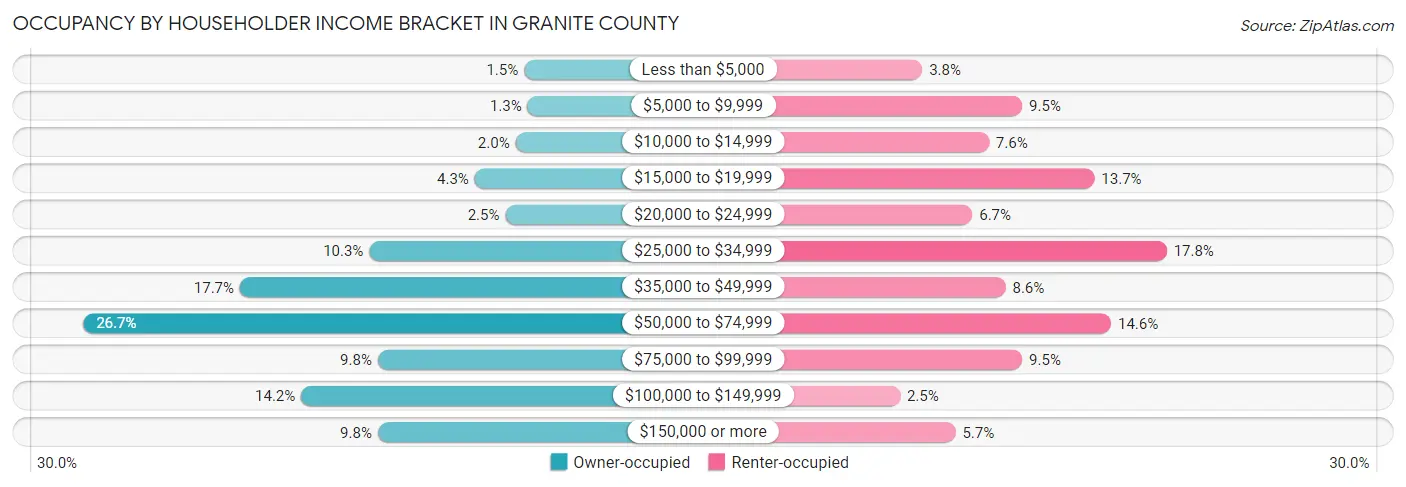
| Income Bracket | Owner-occupied | Renter-occupied |
| Less than $5,000 | 15 (1.5%) | 12 (3.8%) |
| $5,000 to $9,999 | 13 (1.3%) | 30 (9.5%) |
| $10,000 to $14,999 | 20 (1.9%) | 24 (7.6%) |
| $15,000 to $19,999 | 44 (4.3%) | 43 (13.7%) |
| $20,000 to $24,999 | 26 (2.5%) | 21 (6.7%) |
| $25,000 to $34,999 | 106 (10.3%) | 56 (17.8%) |
| $35,000 to $49,999 | 182 (17.7%) | 27 (8.6%) |
| $50,000 to $74,999 | 274 (26.7%) | 46 (14.6%) |
| $75,000 to $99,999 | 101 (9.8%) | 30 (9.5%) |
| $100,000 to $149,999 | 146 (14.2%) | 8 (2.5%) |
| $150,000 or more | 101 (9.8%) | 18 (5.7%) |
| Total | 1,028 (100.0%) | 315 (100.0%) |
Monthly Housing Cost Tiers in Granite County
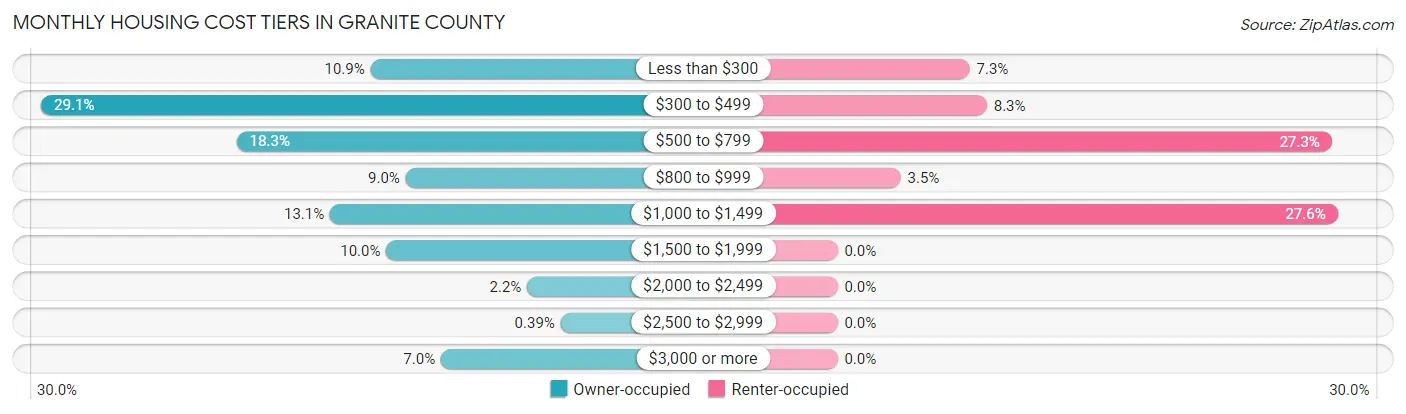
| Monthly Cost | Owner-occupied | Renter-occupied |
| Less than $300 | 112 (10.9%) | 23 (7.3%) |
| $300 to $499 | 299 (29.1%) | 26 (8.3%) |
| $500 to $799 | 188 (18.3%) | 86 (27.3%) |
| $800 to $999 | 92 (8.9%) | 11 (3.5%) |
| $1,000 to $1,499 | 135 (13.1%) | 87 (27.6%) |
| $1,500 to $1,999 | 103 (10.0%) | 0 (0.0%) |
| $2,000 to $2,499 | 23 (2.2%) | 0 (0.0%) |
| $2,500 to $2,999 | 4 (0.4%) | 0 (0.0%) |
| $3,000 or more | 72 (7.0%) | 0 (0.0%) |
| Total | 1,028 (100.0%) | 315 (100.0%) |
Physical Housing Characteristics in Granite County
Housing Structures in Granite County
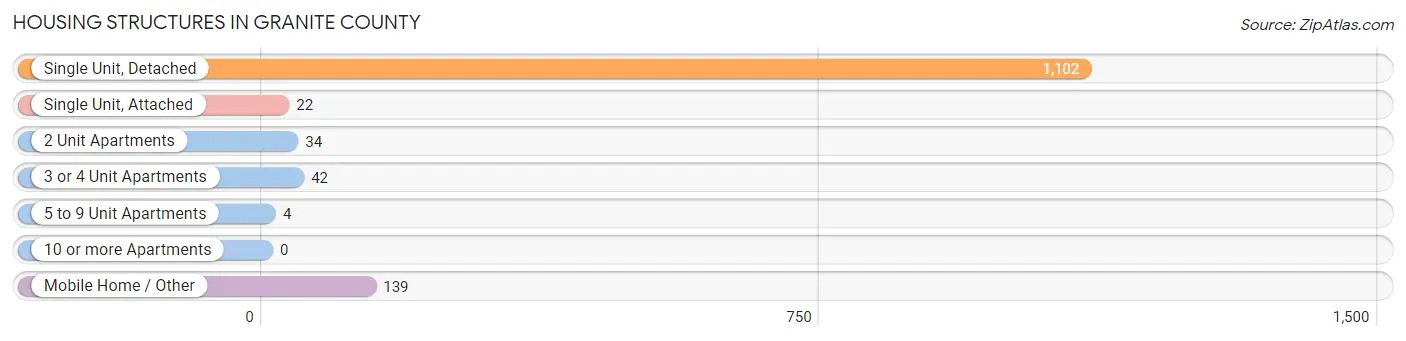
| Structure Type | # Housing Units | % Housing Units |
| Single Unit, Detached | 1,102 | 82.1% |
| Single Unit, Attached | 22 | 1.6% |
| 2 Unit Apartments | 34 | 2.5% |
| 3 or 4 Unit Apartments | 42 | 3.1% |
| 5 to 9 Unit Apartments | 4 | 0.3% |
| 10 or more Apartments | 0 | 0.0% |
| Mobile Home / Other | 139 | 10.3% |
| Total | 1,343 | 100.0% |
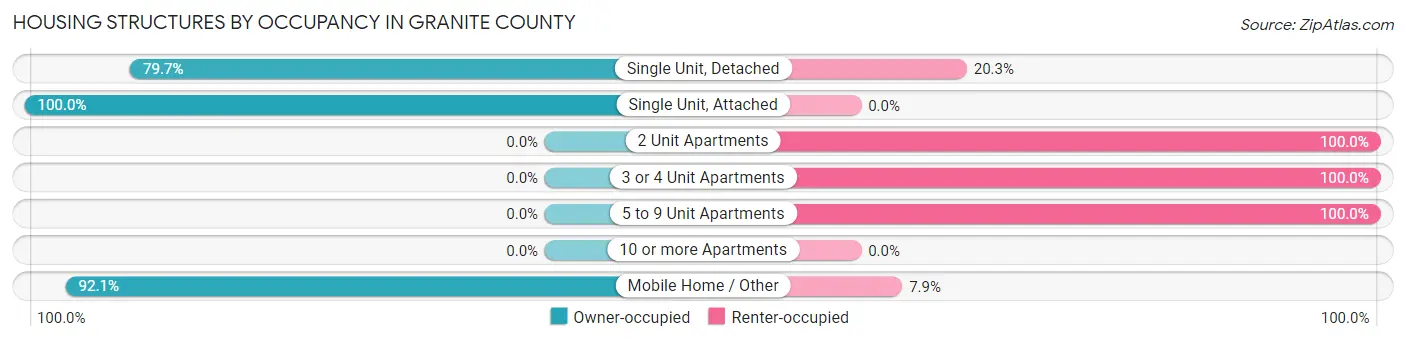
Housing Structures by Occupancy in Granite County
| Structure Type | Owner-occupied | Renter-occupied |
| Single Unit, Detached | 878 (79.7%) | 224 (20.3%) |
| Single Unit, Attached | 22 (100.0%) | 0 (0.0%) |
| 2 Unit Apartments | 0 (0.0%) | 34 (100.0%) |
| 3 or 4 Unit Apartments | 0 (0.0%) | 42 (100.0%) |
| 5 to 9 Unit Apartments | 0 (0.0%) | 4 (100.0%) |
| 10 or more Apartments | 0 (0.0%) | 0 (0.0%) |
| Mobile Home / Other | 128 (92.1%) | 11 (7.9%) |
| Total | 1,028 (76.5%) | 315 (23.4%) |
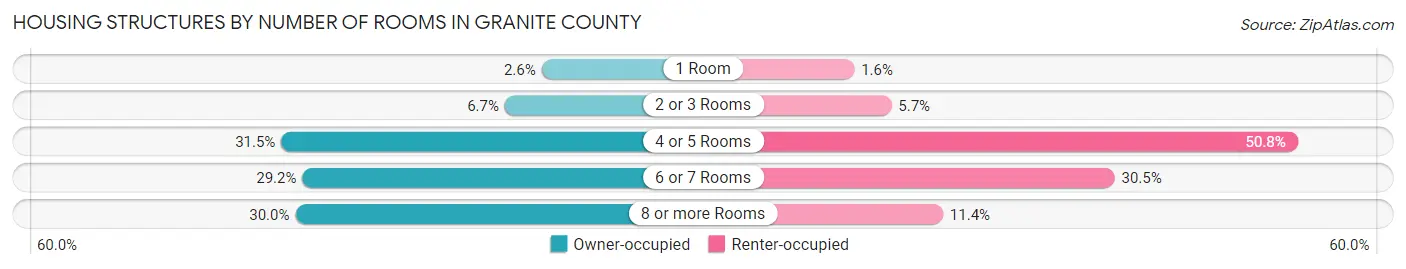
Housing Structures by Number of Rooms in Granite County
| Number of Rooms | Owner-occupied | Renter-occupied |
| 1 Room | 27 (2.6%) | 5 (1.6%) |
| 2 or 3 Rooms | 69 (6.7%) | 18 (5.7%) |
| 4 or 5 Rooms | 324 (31.5%) | 160 (50.8%) |
| 6 or 7 Rooms | 300 (29.2%) | 96 (30.5%) |
| 8 or more Rooms | 308 (30.0%) | 36 (11.4%) |
| Total | 1,028 (100.0%) | 315 (100.0%) |
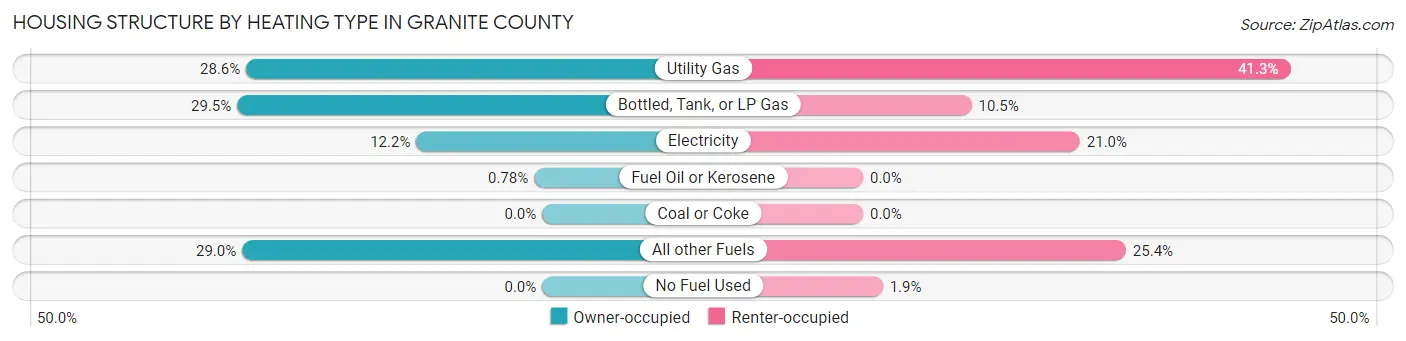
Housing Structure by Heating Type in Granite County
| Heating Type | Owner-occupied | Renter-occupied |
| Utility Gas | 294 (28.6%) | 130 (41.3%) |
| Bottled, Tank, or LP Gas | 303 (29.5%) | 33 (10.5%) |
| Electricity | 125 (12.2%) | 66 (20.9%) |
| Fuel Oil or Kerosene | 8 (0.8%) | 0 (0.0%) |
| Coal or Coke | 0 (0.0%) | 0 (0.0%) |
| All other Fuels | 298 (29.0%) | 80 (25.4%) |
| No Fuel Used | 0 (0.0%) | 6 (1.9%) |
| Total | 1,028 (100.0%) | 315 (100.0%) |
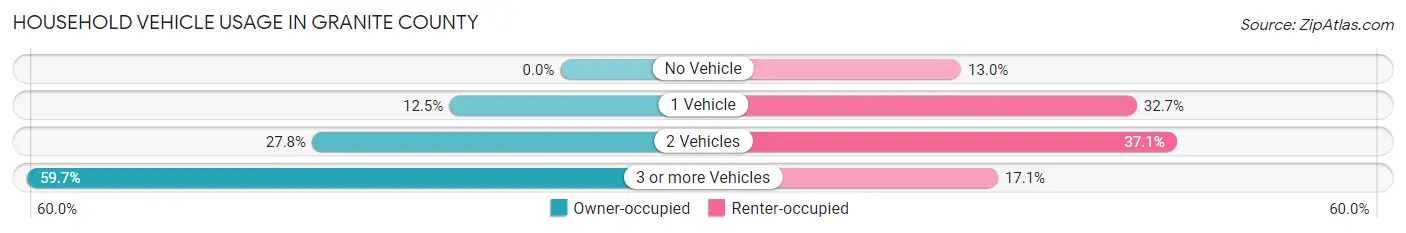
Household Vehicle Usage in Granite County
| Vehicles per Household | Owner-occupied | Renter-occupied |
| No Vehicle | 0 (0.0%) | 41 (13.0%) |
| 1 Vehicle | 128 (12.4%) | 103 (32.7%) |
| 2 Vehicles | 286 (27.8%) | 117 (37.1%) |
| 3 or more Vehicles | 614 (59.7%) | 54 (17.1%) |
| Total | 1,028 (100.0%) | 315 (100.0%) |
Real Estate & Mortgages in Granite County
Real Estate and Mortgage Overview in Granite County
| Characteristic | Without Mortgage | With Mortgage |
| Housing Units | 657 | 371 |
| Median Property Value | $277,200 | $303,300 |
| Median Household Income | $53,681 | $52 |
| Monthly Housing Costs | $445 | $72 |
| Real Estate Taxes | $1,821 | $15 |
Property Value by Mortgage Status in Granite County
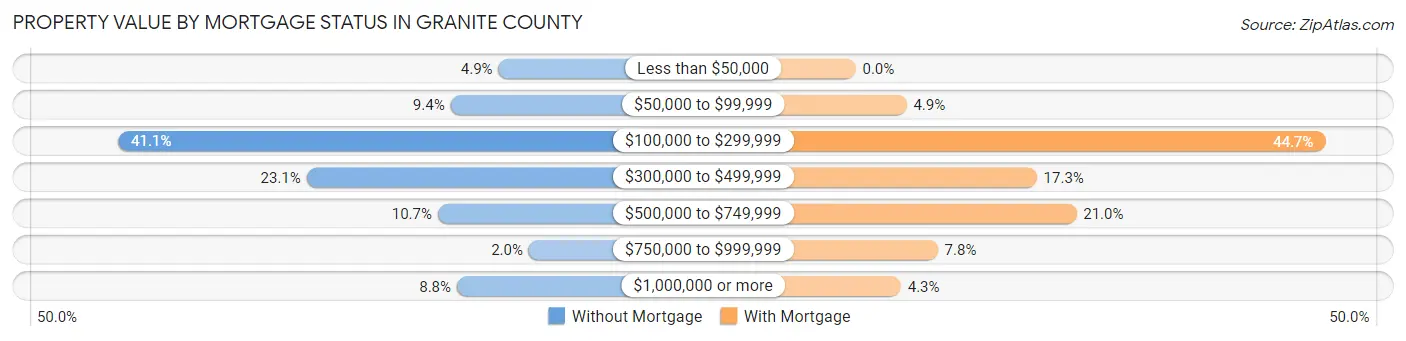
| Property Value | Without Mortgage | With Mortgage |
| Less than $50,000 | 32 (4.9%) | 0 (0.0%) |
| $50,000 to $99,999 | 62 (9.4%) | 18 (4.9%) |
| $100,000 to $299,999 | 270 (41.1%) | 166 (44.7%) |
| $300,000 to $499,999 | 152 (23.1%) | 64 (17.2%) |
| $500,000 to $749,999 | 70 (10.6%) | 78 (21.0%) |
| $750,000 to $999,999 | 13 (2.0%) | 29 (7.8%) |
| $1,000,000 or more | 58 (8.8%) | 16 (4.3%) |
| Total | 657 (100.0%) | 371 (100.0%) |
Household Income by Mortgage Status in Granite County
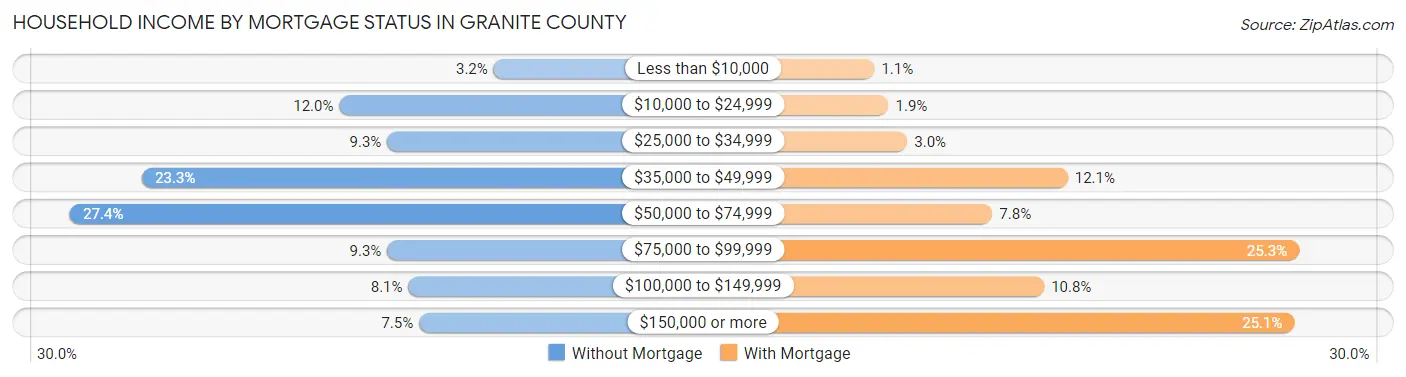
| Household Income | Without Mortgage | With Mortgage |
| Less than $10,000 | 21 (3.2%) | 4 (1.1%) |
| $10,000 to $24,999 | 79 (12.0%) | 7 (1.9%) |
| $25,000 to $34,999 | 61 (9.3%) | 11 (3.0%) |
| $35,000 to $49,999 | 153 (23.3%) | 45 (12.1%) |
| $50,000 to $74,999 | 180 (27.4%) | 29 (7.8%) |
| $75,000 to $99,999 | 61 (9.3%) | 94 (25.3%) |
| $100,000 to $149,999 | 53 (8.1%) | 40 (10.8%) |
| $150,000 or more | 49 (7.5%) | 93 (25.1%) |
| Total | 657 (100.0%) | 371 (100.0%) |
Property Value to Household Income Ratio in Granite County
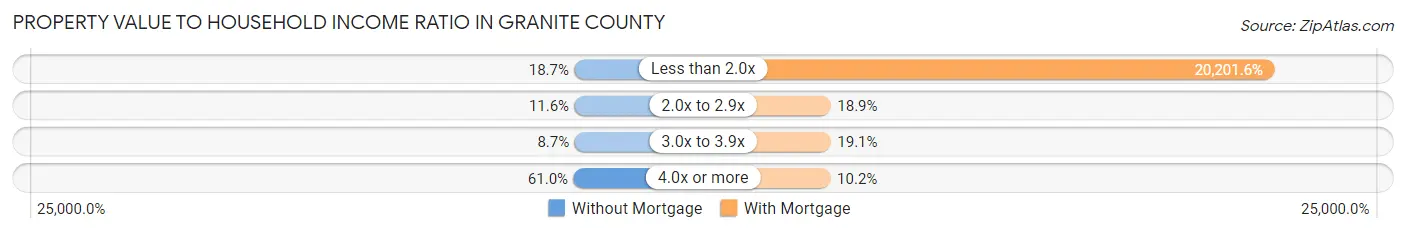
| Value-to-Income Ratio | Without Mortgage | With Mortgage |
| Less than 2.0x | 123 (18.7%) | 74,948 (20,201.6%) |
| 2.0x to 2.9x | 76 (11.6%) | 70 (18.9%) |
| 3.0x to 3.9x | 57 (8.7%) | 71 (19.1%) |
| 4.0x or more | 401 (61.0%) | 38 (10.2%) |
| Total | 657 (100.0%) | 371 (100.0%) |
Real Estate Taxes by Mortgage Status in Granite County
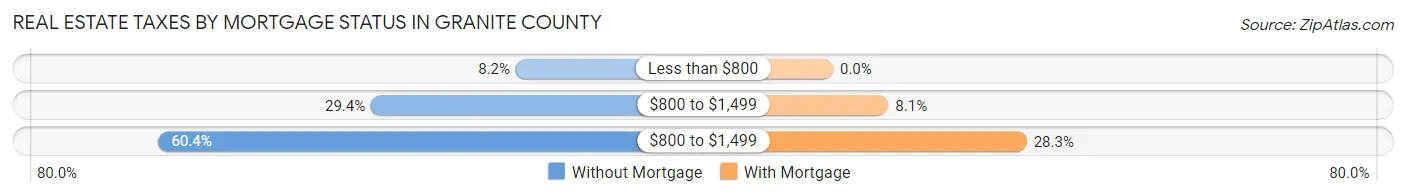
| Property Taxes | Without Mortgage | With Mortgage |
| Less than $800 | 54 (8.2%) | 0 (0.0%) |
| $800 to $1,499 | 193 (29.4%) | 30 (8.1%) |
| $800 to $1,499 | 397 (60.4%) | 105 (28.3%) |
| Total | 657 (100.0%) | 371 (100.0%) |
Health & Disability in Granite County
Health Insurance Coverage by Age in Granite County
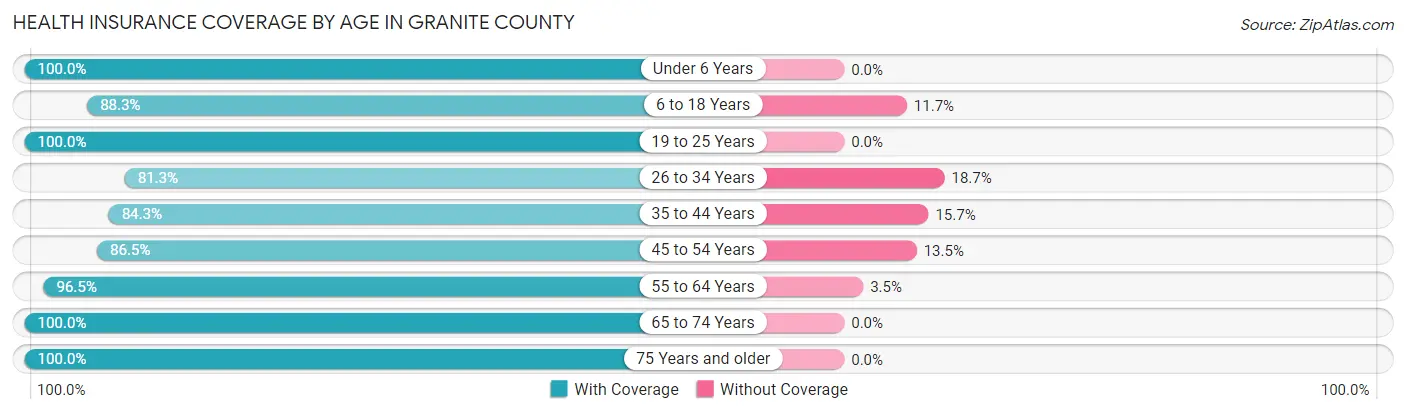
| Age Bracket | With Coverage | Without Coverage |
| Under 6 Years | 183 (100.0%) | 0 (0.0%) |
| 6 to 18 Years | 378 (88.3%) | 50 (11.7%) |
| 19 to 25 Years | 188 (100.0%) | 0 (0.0%) |
| 26 to 34 Years | 87 (81.3%) | 20 (18.7%) |
| 35 to 44 Years | 376 (84.3%) | 70 (15.7%) |
| 45 to 54 Years | 301 (86.5%) | 47 (13.5%) |
| 55 to 64 Years | 601 (96.5%) | 22 (3.5%) |
| 65 to 74 Years | 609 (100.0%) | 0 (0.0%) |
| 75 Years and older | 397 (100.0%) | 0 (0.0%) |
| Total | 3,120 (93.7%) | 209 (6.3%) |
Health Insurance Coverage by Citizenship Status in Granite County
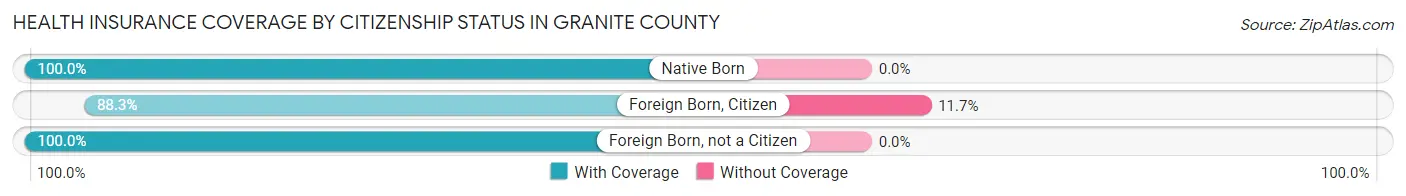
| Citizenship Status | With Coverage | Without Coverage |
| Native Born | 183 (100.0%) | 0 (0.0%) |
| Foreign Born, Citizen | 378 (88.3%) | 50 (11.7%) |
| Foreign Born, not a Citizen | 188 (100.0%) | 0 (0.0%) |
Health Insurance Coverage by Household Income in Granite County
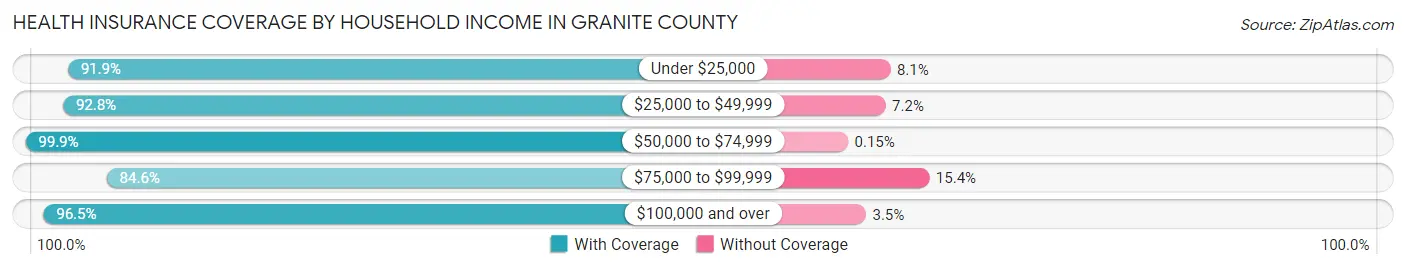
| Household Income | With Coverage | Without Coverage |
| Under $25,000 | 398 (91.9%) | 35 (8.1%) |
| $25,000 to $49,999 | 762 (92.8%) | 59 (7.2%) |
| $50,000 to $74,999 | 651 (99.9%) | 1 (0.2%) |
| $75,000 to $99,999 | 286 (84.6%) | 52 (15.4%) |
| $100,000 and over | 989 (96.5%) | 36 (3.5%) |
Public vs Private Health Insurance Coverage by Age in Granite County
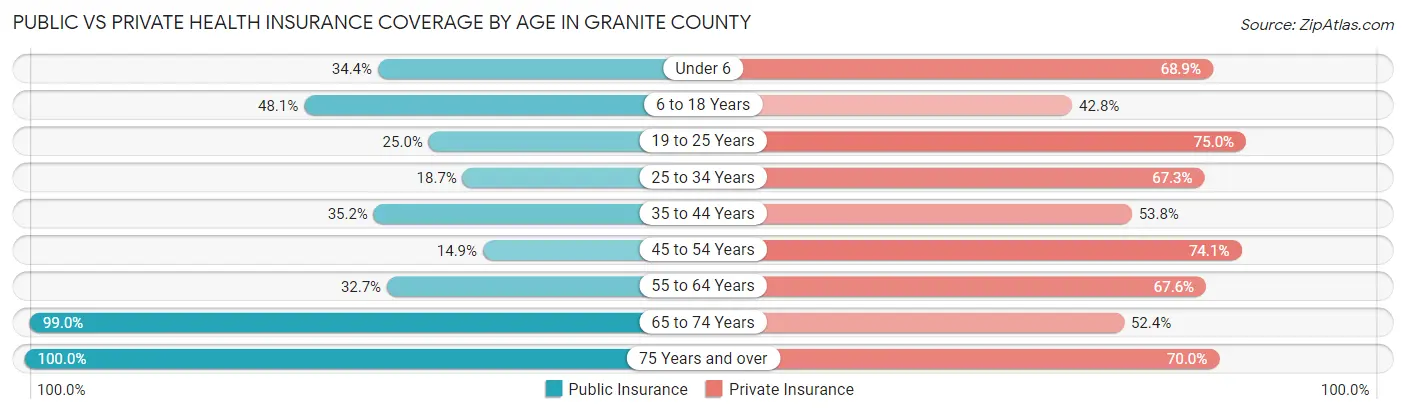
| Age Bracket | Public Insurance | Private Insurance |
| Under 6 | 63 (34.4%) | 126 (68.9%) |
| 6 to 18 Years | 206 (48.1%) | 183 (42.8%) |
| 19 to 25 Years | 47 (25.0%) | 141 (75.0%) |
| 25 to 34 Years | 20 (18.7%) | 72 (67.3%) |
| 35 to 44 Years | 157 (35.2%) | 240 (53.8%) |
| 45 to 54 Years | 52 (14.9%) | 258 (74.1%) |
| 55 to 64 Years | 204 (32.7%) | 421 (67.6%) |
| 65 to 74 Years | 603 (99.0%) | 319 (52.4%) |
| 75 Years and over | 397 (100.0%) | 278 (70.0%) |
| Total | 1,749 (52.5%) | 2,038 (61.2%) |
Disability Status by Sex by Age in Granite County
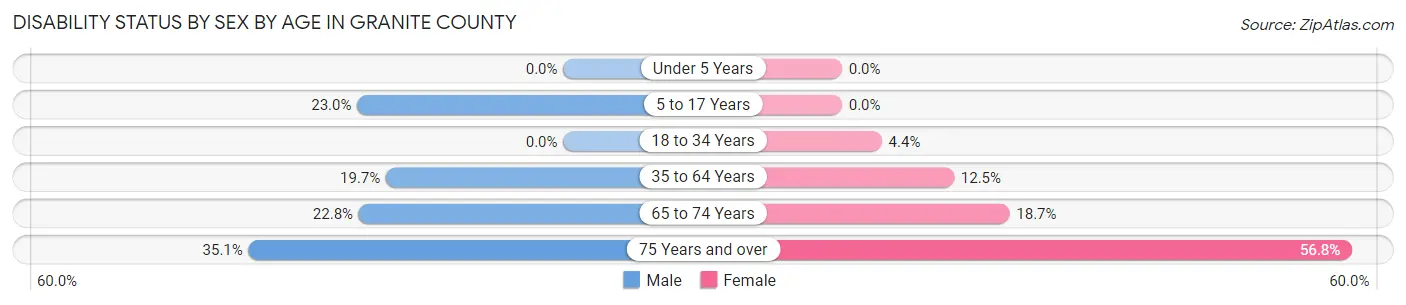
| Age Bracket | Male | Female |
| Under 5 Years | 0 (0.0%) | 0 (0.0%) |
| 5 to 17 Years | 42 (23.0%) | 0 (0.0%) |
| 18 to 34 Years | 0 (0.0%) | 8 (4.4%) |
| 35 to 64 Years | 139 (19.7%) | 89 (12.5%) |
| 65 to 74 Years | 74 (22.8%) | 53 (18.7%) |
| 75 Years and over | 75 (35.0%) | 104 (56.8%) |
Disability Class by Sex by Age in Granite County
Disability Class: Hearing Difficulty
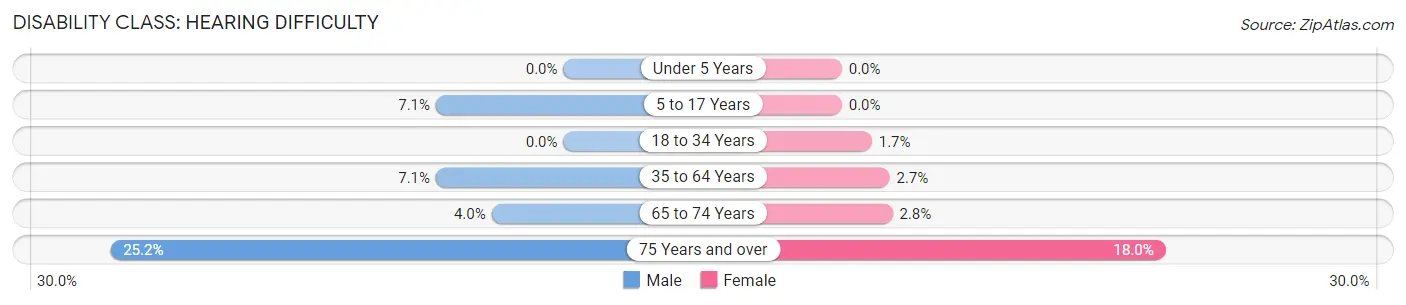
| Age Bracket | Male | Female |
| Under 5 Years | 0 (0.0%) | 0 (0.0%) |
| 5 to 17 Years | 13 (7.1%) | 0 (0.0%) |
| 18 to 34 Years | 0 (0.0%) | 3 (1.7%) |
| 35 to 64 Years | 50 (7.1%) | 19 (2.7%) |
| 65 to 74 Years | 13 (4.0%) | 8 (2.8%) |
| 75 Years and over | 54 (25.2%) | 33 (18.0%) |
Disability Class: Vision Difficulty
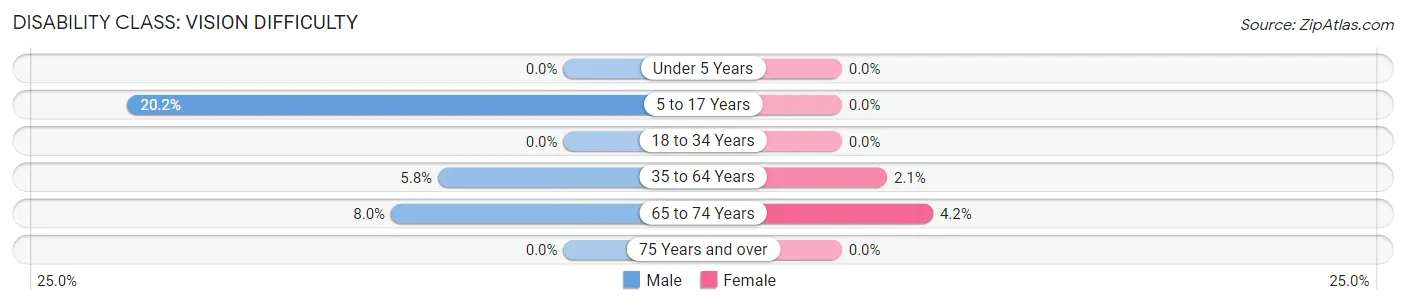
| Age Bracket | Male | Female |
| Under 5 Years | 0 (0.0%) | 0 (0.0%) |
| 5 to 17 Years | 37 (20.2%) | 0 (0.0%) |
| 18 to 34 Years | 0 (0.0%) | 0 (0.0%) |
| 35 to 64 Years | 41 (5.8%) | 15 (2.1%) |
| 65 to 74 Years | 26 (8.0%) | 12 (4.2%) |
| 75 Years and over | 0 (0.0%) | 0 (0.0%) |
Disability Class: Cognitive Difficulty
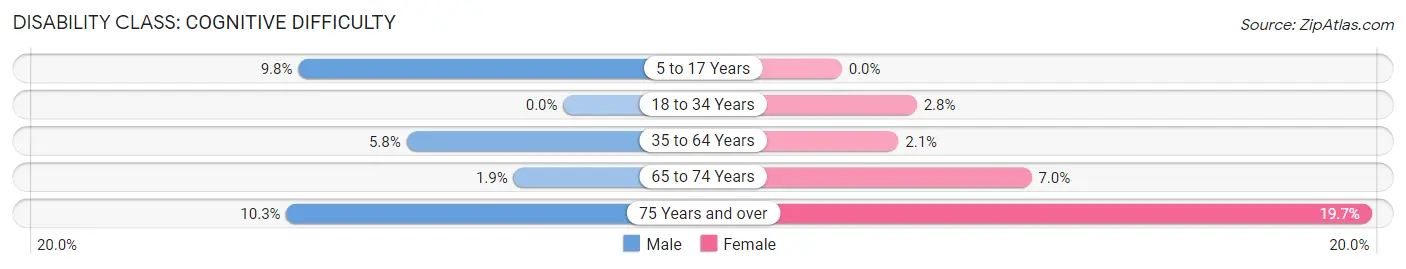
| Age Bracket | Male | Female |
| 5 to 17 Years | 18 (9.8%) | 0 (0.0%) |
| 18 to 34 Years | 0 (0.0%) | 5 (2.8%) |
| 35 to 64 Years | 41 (5.8%) | 15 (2.1%) |
| 65 to 74 Years | 6 (1.8%) | 20 (7.0%) |
| 75 Years and over | 22 (10.3%) | 36 (19.7%) |
Disability Class: Ambulatory Difficulty
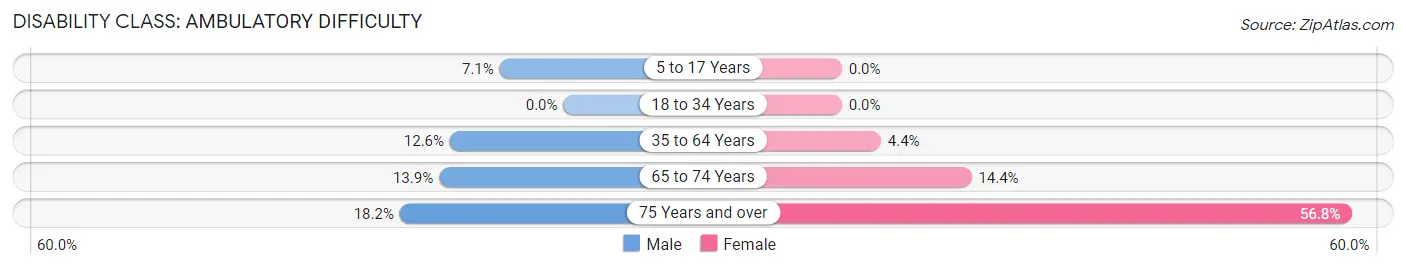
| Age Bracket | Male | Female |
| 5 to 17 Years | 13 (7.1%) | 0 (0.0%) |
| 18 to 34 Years | 0 (0.0%) | 0 (0.0%) |
| 35 to 64 Years | 89 (12.6%) | 31 (4.3%) |
| 65 to 74 Years | 45 (13.9%) | 41 (14.4%) |
| 75 Years and over | 39 (18.2%) | 104 (56.8%) |
Disability Class: Self-Care Difficulty
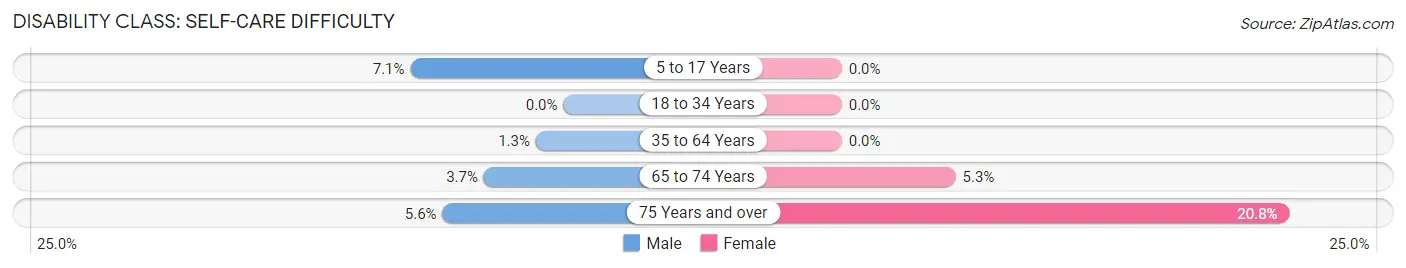
| Age Bracket | Male | Female |
| 5 to 17 Years | 13 (7.1%) | 0 (0.0%) |
| 18 to 34 Years | 0 (0.0%) | 0 (0.0%) |
| 35 to 64 Years | 9 (1.3%) | 0 (0.0%) |
| 65 to 74 Years | 12 (3.7%) | 15 (5.3%) |
| 75 Years and over | 12 (5.6%) | 38 (20.8%) |
Technology Access in Granite County
Computing Device Access in Granite County
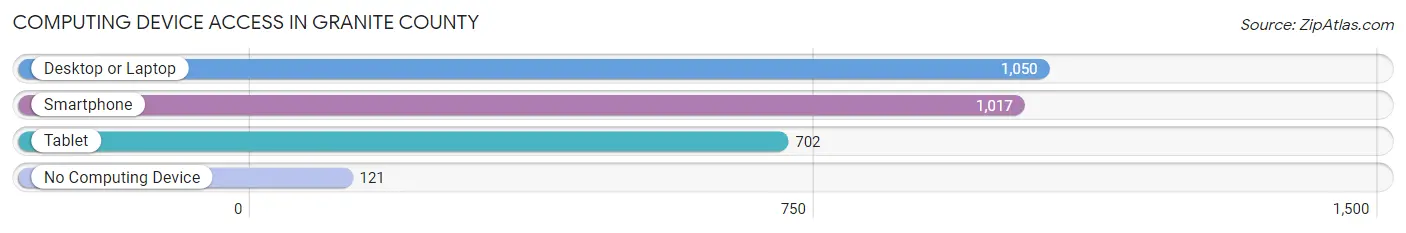
| Device Type | # Households | % Households |
| Desktop or Laptop | 1,050 | 78.2% |
| Smartphone | 1,017 | 75.7% |
| Tablet | 702 | 52.3% |
| No Computing Device | 121 | 9.0% |
| Total | 1,343 | 100.0% |
Internet Access in Granite County
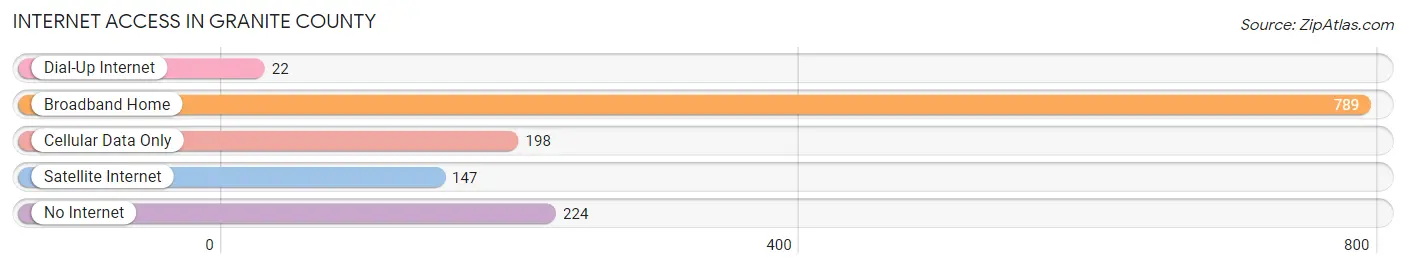
| Internet Type | # Households | % Households |
| Dial-Up Internet | 22 | 1.6% |
| Broadband Home | 789 | 58.8% |
| Cellular Data Only | 198 | 14.7% |
| Satellite Internet | 147 | 11.0% |
| No Internet | 224 | 16.7% |
| Total | 1,343 | 100.0% |
Granite County Summary
Granite County is located in the southwestern part of Montana, and is bordered by Beaverhead County to the north, Deer Lodge County to the east, Powell County to the south, and Idaho to the west. The county seat is Philipsburg, and the largest city is Drummond. The county was established in 1893 and named for the granite formations found in the area.
Geography
Granite County covers an area of 1,845 square miles, making it the fourth largest county in Montana. The county is located in the Rocky Mountains and is home to the Anaconda-Pintler Wilderness, which is part of the Beaverhead-Deerlodge National Forest. The highest point in the county is Mount Haggin, which has an elevation of 9,890 feet. The county is also home to several rivers, including the Big Hole River, the Flint Creek, and the Rock Creek.
The climate of Granite County is semi-arid, with cold winters and hot summers. The average annual precipitation is 13.5 inches, and the average annual snowfall is 40 inches.
Economy
The economy of Granite County is largely based on agriculture and tourism. The county is home to several large ranches, and the main crops grown in the area are hay, wheat, and barley. The county is also home to several tourist attractions, including the Philipsburg Mining Museum, the Granite Ghost Town, and the Garnet Ghost Town.
Demographics
As of the 2010 census, Granite County had a population of 3,079. The racial makeup of the county was 95.3% White, 0.3% African American, 1.2% Native American, 0.3% Asian, 0.1% Pacific Islander, 0.7% from other races, and 2.3% from two or more races. Hispanic or Latino of any race were 2.3% of the population.
The median income for a household in Granite County was $37,917, and the median income for a family was $45,938. The per capita income for the county was $19,945. About 11.2% of families and 14.7% of the population were below the poverty line, including 19.2% of those under age 18 and 8.2% of those age 65 or over.
Conclusion
Granite County is a large county located in the southwestern part of Montana. The county is home to several large ranches and tourist attractions, and the economy is largely based on agriculture and tourism. The population of Granite County is diverse, with a mix of different racial and ethnic backgrounds. The median income for a household in Granite County is lower than the national average, and the poverty rate is higher than the national average.
Common Questions
What is the Total Population of Granite County?
Total Population of Granite County is 3,368.
What is the Total Male Population of Granite County?
Total Male Population of Granite County is 1,724.
What is the Total Female Population of Granite County?
Total Female Population of Granite County is 1,644.
What is the Ratio of Males per 100 Females in Granite County?
There are 104.87 Males per 100 Females in Granite County.
What is the Ratio of Females per 100 Males in Granite County?
There are 95.36 Females per 100 Males in Granite County.
What is the Median Population Age in Granite County?
Median Population Age in Granite County is 54.7 Years.
What is the Average Family Size in Granite County
Average Family Size in Granite County is 2.9 People.
What is the Average Household Size in Granite County
Average Household Size in Granite County is 2.4 People.
What is Per Capita Income in Granite County?
Per Capita income in Granite County is $33,776.
What is the Median Family Income in Granite County?
Median Family Income in Granite County is $65,885.
What is the Median Household income in Granite County?
Median Household Income in Granite County is $53,917.
What is Income or Wage Gap in Granite County?
Income or Wage Gap in Granite County is 12.4%.
Women in Granite County earn 87.6 cents for every dollar earned by a man.
What is Inequality or Gini Index in Granite County?
Inequality or Gini Index in Granite County is 0.49.
How Large is the Labor Force in Granite County?
There are 1,398 People in the Labor Forcein in Granite County.
What is the Percentage of People in the Labor Force in Granite County?
47.9% of People are in the Labor Force in Granite County.
What is the Unemployment Rate in Granite County?
Unemployment Rate in Granite County is 5.7%.