Garfield County, MT
Garfield County Map
Garfield County Overview
976
TOTAL POPULATION
487
MALE POPULATION
489
FEMALE POPULATION
99.59
MALES / 100 FEMALES
100.41
FEMALES / 100 MALES
42.0
MEDIAN AGE
2.9
AVG FAMILY SIZE
2.3
AVG HOUSEHOLD SIZE
$33,745
PER CAPITA INCOME
$83,304
AVG FAMILY INCOME
$61,786
AVG HOUSEHOLD INCOME
30.4%
WAGE / INCOME GAP [ % ]
69.6¢/ $1
WAGE / INCOME GAP [ $ ]
0.46
INEQUALITY / GINI INDEX
536
LABOR FORCE [ PEOPLE ]
70.1%
PERCENT IN LABOR FORCE
Garfield County Area Codes
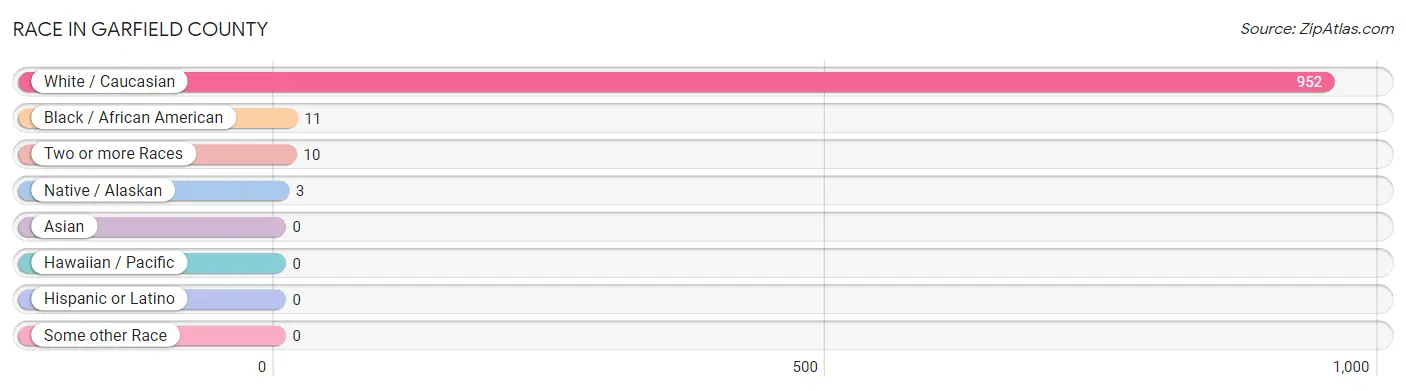
Race in Garfield County
The most populous races in Garfield County are White / Caucasian (952 | 97.5%), Black / African American (11 | 1.1%), and Two or more Races (10 | 1.0%).
| Race | # Population | % Population |
| Asian | 0 | 0.0% |
| Black / African American | 11 | 1.1% |
| Hawaiian / Pacific | 0 | 0.0% |
| Hispanic or Latino | 0 | 0.0% |
| Native / Alaskan | 3 | 0.3% |
| White / Caucasian | 952 | 97.5% |
| Two or more Races | 10 | 1.0% |
| Some other Race | 0 | 0.0% |
| Total | 976 | 100.0% |
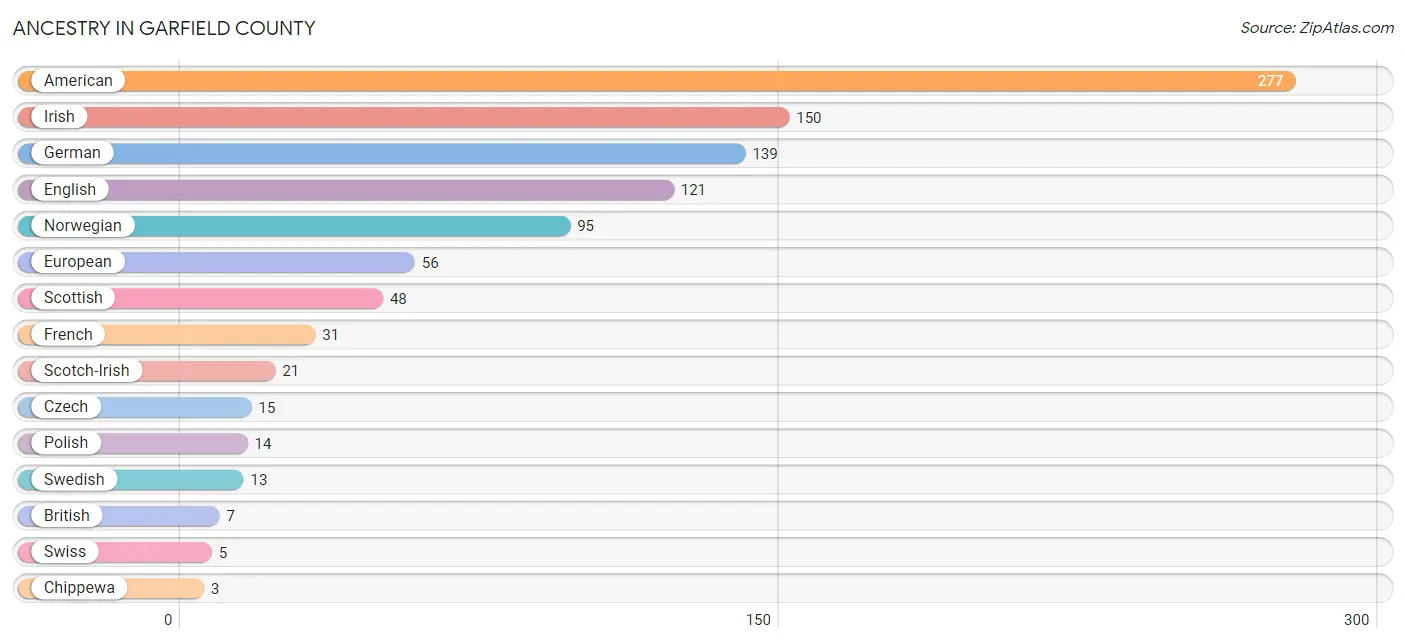
Ancestry in Garfield County
The most populous ancestries reported in Garfield County are American (277 | 28.4%), Irish (150 | 15.4%), German (139 | 14.2%), English (121 | 12.4%), and Norwegian (95 | 9.7%), together accounting for 80.1% of all Garfield County residents.
| Ancestry | # Population | % Population |
| American | 277 | 28.4% |
| British | 7 | 0.7% |
| Chippewa | 3 | 0.3% |
| Croatian | 2 | 0.2% |
| Czech | 15 | 1.5% |
| English | 121 | 12.4% |
| European | 56 | 5.7% |
| French | 31 | 3.2% |
| French Canadian | 1 | 0.1% |
| German | 139 | 14.2% |
| Greek | 1 | 0.1% |
| Hungarian | 2 | 0.2% |
| Irish | 150 | 15.4% |
| Italian | 2 | 0.2% |
| Norwegian | 95 | 9.7% |
| Polish | 14 | 1.4% |
| Scotch-Irish | 21 | 2.1% |
| Scottish | 48 | 4.9% |
| Swedish | 13 | 1.3% |
| Swiss | 5 | 0.5% |
| Welsh | 2 | 0.2% | View All 21 Rows |
Immigrants in Garfield County

| Immigration Origin | # Population | % Population | View All 0 Rows |
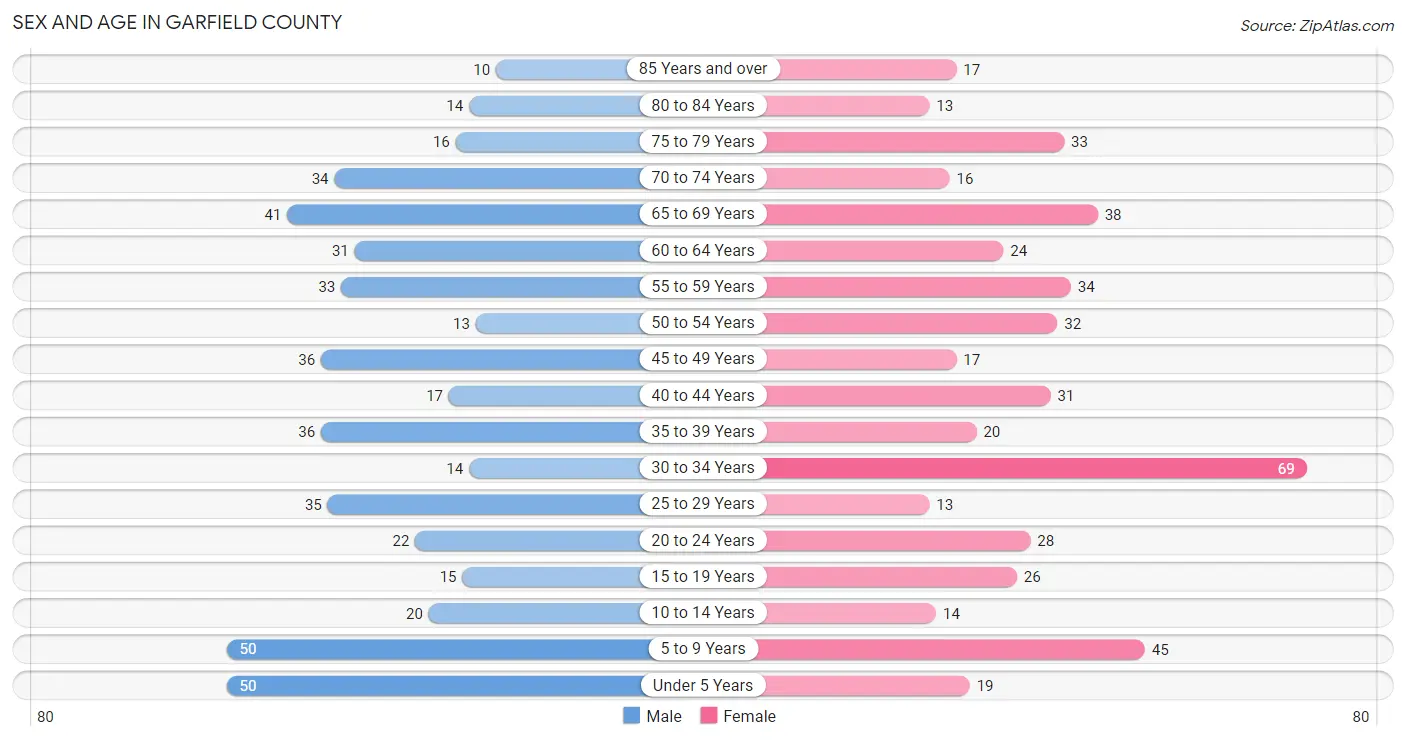
Sex and Age in Garfield County
Sex and Age in Garfield County
The most populous age groups in Garfield County are Under 5 Years (50 | 10.3%) for men and 30 to 34 Years (69 | 14.1%) for women.
| Age Bracket | Male | Female |
| Under 5 Years | 50 (10.3%) | 19 (3.9%) |
| 5 to 9 Years | 50 (10.3%) | 45 (9.2%) |
| 10 to 14 Years | 20 (4.1%) | 14 (2.9%) |
| 15 to 19 Years | 15 (3.1%) | 26 (5.3%) |
| 20 to 24 Years | 22 (4.5%) | 28 (5.7%) |
| 25 to 29 Years | 35 (7.2%) | 13 (2.7%) |
| 30 to 34 Years | 14 (2.9%) | 69 (14.1%) |
| 35 to 39 Years | 36 (7.4%) | 20 (4.1%) |
| 40 to 44 Years | 17 (3.5%) | 31 (6.3%) |
| 45 to 49 Years | 36 (7.4%) | 17 (3.5%) |
| 50 to 54 Years | 13 (2.7%) | 32 (6.5%) |
| 55 to 59 Years | 33 (6.8%) | 34 (7.0%) |
| 60 to 64 Years | 31 (6.4%) | 24 (4.9%) |
| 65 to 69 Years | 41 (8.4%) | 38 (7.8%) |
| 70 to 74 Years | 34 (7.0%) | 16 (3.3%) |
| 75 to 79 Years | 16 (3.3%) | 33 (6.8%) |
| 80 to 84 Years | 14 (2.9%) | 13 (2.7%) |
| 85 Years and over | 10 (2.1%) | 17 (3.5%) |
| Total | 487 (100.0%) | 489 (100.0%) |
Families and Households in Garfield County
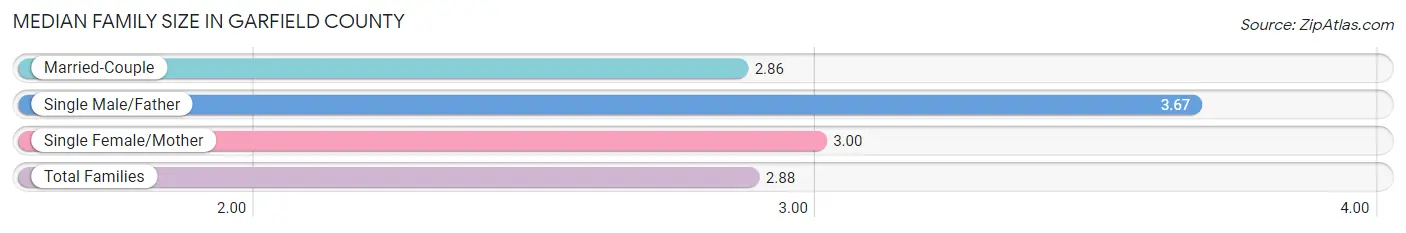
Median Family Size in Garfield County
The median family size in Garfield County is 2.88 persons per family, with single male/father families (3 | 1.1%) accounting for the largest median family size of 3.67 persons per family. On the other hand, married-couple families (257 | 93.4%) represent the smallest median family size with 2.86 persons per family.
| Family Type | # Families | Family Size |
| Married-Couple | 257 (93.4%) | 2.86 |
| Single Male/Father | 3 (1.1%) | 3.67 |
| Single Female/Mother | 15 (5.4%) | 3.00 |
| Total Families | 275 (100.0%) | 2.88 |
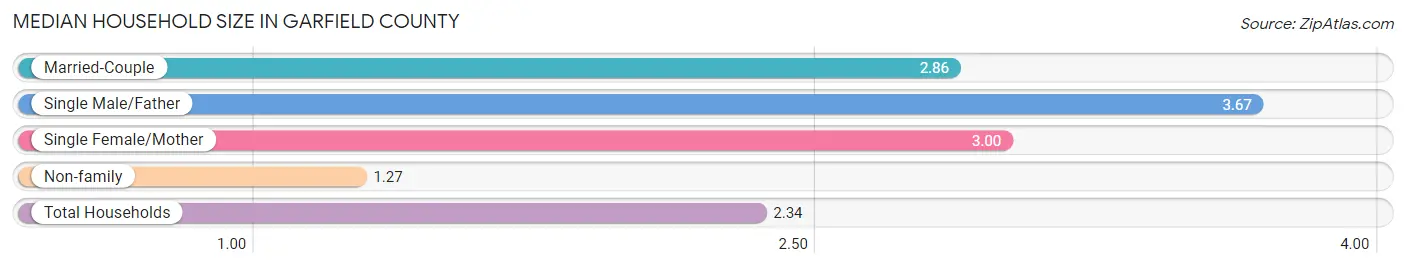
Median Household Size in Garfield County
The median household size in Garfield County is 2.34 persons per household, with single male/father households (3 | 0.7%) accounting for the largest median household size of 3.67 persons per household. non-family households (137 | 33.3%) represent the smallest median household size with 1.27 persons per household.
| Household Type | # Households | Household Size |
| Married-Couple | 257 (62.4%) | 2.86 |
| Single Male/Father | 3 (0.7%) | 3.67 |
| Single Female/Mother | 15 (3.6%) | 3.00 |
| Non-family | 137 (33.3%) | 1.27 |
| Total Households | 412 (100.0%) | 2.34 |
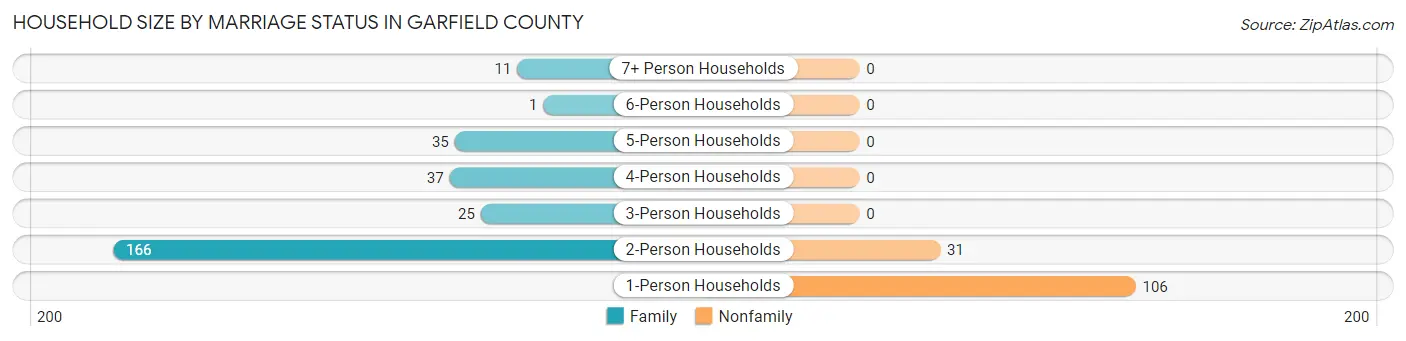
Household Size by Marriage Status in Garfield County
Out of a total of 412 households in Garfield County, 275 (66.7%) are family households, while 137 (33.3%) are nonfamily households. The most numerous type of family households are 2-person households, comprising 166, and the most common type of nonfamily households are 1-person households, comprising 106.
| Household Size | Family Households | Nonfamily Households |
| 1-Person Households | - | 106 (25.7%) |
| 2-Person Households | 166 (40.3%) | 31 (7.5%) |
| 3-Person Households | 25 (6.1%) | 0 (0.0%) |
| 4-Person Households | 37 (9.0%) | 0 (0.0%) |
| 5-Person Households | 35 (8.5%) | 0 (0.0%) |
| 6-Person Households | 1 (0.2%) | 0 (0.0%) |
| 7+ Person Households | 11 (2.7%) | 0 (0.0%) |
| Total | 275 (66.7%) | 137 (33.3%) |
Female Fertility in Garfield County
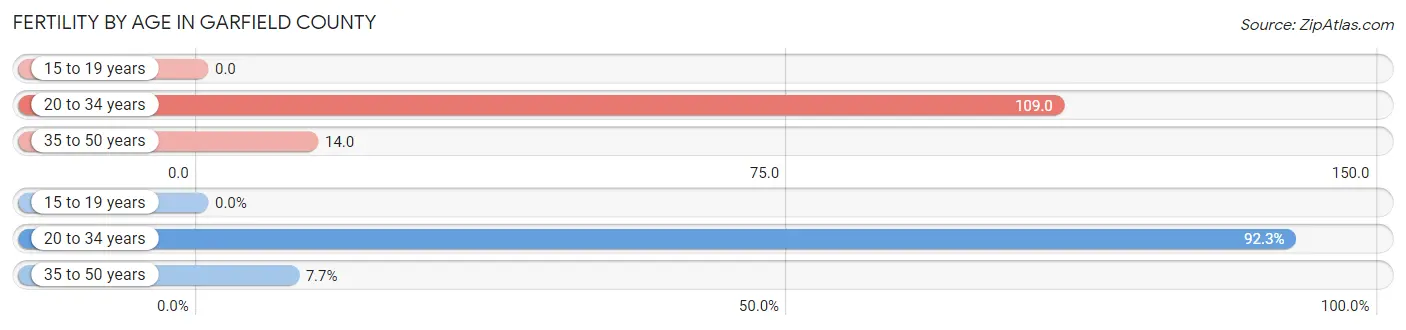
Fertility by Age in Garfield County
Average fertility rate in Garfield County is 62.0 births per 1,000 women. Women in the age bracket of 20 to 34 years have the highest fertility rate with 109.0 births per 1,000 women. Women in the age bracket of 20 to 34 years acount for 92.3% of all women with births.
| Age Bracket | Women with Births | Births / 1,000 Women |
| 15 to 19 years | 0 (0.0%) | 0.0 |
| 20 to 34 years | 12 (92.3%) | 109.0 |
| 35 to 50 years | 1 (7.7%) | 14.0 |
| Total | 13 (100.0%) | 62.0 |
Fertility by Age by Marriage Status in Garfield County
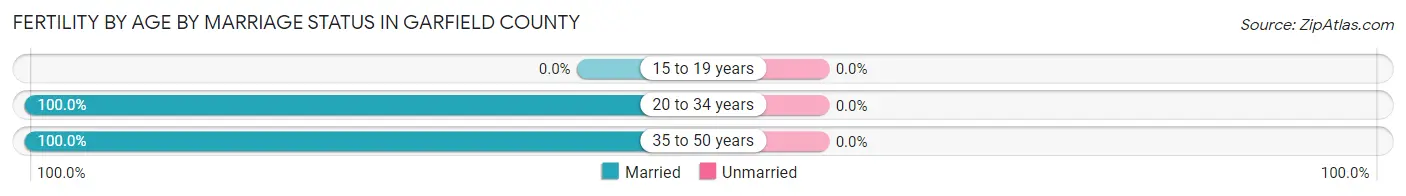
| Age Bracket | Married | Unmarried |
| 15 to 19 years | 0 (0.0%) | 0 (0.0%) |
| 20 to 34 years | 12 (100.0%) | 0 (0.0%) |
| 35 to 50 years | 1 (100.0%) | 0 (0.0%) |
| Total | 13 (100.0%) | 0 (0.0%) |
Fertility by Education in Garfield County
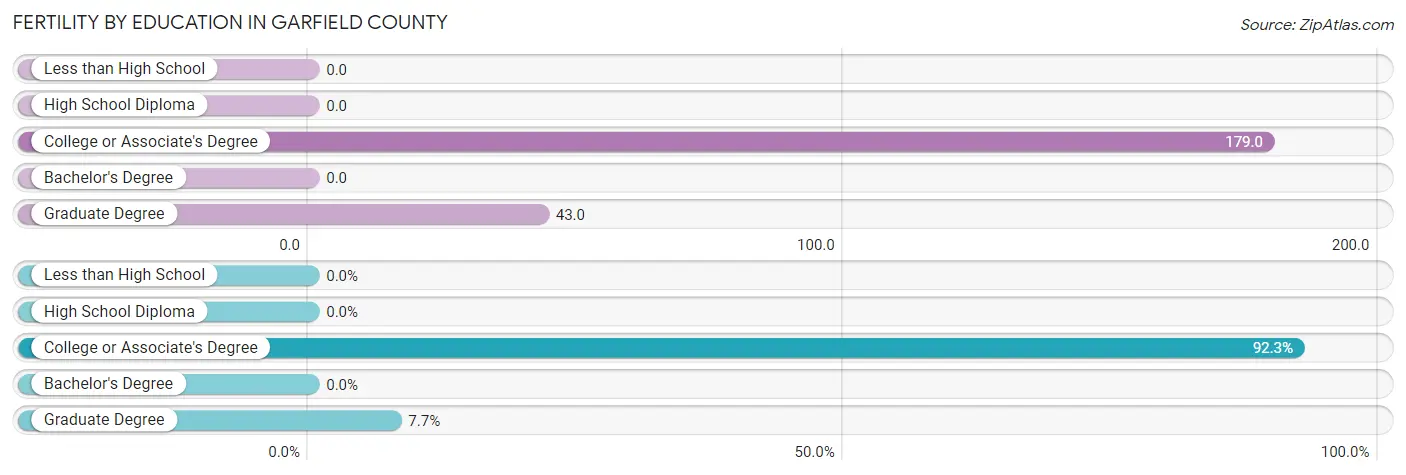
| Educational Attainment | Women with Births | Births / 1,000 Women |
| Less than High School | 0 (0.0%) | 0.0 |
| High School Diploma | 0 (0.0%) | 0.0 |
| College or Associate's Degree | 12 (92.3%) | 179.0 |
| Bachelor's Degree | 0 (0.0%) | 0.0 |
| Graduate Degree | 1 (7.7%) | 43.0 |
| Total | 13 (100.0%) | 62.0 |
Fertility by Education by Marriage Status in Garfield County
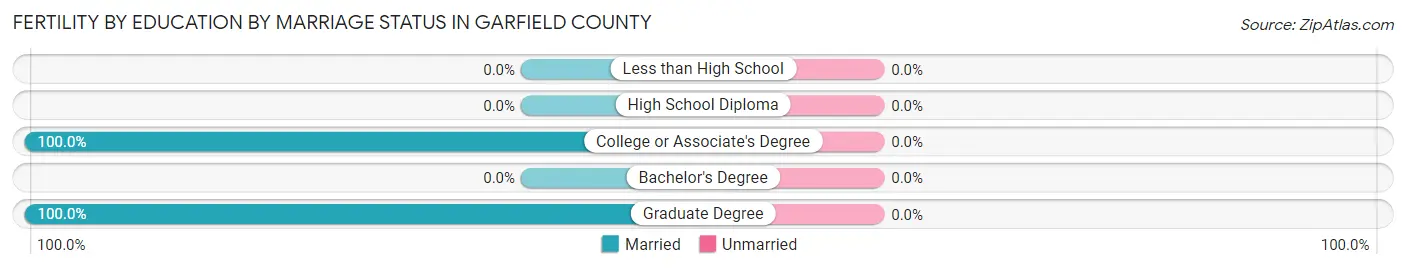
| Educational Attainment | Married | Unmarried |
| Less than High School | 0 (0.0%) | 0 (0.0%) |
| High School Diploma | 0 (0.0%) | 0 (0.0%) |
| College or Associate's Degree | 12 (100.0%) | 0 (0.0%) |
| Bachelor's Degree | 0 (0.0%) | 0 (0.0%) |
| Graduate Degree | 1 (100.0%) | 0 (0.0%) |
| Total | 13 (100.0%) | 0 (0.0%) |
Income in Garfield County
Income Overview in Garfield County
Per Capita Income in Garfield County is $33,745, while median incomes of families and households are $83,304 and $61,786 respectively.
| Characteristic | Number | Measure |
| Per Capita Income | 976 | $33,745 |
| Median Family Income | 275 | $83,304 |
| Mean Family Income | 275 | $103,052 |
| Median Household Income | 412 | $61,786 |
| Mean Household Income | 412 | $84,569 |
| Income Deficit | 275 | $0 |
| Wage / Income Gap (%) | 976 | 30.40% |
| Wage / Income Gap ($) | 976 | 69.60¢ per $1 |
| Gini / Inequality Index | 976 | 0.46 |
Earnings by Sex in Garfield County
Average Earnings in Garfield County are $32,337, $43,214 for men and $30,076 for women, a difference of 30.4%.
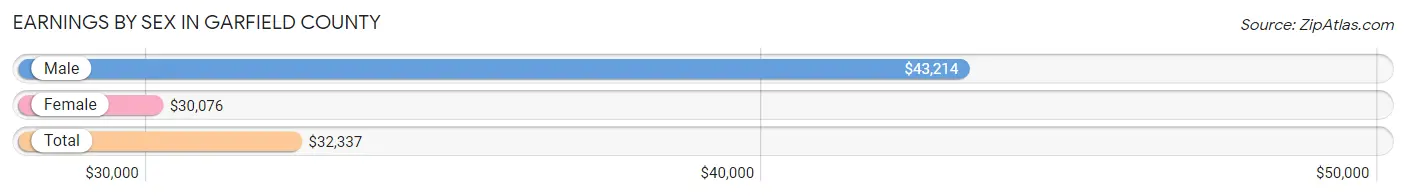
| Sex | Number | Average Earnings |
| Male | 296 (52.1%) | $43,214 |
| Female | 272 (47.9%) | $30,076 |
| Total | 568 (100.0%) | $32,337 |
Earnings by Sex by Income Bracket in Garfield County
The most common earnings brackets in Garfield County are $100,000+ for men (50 | 16.9%) and $30,000 to $34,999 for women (36 | 13.2%).
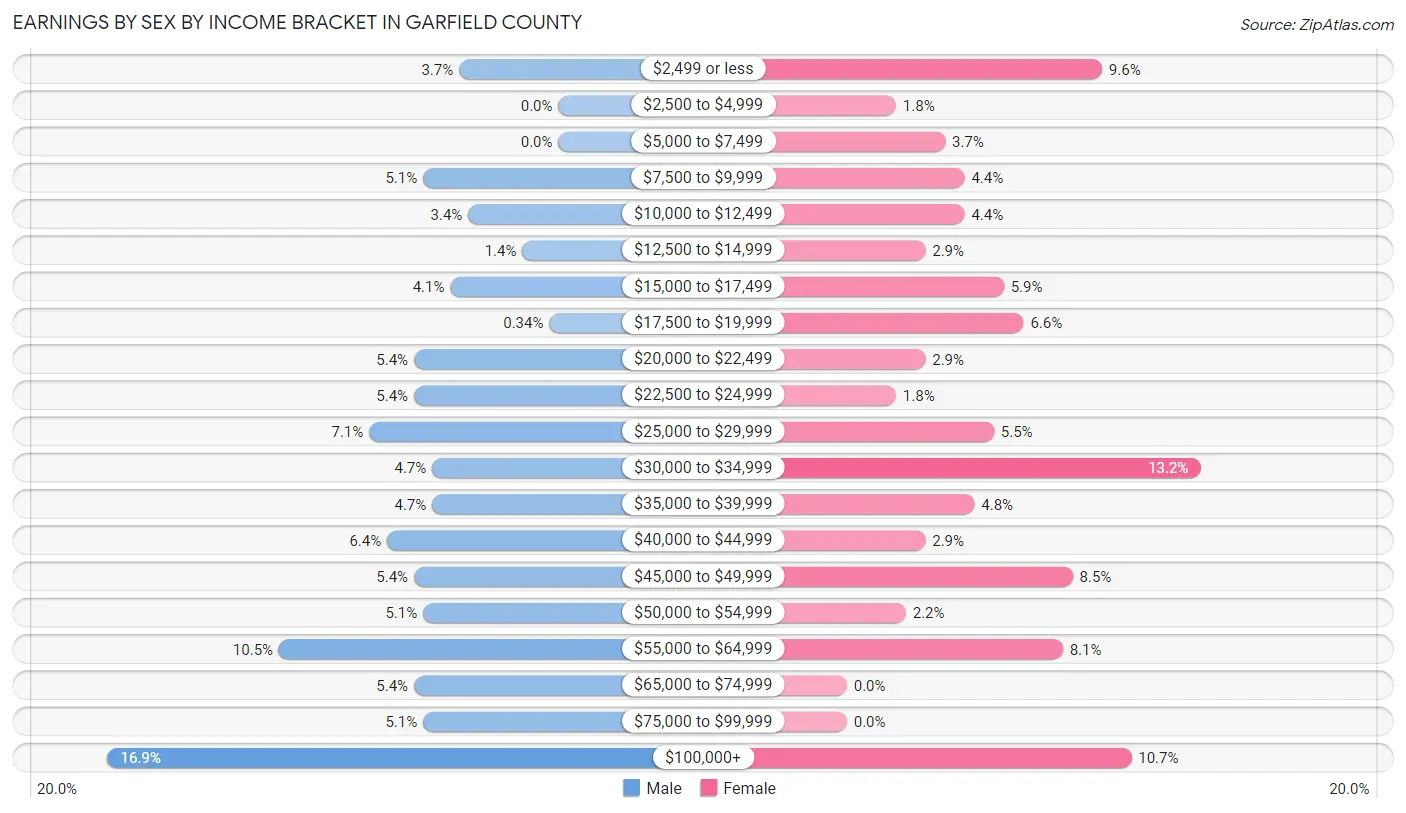
| Income | Male | Female |
| $2,499 or less | 11 (3.7%) | 26 (9.6%) |
| $2,500 to $4,999 | 0 (0.0%) | 5 (1.8%) |
| $5,000 to $7,499 | 0 (0.0%) | 10 (3.7%) |
| $7,500 to $9,999 | 15 (5.1%) | 12 (4.4%) |
| $10,000 to $12,499 | 10 (3.4%) | 12 (4.4%) |
| $12,500 to $14,999 | 4 (1.3%) | 8 (2.9%) |
| $15,000 to $17,499 | 12 (4.1%) | 16 (5.9%) |
| $17,500 to $19,999 | 1 (0.3%) | 18 (6.6%) |
| $20,000 to $22,499 | 16 (5.4%) | 8 (2.9%) |
| $22,500 to $24,999 | 16 (5.4%) | 5 (1.8%) |
| $25,000 to $29,999 | 21 (7.1%) | 15 (5.5%) |
| $30,000 to $34,999 | 14 (4.7%) | 36 (13.2%) |
| $35,000 to $39,999 | 14 (4.7%) | 13 (4.8%) |
| $40,000 to $44,999 | 19 (6.4%) | 8 (2.9%) |
| $45,000 to $49,999 | 16 (5.4%) | 23 (8.5%) |
| $50,000 to $54,999 | 15 (5.1%) | 6 (2.2%) |
| $55,000 to $64,999 | 31 (10.5%) | 22 (8.1%) |
| $65,000 to $74,999 | 16 (5.4%) | 0 (0.0%) |
| $75,000 to $99,999 | 15 (5.1%) | 0 (0.0%) |
| $100,000+ | 50 (16.9%) | 29 (10.7%) |
| Total | 296 (100.0%) | 272 (100.0%) |
Earnings by Sex by Educational Attainment in Garfield County
Average earnings in Garfield County are $45,227 for men and $31,053 for women, a difference of 31.3%. Men with an educational attainment of high school diploma enjoy the highest average annual earnings of $47,500, while those with college or associate's degree education earn the least with $37,250. Women with an educational attainment of bachelor's degree earn the most with the average annual earnings of $56,563, while those with high school diploma education have the smallest earnings of $25,625.
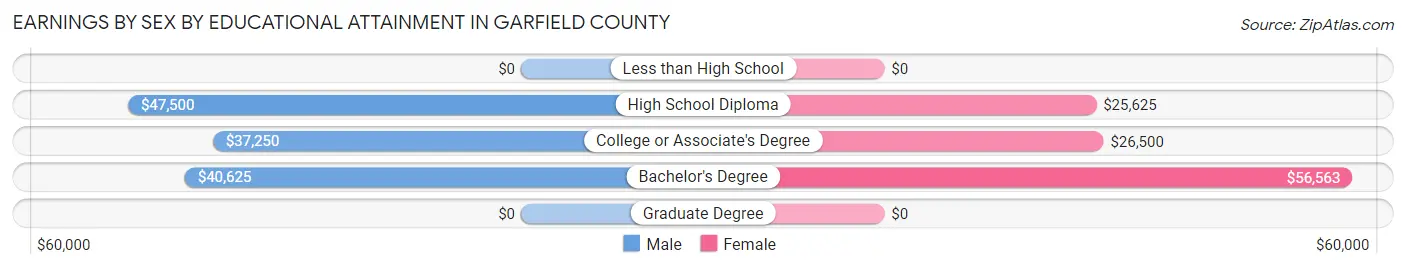
| Educational Attainment | Male Income | Female Income |
| Less than High School | - | - |
| High School Diploma | $47,500 | $25,625 |
| College or Associate's Degree | $37,250 | $26,500 |
| Bachelor's Degree | $40,625 | $56,563 |
| Graduate Degree | - | - |
| Total | $45,227 | $31,053 |
Family Income in Garfield County
Family Income Brackets in Garfield County
According to the Garfield County family income data, there are 55 families falling into the $100,000 to $149,999 income range, which is the most common income bracket and makes up 20.0% of all families. Conversely, the less than $10,000 income bracket is the least frequent group with only 6 families (2.2%) belonging to this category.
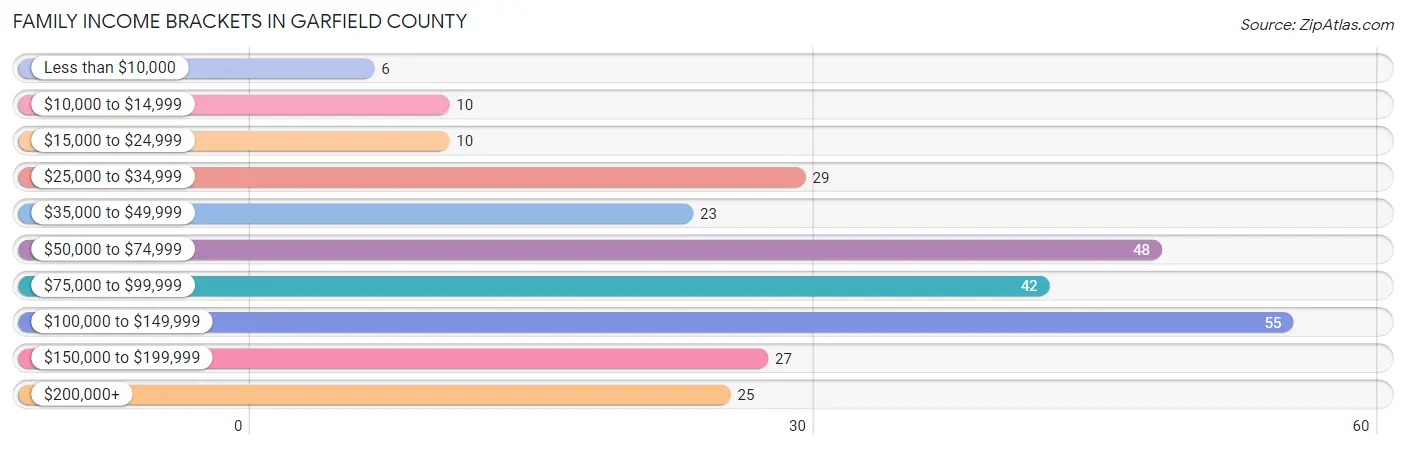
| Income Bracket | # Families | % Families |
| Less than $10,000 | 6 | 2.2% |
| $10,000 to $14,999 | 10 | 3.6% |
| $15,000 to $24,999 | 10 | 3.6% |
| $25,000 to $34,999 | 29 | 10.5% |
| $35,000 to $49,999 | 23 | 8.4% |
| $50,000 to $74,999 | 48 | 17.5% |
| $75,000 to $99,999 | 42 | 15.3% |
| $100,000 to $149,999 | 55 | 20.0% |
| $150,000 to $199,999 | 27 | 9.8% |
| $200,000+ | 25 | 9.1% |
Family Income by Famaliy Size in Garfield County
7+ person families (11 | 4.0%) account for the highest median family income in Garfield County with $137,250 per family, while 2-person families (166 | 60.4%) have the highest median income of $41,696 per family member.
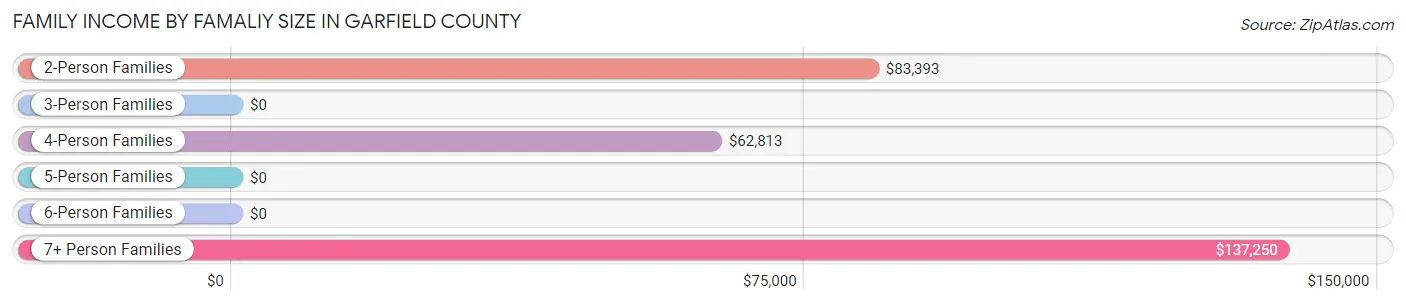
| Income Bracket | # Families | Median Income |
| 2-Person Families | 166 (60.4%) | $83,393 |
| 3-Person Families | 25 (9.1%) | $0 |
| 4-Person Families | 37 (13.5%) | $62,813 |
| 5-Person Families | 35 (12.7%) | $0 |
| 6-Person Families | 1 (0.4%) | $0 |
| 7+ Person Families | 11 (4.0%) | $137,250 |
| Total | 275 (100.0%) | $83,304 |
Family Income by Number of Earners in Garfield County
The median family income in Garfield County is $83,304, with families comprising 3+ earners (19) having the highest median family income of $190,938, while families with no earners (37) have the lowest median family income of $27,917, accounting for 6.9% and 13.5% of families, respectively.
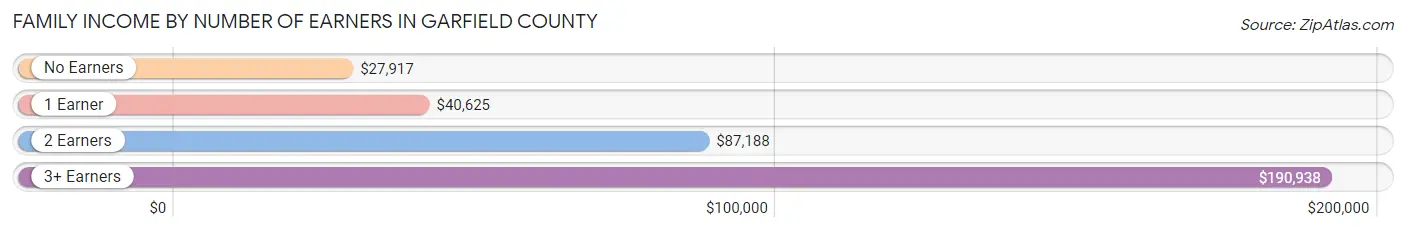
| Number of Earners | # Families | Median Income |
| No Earners | 37 (13.5%) | $27,917 |
| 1 Earner | 56 (20.4%) | $40,625 |
| 2 Earners | 163 (59.3%) | $87,188 |
| 3+ Earners | 19 (6.9%) | $190,938 |
| Total | 275 (100.0%) | $83,304 |
Household Income in Garfield County
Household Income Brackets in Garfield County
With 74 households falling in the category, the $50,000 to $74,999 income range is the most frequent in Garfield County, accounting for 18.0% of all households. In contrast, only 9 households (2.2%) fall into the less than $10,000 income bracket, making it the least populous group.
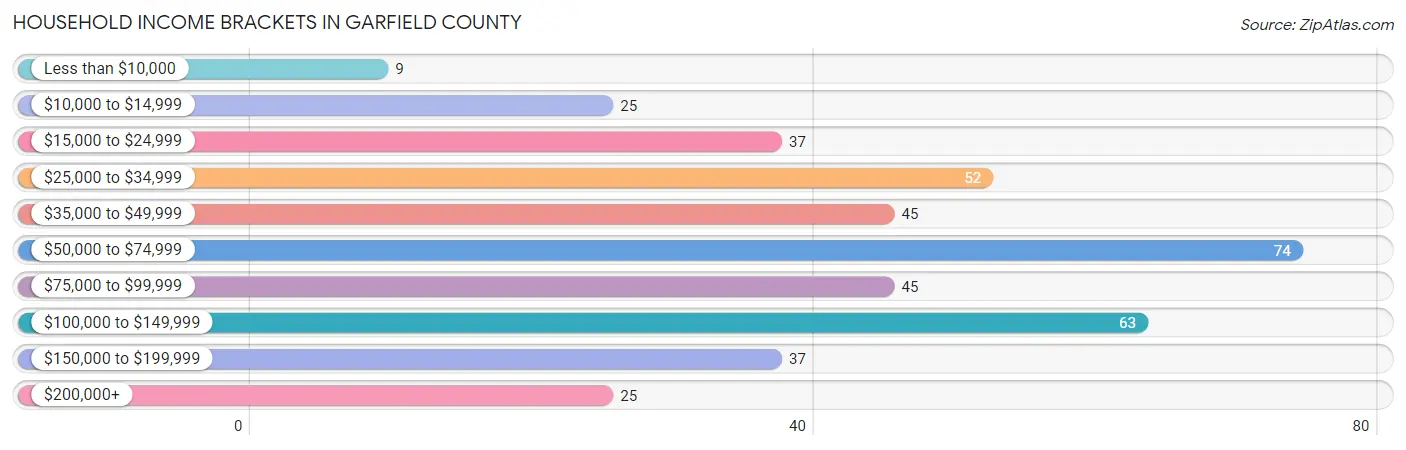
| Income Bracket | # Households | % Households |
| Less than $10,000 | 9 | 2.2% |
| $10,000 to $14,999 | 25 | 6.1% |
| $15,000 to $24,999 | 37 | 9.0% |
| $25,000 to $34,999 | 52 | 12.6% |
| $35,000 to $49,999 | 45 | 10.9% |
| $50,000 to $74,999 | 74 | 18.0% |
| $75,000 to $99,999 | 45 | 10.9% |
| $100,000 to $149,999 | 63 | 15.3% |
| $150,000 to $199,999 | 37 | 9.0% |
| $200,000+ | 25 | 6.1% |
Household Income by Householder Age in Garfield County
The median household income in Garfield County is $61,786, with the highest median household income of $72,500 found in the 25 to 44 years age bracket for the primary householder. A total of 134 households (32.5%) fall into this category. Meanwhile, the 15 to 24 years age bracket for the primary householder has the lowest median household income of $28,750, with 24 households (5.8%) in this group.
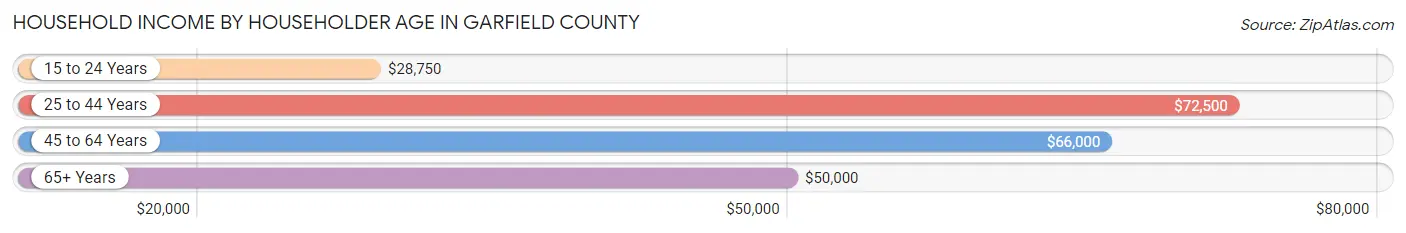
| Income Bracket | # Households | Median Income |
| 15 to 24 Years | 24 (5.8%) | $28,750 |
| 25 to 44 Years | 134 (32.5%) | $72,500 |
| 45 to 64 Years | 112 (27.2%) | $66,000 |
| 65+ Years | 142 (34.5%) | $50,000 |
| Total | 412 (100.0%) | $61,786 |
Poverty in Garfield County
Income Below Poverty by Sex and Age in Garfield County
With 7.0% poverty level for males and 11.8% for females among the residents of Garfield County, under 5 year old males and 18 to 24 year old females are the most vulnerable to poverty, with 12 males (24.0%) and 20 females (41.7%) in their respective age groups living below the poverty level.
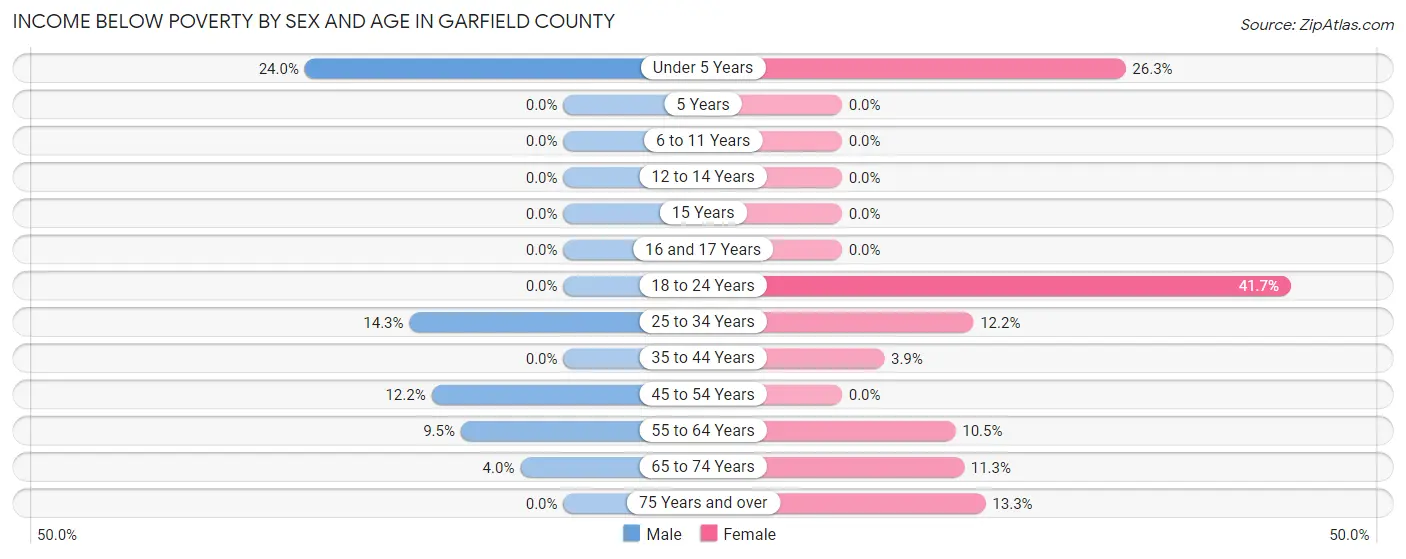
| Age Bracket | Male | Female |
| Under 5 Years | 12 (24.0%) | 5 (26.3%) |
| 5 Years | 0 (0.0%) | 0 (0.0%) |
| 6 to 11 Years | 0 (0.0%) | 0 (0.0%) |
| 12 to 14 Years | 0 (0.0%) | 0 (0.0%) |
| 15 Years | 0 (0.0%) | 0 (0.0%) |
| 16 and 17 Years | 0 (0.0%) | 0 (0.0%) |
| 18 to 24 Years | 0 (0.0%) | 20 (41.7%) |
| 25 to 34 Years | 7 (14.3%) | 10 (12.2%) |
| 35 to 44 Years | 0 (0.0%) | 2 (3.9%) |
| 45 to 54 Years | 6 (12.2%) | 0 (0.0%) |
| 55 to 64 Years | 6 (9.5%) | 6 (10.5%) |
| 65 to 74 Years | 3 (4.0%) | 6 (11.3%) |
| 75 Years and over | 0 (0.0%) | 8 (13.3%) |
| Total | 34 (7.0%) | 57 (11.8%) |
Income Above Poverty by Sex and Age in Garfield County
According to the poverty statistics in Garfield County, males aged 5 years and females aged 5 years are the age groups that are most secure financially, with 100.0% of males and 100.0% of females in these age groups living above the poverty line.
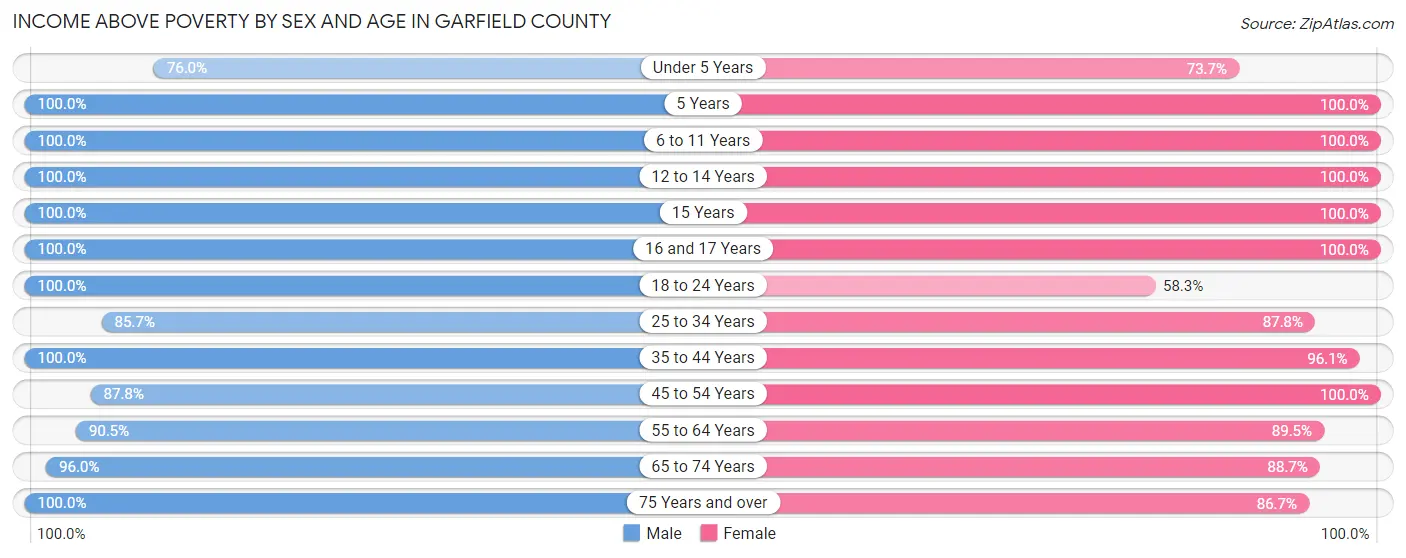
| Age Bracket | Male | Female |
| Under 5 Years | 38 (76.0%) | 14 (73.7%) |
| 5 Years | 2 (100.0%) | 17 (100.0%) |
| 6 to 11 Years | 57 (100.0%) | 36 (100.0%) |
| 12 to 14 Years | 11 (100.0%) | 6 (100.0%) |
| 15 Years | 11 (100.0%) | 2 (100.0%) |
| 16 and 17 Years | 4 (100.0%) | 4 (100.0%) |
| 18 to 24 Years | 22 (100.0%) | 28 (58.3%) |
| 25 to 34 Years | 42 (85.7%) | 72 (87.8%) |
| 35 to 44 Years | 53 (100.0%) | 49 (96.1%) |
| 45 to 54 Years | 43 (87.8%) | 48 (100.0%) |
| 55 to 64 Years | 57 (90.5%) | 51 (89.5%) |
| 65 to 74 Years | 72 (96.0%) | 47 (88.7%) |
| 75 Years and over | 37 (100.0%) | 52 (86.7%) |
| Total | 449 (93.0%) | 426 (88.2%) |
Income Below Poverty Among Married-Couple Families in Garfield County
The poverty statistics for married-couple families in Garfield County show that 7.8% or 20 of the total 257 families live below the poverty line. Families with 1 or 2 children have the highest poverty rate of 14.6%, comprising of 7 families. On the other hand, families with 3 or 4 children have the lowest poverty rate of 0.0%, which includes 0 families.
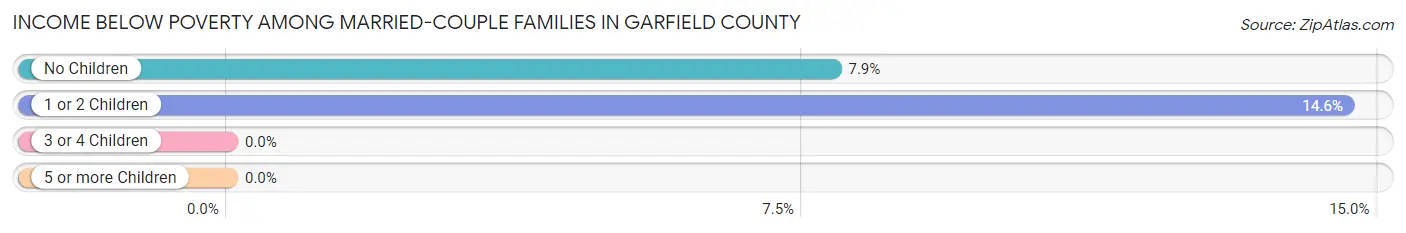
| Children | Above Poverty | Below Poverty |
| No Children | 152 (92.1%) | 13 (7.9%) |
| 1 or 2 Children | 41 (85.4%) | 7 (14.6%) |
| 3 or 4 Children | 38 (100.0%) | 0 (0.0%) |
| 5 or more Children | 6 (100.0%) | 0 (0.0%) |
| Total | 237 (92.2%) | 20 (7.8%) |
Income Below Poverty Among Single-Parent Households in Garfield County
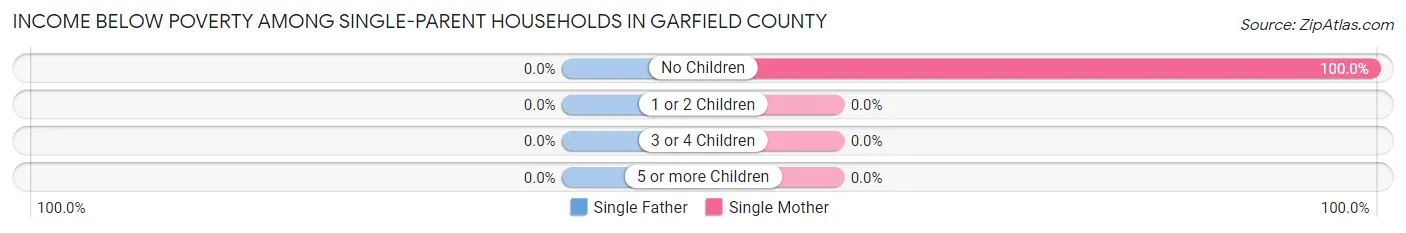
| Children | Single Father | Single Mother |
| No Children | 0 (0.0%) | 2 (100.0%) |
| 1 or 2 Children | 0 (0.0%) | 0 (0.0%) |
| 3 or 4 Children | 0 (0.0%) | 0 (0.0%) |
| 5 or more Children | 0 (0.0%) | 0 (0.0%) |
| Total | 0 (0.0%) | 2 (13.3%) |
Income Below Poverty Among Married-Couple vs Single-Parent Households in Garfield County
The poverty data for Garfield County shows that 20 of the married-couple family households (7.8%) and 2 of the single-parent households (11.1%) are living below the poverty level. Within the married-couple family households, those with 1 or 2 children have the highest poverty rate, with 7 households (14.6%) falling below the poverty line. Among the single-parent households, those with no children have the highest poverty rate, with 2 household (66.7%) living below poverty.
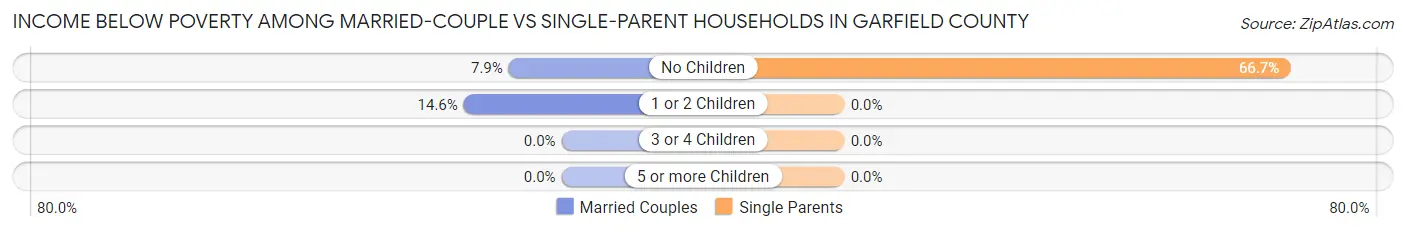
| Children | Married-Couple Families | Single-Parent Households |
| No Children | 13 (7.9%) | 2 (66.7%) |
| 1 or 2 Children | 7 (14.6%) | 0 (0.0%) |
| 3 or 4 Children | 0 (0.0%) | 0 (0.0%) |
| 5 or more Children | 0 (0.0%) | 0 (0.0%) |
| Total | 20 (7.8%) | 2 (11.1%) |
Employment Characteristics in Garfield County
Employment by Class of Employer in Garfield County
Among the 517 employed individuals in Garfield County, private company employees (183 | 35.4%), self-employed (incorporated) (128 | 24.8%), and self-employed (not incorporated) (118 | 22.8%) make up the most common classes of employment.
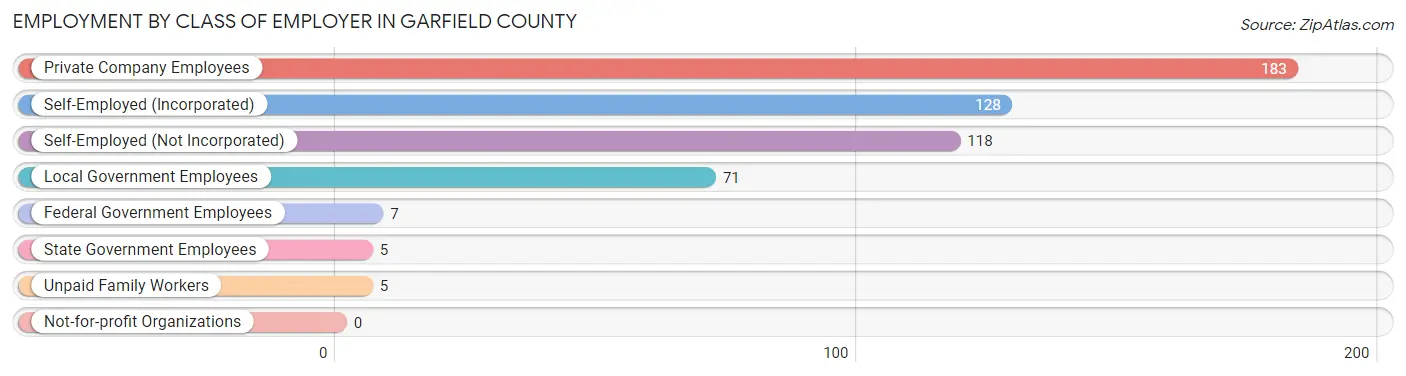
| Employer Class | # Employees | % Employees |
| Private Company Employees | 183 | 35.4% |
| Self-Employed (Incorporated) | 128 | 24.8% |
| Self-Employed (Not Incorporated) | 118 | 22.8% |
| Not-for-profit Organizations | 0 | 0.0% |
| Local Government Employees | 71 | 13.7% |
| State Government Employees | 5 | 1.0% |
| Federal Government Employees | 7 | 1.3% |
| Unpaid Family Workers | 5 | 1.0% |
| Total | 517 | 100.0% |
Employment Status by Age in Garfield County
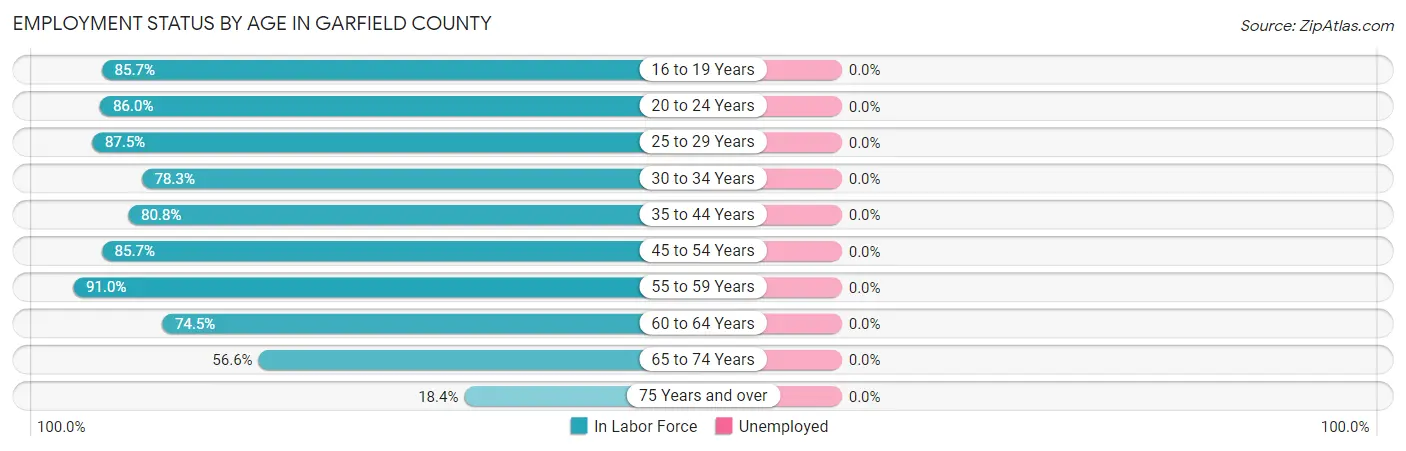
| Age Bracket | In Labor Force | Unemployed |
| 16 to 19 Years | 24 (85.7%) | 0 (0.0%) |
| 20 to 24 Years | 43 (86.0%) | 0 (0.0%) |
| 25 to 29 Years | 42 (87.5%) | 0 (0.0%) |
| 30 to 34 Years | 65 (78.3%) | 0 (0.0%) |
| 35 to 44 Years | 84 (80.8%) | 0 (0.0%) |
| 45 to 54 Years | 84 (85.7%) | 0 (0.0%) |
| 55 to 59 Years | 61 (91.0%) | 0 (0.0%) |
| 60 to 64 Years | 41 (74.5%) | 0 (0.0%) |
| 65 to 74 Years | 73 (56.6%) | 0 (0.0%) |
| 75 Years and over | 19 (18.4%) | 0 (0.0%) |
| Total | 536 (70.1%) | 0 (0.0%) |
Employment Status by Educational Attainment in Garfield County
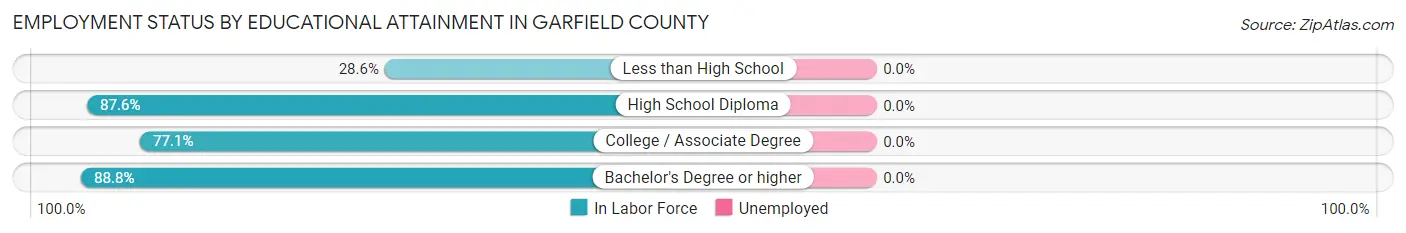
| Educational Attainment | In Labor Force | Unemployed |
| Less than High School | 2 (28.6%) | 0 (0.0%) |
| High School Diploma | 134 (87.6%) | 0 (0.0%) |
| College / Associate Degree | 138 (77.1%) | 0 (0.0%) |
| Bachelor's Degree or higher | 103 (88.8%) | 0 (0.0%) |
| Total | 377 (82.9%) | 0 (0.0%) |
Employment Occupations by Sex in Garfield County
Management, Business, Science and Arts Occupations
The most common Management, Business, Science and Arts occupations in Garfield County are Management (207 | 38.6%), Community & Social Service (43 | 8.0%), Education Instruction & Library (37 | 6.9%), Health Diagnosing & Treating (33 | 6.2%), and Health Technologists (33 | 6.2%).
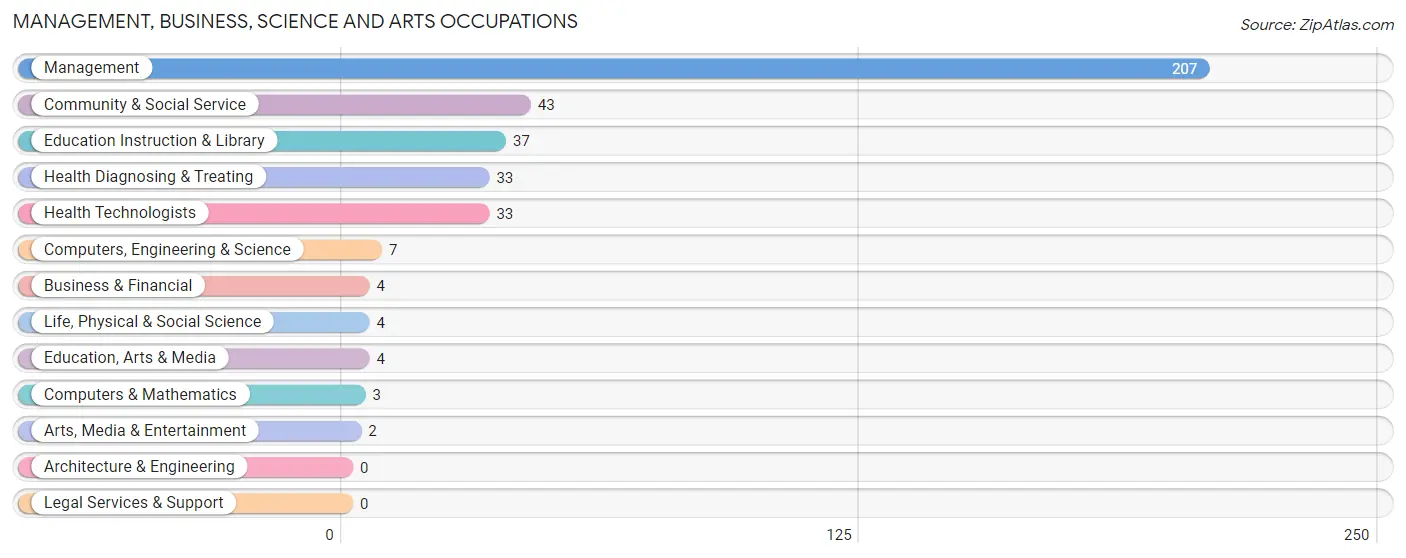
Management, Business, Science and Arts Occupations by Sex
Within the Management, Business, Science and Arts occupations in Garfield County, the most male-oriented occupations are Computers & Mathematics (100.0%), Business & Financial (75.0%), and Management (69.6%), while the most female-oriented occupations are Life, Physical & Social Science (100.0%), Community & Social Service (100.0%), and Education, Arts & Media (100.0%).
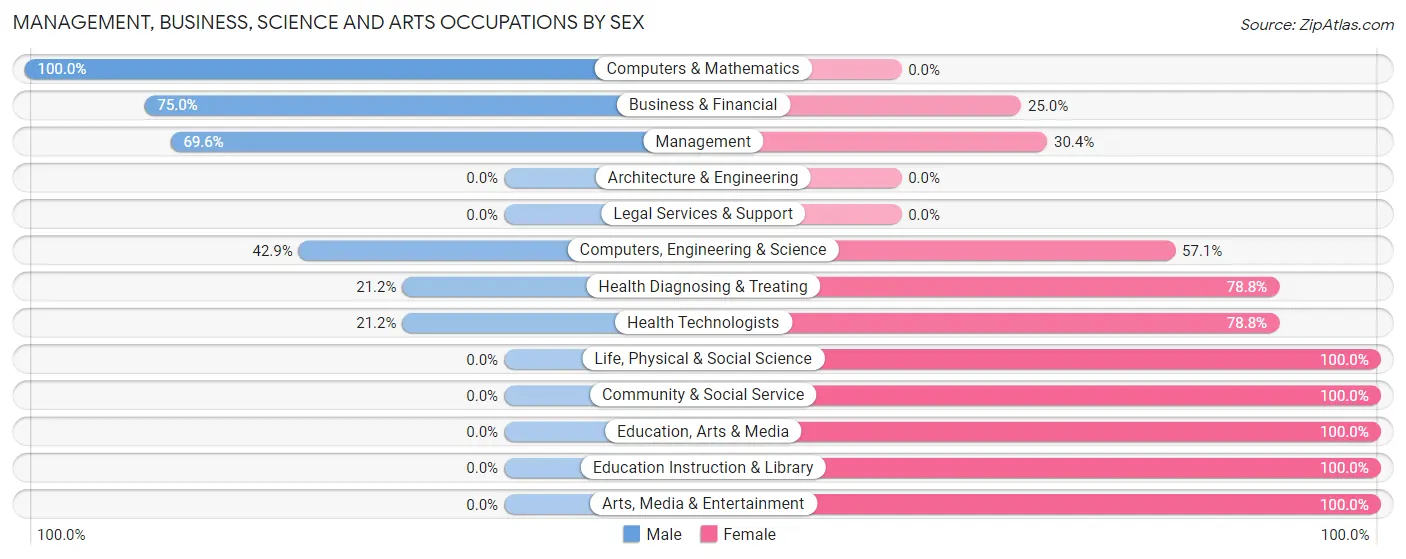
| Occupation | Male | Female |
| Management | 144 (69.6%) | 63 (30.4%) |
| Business & Financial | 3 (75.0%) | 1 (25.0%) |
| Computers, Engineering & Science | 3 (42.9%) | 4 (57.1%) |
| Computers & Mathematics | 3 (100.0%) | 0 (0.0%) |
| Architecture & Engineering | 0 (0.0%) | 0 (0.0%) |
| Life, Physical & Social Science | 0 (0.0%) | 4 (100.0%) |
| Community & Social Service | 0 (0.0%) | 43 (100.0%) |
| Education, Arts & Media | 0 (0.0%) | 4 (100.0%) |
| Legal Services & Support | 0 (0.0%) | 0 (0.0%) |
| Education Instruction & Library | 0 (0.0%) | 37 (100.0%) |
| Arts, Media & Entertainment | 0 (0.0%) | 2 (100.0%) |
| Health Diagnosing & Treating | 7 (21.2%) | 26 (78.8%) |
| Health Technologists | 7 (21.2%) | 26 (78.8%) |
| Total (Category) | 157 (53.4%) | 137 (46.6%) |
| Total (Overall) | 276 (51.5%) | 260 (48.5%) |
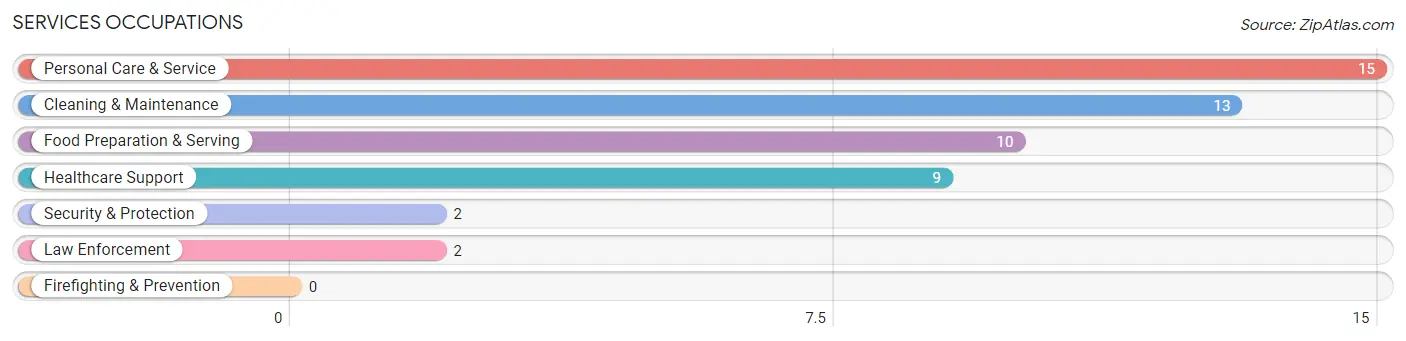
Services Occupations
The most common Services occupations in Garfield County are Personal Care & Service (15 | 2.8%), Cleaning & Maintenance (13 | 2.4%), Food Preparation & Serving (10 | 1.9%), Healthcare Support (9 | 1.7%), and Security & Protection (2 | 0.4%).
Services Occupations by Sex
Within the Services occupations in Garfield County, the most male-oriented occupations are Security & Protection (100.0%), Law Enforcement (100.0%), and Food Preparation & Serving (100.0%), while the most female-oriented occupations are Healthcare Support (100.0%), Personal Care & Service (86.7%), and Cleaning & Maintenance (38.5%).
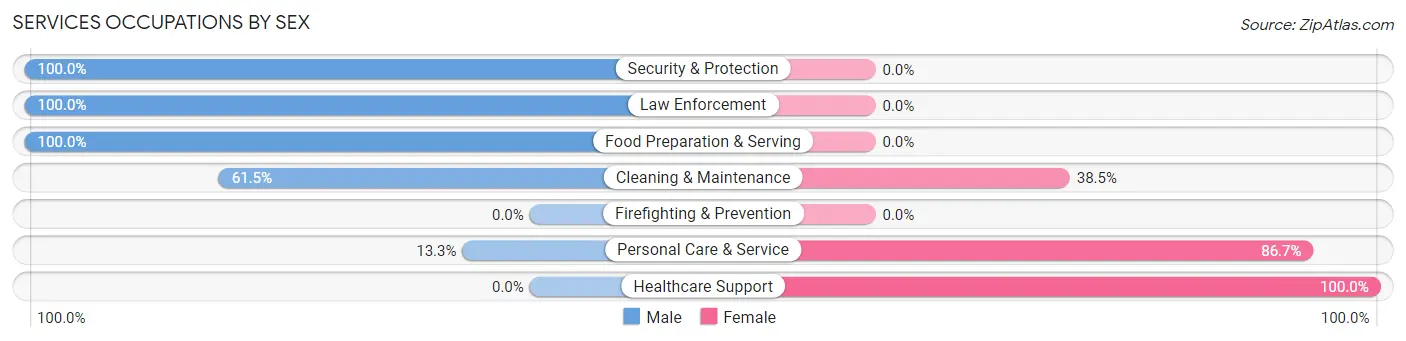
| Occupation | Male | Female |
| Healthcare Support | 0 (0.0%) | 9 (100.0%) |
| Security & Protection | 2 (100.0%) | 0 (0.0%) |
| Firefighting & Prevention | 0 (0.0%) | 0 (0.0%) |
| Law Enforcement | 2 (100.0%) | 0 (0.0%) |
| Food Preparation & Serving | 10 (100.0%) | 0 (0.0%) |
| Cleaning & Maintenance | 8 (61.5%) | 5 (38.5%) |
| Personal Care & Service | 2 (13.3%) | 13 (86.7%) |
| Total (Category) | 22 (44.9%) | 27 (55.1%) |
| Total (Overall) | 276 (51.5%) | 260 (48.5%) |
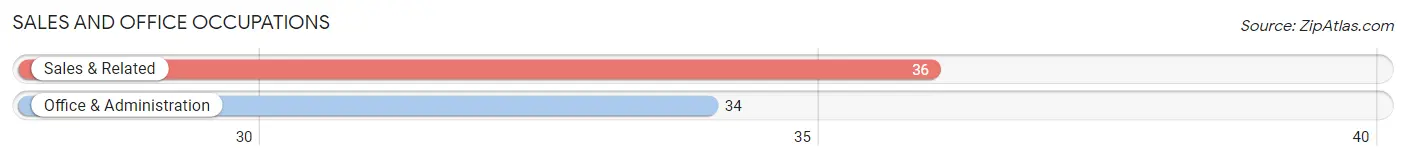
Sales and Office Occupations
The most common Sales and Office occupations in Garfield County are Sales & Related (36 | 6.7%), and Office & Administration (34 | 6.3%).
Sales and Office Occupations by Sex
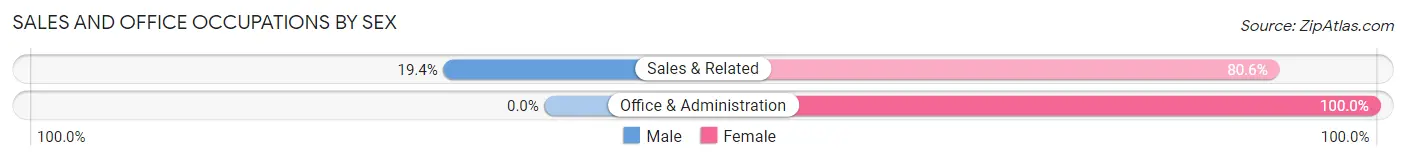
| Occupation | Male | Female |
| Sales & Related | 7 (19.4%) | 29 (80.6%) |
| Office & Administration | 0 (0.0%) | 34 (100.0%) |
| Total (Category) | 7 (10.0%) | 63 (90.0%) |
| Total (Overall) | 276 (51.5%) | 260 (48.5%) |
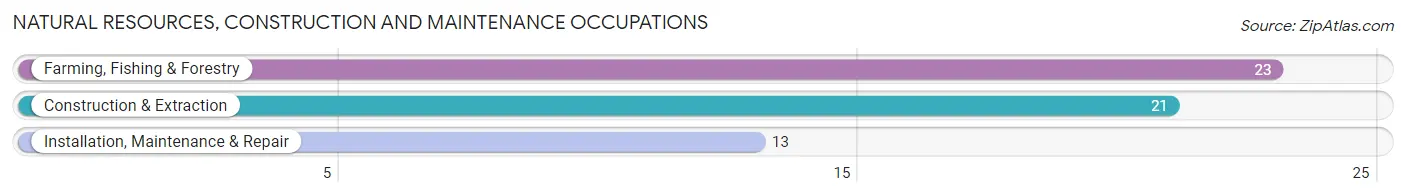
Natural Resources, Construction and Maintenance Occupations
The most common Natural Resources, Construction and Maintenance occupations in Garfield County are Farming, Fishing & Forestry (23 | 4.3%), Construction & Extraction (21 | 3.9%), and Installation, Maintenance & Repair (13 | 2.4%).
Natural Resources, Construction and Maintenance Occupations by Sex
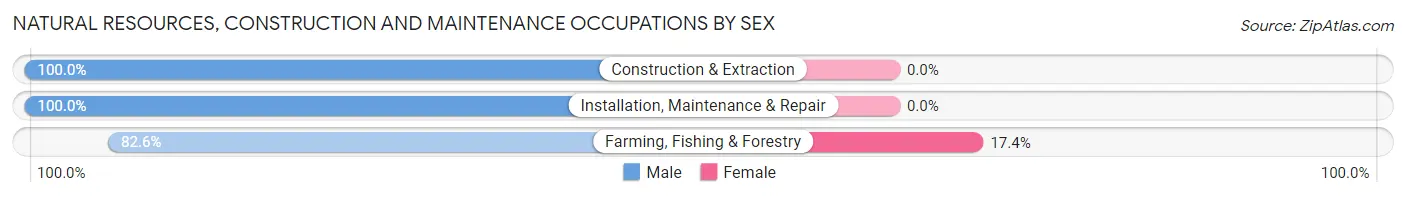
| Occupation | Male | Female |
| Farming, Fishing & Forestry | 19 (82.6%) | 4 (17.4%) |
| Construction & Extraction | 21 (100.0%) | 0 (0.0%) |
| Installation, Maintenance & Repair | 13 (100.0%) | 0 (0.0%) |
| Total (Category) | 53 (93.0%) | 4 (7.0%) |
| Total (Overall) | 276 (51.5%) | 260 (48.5%) |
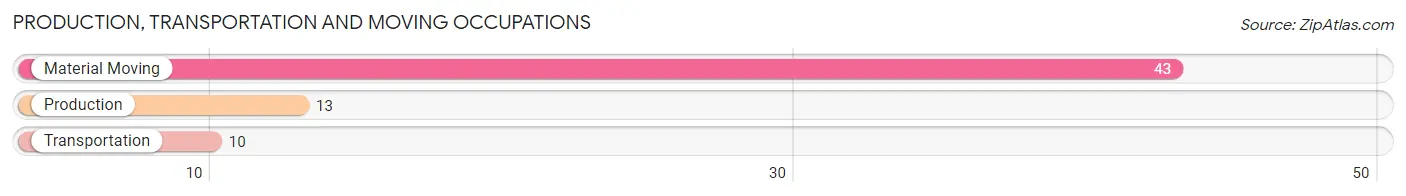
Production, Transportation and Moving Occupations
The most common Production, Transportation and Moving occupations in Garfield County are Material Moving (43 | 8.0%), Production (13 | 2.4%), and Transportation (10 | 1.9%).
Production, Transportation and Moving Occupations by Sex
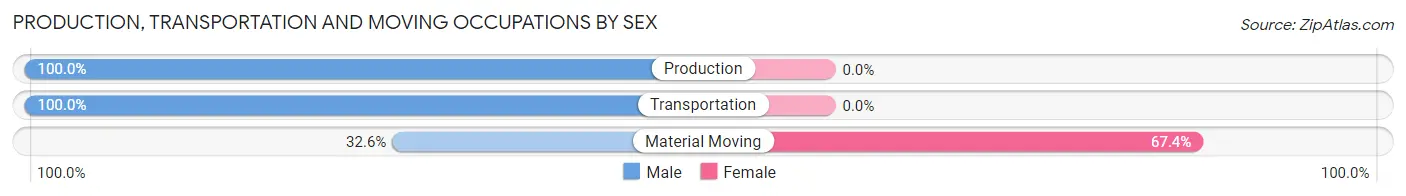
| Occupation | Male | Female |
| Production | 13 (100.0%) | 0 (0.0%) |
| Transportation | 10 (100.0%) | 0 (0.0%) |
| Material Moving | 14 (32.6%) | 29 (67.4%) |
| Total (Category) | 37 (56.1%) | 29 (43.9%) |
| Total (Overall) | 276 (51.5%) | 260 (48.5%) |
Employment Industries by Sex in Garfield County
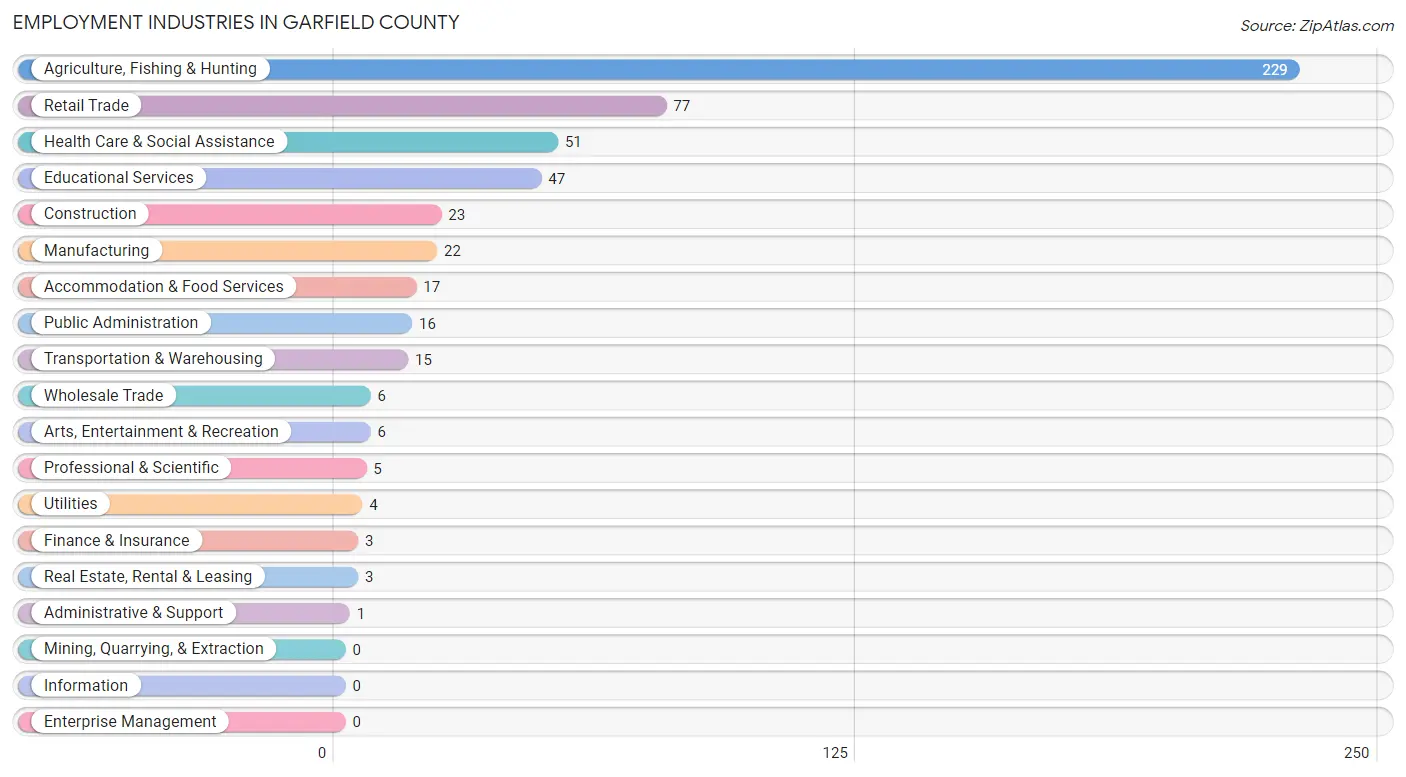
Employment Industries in Garfield County
The major employment industries in Garfield County include Agriculture, Fishing & Hunting (229 | 42.7%), Retail Trade (77 | 14.4%), Health Care & Social Assistance (51 | 9.5%), Educational Services (47 | 8.8%), and Construction (23 | 4.3%).
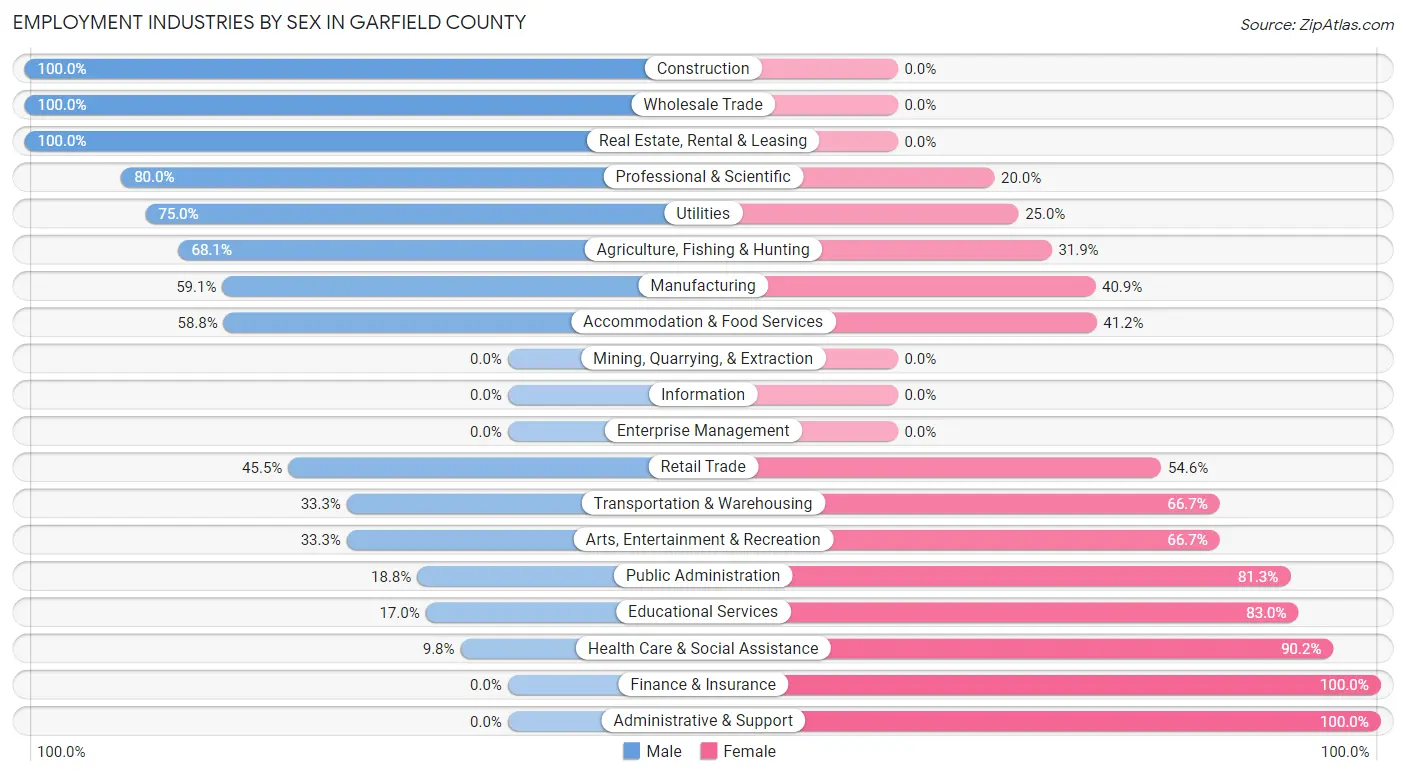
Employment Industries by Sex in Garfield County
The Garfield County industries that see more men than women are Construction (100.0%), Wholesale Trade (100.0%), and Real Estate, Rental & Leasing (100.0%), whereas the industries that tend to have a higher number of women are Finance & Insurance (100.0%), Administrative & Support (100.0%), and Health Care & Social Assistance (90.2%).
| Industry | Male | Female |
| Agriculture, Fishing & Hunting | 156 (68.1%) | 73 (31.9%) |
| Mining, Quarrying, & Extraction | 0 (0.0%) | 0 (0.0%) |
| Construction | 23 (100.0%) | 0 (0.0%) |
| Manufacturing | 13 (59.1%) | 9 (40.9%) |
| Wholesale Trade | 6 (100.0%) | 0 (0.0%) |
| Retail Trade | 35 (45.5%) | 42 (54.5%) |
| Transportation & Warehousing | 5 (33.3%) | 10 (66.7%) |
| Utilities | 3 (75.0%) | 1 (25.0%) |
| Information | 0 (0.0%) | 0 (0.0%) |
| Finance & Insurance | 0 (0.0%) | 3 (100.0%) |
| Real Estate, Rental & Leasing | 3 (100.0%) | 0 (0.0%) |
| Professional & Scientific | 4 (80.0%) | 1 (20.0%) |
| Enterprise Management | 0 (0.0%) | 0 (0.0%) |
| Administrative & Support | 0 (0.0%) | 1 (100.0%) |
| Educational Services | 8 (17.0%) | 39 (83.0%) |
| Health Care & Social Assistance | 5 (9.8%) | 46 (90.2%) |
| Arts, Entertainment & Recreation | 2 (33.3%) | 4 (66.7%) |
| Accommodation & Food Services | 10 (58.8%) | 7 (41.2%) |
| Public Administration | 3 (18.8%) | 13 (81.2%) |
| Total | 276 (51.5%) | 260 (48.5%) |
Education in Garfield County
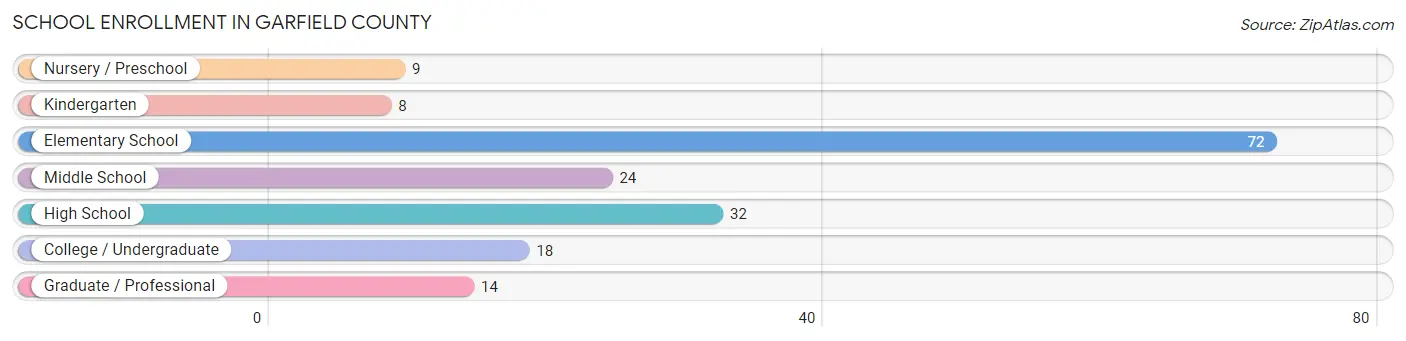
School Enrollment in Garfield County
The most common levels of schooling among the 177 students in Garfield County are elementary school (72 | 40.7%), high school (32 | 18.1%), and middle school (24 | 13.6%).
| School Level | # Students | % Students |
| Nursery / Preschool | 9 | 5.1% |
| Kindergarten | 8 | 4.5% |
| Elementary School | 72 | 40.7% |
| Middle School | 24 | 13.6% |
| High School | 32 | 18.1% |
| College / Undergraduate | 18 | 10.2% |
| Graduate / Professional | 14 | 7.9% |
| Total | 177 | 100.0% |
School Enrollment by Age by Funding Source in Garfield County
Out of a total of 177 students who are enrolled in schools in Garfield County, 12 (6.8%) attend a private institution, while the remaining 165 (93.2%) are enrolled in public schools. The age group of 15 to 17 year olds has the highest likelihood of being enrolled in private schools, with 5 (26.3% in the age bracket) enrolled. Conversely, the age group of 3 to 4 year olds has the lowest likelihood of being enrolled in a private school, with 7 (100.0% in the age bracket) attending a public institution.
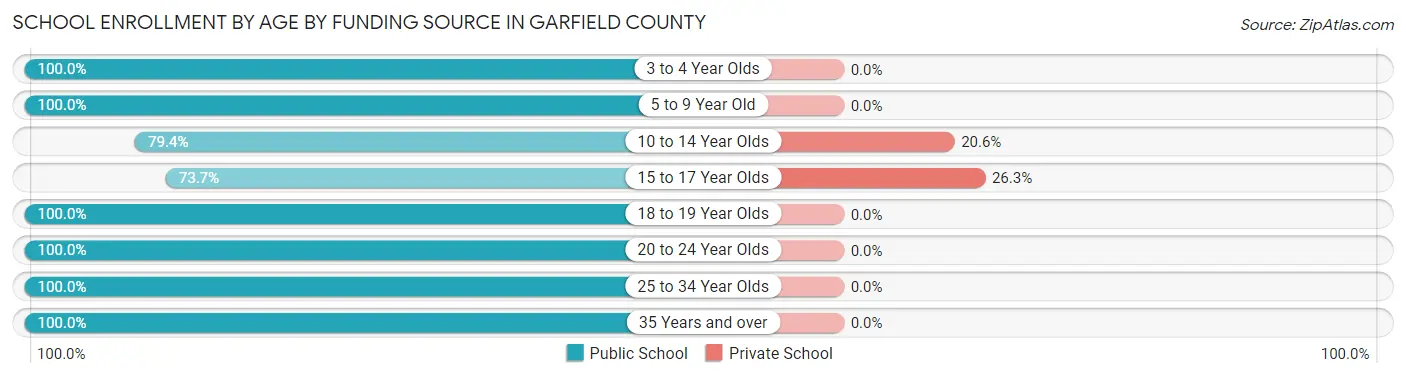
| Age Bracket | Public School | Private School |
| 3 to 4 Year Olds | 7 (100.0%) | 0 (0.0%) |
| 5 to 9 Year Old | 73 (100.0%) | 0 (0.0%) |
| 10 to 14 Year Olds | 27 (79.4%) | 7 (20.6%) |
| 15 to 17 Year Olds | 14 (73.7%) | 5 (26.3%) |
| 18 to 19 Year Olds | 12 (100.0%) | 0 (0.0%) |
| 20 to 24 Year Olds | 3 (100.0%) | 0 (0.0%) |
| 25 to 34 Year Olds | 26 (100.0%) | 0 (0.0%) |
| 35 Years and over | 3 (100.0%) | 0 (0.0%) |
| Total | 165 (93.2%) | 12 (6.8%) |
Educational Attainment by Field of Study in Garfield County
Bio, nature & agricultural (51 | 33.8%), education (42 | 27.8%), science & technology (29 | 19.2%), business (7 | 4.6%), and arts & humanities (7 | 4.6%) are the most common fields of study among 151 individuals in Garfield County who have obtained a bachelor's degree or higher.
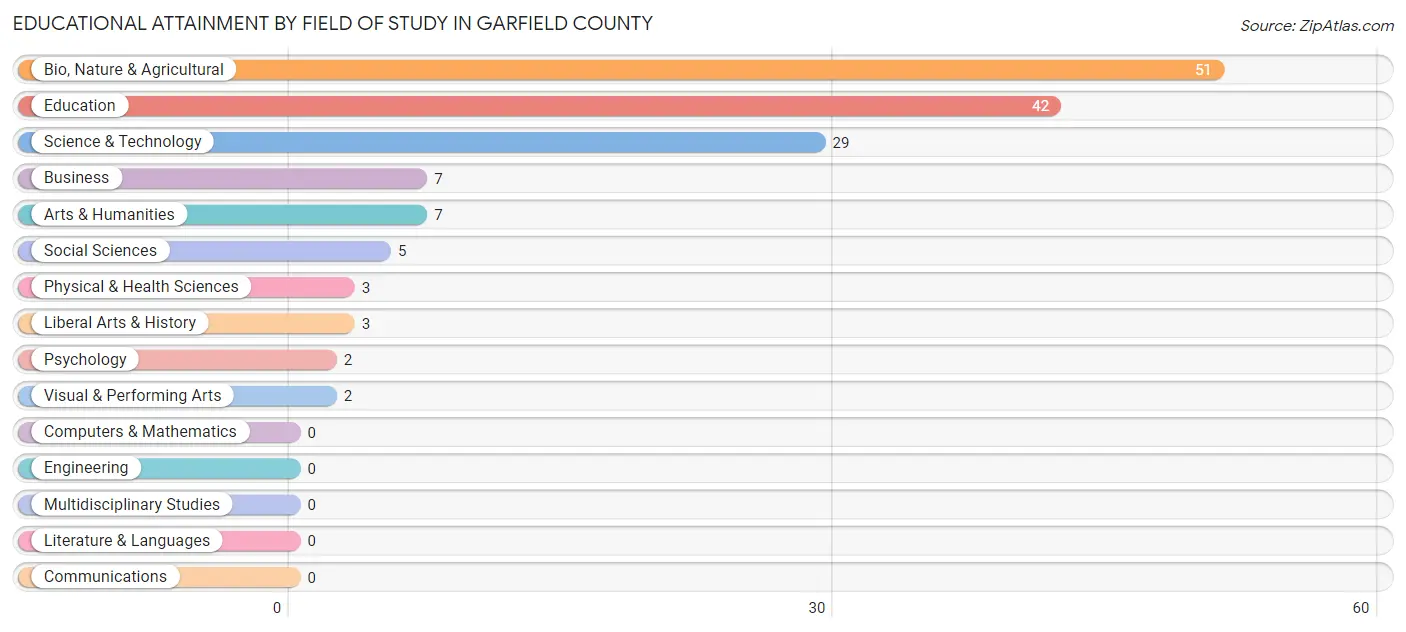
| Field of Study | # Graduates | % Graduates |
| Computers & Mathematics | 0 | 0.0% |
| Bio, Nature & Agricultural | 51 | 33.8% |
| Physical & Health Sciences | 3 | 2.0% |
| Psychology | 2 | 1.3% |
| Social Sciences | 5 | 3.3% |
| Engineering | 0 | 0.0% |
| Multidisciplinary Studies | 0 | 0.0% |
| Science & Technology | 29 | 19.2% |
| Business | 7 | 4.6% |
| Education | 42 | 27.8% |
| Literature & Languages | 0 | 0.0% |
| Liberal Arts & History | 3 | 2.0% |
| Visual & Performing Arts | 2 | 1.3% |
| Communications | 0 | 0.0% |
| Arts & Humanities | 7 | 4.6% |
| Total | 151 | 100.0% |
Transportation & Commute in Garfield County
Vehicle Availability by Sex in Garfield County
The most prevalent vehicle ownership categories in Garfield County are males with 3 vehicles (77, accounting for 28.4%) and females with 3 vehicles (79, making up 31.3%).
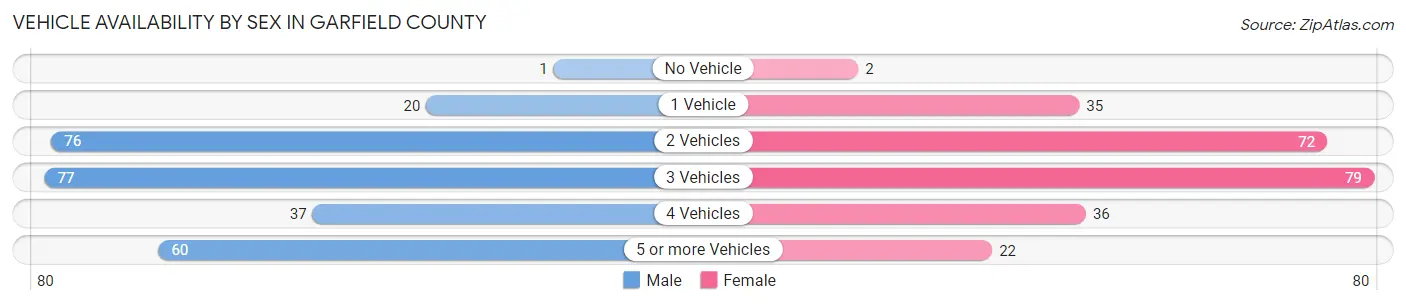
| Vehicles Available | Male | Female |
| No Vehicle | 1 (0.4%) | 2 (0.8%) |
| 1 Vehicle | 20 (7.4%) | 35 (14.2%) |
| 2 Vehicles | 76 (28.0%) | 72 (29.3%) |
| 3 Vehicles | 77 (28.4%) | 79 (32.1%) |
| 4 Vehicles | 37 (13.7%) | 36 (14.6%) |
| 5 or more Vehicles | 60 (22.1%) | 22 (8.9%) |
| Total | 271 (100.0%) | 246 (100.0%) |
Commute Time in Garfield County
The most frequently occuring commute durations in Garfield County are 5 to 9 minutes (164 commuters, 46.1%), less than 5 minutes (71 commuters, 19.9%), and 30 to 34 minutes (41 commuters, 11.5%).
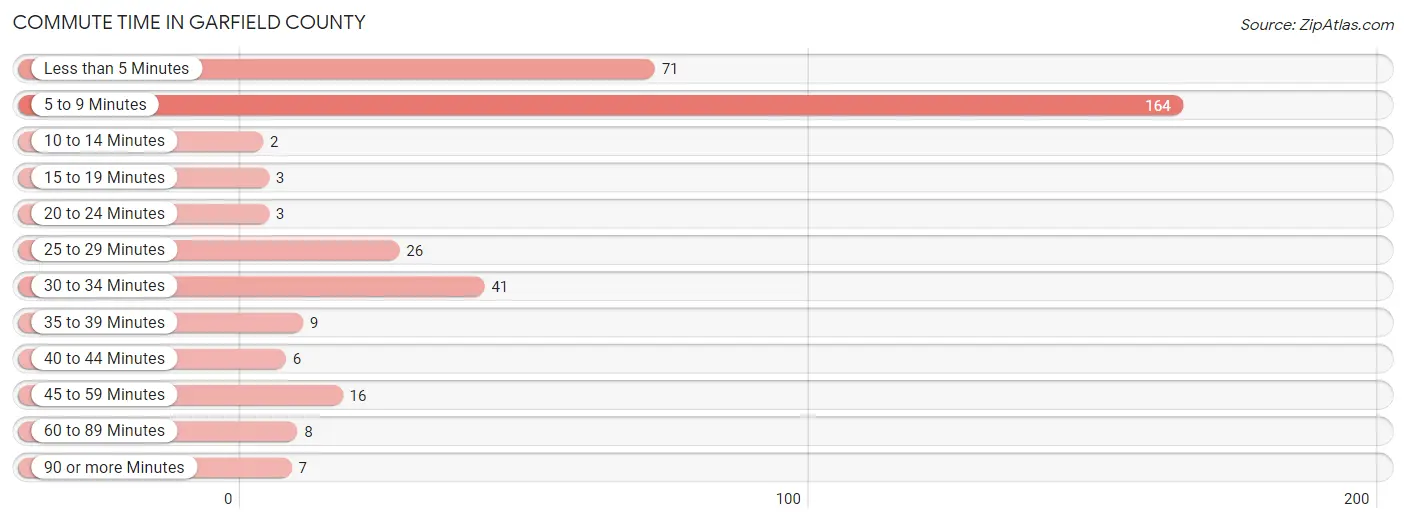
| Commute Time | # Commuters | % Commuters |
| Less than 5 Minutes | 71 | 19.9% |
| 5 to 9 Minutes | 164 | 46.1% |
| 10 to 14 Minutes | 2 | 0.6% |
| 15 to 19 Minutes | 3 | 0.8% |
| 20 to 24 Minutes | 3 | 0.8% |
| 25 to 29 Minutes | 26 | 7.3% |
| 30 to 34 Minutes | 41 | 11.5% |
| 35 to 39 Minutes | 9 | 2.5% |
| 40 to 44 Minutes | 6 | 1.7% |
| 45 to 59 Minutes | 16 | 4.5% |
| 60 to 89 Minutes | 8 | 2.2% |
| 90 or more Minutes | 7 | 2.0% |
Commute Time by Sex in Garfield County
The most common commute times in Garfield County are 5 to 9 minutes (80 commuters, 51.3%) for males and 5 to 9 minutes (84 commuters, 42.0%) for females.
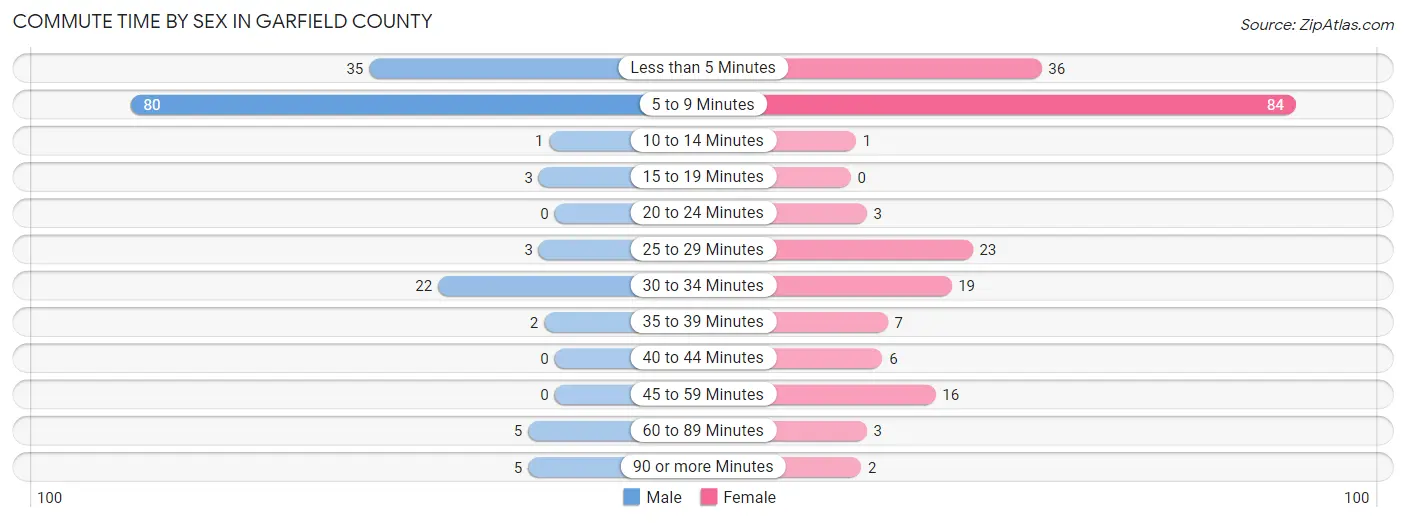
| Commute Time | Male | Female |
| Less than 5 Minutes | 35 (22.4%) | 36 (18.0%) |
| 5 to 9 Minutes | 80 (51.3%) | 84 (42.0%) |
| 10 to 14 Minutes | 1 (0.6%) | 1 (0.5%) |
| 15 to 19 Minutes | 3 (1.9%) | 0 (0.0%) |
| 20 to 24 Minutes | 0 (0.0%) | 3 (1.5%) |
| 25 to 29 Minutes | 3 (1.9%) | 23 (11.5%) |
| 30 to 34 Minutes | 22 (14.1%) | 19 (9.5%) |
| 35 to 39 Minutes | 2 (1.3%) | 7 (3.5%) |
| 40 to 44 Minutes | 0 (0.0%) | 6 (3.0%) |
| 45 to 59 Minutes | 0 (0.0%) | 16 (8.0%) |
| 60 to 89 Minutes | 5 (3.2%) | 3 (1.5%) |
| 90 or more Minutes | 5 (3.2%) | 2 (1.0%) |
Time of Departure to Work by Sex in Garfield County
The most frequent times of departure to work in Garfield County are 7:00 AM to 7:29 AM (34, 21.8%) for males and 7:00 AM to 7:29 AM (40, 20.0%) for females.
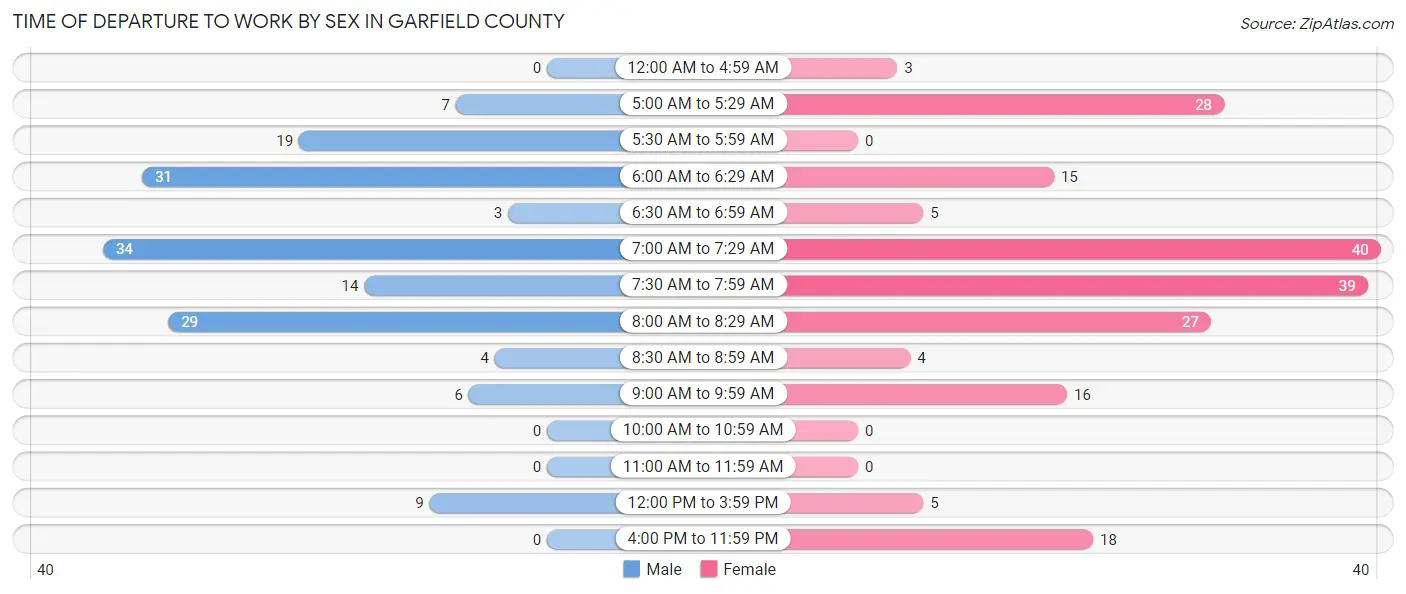
| Time of Departure | Male | Female |
| 12:00 AM to 4:59 AM | 0 (0.0%) | 3 (1.5%) |
| 5:00 AM to 5:29 AM | 7 (4.5%) | 28 (14.0%) |
| 5:30 AM to 5:59 AM | 19 (12.2%) | 0 (0.0%) |
| 6:00 AM to 6:29 AM | 31 (19.9%) | 15 (7.5%) |
| 6:30 AM to 6:59 AM | 3 (1.9%) | 5 (2.5%) |
| 7:00 AM to 7:29 AM | 34 (21.8%) | 40 (20.0%) |
| 7:30 AM to 7:59 AM | 14 (9.0%) | 39 (19.5%) |
| 8:00 AM to 8:29 AM | 29 (18.6%) | 27 (13.5%) |
| 8:30 AM to 8:59 AM | 4 (2.6%) | 4 (2.0%) |
| 9:00 AM to 9:59 AM | 6 (3.8%) | 16 (8.0%) |
| 10:00 AM to 10:59 AM | 0 (0.0%) | 0 (0.0%) |
| 11:00 AM to 11:59 AM | 0 (0.0%) | 0 (0.0%) |
| 12:00 PM to 3:59 PM | 9 (5.8%) | 5 (2.5%) |
| 4:00 PM to 11:59 PM | 0 (0.0%) | 18 (9.0%) |
| Total | 156 (100.0%) | 200 (100.0%) |
Housing Occupancy in Garfield County
Occupancy by Ownership in Garfield County
Of the total 412 dwellings in Garfield County, owner-occupied units account for 286 (69.4%), while renter-occupied units make up 126 (30.6%).
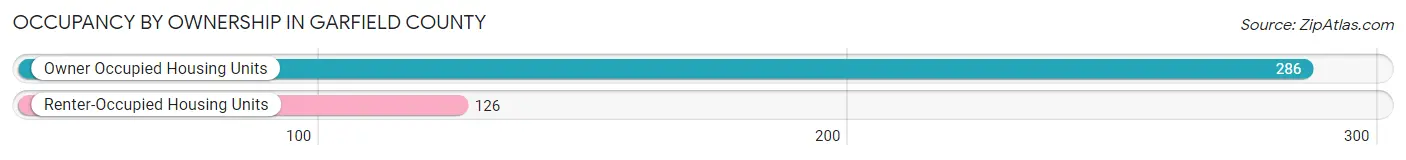
| Occupancy | # Housing Units | % Housing Units |
| Owner Occupied Housing Units | 286 | 69.4% |
| Renter-Occupied Housing Units | 126 | 30.6% |
| Total Occupied Housing Units | 412 | 100.0% |
Occupancy by Household Size in Garfield County
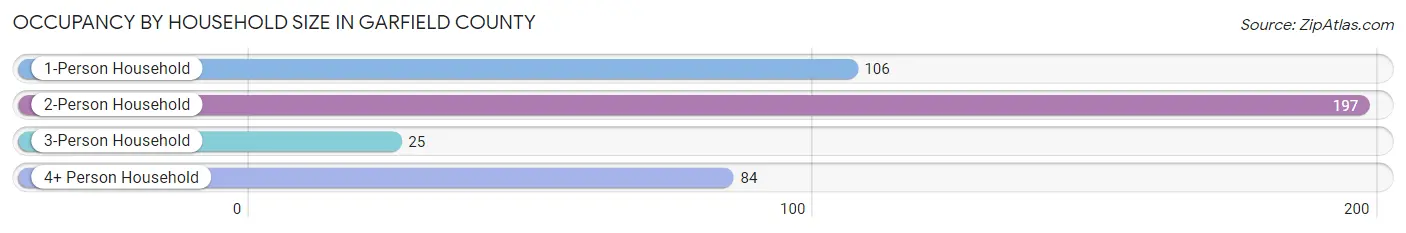
| Household Size | # Housing Units | % Housing Units |
| 1-Person Household | 106 | 25.7% |
| 2-Person Household | 197 | 47.8% |
| 3-Person Household | 25 | 6.1% |
| 4+ Person Household | 84 | 20.4% |
| Total Housing Units | 412 | 100.0% |
Occupancy by Ownership by Household Size in Garfield County
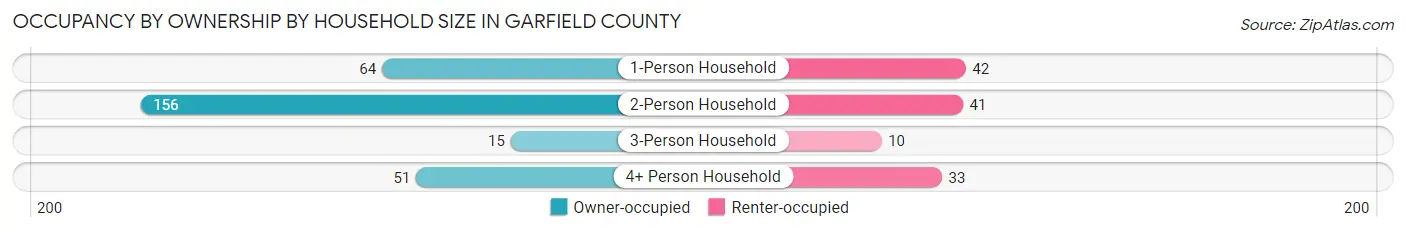
| Household Size | Owner-occupied | Renter-occupied |
| 1-Person Household | 64 (60.4%) | 42 (39.6%) |
| 2-Person Household | 156 (79.2%) | 41 (20.8%) |
| 3-Person Household | 15 (60.0%) | 10 (40.0%) |
| 4+ Person Household | 51 (60.7%) | 33 (39.3%) |
| Total Housing Units | 286 (69.4%) | 126 (30.6%) |
Occupancy by Educational Attainment in Garfield County
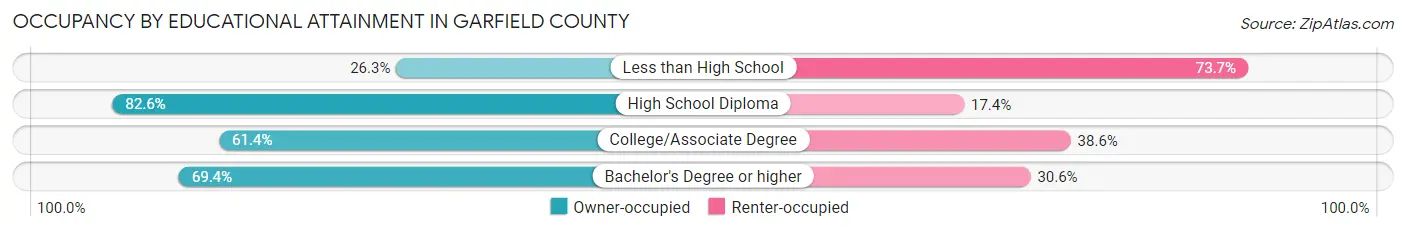
| Household Size | Owner-occupied | Renter-occupied |
| Less than High School | 5 (26.3%) | 14 (73.7%) |
| High School Diploma | 128 (82.6%) | 27 (17.4%) |
| College/Associate Degree | 94 (61.4%) | 59 (38.6%) |
| Bachelor's Degree or higher | 59 (69.4%) | 26 (30.6%) |
Occupancy by Age of Householder in Garfield County
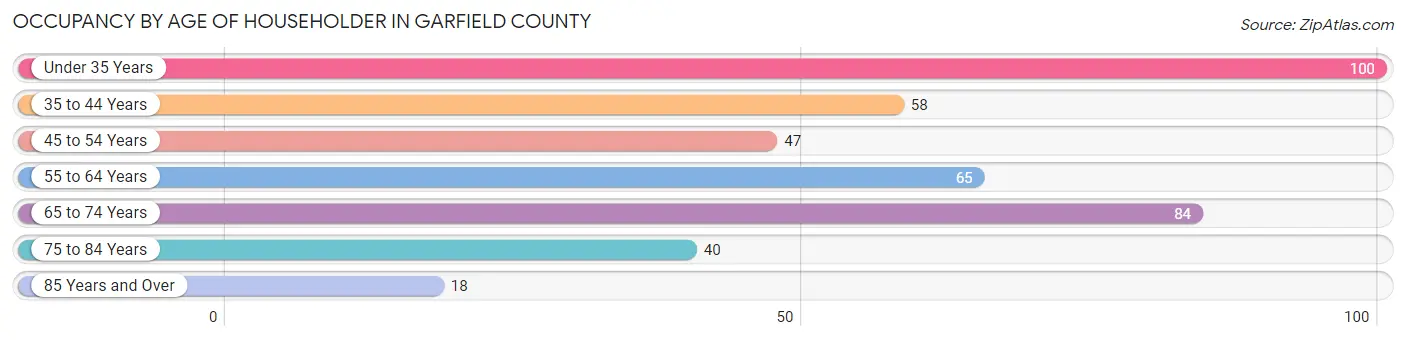
| Age Bracket | # Households | % Households |
| Under 35 Years | 100 | 24.3% |
| 35 to 44 Years | 58 | 14.1% |
| 45 to 54 Years | 47 | 11.4% |
| 55 to 64 Years | 65 | 15.8% |
| 65 to 74 Years | 84 | 20.4% |
| 75 to 84 Years | 40 | 9.7% |
| 85 Years and Over | 18 | 4.4% |
| Total | 412 | 100.0% |
Housing Finances in Garfield County
Median Income by Occupancy in Garfield County
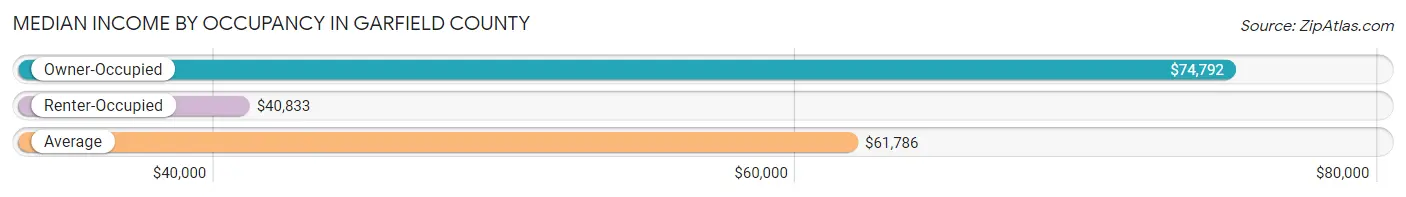
| Occupancy Type | # Households | Median Income |
| Owner-Occupied | 286 (69.4%) | $74,792 |
| Renter-Occupied | 126 (30.6%) | $40,833 |
| Average | 412 (100.0%) | $61,786 |
Occupancy by Householder Income Bracket in Garfield County
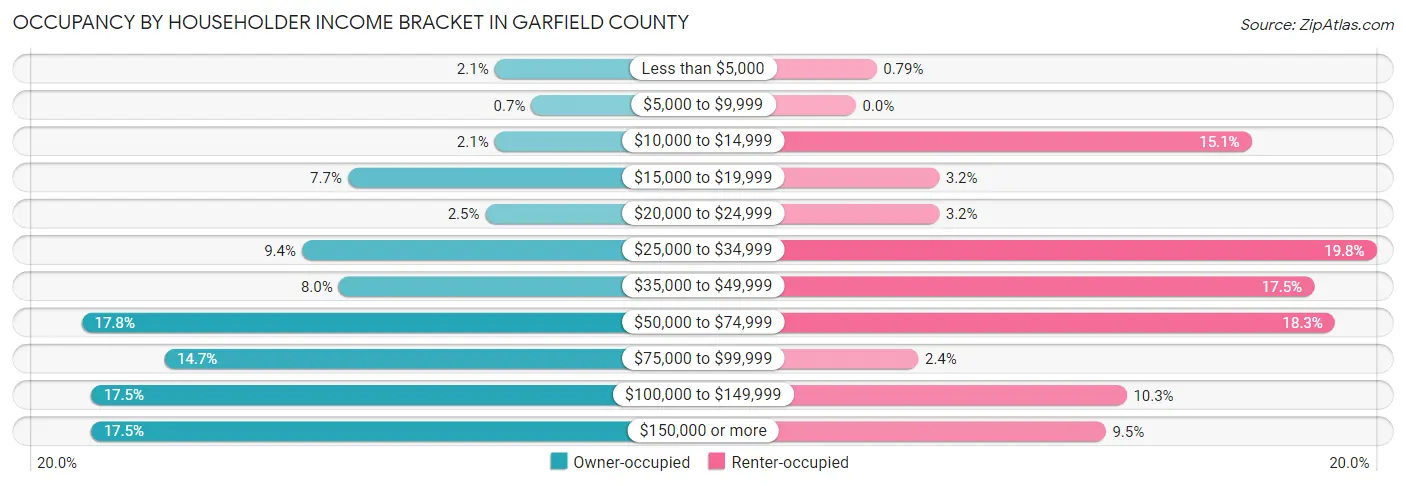
| Income Bracket | Owner-occupied | Renter-occupied |
| Less than $5,000 | 6 (2.1%) | 1 (0.8%) |
| $5,000 to $9,999 | 2 (0.7%) | 0 (0.0%) |
| $10,000 to $14,999 | 6 (2.1%) | 19 (15.1%) |
| $15,000 to $19,999 | 22 (7.7%) | 4 (3.2%) |
| $20,000 to $24,999 | 7 (2.5%) | 4 (3.2%) |
| $25,000 to $34,999 | 27 (9.4%) | 25 (19.8%) |
| $35,000 to $49,999 | 23 (8.0%) | 22 (17.5%) |
| $50,000 to $74,999 | 51 (17.8%) | 23 (18.2%) |
| $75,000 to $99,999 | 42 (14.7%) | 3 (2.4%) |
| $100,000 to $149,999 | 50 (17.5%) | 13 (10.3%) |
| $150,000 or more | 50 (17.5%) | 12 (9.5%) |
| Total | 286 (100.0%) | 126 (100.0%) |
Monthly Housing Cost Tiers in Garfield County
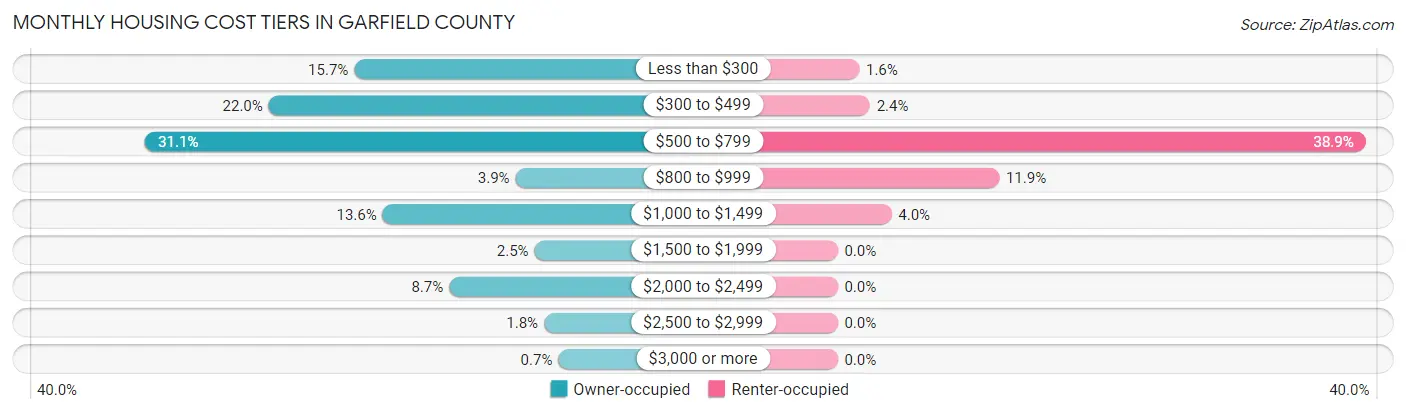
| Monthly Cost | Owner-occupied | Renter-occupied |
| Less than $300 | 45 (15.7%) | 2 (1.6%) |
| $300 to $499 | 63 (22.0%) | 3 (2.4%) |
| $500 to $799 | 89 (31.1%) | 49 (38.9%) |
| $800 to $999 | 11 (3.8%) | 15 (11.9%) |
| $1,000 to $1,499 | 39 (13.6%) | 5 (4.0%) |
| $1,500 to $1,999 | 7 (2.5%) | 0 (0.0%) |
| $2,000 to $2,499 | 25 (8.7%) | 0 (0.0%) |
| $2,500 to $2,999 | 5 (1.8%) | 0 (0.0%) |
| $3,000 or more | 2 (0.7%) | 0 (0.0%) |
| Total | 286 (100.0%) | 126 (100.0%) |
Physical Housing Characteristics in Garfield County
Housing Structures in Garfield County
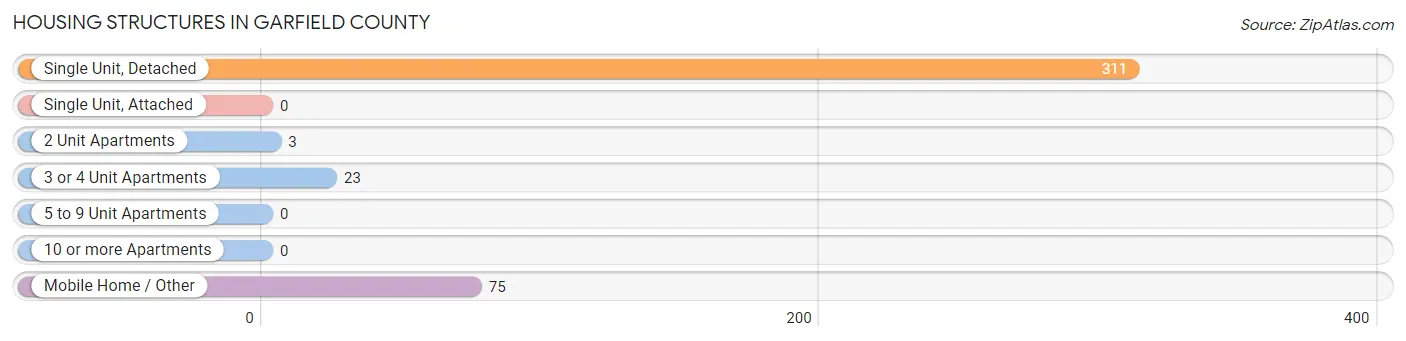
| Structure Type | # Housing Units | % Housing Units |
| Single Unit, Detached | 311 | 75.5% |
| Single Unit, Attached | 0 | 0.0% |
| 2 Unit Apartments | 3 | 0.7% |
| 3 or 4 Unit Apartments | 23 | 5.6% |
| 5 to 9 Unit Apartments | 0 | 0.0% |
| 10 or more Apartments | 0 | 0.0% |
| Mobile Home / Other | 75 | 18.2% |
| Total | 412 | 100.0% |
Housing Structures by Occupancy in Garfield County
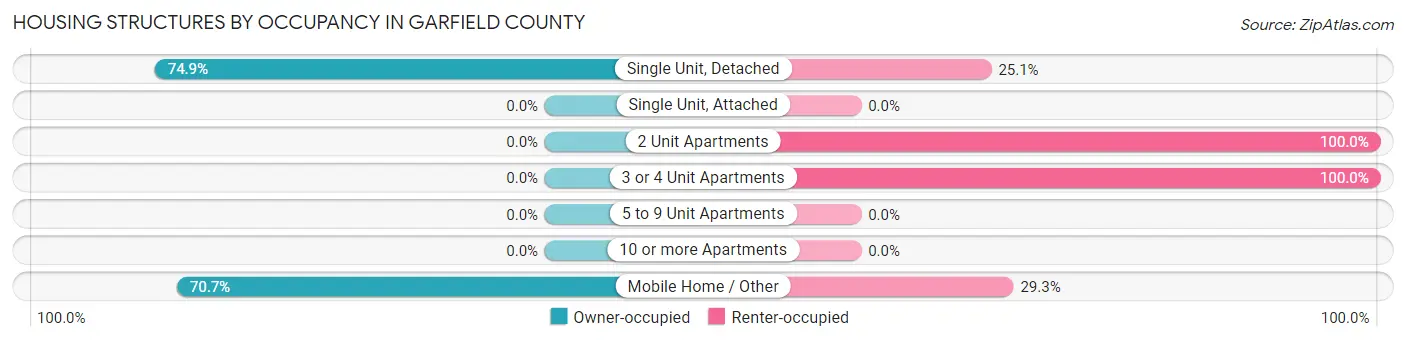
| Structure Type | Owner-occupied | Renter-occupied |
| Single Unit, Detached | 233 (74.9%) | 78 (25.1%) |
| Single Unit, Attached | 0 (0.0%) | 0 (0.0%) |
| 2 Unit Apartments | 0 (0.0%) | 3 (100.0%) |
| 3 or 4 Unit Apartments | 0 (0.0%) | 23 (100.0%) |
| 5 to 9 Unit Apartments | 0 (0.0%) | 0 (0.0%) |
| 10 or more Apartments | 0 (0.0%) | 0 (0.0%) |
| Mobile Home / Other | 53 (70.7%) | 22 (29.3%) |
| Total | 286 (69.4%) | 126 (30.6%) |
Housing Structures by Number of Rooms in Garfield County
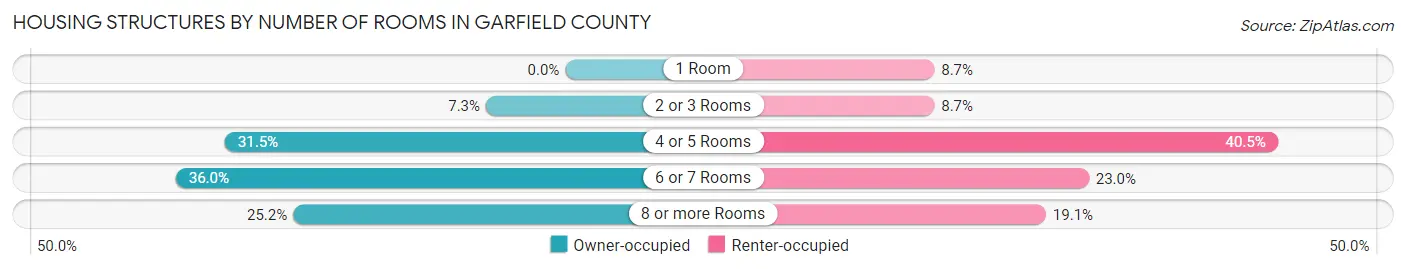
| Number of Rooms | Owner-occupied | Renter-occupied |
| 1 Room | 0 (0.0%) | 11 (8.7%) |
| 2 or 3 Rooms | 21 (7.3%) | 11 (8.7%) |
| 4 or 5 Rooms | 90 (31.5%) | 51 (40.5%) |
| 6 or 7 Rooms | 103 (36.0%) | 29 (23.0%) |
| 8 or more Rooms | 72 (25.2%) | 24 (19.1%) |
| Total | 286 (100.0%) | 126 (100.0%) |
Housing Structure by Heating Type in Garfield County
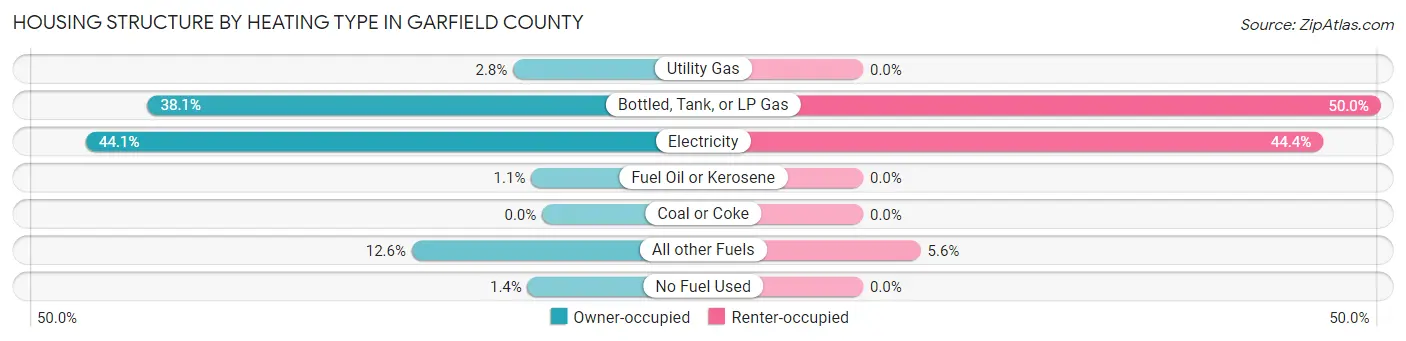
| Heating Type | Owner-occupied | Renter-occupied |
| Utility Gas | 8 (2.8%) | 0 (0.0%) |
| Bottled, Tank, or LP Gas | 109 (38.1%) | 63 (50.0%) |
| Electricity | 126 (44.1%) | 56 (44.4%) |
| Fuel Oil or Kerosene | 3 (1.1%) | 0 (0.0%) |
| Coal or Coke | 0 (0.0%) | 0 (0.0%) |
| All other Fuels | 36 (12.6%) | 7 (5.6%) |
| No Fuel Used | 4 (1.4%) | 0 (0.0%) |
| Total | 286 (100.0%) | 126 (100.0%) |
Household Vehicle Usage in Garfield County
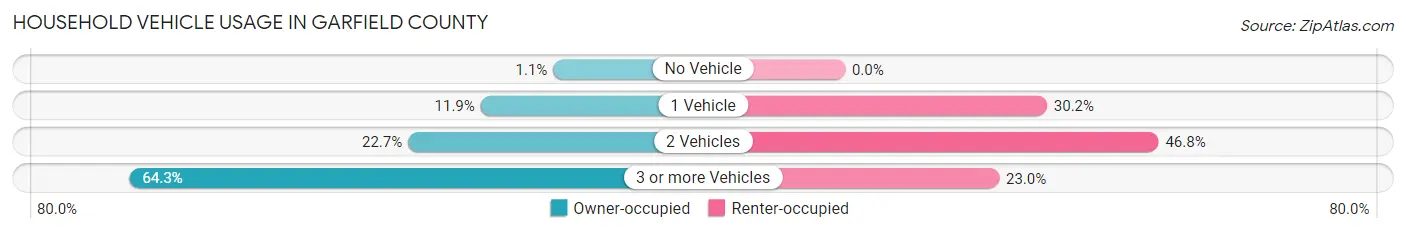
| Vehicles per Household | Owner-occupied | Renter-occupied |
| No Vehicle | 3 (1.1%) | 0 (0.0%) |
| 1 Vehicle | 34 (11.9%) | 38 (30.2%) |
| 2 Vehicles | 65 (22.7%) | 59 (46.8%) |
| 3 or more Vehicles | 184 (64.3%) | 29 (23.0%) |
| Total | 286 (100.0%) | 126 (100.0%) |
Real Estate & Mortgages in Garfield County
Real Estate and Mortgage Overview in Garfield County
| Characteristic | Without Mortgage | With Mortgage |
| Housing Units | 214 | 72 |
| Median Property Value | $167,900 | $161,800 |
| Median Household Income | $71,667 | $12 |
| Monthly Housing Costs | $502 | $2 |
| Real Estate Taxes | $1,304 | $0 |
Property Value by Mortgage Status in Garfield County
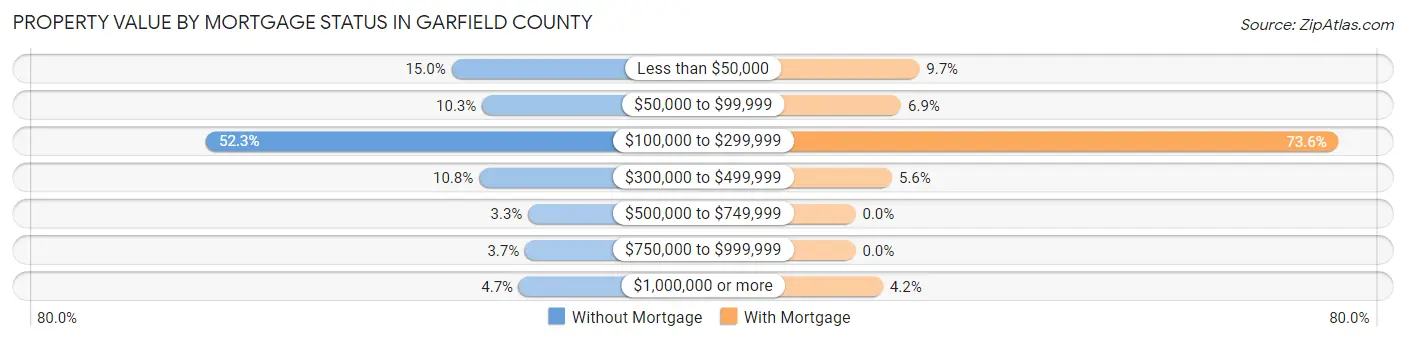
| Property Value | Without Mortgage | With Mortgage |
| Less than $50,000 | 32 (14.9%) | 7 (9.7%) |
| $50,000 to $99,999 | 22 (10.3%) | 5 (6.9%) |
| $100,000 to $299,999 | 112 (52.3%) | 53 (73.6%) |
| $300,000 to $499,999 | 23 (10.7%) | 4 (5.6%) |
| $500,000 to $749,999 | 7 (3.3%) | 0 (0.0%) |
| $750,000 to $999,999 | 8 (3.7%) | 0 (0.0%) |
| $1,000,000 or more | 10 (4.7%) | 3 (4.2%) |
| Total | 214 (100.0%) | 72 (100.0%) |
Household Income by Mortgage Status in Garfield County
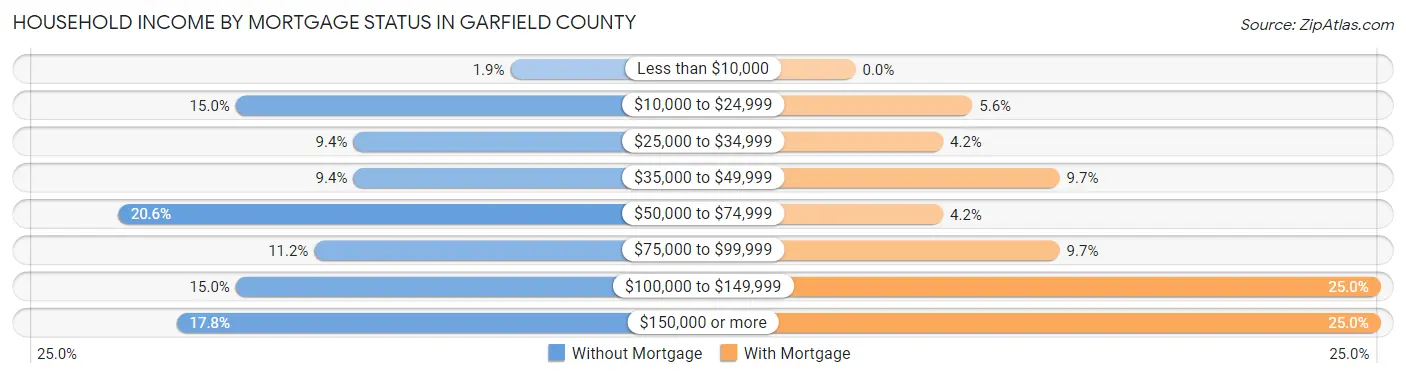
| Household Income | Without Mortgage | With Mortgage |
| Less than $10,000 | 4 (1.9%) | 0 (0.0%) |
| $10,000 to $24,999 | 32 (14.9%) | 4 (5.6%) |
| $25,000 to $34,999 | 20 (9.3%) | 3 (4.2%) |
| $35,000 to $49,999 | 20 (9.3%) | 7 (9.7%) |
| $50,000 to $74,999 | 44 (20.6%) | 3 (4.2%) |
| $75,000 to $99,999 | 24 (11.2%) | 7 (9.7%) |
| $100,000 to $149,999 | 32 (14.9%) | 18 (25.0%) |
| $150,000 or more | 38 (17.8%) | 18 (25.0%) |
| Total | 214 (100.0%) | 72 (100.0%) |
Property Value to Household Income Ratio in Garfield County
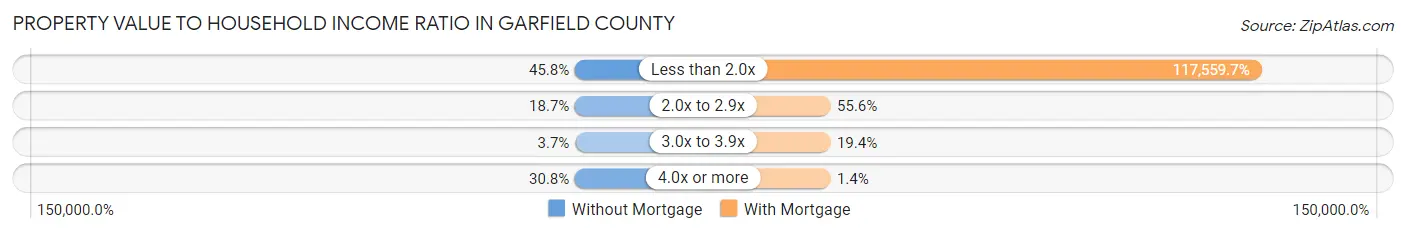
| Value-to-Income Ratio | Without Mortgage | With Mortgage |
| Less than 2.0x | 98 (45.8%) | 84,643 (117,559.7%) |
| 2.0x to 2.9x | 40 (18.7%) | 40 (55.6%) |
| 3.0x to 3.9x | 8 (3.7%) | 14 (19.4%) |
| 4.0x or more | 66 (30.8%) | 1 (1.4%) |
| Total | 214 (100.0%) | 72 (100.0%) |
Real Estate Taxes by Mortgage Status in Garfield County
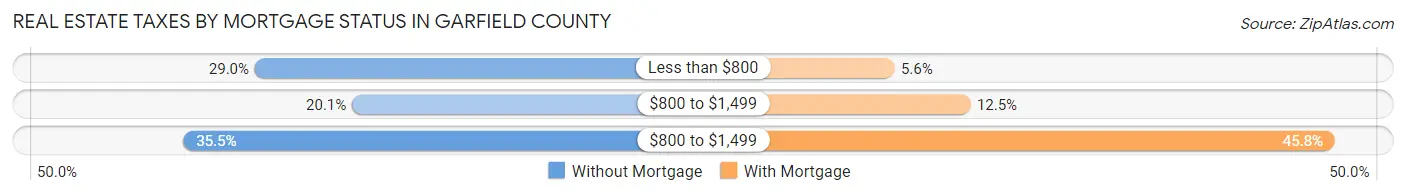
| Property Taxes | Without Mortgage | With Mortgage |
| Less than $800 | 62 (29.0%) | 4 (5.6%) |
| $800 to $1,499 | 43 (20.1%) | 9 (12.5%) |
| $800 to $1,499 | 76 (35.5%) | 33 (45.8%) |
| Total | 214 (100.0%) | 72 (100.0%) |
Health & Disability in Garfield County
Health Insurance Coverage by Age in Garfield County
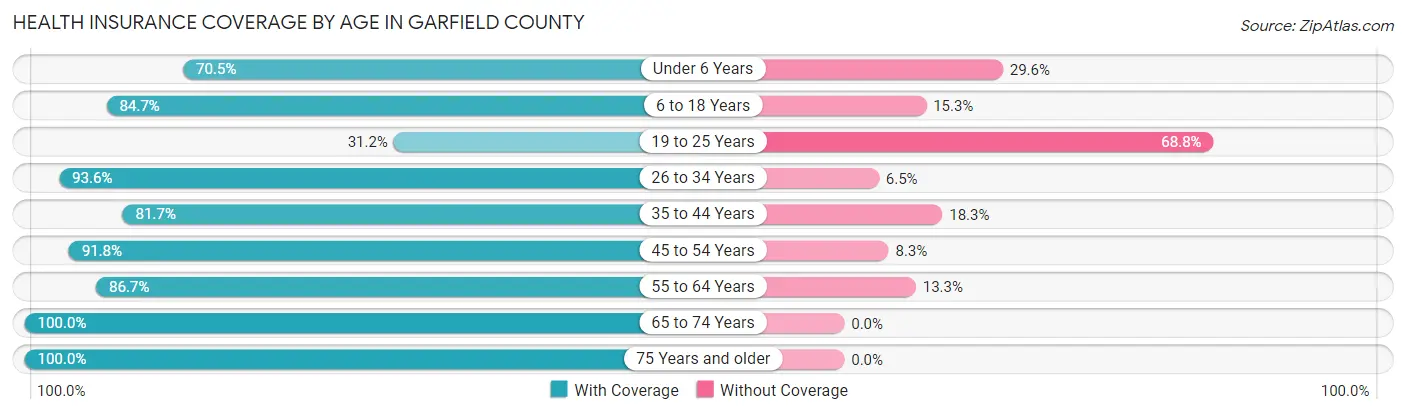
| Age Bracket | With Coverage | Without Coverage |
| Under 6 Years | 62 (70.5%) | 26 (29.5%) |
| 6 to 18 Years | 111 (84.7%) | 20 (15.3%) |
| 19 to 25 Years | 24 (31.2%) | 53 (68.8%) |
| 26 to 34 Years | 116 (93.5%) | 8 (6.5%) |
| 35 to 44 Years | 85 (81.7%) | 19 (18.3%) |
| 45 to 54 Years | 89 (91.7%) | 8 (8.3%) |
| 55 to 64 Years | 104 (86.7%) | 16 (13.3%) |
| 65 to 74 Years | 128 (100.0%) | 0 (0.0%) |
| 75 Years and older | 97 (100.0%) | 0 (0.0%) |
| Total | 816 (84.5%) | 150 (15.5%) |
Health Insurance Coverage by Citizenship Status in Garfield County
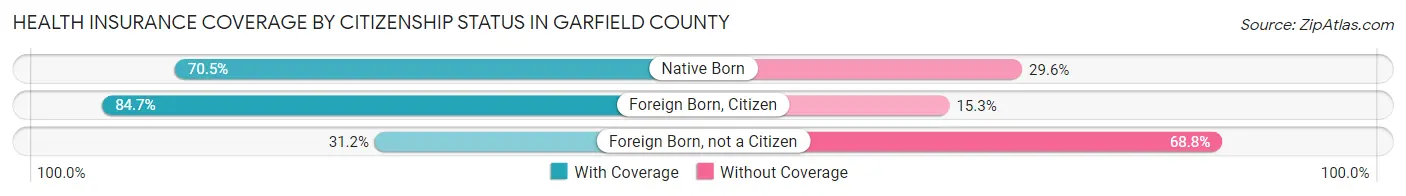
| Citizenship Status | With Coverage | Without Coverage |
| Native Born | 62 (70.5%) | 26 (29.5%) |
| Foreign Born, Citizen | 111 (84.7%) | 20 (15.3%) |
| Foreign Born, not a Citizen | 24 (31.2%) | 53 (68.8%) |
Health Insurance Coverage by Household Income in Garfield County
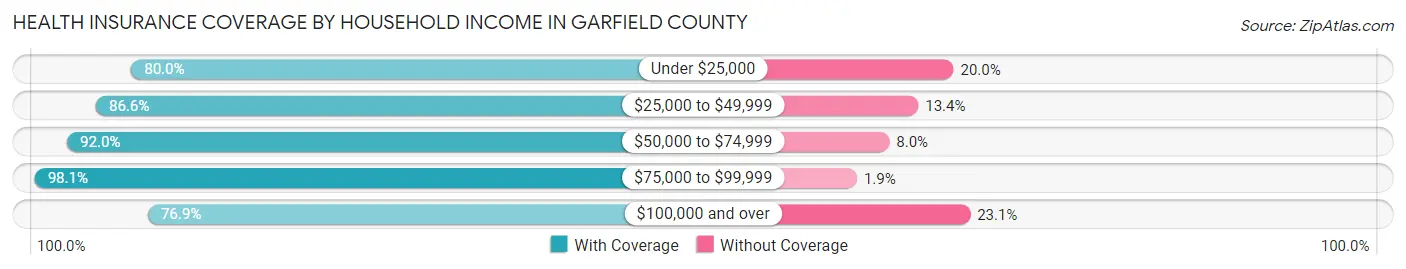
| Household Income | With Coverage | Without Coverage |
| Under $25,000 | 96 (80.0%) | 24 (20.0%) |
| $25,000 to $49,999 | 168 (86.6%) | 26 (13.4%) |
| $50,000 to $74,999 | 173 (92.0%) | 15 (8.0%) |
| $75,000 to $99,999 | 103 (98.1%) | 2 (1.9%) |
| $100,000 and over | 276 (76.9%) | 83 (23.1%) |
Public vs Private Health Insurance Coverage by Age in Garfield County
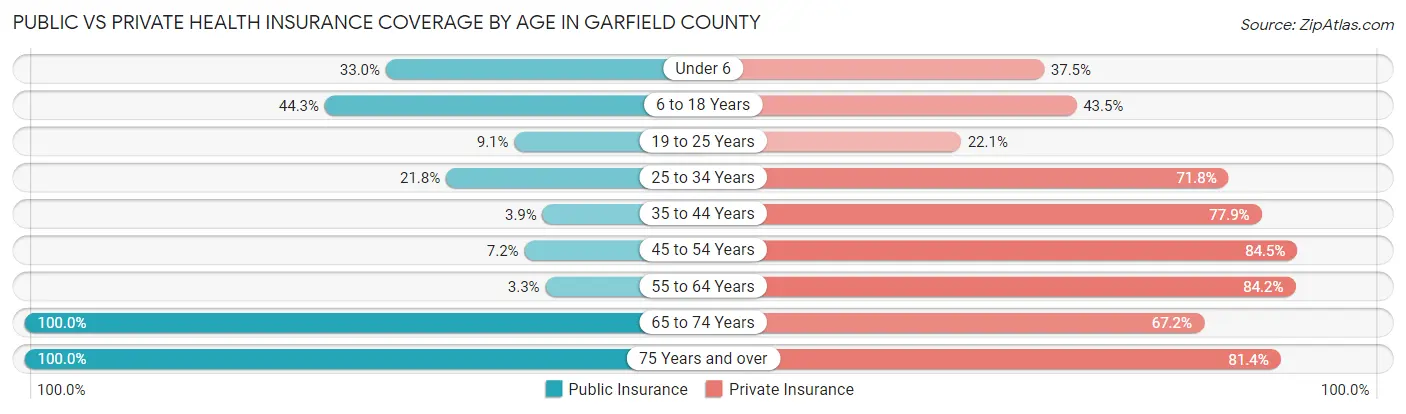
| Age Bracket | Public Insurance | Private Insurance |
| Under 6 | 29 (33.0%) | 33 (37.5%) |
| 6 to 18 Years | 58 (44.3%) | 57 (43.5%) |
| 19 to 25 Years | 7 (9.1%) | 17 (22.1%) |
| 25 to 34 Years | 27 (21.8%) | 89 (71.8%) |
| 35 to 44 Years | 4 (3.8%) | 81 (77.9%) |
| 45 to 54 Years | 7 (7.2%) | 82 (84.5%) |
| 55 to 64 Years | 4 (3.3%) | 101 (84.2%) |
| 65 to 74 Years | 128 (100.0%) | 86 (67.2%) |
| 75 Years and over | 97 (100.0%) | 79 (81.4%) |
| Total | 361 (37.4%) | 625 (64.7%) |
Disability Status by Sex by Age in Garfield County
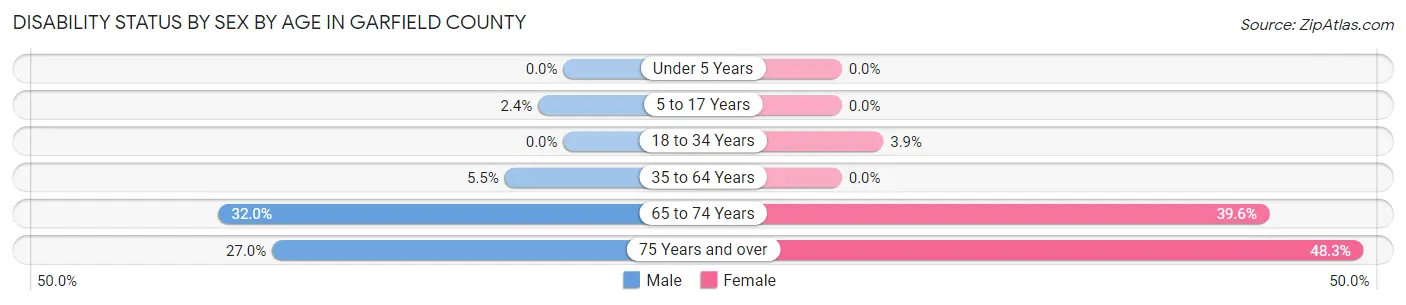
| Age Bracket | Male | Female |
| Under 5 Years | 0 (0.0%) | 0 (0.0%) |
| 5 to 17 Years | 2 (2.4%) | 0 (0.0%) |
| 18 to 34 Years | 0 (0.0%) | 5 (3.8%) |
| 35 to 64 Years | 9 (5.4%) | 0 (0.0%) |
| 65 to 74 Years | 24 (32.0%) | 21 (39.6%) |
| 75 Years and over | 10 (27.0%) | 29 (48.3%) |
Disability Class by Sex by Age in Garfield County
Disability Class: Hearing Difficulty
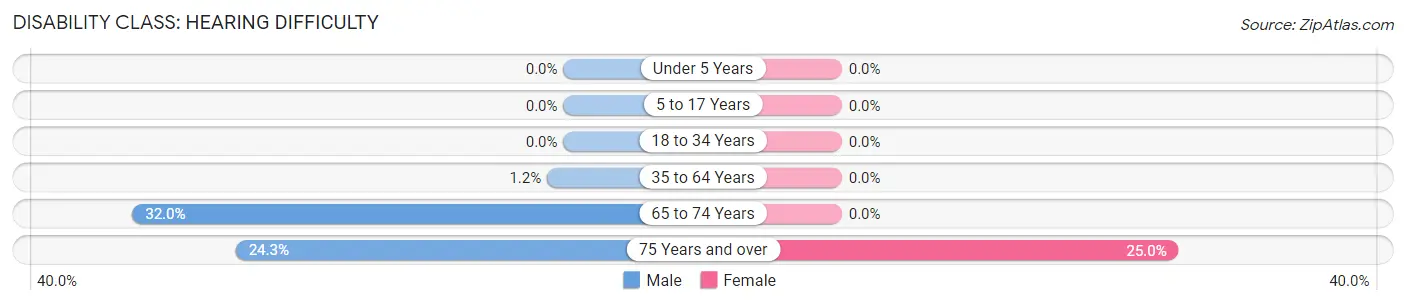
| Age Bracket | Male | Female |
| Under 5 Years | 0 (0.0%) | 0 (0.0%) |
| 5 to 17 Years | 0 (0.0%) | 0 (0.0%) |
| 18 to 34 Years | 0 (0.0%) | 0 (0.0%) |
| 35 to 64 Years | 2 (1.2%) | 0 (0.0%) |
| 65 to 74 Years | 24 (32.0%) | 0 (0.0%) |
| 75 Years and over | 9 (24.3%) | 15 (25.0%) |
Disability Class: Vision Difficulty
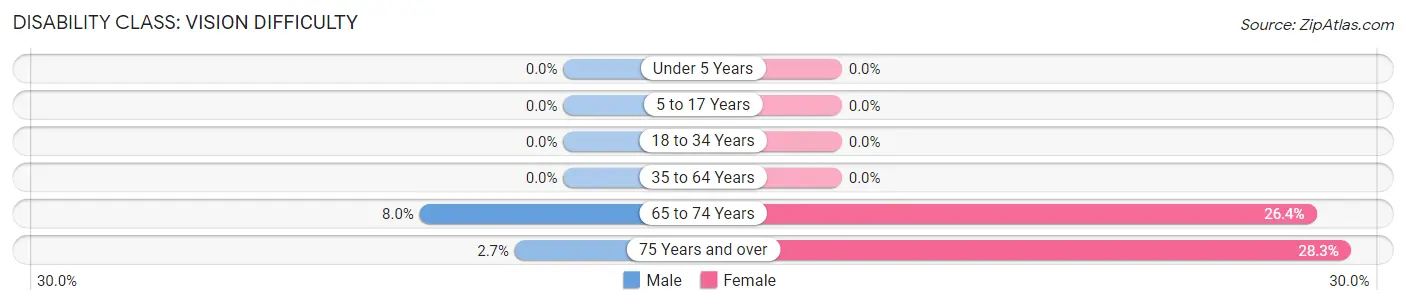
| Age Bracket | Male | Female |
| Under 5 Years | 0 (0.0%) | 0 (0.0%) |
| 5 to 17 Years | 0 (0.0%) | 0 (0.0%) |
| 18 to 34 Years | 0 (0.0%) | 0 (0.0%) |
| 35 to 64 Years | 0 (0.0%) | 0 (0.0%) |
| 65 to 74 Years | 6 (8.0%) | 14 (26.4%) |
| 75 Years and over | 1 (2.7%) | 17 (28.3%) |
Disability Class: Cognitive Difficulty
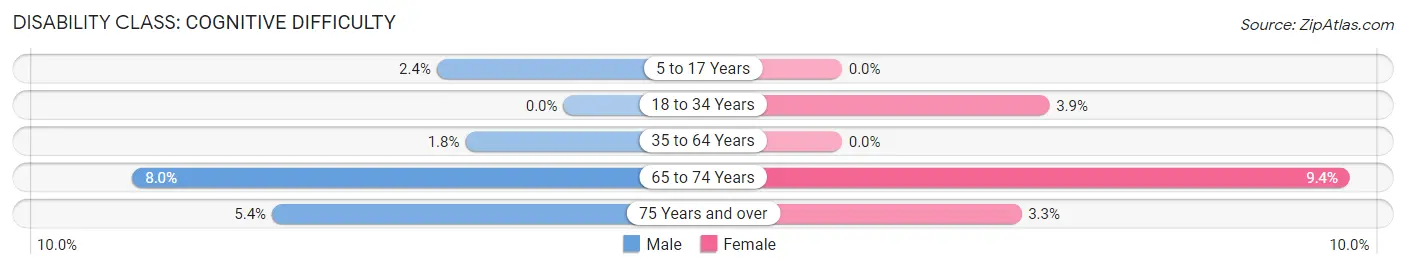
| Age Bracket | Male | Female |
| 5 to 17 Years | 2 (2.4%) | 0 (0.0%) |
| 18 to 34 Years | 0 (0.0%) | 5 (3.8%) |
| 35 to 64 Years | 3 (1.8%) | 0 (0.0%) |
| 65 to 74 Years | 6 (8.0%) | 5 (9.4%) |
| 75 Years and over | 2 (5.4%) | 2 (3.3%) |
Disability Class: Ambulatory Difficulty
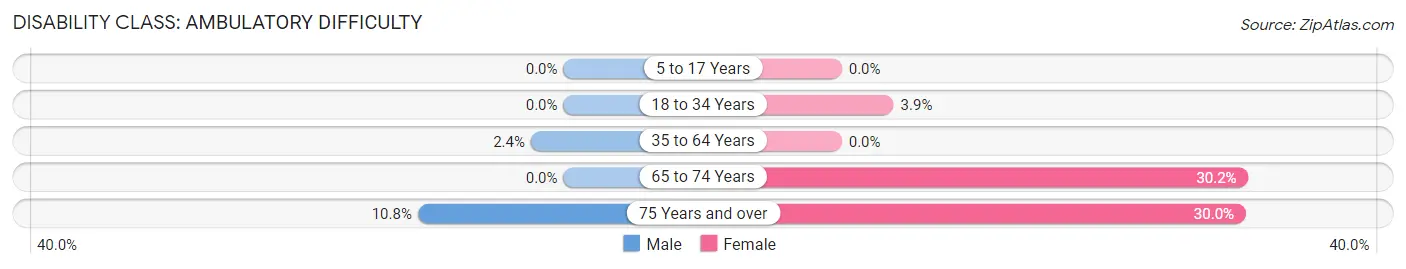
| Age Bracket | Male | Female |
| 5 to 17 Years | 0 (0.0%) | 0 (0.0%) |
| 18 to 34 Years | 0 (0.0%) | 5 (3.8%) |
| 35 to 64 Years | 4 (2.4%) | 0 (0.0%) |
| 65 to 74 Years | 0 (0.0%) | 16 (30.2%) |
| 75 Years and over | 4 (10.8%) | 18 (30.0%) |
Disability Class: Self-Care Difficulty
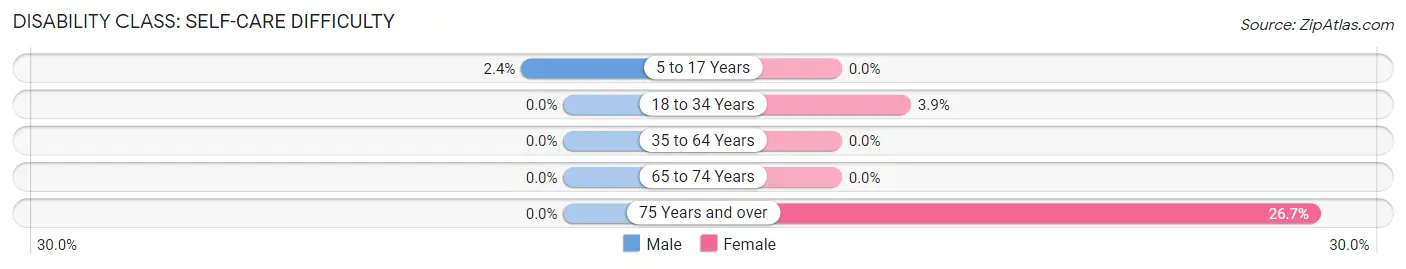
| Age Bracket | Male | Female |
| 5 to 17 Years | 2 (2.4%) | 0 (0.0%) |
| 18 to 34 Years | 0 (0.0%) | 5 (3.8%) |
| 35 to 64 Years | 0 (0.0%) | 0 (0.0%) |
| 65 to 74 Years | 0 (0.0%) | 0 (0.0%) |
| 75 Years and over | 0 (0.0%) | 16 (26.7%) |
Technology Access in Garfield County
Computing Device Access in Garfield County
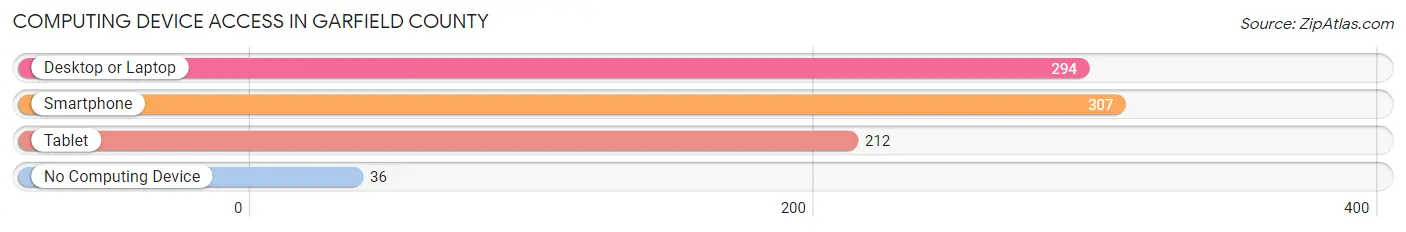
| Device Type | # Households | % Households |
| Desktop or Laptop | 294 | 71.4% |
| Smartphone | 307 | 74.5% |
| Tablet | 212 | 51.5% |
| No Computing Device | 36 | 8.7% |
| Total | 412 | 100.0% |
Internet Access in Garfield County
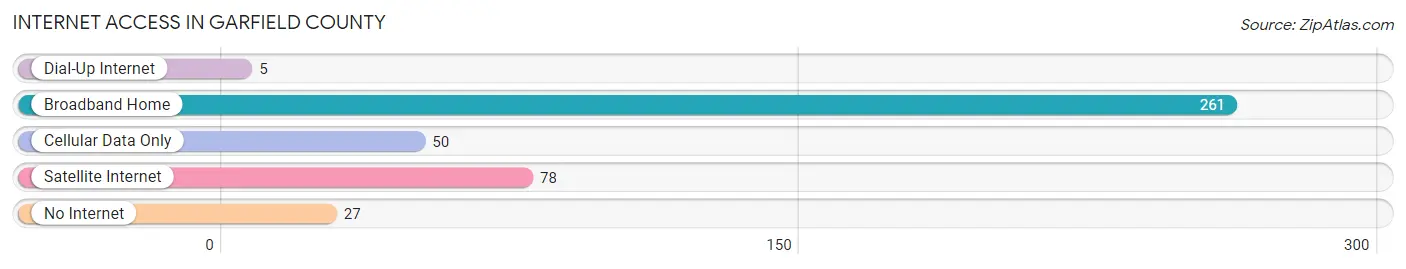
| Internet Type | # Households | % Households |
| Dial-Up Internet | 5 | 1.2% |
| Broadband Home | 261 | 63.3% |
| Cellular Data Only | 50 | 12.1% |
| Satellite Internet | 78 | 18.9% |
| No Internet | 27 | 6.6% |
| Total | 412 | 100.0% |
Garfield County Summary
Garfield County is located in the north-central region of Montana, and is bordered by Petroleum County to the north, Fergus County to the east, Musselshell County to the south, and Wheatland County to the west. The county seat is Jordan, and the largest city is Jordan. The county was established in 1919 and named after James A. Garfield, the 20th President of the United States.
Geography
Garfield County covers an area of 2,845 square miles, making it the fourth largest county in Montana. The county is located in the Missouri River Valley, and is part of the Great Plains region. The county is mostly flat, with rolling hills in the east and south. The highest point in the county is located in the northwest corner, at an elevation of 4,890 feet. The county is home to several rivers, including the Musselshell, the Missouri, and the Yellowstone.
The climate of Garfield County is semi-arid, with hot summers and cold winters. The average annual precipitation is 13.5 inches, and the average annual snowfall is 24.5 inches.
Demographics
As of the 2010 census, Garfield County had a population of 1,845. The population density was 0.7 people per square mile. The racial makeup of the county was 97.3% White, 0.2% Native American, 0.2% Asian, 0.1% Black or African American, 0.1% Pacific Islander, 0.7% from other races, and 1.4% from two or more races. Hispanic or Latino of any race were 2.2% of the population.
The median income for a household in the county was $35,938, and the median income for a family was $41,250. The per capita income for the county was $17,845. About 11.2% of families and 14.2% of the population were below the poverty line, including 17.2% of those under age 18 and 8.3% of those age 65 or over.
Economy
The economy of Garfield County is largely based on agriculture and ranching. The county is home to several large ranches, and the majority of the land is used for grazing. The county is also home to several small farms, which produce a variety of crops, including wheat, barley, oats, and hay.
The county is also home to several oil and gas fields, which provide jobs and revenue for the county. The county is also home to several small businesses, including restaurants, stores, and other services.
Garfield County is home to several tourist attractions, including the Little Bighorn Battlefield National Monument, the Charles M. Russell National Wildlife Refuge, and the Missouri River. These attractions bring in tourists from all over the country, and provide jobs and revenue for the county.
Conclusion
Garfield County is a rural county located in the north-central region of Montana. The county is home to several large ranches, small farms, and oil and gas fields, and is also home to several tourist attractions. The county has a population of 1,845, and the economy is largely based on agriculture and ranching. The county is also home to several small businesses, which provide jobs and revenue for the county.
Common Questions
What is the Total Population of Garfield County?
Total Population of Garfield County is 976.
What is the Total Male Population of Garfield County?
Total Male Population of Garfield County is 487.
What is the Total Female Population of Garfield County?
Total Female Population of Garfield County is 489.
What is the Ratio of Males per 100 Females in Garfield County?
There are 99.59 Males per 100 Females in Garfield County.
What is the Ratio of Females per 100 Males in Garfield County?
There are 100.41 Females per 100 Males in Garfield County.
What is the Median Population Age in Garfield County?
Median Population Age in Garfield County is 42.0 Years.
What is the Average Family Size in Garfield County
Average Family Size in Garfield County is 2.9 People.
What is the Average Household Size in Garfield County
Average Household Size in Garfield County is 2.3 People.
What is Per Capita Income in Garfield County?
Per Capita income in Garfield County is $33,745.
What is the Median Family Income in Garfield County?
Median Family Income in Garfield County is $83,304.
What is the Median Household income in Garfield County?
Median Household Income in Garfield County is $61,786.
What is Income or Wage Gap in Garfield County?
Income or Wage Gap in Garfield County is 30.4%.
Women in Garfield County earn 69.6 cents for every dollar earned by a man.
What is Inequality or Gini Index in Garfield County?
Inequality or Gini Index in Garfield County is 0.46.
How Large is the Labor Force in Garfield County?
There are 536 People in the Labor Forcein in Garfield County.
What is the Percentage of People in the Labor Force in Garfield County?
70.1% of People are in the Labor Force in Garfield County.