Fallon County, MT
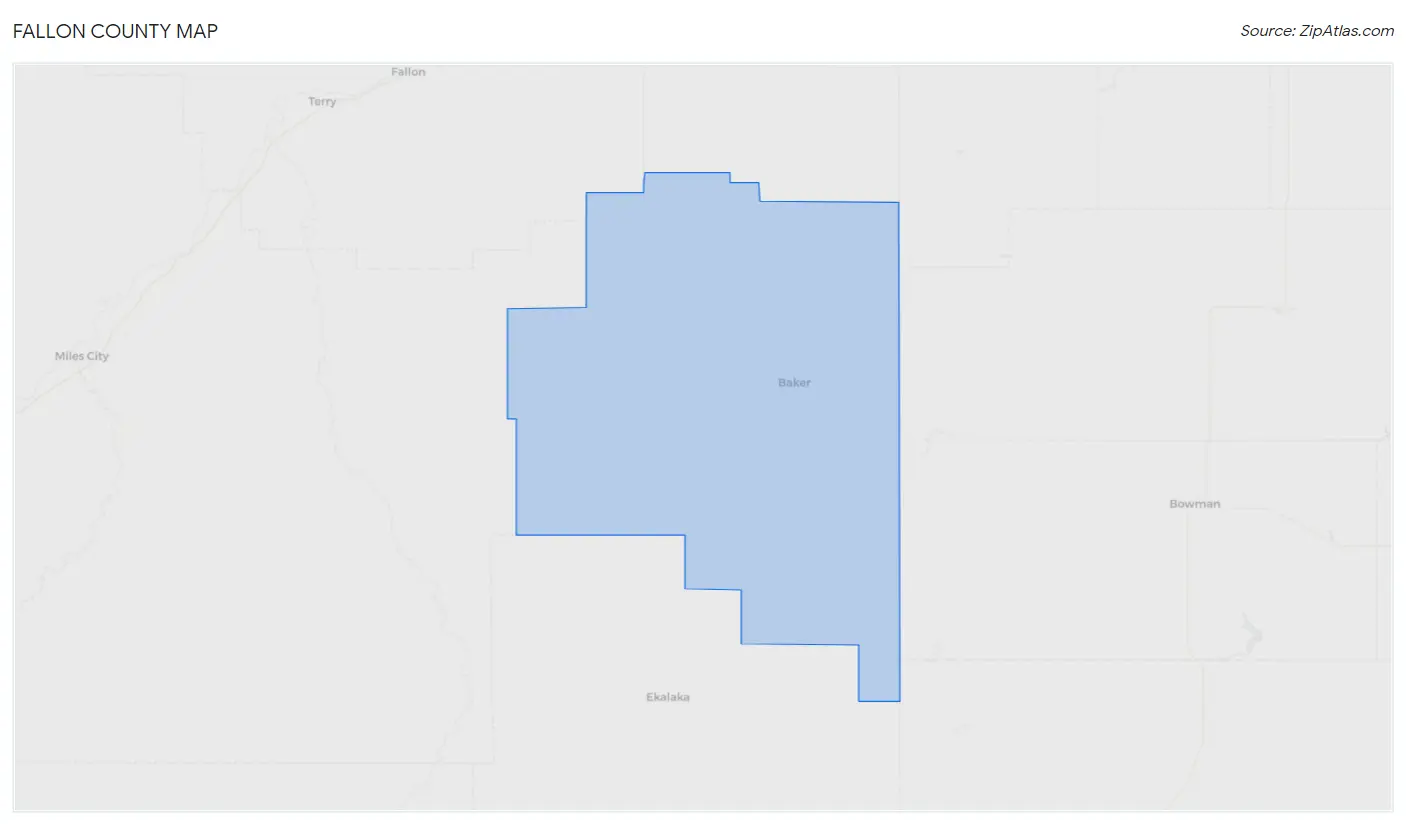
Fallon County Map
Fallon County Overview
2,941
TOTAL POPULATION
1,448
MALE POPULATION
1,493
FEMALE POPULATION
96.99
MALES / 100 FEMALES
103.11
FEMALES / 100 MALES
37.2
MEDIAN AGE
3.1
AVG FAMILY SIZE
2.5
AVG HOUSEHOLD SIZE
$42,516
PER CAPITA INCOME
$112,540
AVG FAMILY INCOME
$79,750
AVG HOUSEHOLD INCOME
57.4%
WAGE / INCOME GAP [ % ]
42.6¢/ $1
WAGE / INCOME GAP [ $ ]
0.46
INEQUALITY / GINI INDEX
1,426
LABOR FORCE [ PEOPLE ]
64.4%
PERCENT IN LABOR FORCE
Fallon County Area Codes
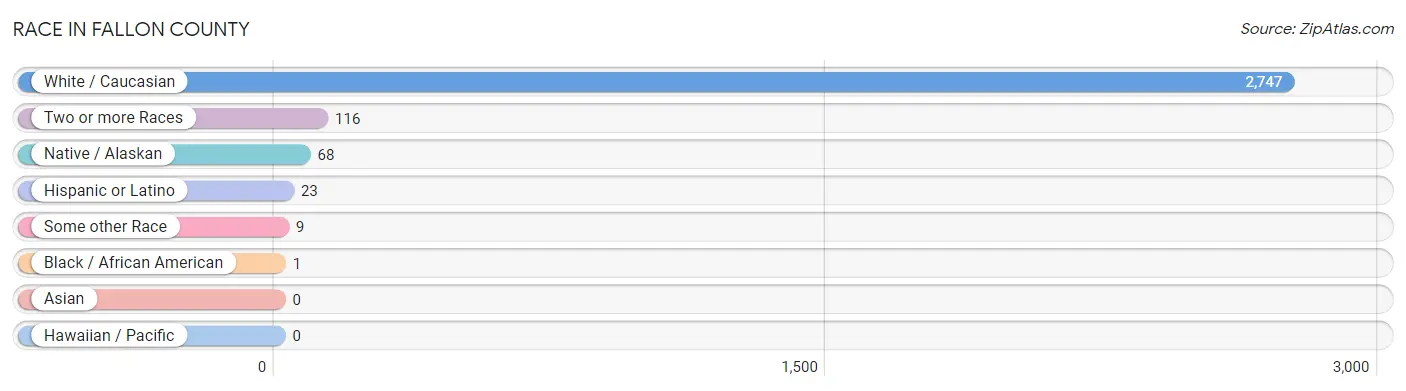
Race in Fallon County
The most populous races in Fallon County are White / Caucasian (2,747 | 93.4%), Two or more Races (116 | 3.9%), and Native / Alaskan (68 | 2.3%).
| Race | # Population | % Population |
| Asian | 0 | 0.0% |
| Black / African American | 1 | 0.0% |
| Hawaiian / Pacific | 0 | 0.0% |
| Hispanic or Latino | 23 | 0.8% |
| Native / Alaskan | 68 | 2.3% |
| White / Caucasian | 2,747 | 93.4% |
| Two or more Races | 116 | 3.9% |
| Some other Race | 9 | 0.3% |
| Total | 2,941 | 100.0% |
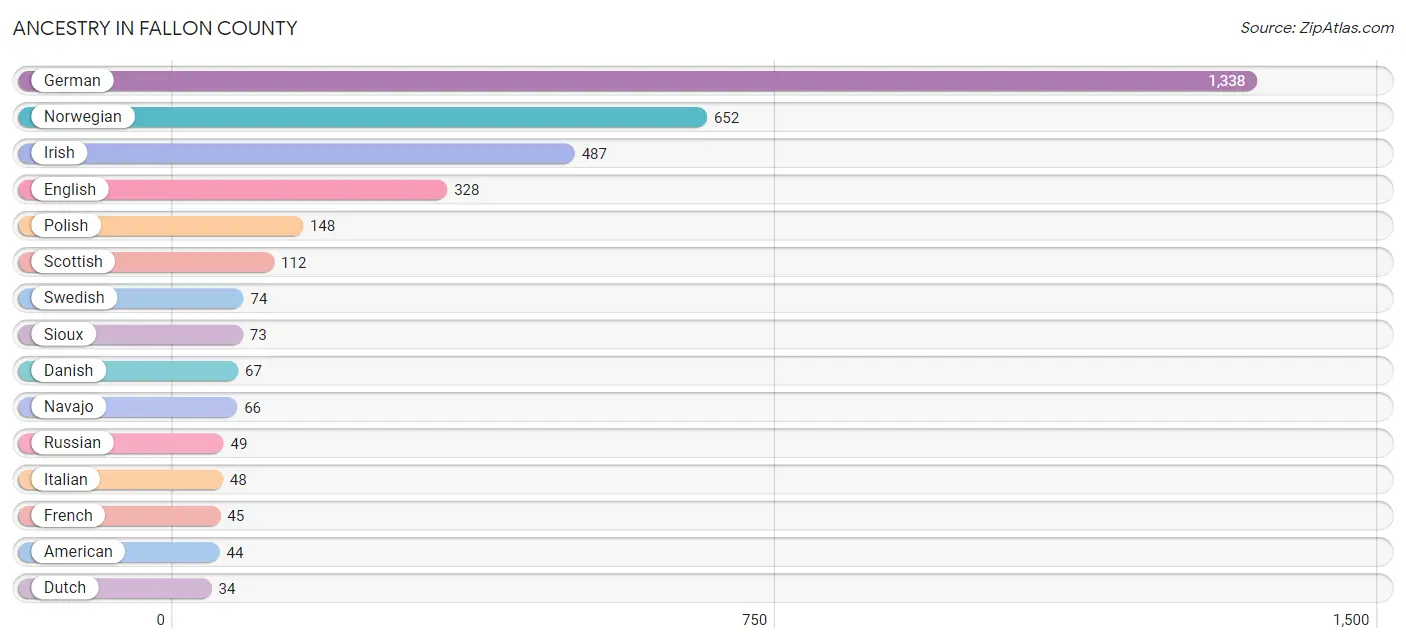
Ancestry in Fallon County
The most populous ancestries reported in Fallon County are German (1,338 | 45.5%), Norwegian (652 | 22.2%), Irish (487 | 16.6%), English (328 | 11.2%), and Polish (148 | 5.0%), together accounting for 100.4% of all Fallon County residents.
| Ancestry | # Population | % Population |
| Afghan | 1 | 0.0% |
| American | 44 | 1.5% |
| Blackfeet | 1 | 0.0% |
| Canadian | 1 | 0.0% |
| Chickasaw | 5 | 0.2% |
| Chippewa | 2 | 0.1% |
| Czech | 20 | 0.7% |
| Czechoslovakian | 8 | 0.3% |
| Danish | 67 | 2.3% |
| Dutch | 34 | 1.2% |
| English | 328 | 11.2% |
| European | 31 | 1.1% |
| Finnish | 7 | 0.2% |
| French | 45 | 1.5% |
| French American Indian | 1 | 0.0% |
| French Canadian | 1 | 0.0% |
| German | 1,338 | 45.5% |
| Irish | 487 | 16.6% |
| Italian | 48 | 1.6% |
| Mexican | 10 | 0.3% |
| Navajo | 66 | 2.2% |
| Norwegian | 652 | 22.2% |
| Polish | 148 | 5.0% |
| Russian | 49 | 1.7% |
| Scandinavian | 15 | 0.5% |
| Scotch-Irish | 11 | 0.4% |
| Scottish | 112 | 3.8% |
| Serbian | 7 | 0.2% |
| Sioux | 73 | 2.5% |
| Spaniard | 12 | 0.4% |
| Spanish | 1 | 0.0% |
| Swedish | 74 | 2.5% |
| Swiss | 2 | 0.1% |
| Ukrainian | 1 | 0.0% |
| Welsh | 3 | 0.1% |
| Yugoslavian | 26 | 0.9% | View All 36 Rows |
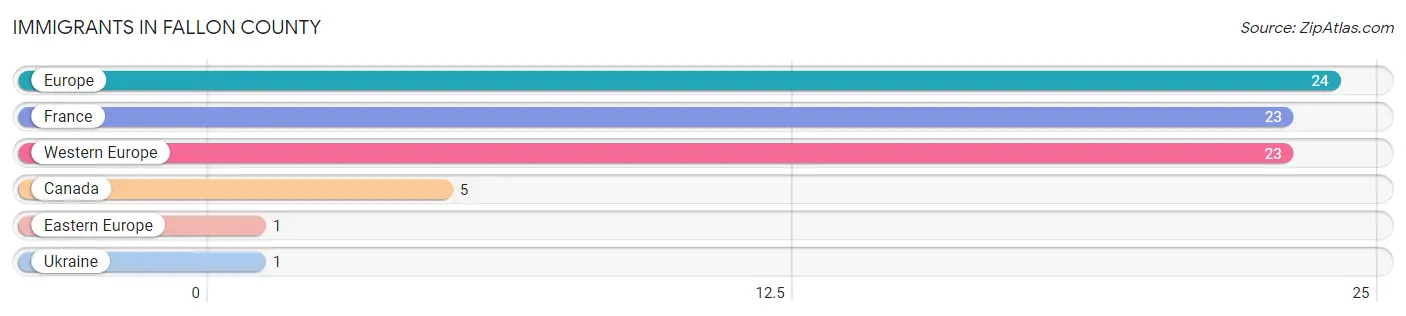
Immigrants in Fallon County
The most numerous immigrant groups reported in Fallon County came from Europe (24 | 0.8%), France (23 | 0.8%), Western Europe (23 | 0.8%), Canada (5 | 0.2%), and Eastern Europe (1 | 0.0%), together accounting for 2.6% of all Fallon County residents.
| Immigration Origin | # Population | % Population |
| Canada | 5 | 0.2% |
| Eastern Europe | 1 | 0.0% |
| Europe | 24 | 0.8% |
| France | 23 | 0.8% |
| Ukraine | 1 | 0.0% |
| Western Europe | 23 | 0.8% | View All 6 Rows |
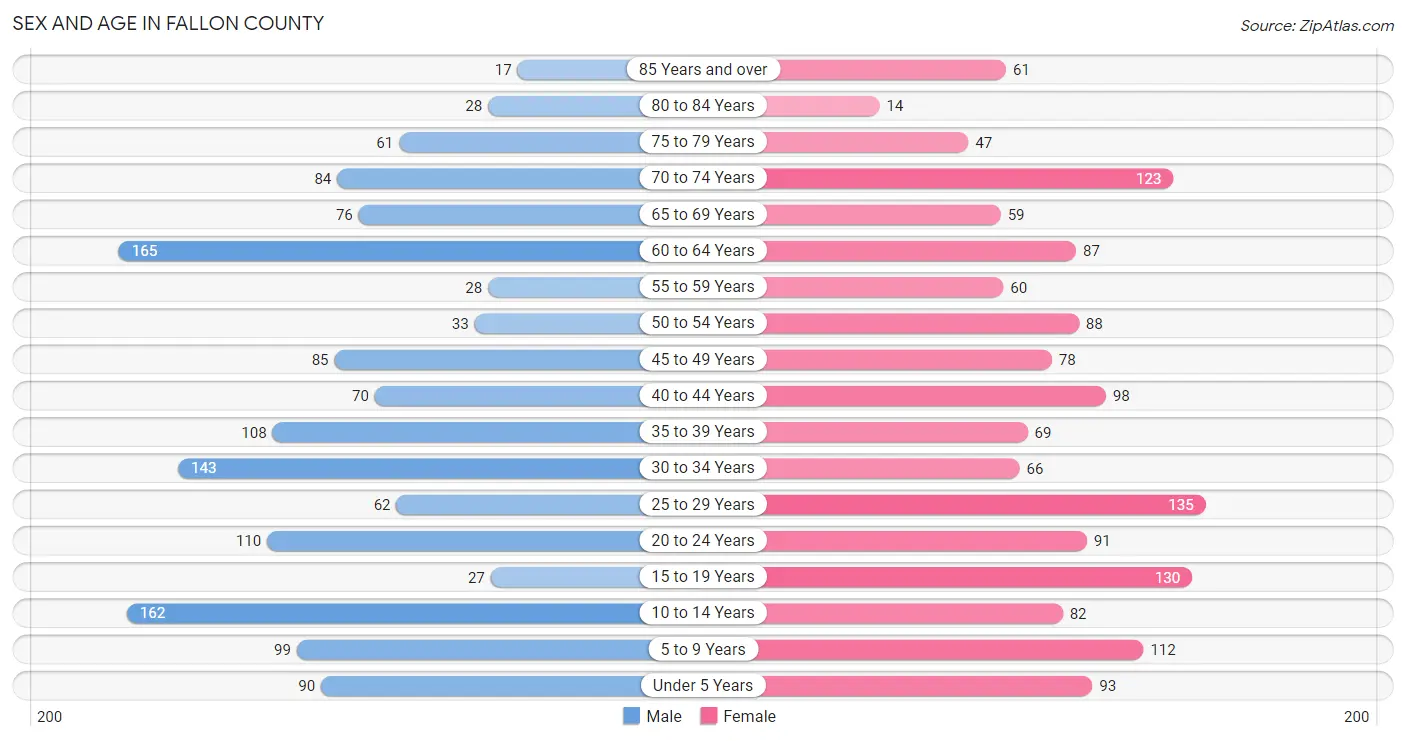
Sex and Age in Fallon County
Sex and Age in Fallon County
The most populous age groups in Fallon County are 60 to 64 Years (165 | 11.4%) for men and 25 to 29 Years (135 | 9.0%) for women.
| Age Bracket | Male | Female |
| Under 5 Years | 90 (6.2%) | 93 (6.2%) |
| 5 to 9 Years | 99 (6.8%) | 112 (7.5%) |
| 10 to 14 Years | 162 (11.2%) | 82 (5.5%) |
| 15 to 19 Years | 27 (1.9%) | 130 (8.7%) |
| 20 to 24 Years | 110 (7.6%) | 91 (6.1%) |
| 25 to 29 Years | 62 (4.3%) | 135 (9.0%) |
| 30 to 34 Years | 143 (9.9%) | 66 (4.4%) |
| 35 to 39 Years | 108 (7.5%) | 69 (4.6%) |
| 40 to 44 Years | 70 (4.8%) | 98 (6.6%) |
| 45 to 49 Years | 85 (5.9%) | 78 (5.2%) |
| 50 to 54 Years | 33 (2.3%) | 88 (5.9%) |
| 55 to 59 Years | 28 (1.9%) | 60 (4.0%) |
| 60 to 64 Years | 165 (11.4%) | 87 (5.8%) |
| 65 to 69 Years | 76 (5.2%) | 59 (4.0%) |
| 70 to 74 Years | 84 (5.8%) | 123 (8.2%) |
| 75 to 79 Years | 61 (4.2%) | 47 (3.2%) |
| 80 to 84 Years | 28 (1.9%) | 14 (0.9%) |
| 85 Years and over | 17 (1.2%) | 61 (4.1%) |
| Total | 1,448 (100.0%) | 1,493 (100.0%) |
Families and Households in Fallon County
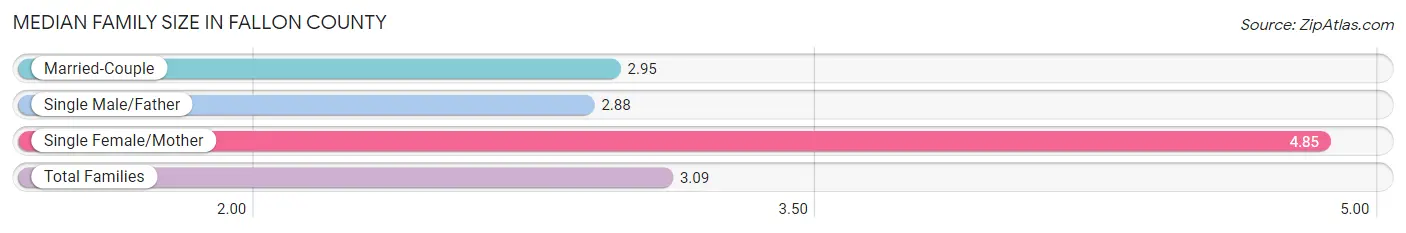
Median Family Size in Fallon County
The median family size in Fallon County is 3.09 persons per family, with single female/mother families (59 | 7.9%) accounting for the largest median family size of 4.85 persons per family. On the other hand, single male/father families (8 | 1.1%) represent the smallest median family size with 2.88 persons per family.
| Family Type | # Families | Family Size |
| Married-Couple | 681 (91.0%) | 2.95 |
| Single Male/Father | 8 (1.1%) | 2.88 |
| Single Female/Mother | 59 (7.9%) | 4.85 |
| Total Families | 748 (100.0%) | 3.09 |
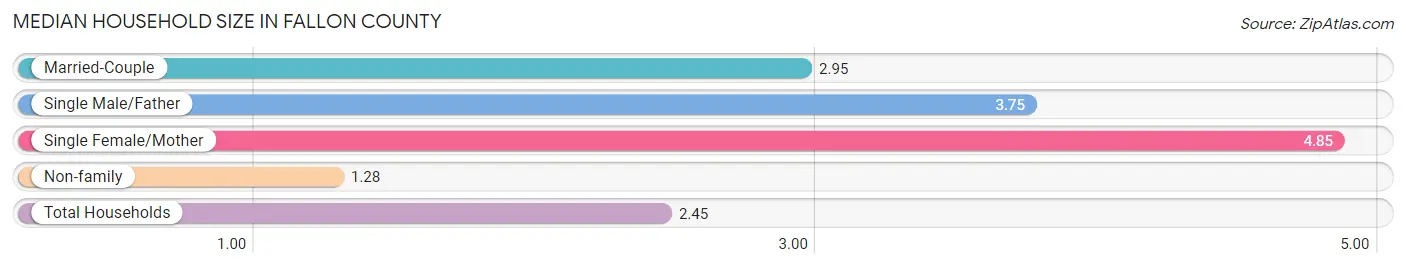
Median Household Size in Fallon County
The median household size in Fallon County is 2.45 persons per household, with single female/mother households (59 | 5.1%) accounting for the largest median household size of 4.85 persons per household. non-family households (416 | 35.7%) represent the smallest median household size with 1.28 persons per household.
| Household Type | # Households | Household Size |
| Married-Couple | 681 (58.5%) | 2.95 |
| Single Male/Father | 8 (0.7%) | 3.75 |
| Single Female/Mother | 59 (5.1%) | 4.85 |
| Non-family | 416 (35.7%) | 1.28 |
| Total Households | 1,164 (100.0%) | 2.45 |
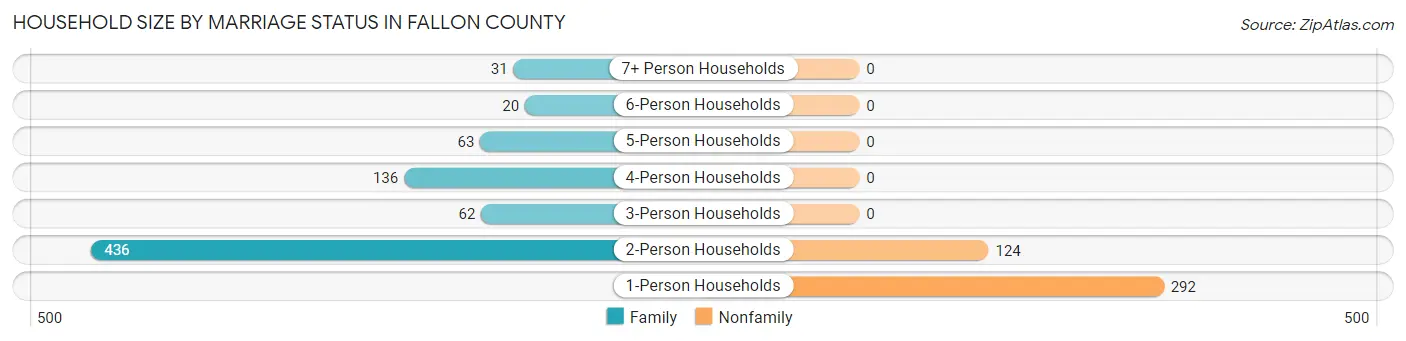
Household Size by Marriage Status in Fallon County
Out of a total of 1,164 households in Fallon County, 748 (64.3%) are family households, while 416 (35.7%) are nonfamily households. The most numerous type of family households are 2-person households, comprising 436, and the most common type of nonfamily households are 1-person households, comprising 292.
| Household Size | Family Households | Nonfamily Households |
| 1-Person Households | - | 292 (25.1%) |
| 2-Person Households | 436 (37.5%) | 124 (10.6%) |
| 3-Person Households | 62 (5.3%) | 0 (0.0%) |
| 4-Person Households | 136 (11.7%) | 0 (0.0%) |
| 5-Person Households | 63 (5.4%) | 0 (0.0%) |
| 6-Person Households | 20 (1.7%) | 0 (0.0%) |
| 7+ Person Households | 31 (2.7%) | 0 (0.0%) |
| Total | 748 (64.3%) | 416 (35.7%) |
Female Fertility in Fallon County
Fertility by Age in Fallon County
Average fertility rate in Fallon County is 47.0 births per 1,000 women. Women in the age bracket of 35 to 50 years have the highest fertility rate with 79.0 births per 1,000 women. Women in the age bracket of 35 to 50 years acount for 62.5% of all women with births.
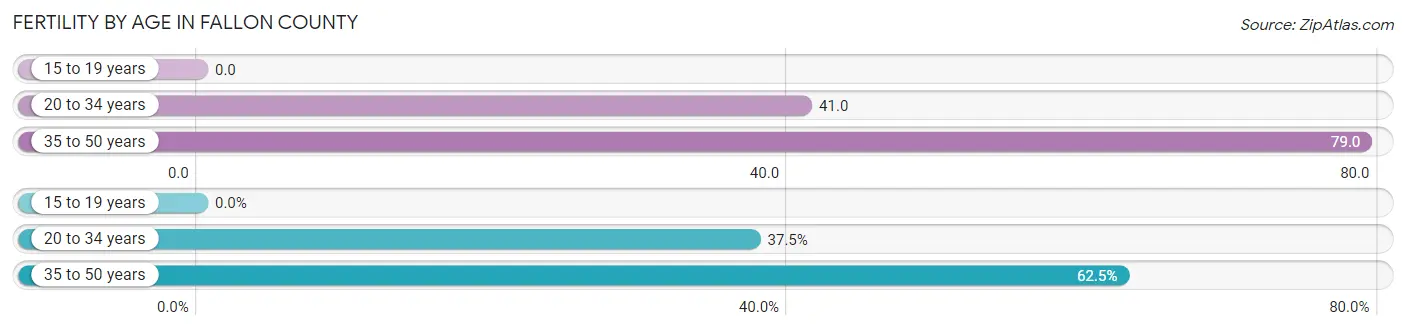
| Age Bracket | Women with Births | Births / 1,000 Women |
| 15 to 19 years | 0 (0.0%) | 0.0 |
| 20 to 34 years | 12 (37.5%) | 41.0 |
| 35 to 50 years | 20 (62.5%) | 79.0 |
| Total | 32 (100.0%) | 47.0 |
Fertility by Age by Marriage Status in Fallon County
15.6% of women with births (32) in Fallon County are married. The highest percentage of unmarried women with births falls into 35 to 50 years age bracket with 100.0% of them unmarried at the time of birth, while the lowest percentage of unmarried women with births belong to 20 to 34 years age bracket with 58.3% of them unmarried.
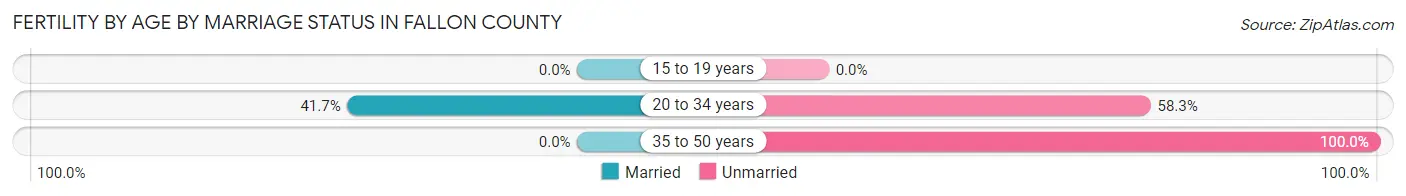
| Age Bracket | Married | Unmarried |
| 15 to 19 years | 0 (0.0%) | 0 (0.0%) |
| 20 to 34 years | 5 (41.7%) | 7 (58.3%) |
| 35 to 50 years | 0 (0.0%) | 20 (100.0%) |
| Total | 5 (15.6%) | 27 (84.4%) |
Fertility by Education in Fallon County
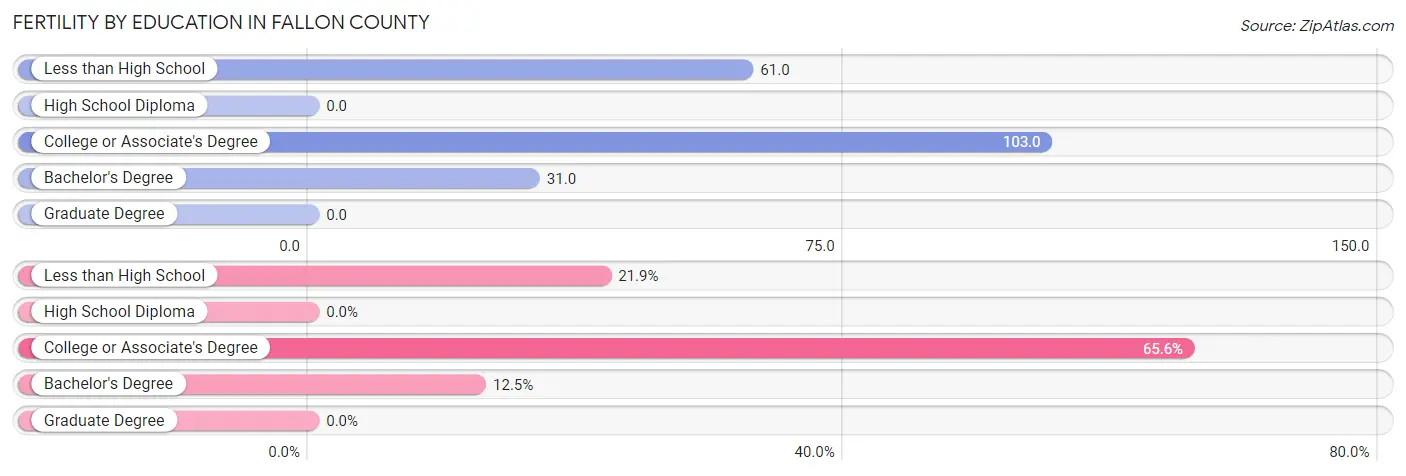
| Educational Attainment | Women with Births | Births / 1,000 Women |
| Less than High School | 7 (21.9%) | 61.0 |
| High School Diploma | 0 (0.0%) | 0.0 |
| College or Associate's Degree | 21 (65.6%) | 103.0 |
| Bachelor's Degree | 4 (12.5%) | 31.0 |
| Graduate Degree | 0 (0.0%) | 0.0 |
| Total | 32 (100.0%) | 47.0 |
Fertility by Education by Marriage Status in Fallon County
84.4% of women with births in Fallon County are unmarried. Women with the educational attainment of bachelor's degree are most likely to be married with 100.0% of them married at childbirth, while women with the educational attainment of less than high school are least likely to be married with 100.0% of them unmarried at childbirth.
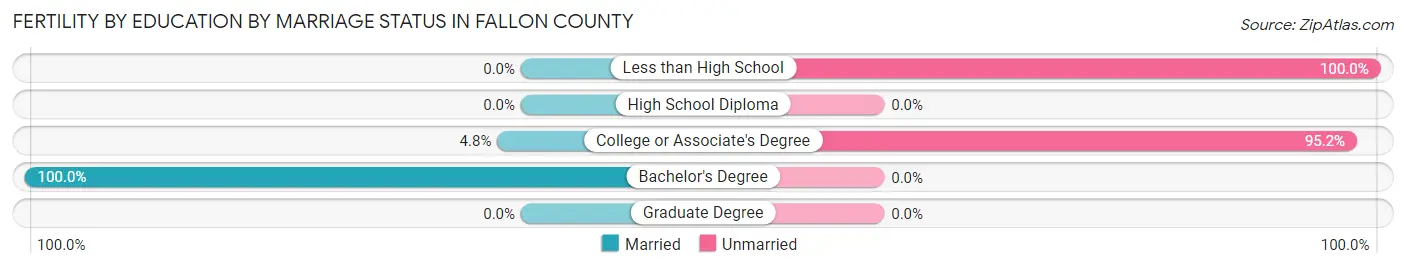
| Educational Attainment | Married | Unmarried |
| Less than High School | 0 (0.0%) | 7 (100.0%) |
| High School Diploma | 0 (0.0%) | 0 (0.0%) |
| College or Associate's Degree | 1 (4.8%) | 20 (95.2%) |
| Bachelor's Degree | 4 (100.0%) | 0 (0.0%) |
| Graduate Degree | 0 (0.0%) | 0 (0.0%) |
| Total | 5 (15.6%) | 27 (84.4%) |
Income in Fallon County
Income Overview in Fallon County
Per Capita Income in Fallon County is $42,516, while median incomes of families and households are $112,540 and $79,750 respectively.
| Characteristic | Number | Measure |
| Per Capita Income | 2,941 | $42,516 |
| Median Family Income | 748 | $112,540 |
| Mean Family Income | 748 | $129,552 |
| Median Household Income | 1,164 | $79,750 |
| Mean Household Income | 1,164 | $101,684 |
| Income Deficit | 748 | $0 |
| Wage / Income Gap (%) | 2,941 | 57.38% |
| Wage / Income Gap ($) | 2,941 | 42.62¢ per $1 |
| Gini / Inequality Index | 2,941 | 0.46 |
Earnings by Sex in Fallon County
Average Earnings in Fallon County are $47,396, $67,308 for men and $28,690 for women, a difference of 57.4%.
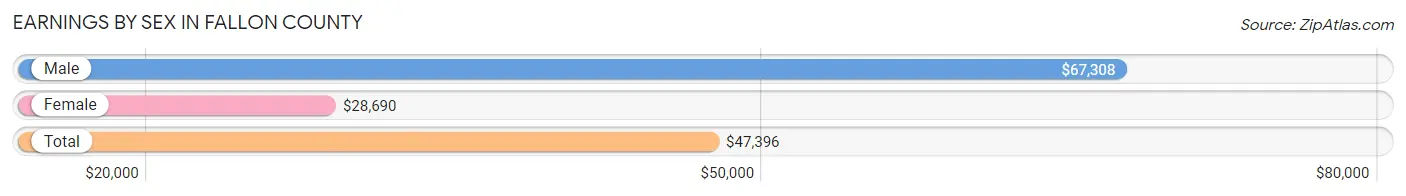
| Sex | Number | Average Earnings |
| Male | 840 (52.9%) | $67,308 |
| Female | 748 (47.1%) | $28,690 |
| Total | 1,588 (100.0%) | $47,396 |
Earnings by Sex by Income Bracket in Fallon County
The most common earnings brackets in Fallon County are $100,000+ for men (205 | 24.4%) and $7,500 to $9,999 for women (99 | 13.2%).
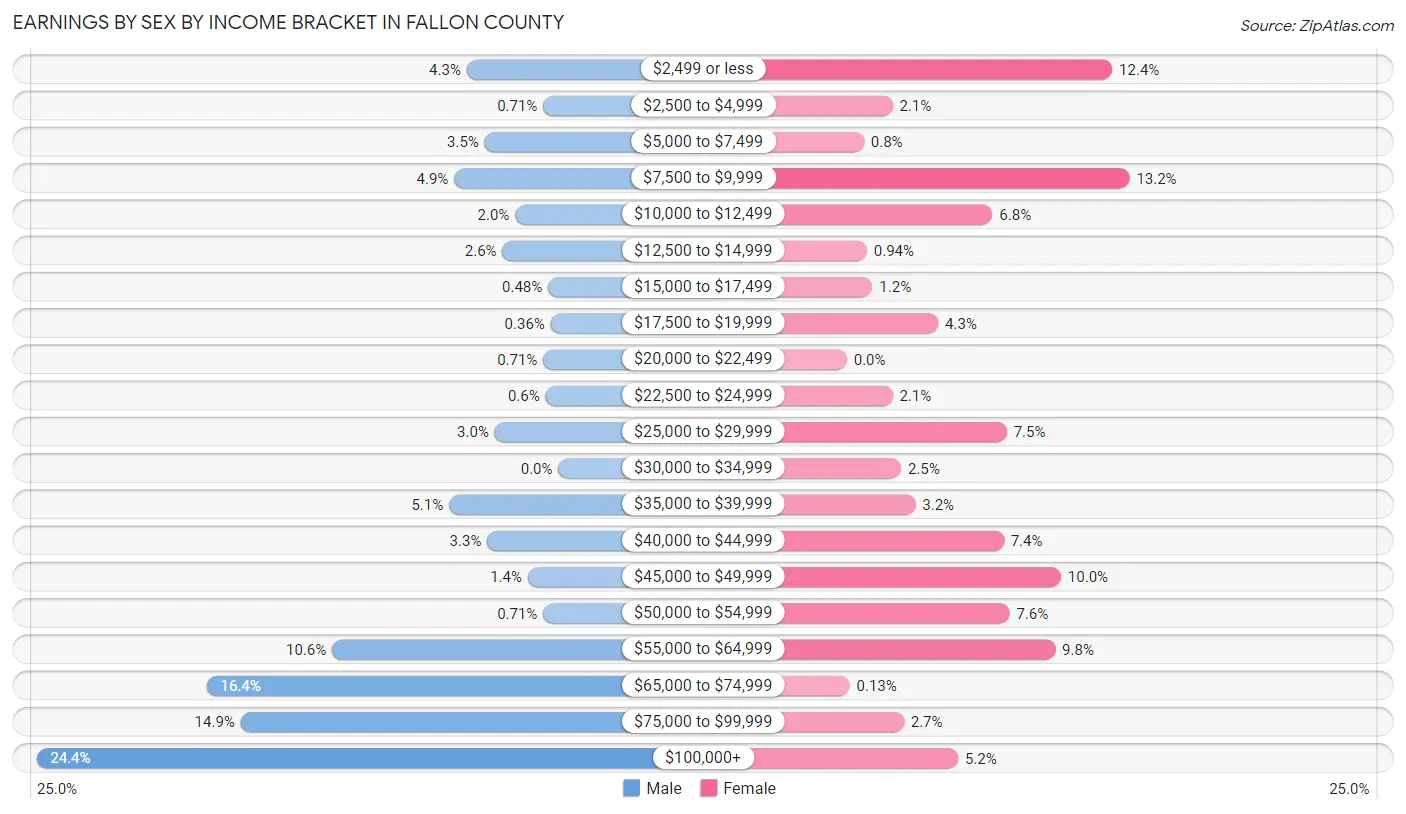
| Income | Male | Female |
| $2,499 or less | 36 (4.3%) | 93 (12.4%) |
| $2,500 to $4,999 | 6 (0.7%) | 16 (2.1%) |
| $5,000 to $7,499 | 29 (3.5%) | 6 (0.8%) |
| $7,500 to $9,999 | 41 (4.9%) | 99 (13.2%) |
| $10,000 to $12,499 | 17 (2.0%) | 51 (6.8%) |
| $12,500 to $14,999 | 22 (2.6%) | 7 (0.9%) |
| $15,000 to $17,499 | 4 (0.5%) | 9 (1.2%) |
| $17,500 to $19,999 | 3 (0.4%) | 32 (4.3%) |
| $20,000 to $22,499 | 6 (0.7%) | 0 (0.0%) |
| $22,500 to $24,999 | 5 (0.6%) | 16 (2.1%) |
| $25,000 to $29,999 | 25 (3.0%) | 56 (7.5%) |
| $30,000 to $34,999 | 0 (0.0%) | 19 (2.5%) |
| $35,000 to $39,999 | 43 (5.1%) | 24 (3.2%) |
| $40,000 to $44,999 | 28 (3.3%) | 55 (7.3%) |
| $45,000 to $49,999 | 12 (1.4%) | 75 (10.0%) |
| $50,000 to $54,999 | 6 (0.7%) | 57 (7.6%) |
| $55,000 to $64,999 | 89 (10.6%) | 73 (9.8%) |
| $65,000 to $74,999 | 138 (16.4%) | 1 (0.1%) |
| $75,000 to $99,999 | 125 (14.9%) | 20 (2.7%) |
| $100,000+ | 205 (24.4%) | 39 (5.2%) |
| Total | 840 (100.0%) | 748 (100.0%) |
Earnings by Sex by Educational Attainment in Fallon County
Average earnings in Fallon County are $71,360 for men and $37,917 for women, a difference of 46.9%. Men with an educational attainment of college or associate's degree enjoy the highest average annual earnings of $74,722, while those with graduate degree education earn the least with $28,083. Women with an educational attainment of bachelor's degree earn the most with the average annual earnings of $46,696, while those with college or associate's degree education have the smallest earnings of $25,184.
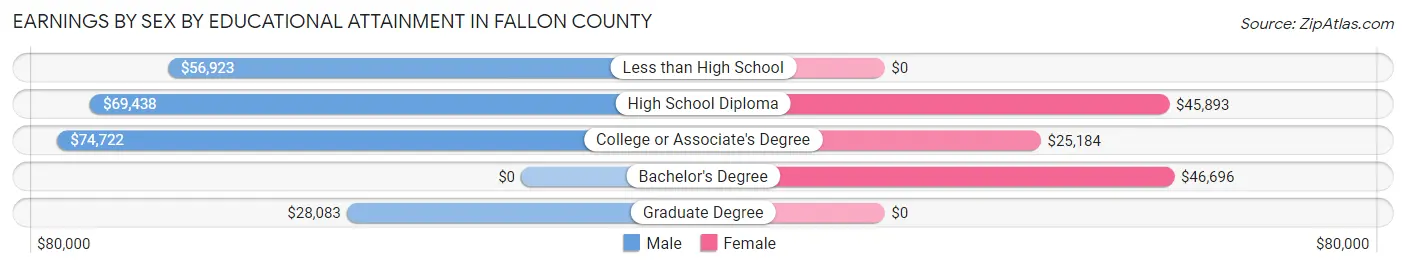
| Educational Attainment | Male Income | Female Income |
| Less than High School | $56,923 | $0 |
| High School Diploma | $69,438 | $45,893 |
| College or Associate's Degree | $74,722 | $25,184 |
| Bachelor's Degree | - | - |
| Graduate Degree | $28,083 | $0 |
| Total | $71,360 | $37,917 |
Family Income in Fallon County
Family Income Brackets in Fallon County
According to the Fallon County family income data, there are 245 families falling into the $100,000 to $149,999 income range, which is the most common income bracket and makes up 32.8% of all families. Conversely, the less than $10,000 income bracket is the least frequent group with only 7 families (0.9%) belonging to this category.
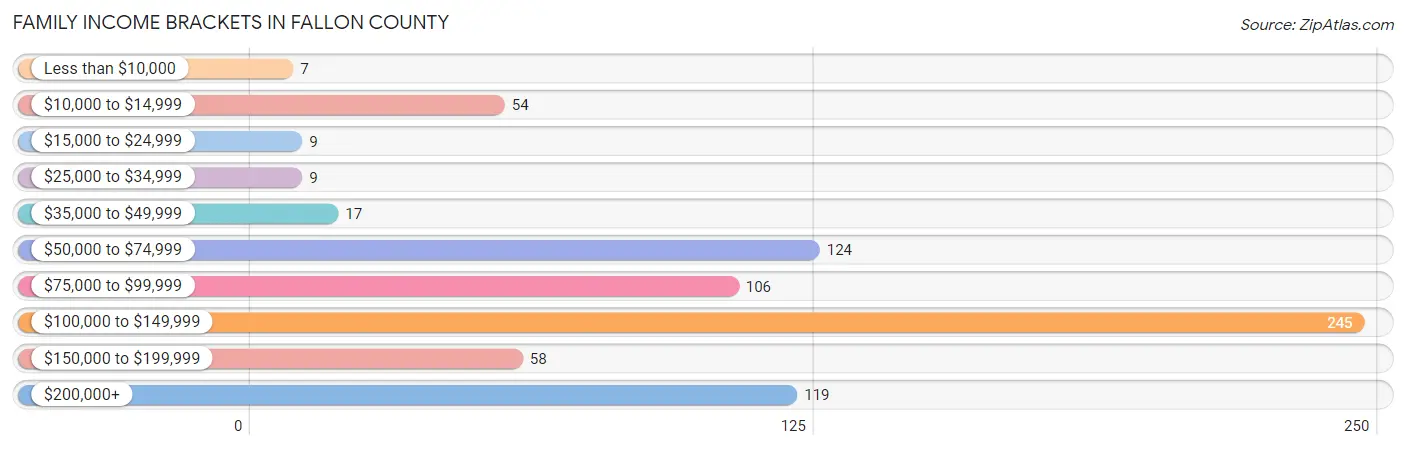
| Income Bracket | # Families | % Families |
| Less than $10,000 | 7 | 0.9% |
| $10,000 to $14,999 | 54 | 7.2% |
| $15,000 to $24,999 | 9 | 1.2% |
| $25,000 to $34,999 | 9 | 1.2% |
| $35,000 to $49,999 | 17 | 2.3% |
| $50,000 to $74,999 | 124 | 16.6% |
| $75,000 to $99,999 | 106 | 14.2% |
| $100,000 to $149,999 | 245 | 32.8% |
| $150,000 to $199,999 | 58 | 7.8% |
| $200,000+ | 119 | 15.9% |
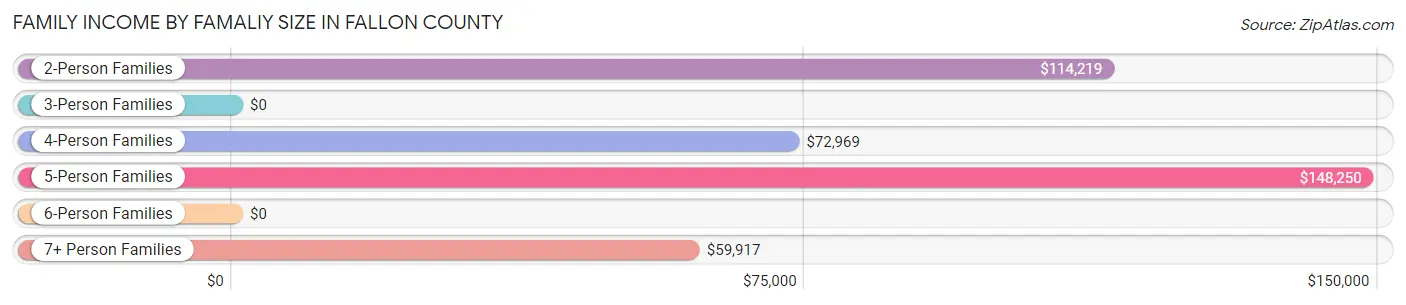
Family Income by Famaliy Size in Fallon County
5-person families (63 | 8.4%) account for the highest median family income in Fallon County with $148,250 per family, while 2-person families (436 | 58.3%) have the highest median income of $57,110 per family member.
| Income Bracket | # Families | Median Income |
| 2-Person Families | 436 (58.3%) | $114,219 |
| 3-Person Families | 68 (9.1%) | $0 |
| 4-Person Families | 130 (17.4%) | $72,969 |
| 5-Person Families | 63 (8.4%) | $148,250 |
| 6-Person Families | 20 (2.7%) | $0 |
| 7+ Person Families | 31 (4.1%) | $59,917 |
| Total | 748 (100.0%) | $112,540 |
Family Income by Number of Earners in Fallon County
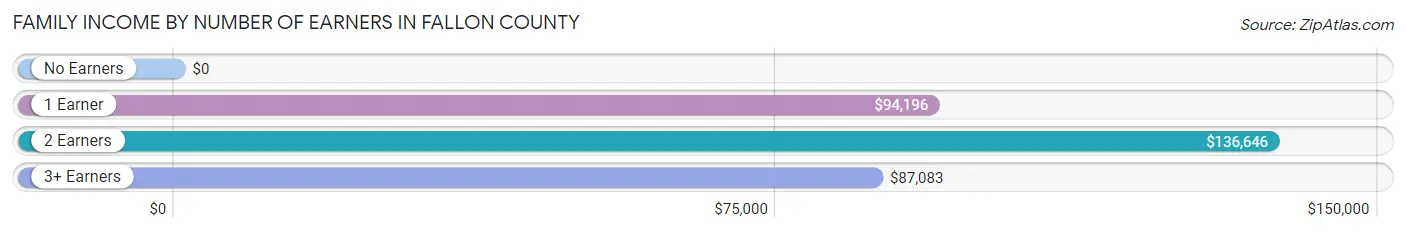
| Number of Earners | # Families | Median Income |
| No Earners | 126 (16.8%) | $0 |
| 1 Earner | 213 (28.5%) | $94,196 |
| 2 Earners | 362 (48.4%) | $136,646 |
| 3+ Earners | 47 (6.3%) | $87,083 |
| Total | 748 (100.0%) | $112,540 |
Household Income in Fallon County
Household Income Brackets in Fallon County
With 286 households falling in the category, the $100,000 to $149,999 income range is the most frequent in Fallon County, accounting for 24.6% of all households. In contrast, only 36 households (3.1%) fall into the $15,000 to $24,999 income bracket, making it the least populous group.
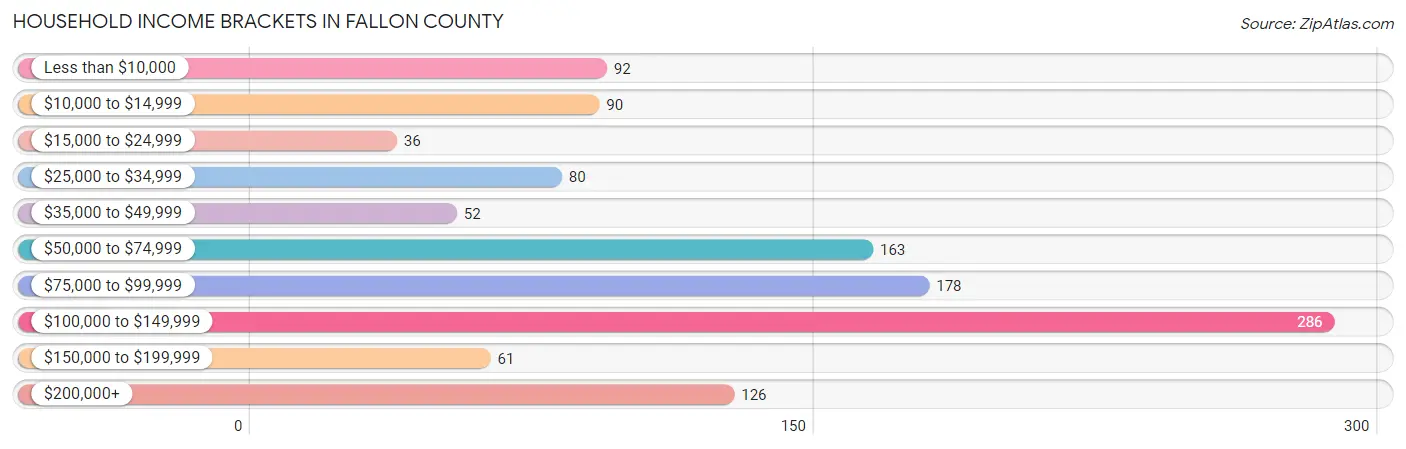
| Income Bracket | # Households | % Households |
| Less than $10,000 | 92 | 7.9% |
| $10,000 to $14,999 | 90 | 7.7% |
| $15,000 to $24,999 | 36 | 3.1% |
| $25,000 to $34,999 | 80 | 6.9% |
| $35,000 to $49,999 | 52 | 4.5% |
| $50,000 to $74,999 | 163 | 14.0% |
| $75,000 to $99,999 | 178 | 15.3% |
| $100,000 to $149,999 | 286 | 24.6% |
| $150,000 to $199,999 | 61 | 5.2% |
| $200,000+ | 126 | 10.8% |
Household Income by Householder Age in Fallon County
The median household income in Fallon County is $79,750, with the highest median household income of $118,917 found in the 45 to 64 years age bracket for the primary householder. A total of 347 households (29.8%) fall into this category. Meanwhile, the 15 to 24 years age bracket for the primary householder has the lowest median household income of $0, with 64 households (5.5%) in this group.
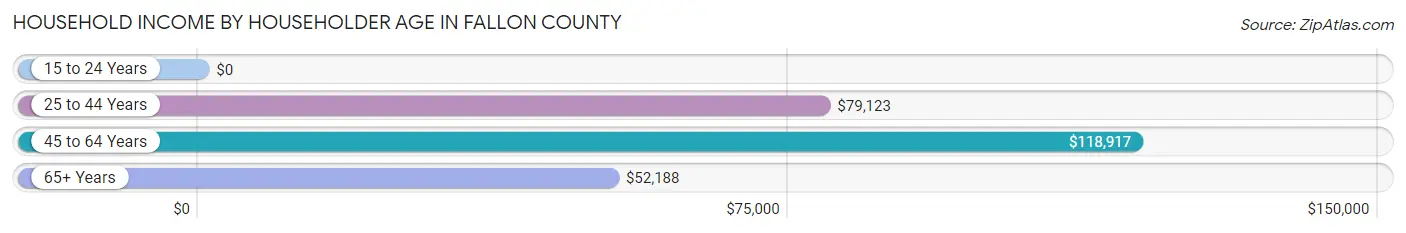
| Income Bracket | # Households | Median Income |
| 15 to 24 Years | 64 (5.5%) | $0 |
| 25 to 44 Years | 438 (37.6%) | $79,123 |
| 45 to 64 Years | 347 (29.8%) | $118,917 |
| 65+ Years | 315 (27.1%) | $52,188 |
| Total | 1,164 (100.0%) | $79,750 |
Poverty in Fallon County
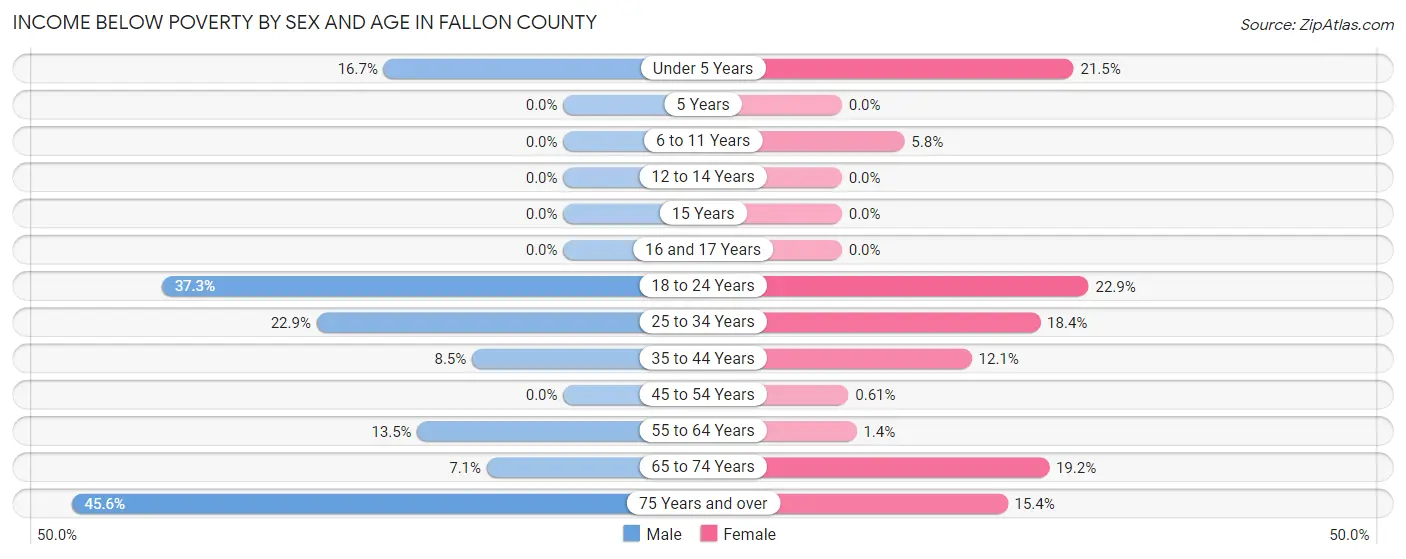
Income Below Poverty by Sex and Age in Fallon County
With 14.0% poverty level for males and 11.5% for females among the residents of Fallon County, 75 year old and over males and 18 to 24 year old females are the most vulnerable to poverty, with 47 males (45.6%) and 30 females (22.9%) in their respective age groups living below the poverty level.
| Age Bracket | Male | Female |
| Under 5 Years | 15 (16.7%) | 20 (21.5%) |
| 5 Years | 0 (0.0%) | 0 (0.0%) |
| 6 to 11 Years | 0 (0.0%) | 9 (5.8%) |
| 12 to 14 Years | 0 (0.0%) | 0 (0.0%) |
| 15 Years | 0 (0.0%) | 0 (0.0%) |
| 16 and 17 Years | 0 (0.0%) | 0 (0.0%) |
| 18 to 24 Years | 41 (37.3%) | 30 (22.9%) |
| 25 to 34 Years | 46 (22.9%) | 37 (18.4%) |
| 35 to 44 Years | 15 (8.5%) | 20 (12.0%) |
| 45 to 54 Years | 0 (0.0%) | 1 (0.6%) |
| 55 to 64 Years | 26 (13.5%) | 2 (1.4%) |
| 65 to 74 Years | 11 (7.1%) | 35 (19.2%) |
| 75 Years and over | 47 (45.6%) | 10 (15.4%) |
| Total | 201 (14.0%) | 164 (11.5%) |
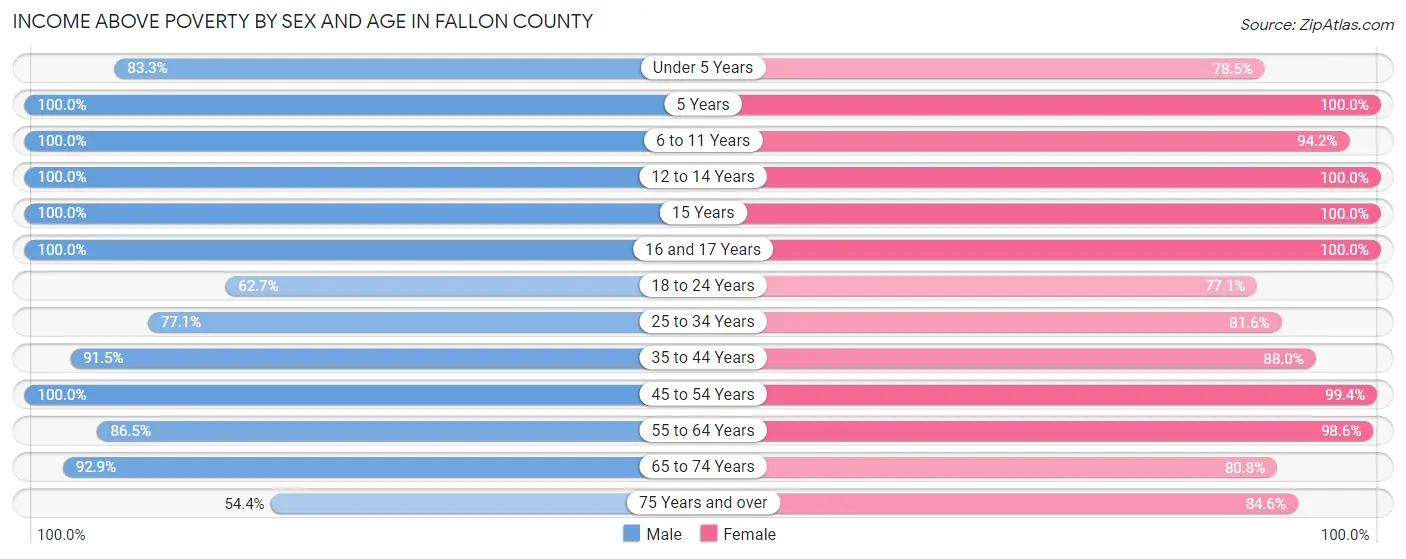
Income Above Poverty by Sex and Age in Fallon County
According to the poverty statistics in Fallon County, males aged 5 years and females aged 5 years are the age groups that are most secure financially, with 100.0% of males and 100.0% of females in these age groups living above the poverty line.
| Age Bracket | Male | Female |
| Under 5 Years | 75 (83.3%) | 73 (78.5%) |
| 5 Years | 4 (100.0%) | 16 (100.0%) |
| 6 to 11 Years | 171 (100.0%) | 146 (94.2%) |
| 12 to 14 Years | 86 (100.0%) | 23 (100.0%) |
| 15 Years | 15 (100.0%) | 70 (100.0%) |
| 16 and 17 Years | 12 (100.0%) | 17 (100.0%) |
| 18 to 24 Years | 69 (62.7%) | 101 (77.1%) |
| 25 to 34 Years | 155 (77.1%) | 164 (81.6%) |
| 35 to 44 Years | 162 (91.5%) | 146 (87.9%) |
| 45 to 54 Years | 116 (100.0%) | 164 (99.4%) |
| 55 to 64 Years | 166 (86.5%) | 145 (98.6%) |
| 65 to 74 Years | 144 (92.9%) | 147 (80.8%) |
| 75 Years and over | 56 (54.4%) | 55 (84.6%) |
| Total | 1,231 (86.0%) | 1,267 (88.5%) |
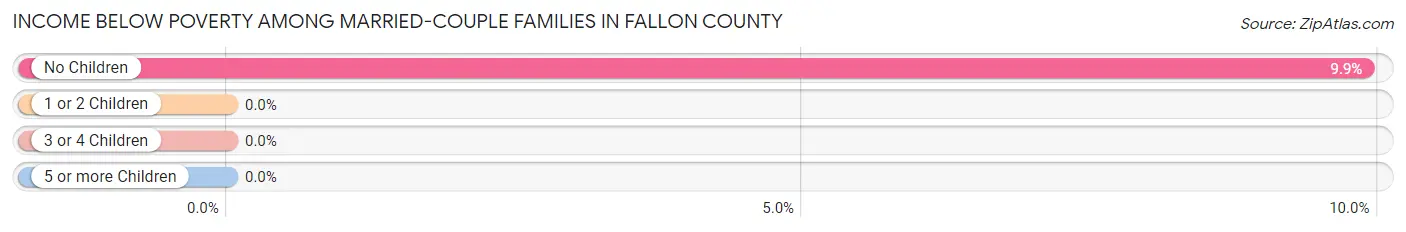
Income Below Poverty Among Married-Couple Families in Fallon County
The poverty statistics for married-couple families in Fallon County show that 6.5% or 44 of the total 681 families live below the poverty line. Families with no children have the highest poverty rate of 9.9%, comprising of 44 families. On the other hand, families with 1 or 2 children have the lowest poverty rate of 0.0%, which includes 0 families.
| Children | Above Poverty | Below Poverty |
| No Children | 401 (90.1%) | 44 (9.9%) |
| 1 or 2 Children | 137 (100.0%) | 0 (0.0%) |
| 3 or 4 Children | 98 (100.0%) | 0 (0.0%) |
| 5 or more Children | 1 (100.0%) | 0 (0.0%) |
| Total | 637 (93.5%) | 44 (6.5%) |
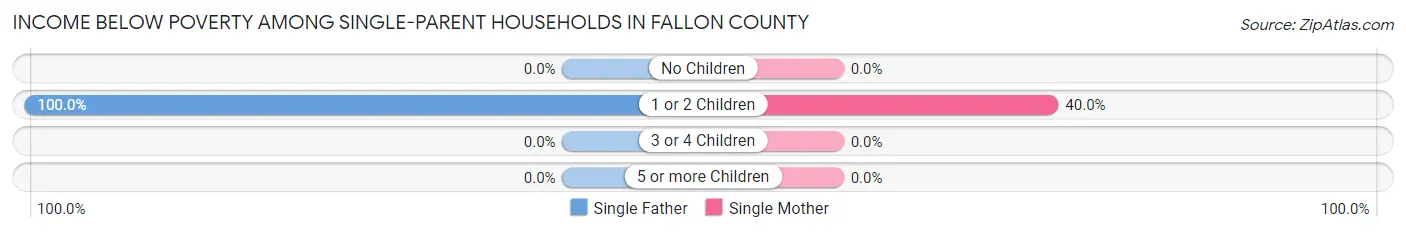
Income Below Poverty Among Single-Parent Households in Fallon County
According to the poverty data in Fallon County, 75.0% or 6 single-father households and 33.9% or 20 single-mother households are living below the poverty line. Among single-father households, those with 1 or 2 children have the highest poverty rate, with 6 households (100.0%) experiencing poverty. Likewise, among single-mother households, those with 1 or 2 children have the highest poverty rate, with 20 households (40.0%) falling below the poverty line.
| Children | Single Father | Single Mother |
| No Children | 0 (0.0%) | 0 (0.0%) |
| 1 or 2 Children | 6 (100.0%) | 20 (40.0%) |
| 3 or 4 Children | 0 (0.0%) | 0 (0.0%) |
| 5 or more Children | 0 (0.0%) | 0 (0.0%) |
| Total | 6 (75.0%) | 20 (33.9%) |
Income Below Poverty Among Married-Couple vs Single-Parent Households in Fallon County
The poverty data for Fallon County shows that 44 of the married-couple family households (6.5%) and 26 of the single-parent households (38.8%) are living below the poverty level. Within the married-couple family households, those with no children have the highest poverty rate, with 44 households (9.9%) falling below the poverty line. Among the single-parent households, those with 1 or 2 children have the highest poverty rate, with 26 household (46.4%) living below poverty.
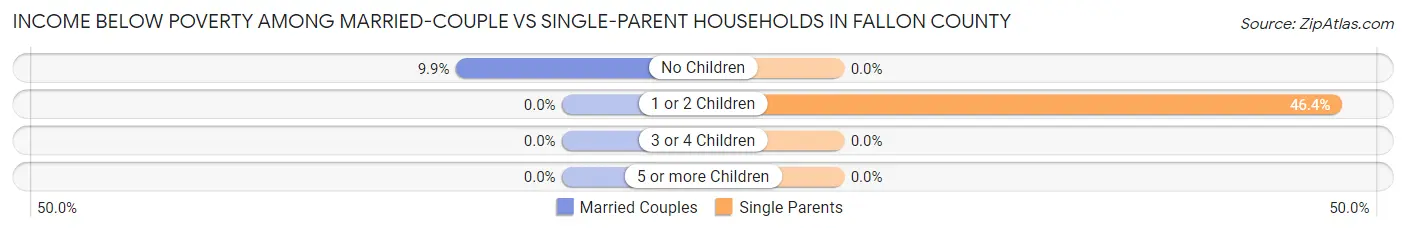
| Children | Married-Couple Families | Single-Parent Households |
| No Children | 44 (9.9%) | 0 (0.0%) |
| 1 or 2 Children | 0 (0.0%) | 26 (46.4%) |
| 3 or 4 Children | 0 (0.0%) | 0 (0.0%) |
| 5 or more Children | 0 (0.0%) | 0 (0.0%) |
| Total | 44 (6.5%) | 26 (38.8%) |
Employment Characteristics in Fallon County
Employment by Class of Employer in Fallon County
Among the 1,423 employed individuals in Fallon County, private company employees (876 | 61.6%), local government employees (169 | 11.9%), and self-employed (not incorporated) (129 | 9.1%) make up the most common classes of employment.
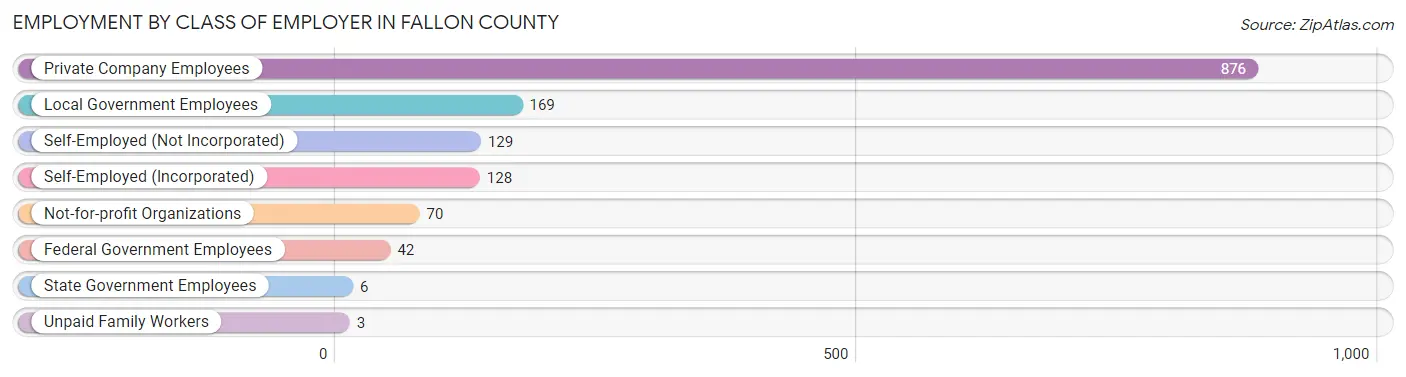
| Employer Class | # Employees | % Employees |
| Private Company Employees | 876 | 61.6% |
| Self-Employed (Incorporated) | 128 | 9.0% |
| Self-Employed (Not Incorporated) | 129 | 9.1% |
| Not-for-profit Organizations | 70 | 4.9% |
| Local Government Employees | 169 | 11.9% |
| State Government Employees | 6 | 0.4% |
| Federal Government Employees | 42 | 2.9% |
| Unpaid Family Workers | 3 | 0.2% |
| Total | 1,423 | 100.0% |
Employment Status by Age in Fallon County
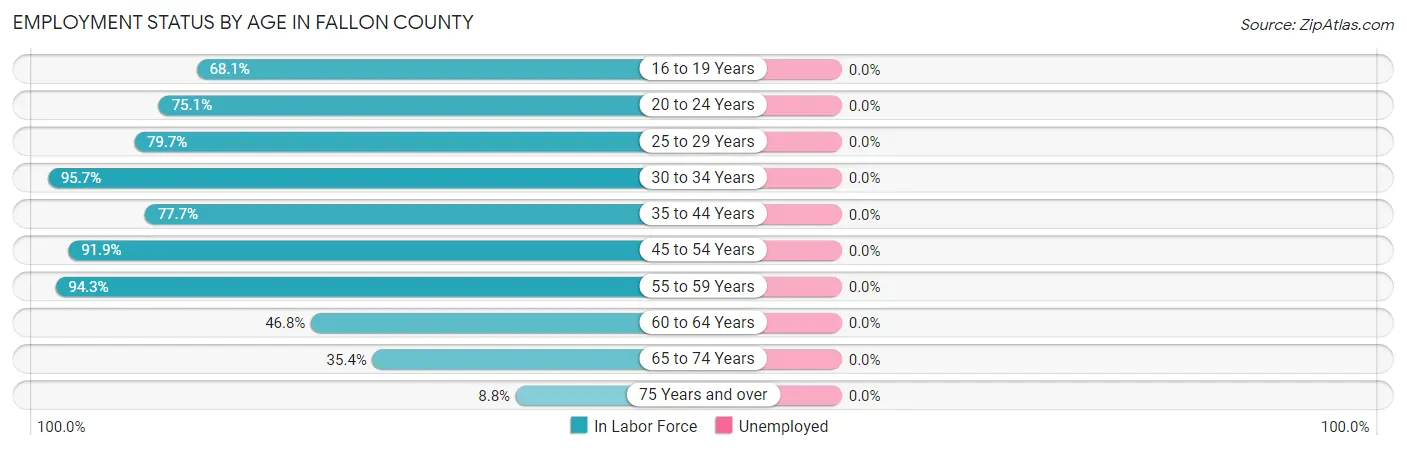
| Age Bracket | In Labor Force | Unemployed |
| 16 to 19 Years | 47 (68.1%) | 0 (0.0%) |
| 20 to 24 Years | 151 (75.1%) | 0 (0.0%) |
| 25 to 29 Years | 157 (79.7%) | 0 (0.0%) |
| 30 to 34 Years | 200 (95.7%) | 0 (0.0%) |
| 35 to 44 Years | 268 (77.7%) | 0 (0.0%) |
| 45 to 54 Years | 261 (91.9%) | 0 (0.0%) |
| 55 to 59 Years | 83 (94.3%) | 0 (0.0%) |
| 60 to 64 Years | 118 (46.8%) | 0 (0.0%) |
| 65 to 74 Years | 121 (35.4%) | 0 (0.0%) |
| 75 Years and over | 20 (8.8%) | 0 (0.0%) |
| Total | 1,426 (64.4%) | 0 (0.0%) |
Employment Status by Educational Attainment in Fallon County
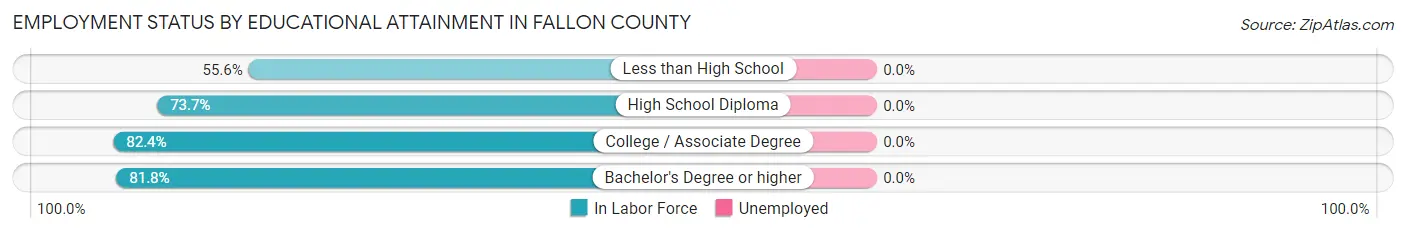
| Educational Attainment | In Labor Force | Unemployed |
| Less than High School | 25 (55.6%) | 0 (0.0%) |
| High School Diploma | 274 (73.7%) | 0 (0.0%) |
| College / Associate Degree | 540 (82.4%) | 0 (0.0%) |
| Bachelor's Degree or higher | 248 (81.8%) | 0 (0.0%) |
| Total | 1,088 (79.1%) | 0 (0.0%) |
Employment Occupations by Sex in Fallon County
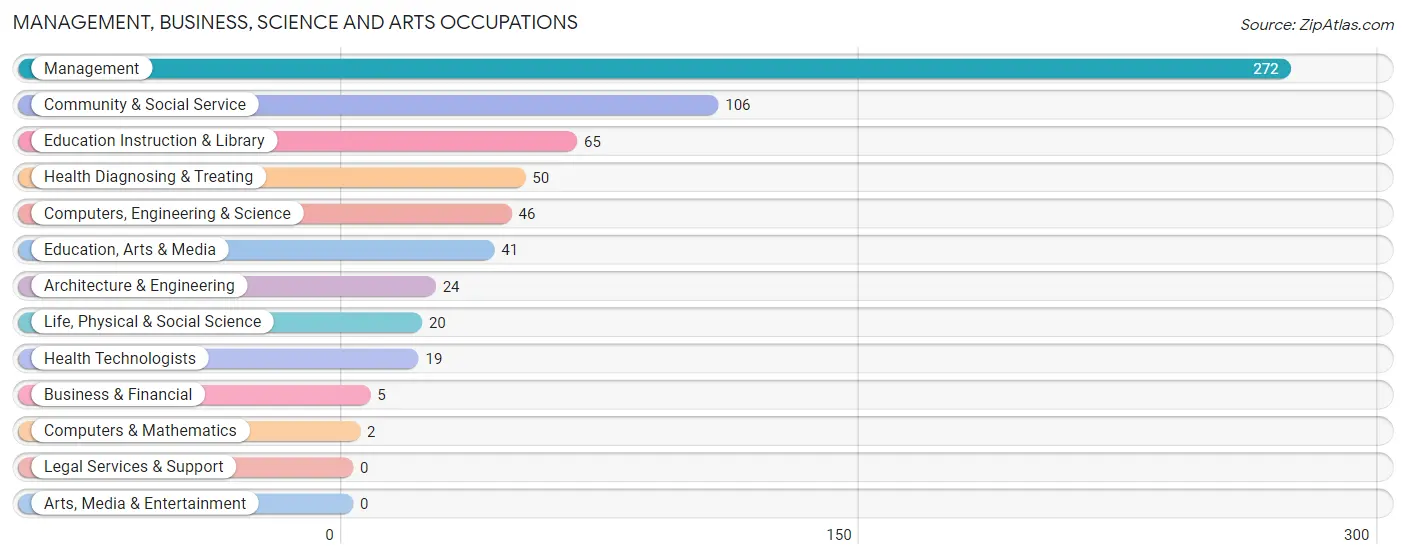
Management, Business, Science and Arts Occupations
The most common Management, Business, Science and Arts occupations in Fallon County are Management (272 | 19.1%), Community & Social Service (106 | 7.4%), Education Instruction & Library (65 | 4.6%), Health Diagnosing & Treating (50 | 3.5%), and Computers, Engineering & Science (46 | 3.2%).
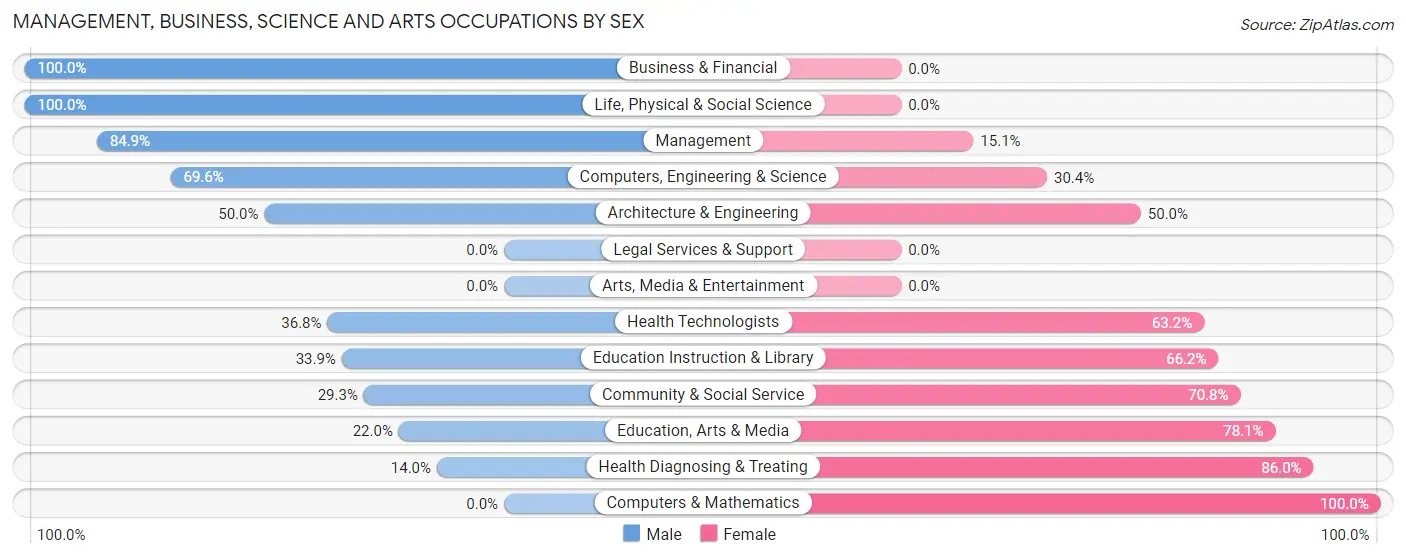
Management, Business, Science and Arts Occupations by Sex
Within the Management, Business, Science and Arts occupations in Fallon County, the most male-oriented occupations are Business & Financial (100.0%), Life, Physical & Social Science (100.0%), and Management (84.9%), while the most female-oriented occupations are Computers & Mathematics (100.0%), Health Diagnosing & Treating (86.0%), and Education, Arts & Media (78.0%).
| Occupation | Male | Female |
| Management | 231 (84.9%) | 41 (15.1%) |
| Business & Financial | 5 (100.0%) | 0 (0.0%) |
| Computers, Engineering & Science | 32 (69.6%) | 14 (30.4%) |
| Computers & Mathematics | 0 (0.0%) | 2 (100.0%) |
| Architecture & Engineering | 12 (50.0%) | 12 (50.0%) |
| Life, Physical & Social Science | 20 (100.0%) | 0 (0.0%) |
| Community & Social Service | 31 (29.2%) | 75 (70.8%) |
| Education, Arts & Media | 9 (22.0%) | 32 (78.0%) |
| Legal Services & Support | 0 (0.0%) | 0 (0.0%) |
| Education Instruction & Library | 22 (33.9%) | 43 (66.1%) |
| Arts, Media & Entertainment | 0 (0.0%) | 0 (0.0%) |
| Health Diagnosing & Treating | 7 (14.0%) | 43 (86.0%) |
| Health Technologists | 7 (36.8%) | 12 (63.2%) |
| Total (Category) | 306 (63.9%) | 173 (36.1%) |
| Total (Overall) | 804 (56.4%) | 622 (43.6%) |
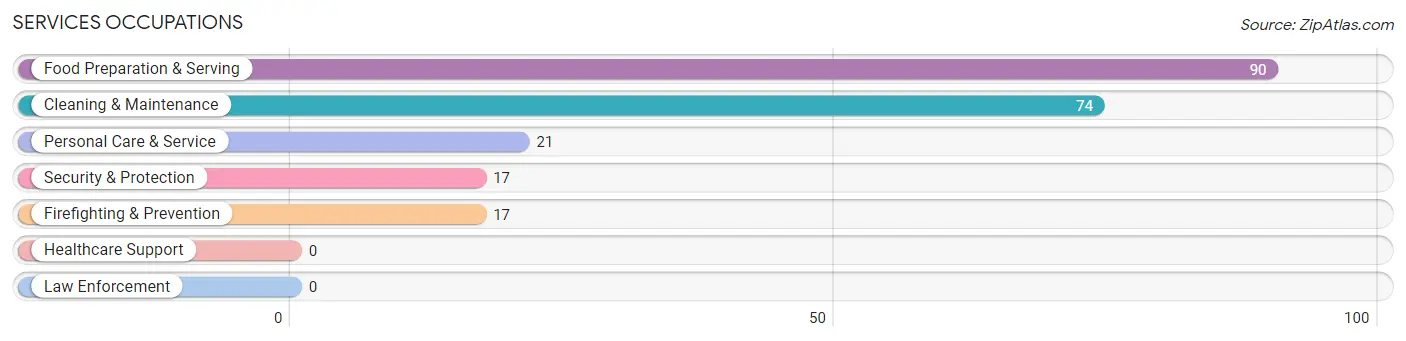
Services Occupations
The most common Services occupations in Fallon County are Food Preparation & Serving (90 | 6.3%), Cleaning & Maintenance (74 | 5.2%), Personal Care & Service (21 | 1.5%), Security & Protection (17 | 1.2%), and Firefighting & Prevention (17 | 1.2%).
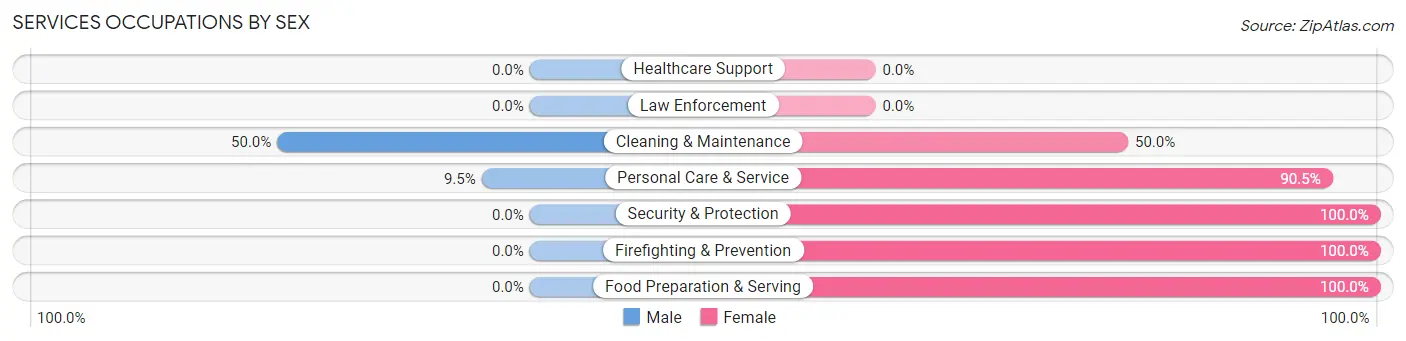
Services Occupations by Sex
Within the Services occupations in Fallon County, the most male-oriented occupations are Cleaning & Maintenance (50.0%), and Personal Care & Service (9.5%), while the most female-oriented occupations are Security & Protection (100.0%), Firefighting & Prevention (100.0%), and Food Preparation & Serving (100.0%).
| Occupation | Male | Female |
| Healthcare Support | 0 (0.0%) | 0 (0.0%) |
| Security & Protection | 0 (0.0%) | 17 (100.0%) |
| Firefighting & Prevention | 0 (0.0%) | 17 (100.0%) |
| Law Enforcement | 0 (0.0%) | 0 (0.0%) |
| Food Preparation & Serving | 0 (0.0%) | 90 (100.0%) |
| Cleaning & Maintenance | 37 (50.0%) | 37 (50.0%) |
| Personal Care & Service | 2 (9.5%) | 19 (90.5%) |
| Total (Category) | 39 (19.3%) | 163 (80.7%) |
| Total (Overall) | 804 (56.4%) | 622 (43.6%) |
Sales and Office Occupations
The most common Sales and Office occupations in Fallon County are Office & Administration (166 | 11.6%), and Sales & Related (58 | 4.1%).

Sales and Office Occupations by Sex

| Occupation | Male | Female |
| Sales & Related | 35 (60.3%) | 23 (39.7%) |
| Office & Administration | 9 (5.4%) | 157 (94.6%) |
| Total (Category) | 44 (19.6%) | 180 (80.4%) |
| Total (Overall) | 804 (56.4%) | 622 (43.6%) |
Natural Resources, Construction and Maintenance Occupations
The most common Natural Resources, Construction and Maintenance occupations in Fallon County are Construction & Extraction (264 | 18.5%), Installation, Maintenance & Repair (93 | 6.5%), and Farming, Fishing & Forestry (19 | 1.3%).
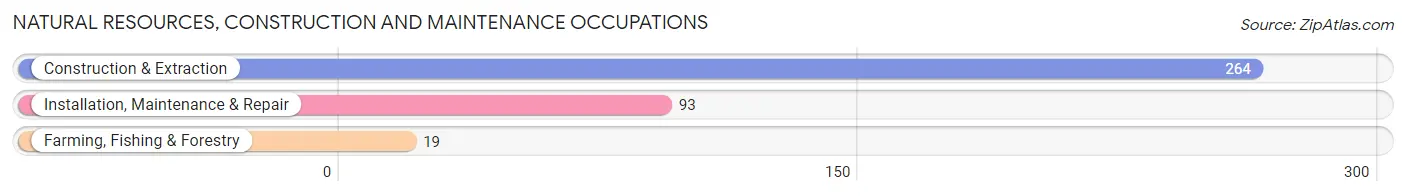
Natural Resources, Construction and Maintenance Occupations by Sex

| Occupation | Male | Female |
| Farming, Fishing & Forestry | 19 (100.0%) | 0 (0.0%) |
| Construction & Extraction | 235 (89.0%) | 29 (11.0%) |
| Installation, Maintenance & Repair | 70 (75.3%) | 23 (24.7%) |
| Total (Category) | 324 (86.2%) | 52 (13.8%) |
| Total (Overall) | 804 (56.4%) | 622 (43.6%) |
Production, Transportation and Moving Occupations
The most common Production, Transportation and Moving occupations in Fallon County are Production (91 | 6.4%), Transportation (30 | 2.1%), and Material Moving (24 | 1.7%).
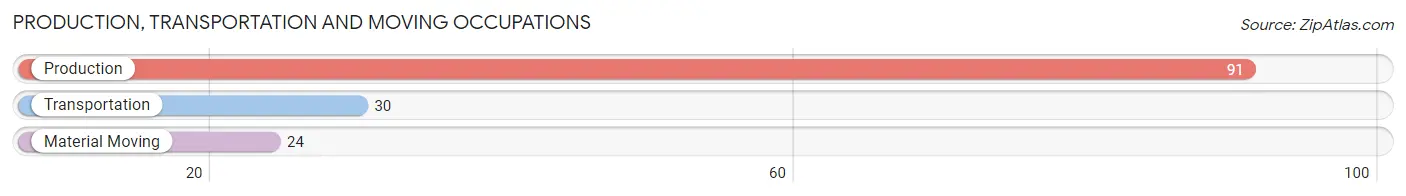
Production, Transportation and Moving Occupations by Sex
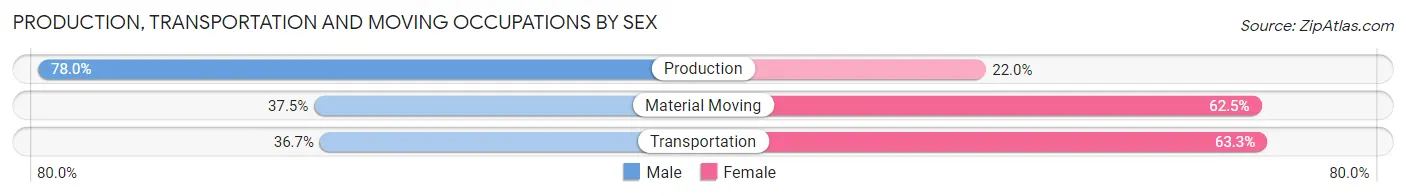
| Occupation | Male | Female |
| Production | 71 (78.0%) | 20 (22.0%) |
| Transportation | 11 (36.7%) | 19 (63.3%) |
| Material Moving | 9 (37.5%) | 15 (62.5%) |
| Total (Category) | 91 (62.8%) | 54 (37.2%) |
| Total (Overall) | 804 (56.4%) | 622 (43.6%) |
Employment Industries by Sex in Fallon County
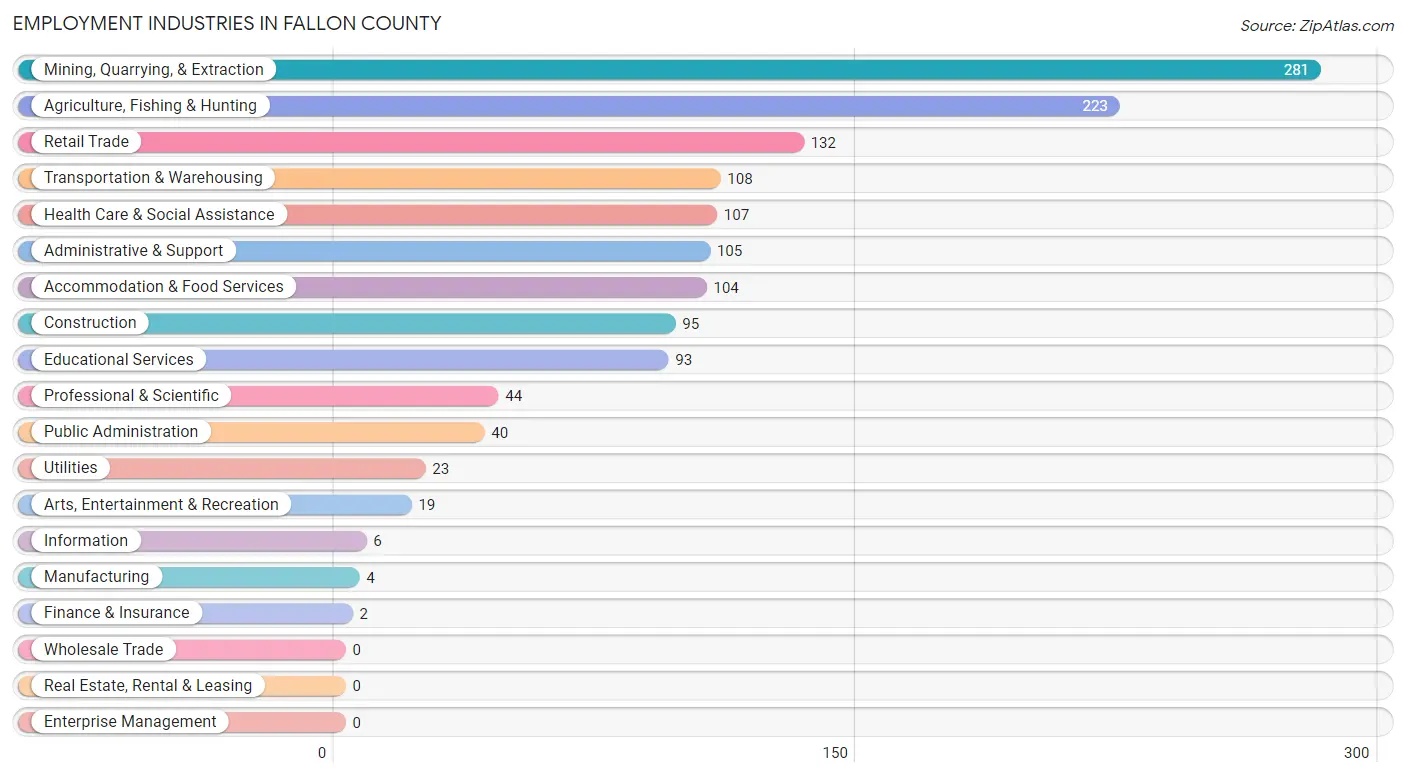
Employment Industries in Fallon County
The major employment industries in Fallon County include Mining, Quarrying, & Extraction (281 | 19.7%), Agriculture, Fishing & Hunting (223 | 15.6%), Retail Trade (132 | 9.3%), Transportation & Warehousing (108 | 7.6%), and Health Care & Social Assistance (107 | 7.5%).
Employment Industries by Sex in Fallon County
The Fallon County industries that see more men than women are Manufacturing (100.0%), Utilities (100.0%), and Information (100.0%), whereas the industries that tend to have a higher number of women are Finance & Insurance (100.0%), Health Care & Social Assistance (100.0%), and Arts, Entertainment & Recreation (100.0%).
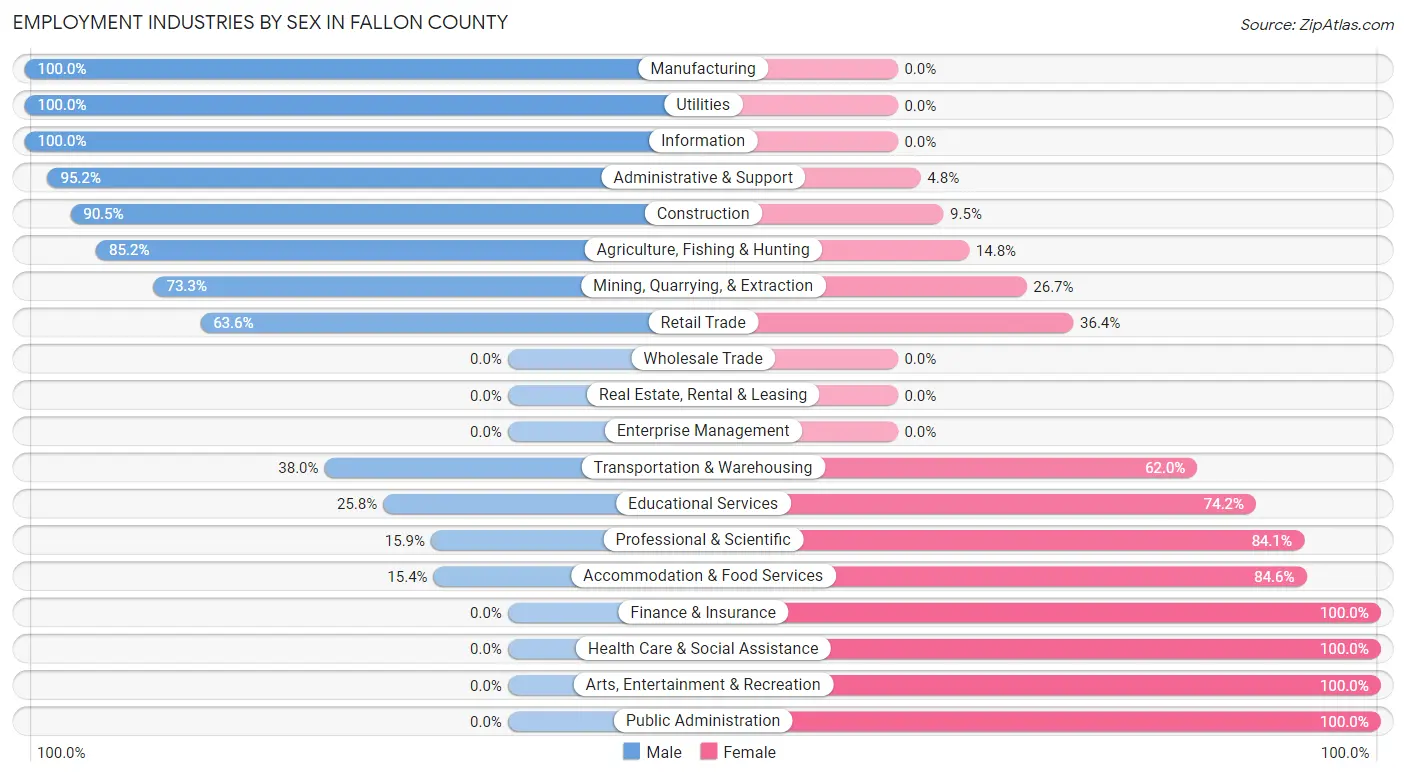
| Industry | Male | Female |
| Agriculture, Fishing & Hunting | 190 (85.2%) | 33 (14.8%) |
| Mining, Quarrying, & Extraction | 206 (73.3%) | 75 (26.7%) |
| Construction | 86 (90.5%) | 9 (9.5%) |
| Manufacturing | 4 (100.0%) | 0 (0.0%) |
| Wholesale Trade | 0 (0.0%) | 0 (0.0%) |
| Retail Trade | 84 (63.6%) | 48 (36.4%) |
| Transportation & Warehousing | 41 (38.0%) | 67 (62.0%) |
| Utilities | 23 (100.0%) | 0 (0.0%) |
| Information | 6 (100.0%) | 0 (0.0%) |
| Finance & Insurance | 0 (0.0%) | 2 (100.0%) |
| Real Estate, Rental & Leasing | 0 (0.0%) | 0 (0.0%) |
| Professional & Scientific | 7 (15.9%) | 37 (84.1%) |
| Enterprise Management | 0 (0.0%) | 0 (0.0%) |
| Administrative & Support | 100 (95.2%) | 5 (4.8%) |
| Educational Services | 24 (25.8%) | 69 (74.2%) |
| Health Care & Social Assistance | 0 (0.0%) | 107 (100.0%) |
| Arts, Entertainment & Recreation | 0 (0.0%) | 19 (100.0%) |
| Accommodation & Food Services | 16 (15.4%) | 88 (84.6%) |
| Public Administration | 0 (0.0%) | 40 (100.0%) |
| Total | 804 (56.4%) | 622 (43.6%) |
Education in Fallon County
School Enrollment in Fallon County
The most common levels of schooling among the 626 students in Fallon County are middle school (215 | 34.4%), elementary school (209 | 33.4%), and high school (134 | 21.4%).
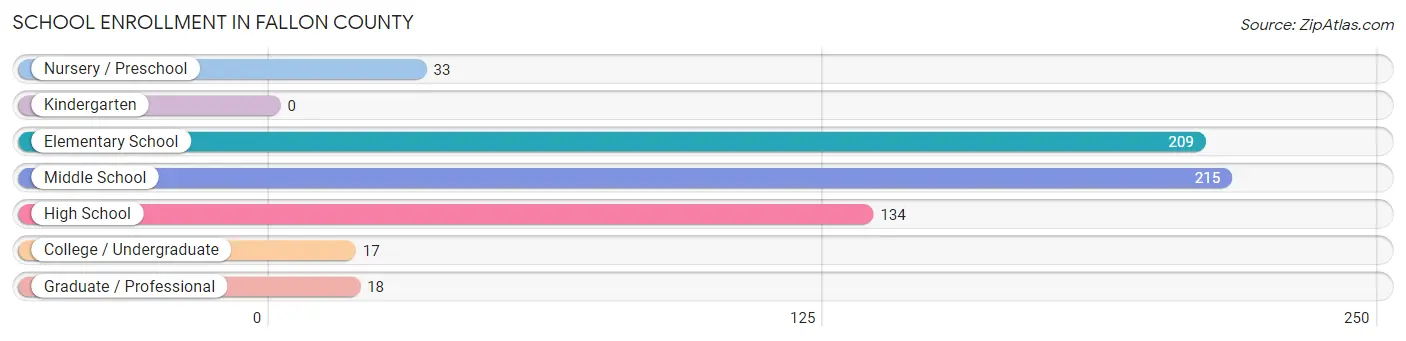
| School Level | # Students | % Students |
| Nursery / Preschool | 33 | 5.3% |
| Kindergarten | 0 | 0.0% |
| Elementary School | 209 | 33.4% |
| Middle School | 215 | 34.4% |
| High School | 134 | 21.4% |
| College / Undergraduate | 17 | 2.7% |
| Graduate / Professional | 18 | 2.9% |
| Total | 626 | 100.0% |
School Enrollment by Age by Funding Source in Fallon County
Out of a total of 626 students who are enrolled in schools in Fallon County, 58 (9.3%) attend a private institution, while the remaining 568 (90.7%) are enrolled in public schools. The age group of 25 to 34 year olds has the highest likelihood of being enrolled in private schools, with 7 (100.0% in the age bracket) enrolled. Conversely, the age group of 3 to 4 year olds has the lowest likelihood of being enrolled in a private school, with 17 (100.0% in the age bracket) attending a public institution.
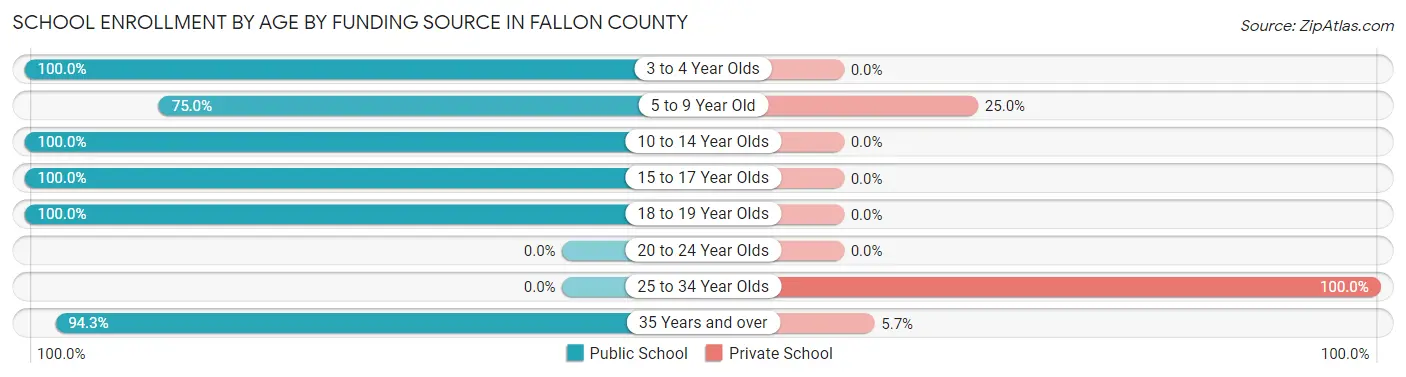
| Age Bracket | Public School | Private School |
| 3 to 4 Year Olds | 17 (100.0%) | 0 (0.0%) |
| 5 to 9 Year Old | 147 (75.0%) | 49 (25.0%) |
| 10 to 14 Year Olds | 244 (100.0%) | 0 (0.0%) |
| 15 to 17 Year Olds | 117 (100.0%) | 0 (0.0%) |
| 18 to 19 Year Olds | 10 (100.0%) | 0 (0.0%) |
| 20 to 24 Year Olds | 0 (0.0%) | 0 (0.0%) |
| 25 to 34 Year Olds | 0 (0.0%) | 7 (100.0%) |
| 35 Years and over | 33 (94.3%) | 2 (5.7%) |
| Total | 568 (90.7%) | 58 (9.3%) |
Educational Attainment by Field of Study in Fallon County
Bio, nature & agricultural (117 | 27.9%), education (102 | 24.3%), business (85 | 20.2%), social sciences (37 | 8.8%), and science & technology (31 | 7.4%) are the most common fields of study among 420 individuals in Fallon County who have obtained a bachelor's degree or higher.
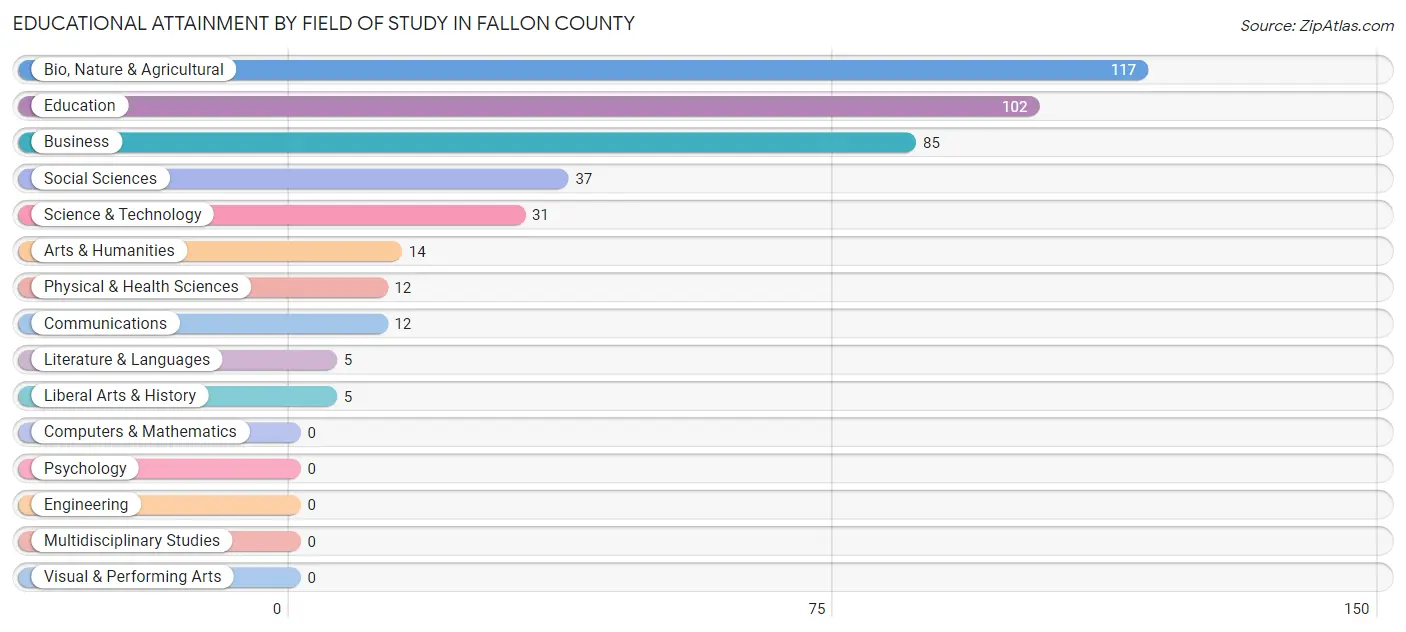
| Field of Study | # Graduates | % Graduates |
| Computers & Mathematics | 0 | 0.0% |
| Bio, Nature & Agricultural | 117 | 27.9% |
| Physical & Health Sciences | 12 | 2.9% |
| Psychology | 0 | 0.0% |
| Social Sciences | 37 | 8.8% |
| Engineering | 0 | 0.0% |
| Multidisciplinary Studies | 0 | 0.0% |
| Science & Technology | 31 | 7.4% |
| Business | 85 | 20.2% |
| Education | 102 | 24.3% |
| Literature & Languages | 5 | 1.2% |
| Liberal Arts & History | 5 | 1.2% |
| Visual & Performing Arts | 0 | 0.0% |
| Communications | 12 | 2.9% |
| Arts & Humanities | 14 | 3.3% |
| Total | 420 | 100.0% |
Transportation & Commute in Fallon County
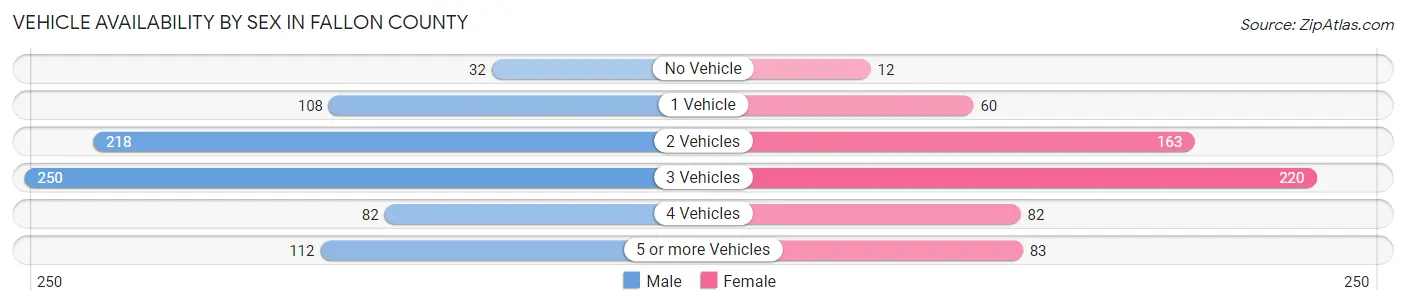
Vehicle Availability by Sex in Fallon County
The most prevalent vehicle ownership categories in Fallon County are males with 3 vehicles (250, accounting for 31.2%) and females with 3 vehicles (220, making up 40.3%).
| Vehicles Available | Male | Female |
| No Vehicle | 32 (4.0%) | 12 (1.9%) |
| 1 Vehicle | 108 (13.5%) | 60 (9.7%) |
| 2 Vehicles | 218 (27.2%) | 163 (26.3%) |
| 3 Vehicles | 250 (31.2%) | 220 (35.5%) |
| 4 Vehicles | 82 (10.2%) | 82 (13.2%) |
| 5 or more Vehicles | 112 (14.0%) | 83 (13.4%) |
| Total | 802 (100.0%) | 620 (100.0%) |
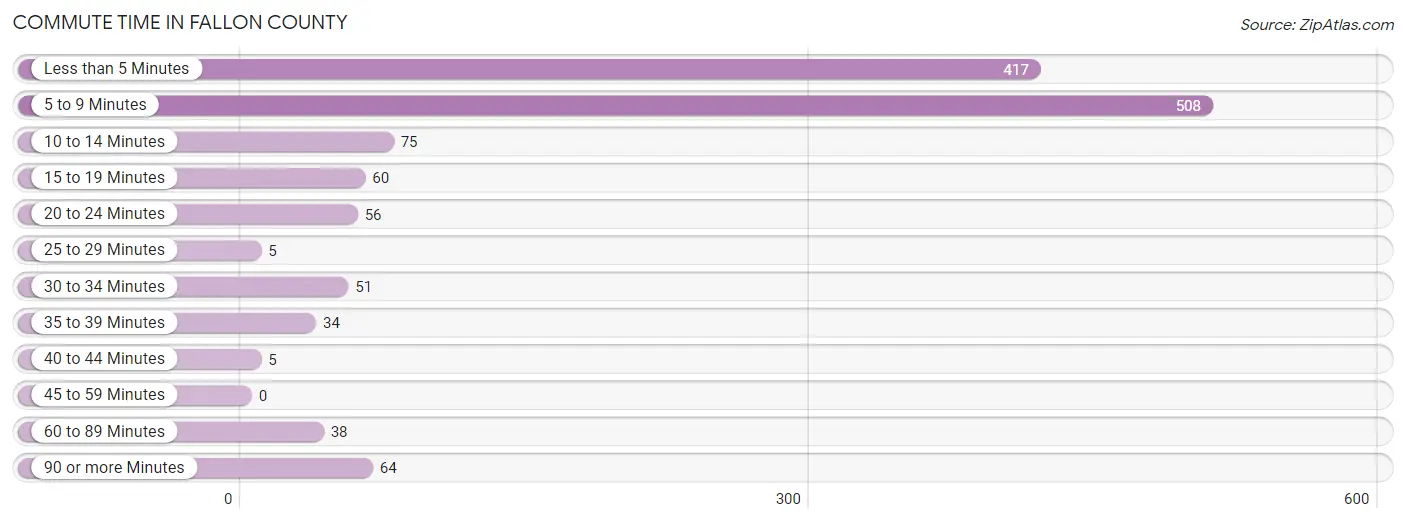
Commute Time in Fallon County
The most frequently occuring commute durations in Fallon County are 5 to 9 minutes (508 commuters, 38.7%), less than 5 minutes (417 commuters, 31.8%), and 10 to 14 minutes (75 commuters, 5.7%).
| Commute Time | # Commuters | % Commuters |
| Less than 5 Minutes | 417 | 31.8% |
| 5 to 9 Minutes | 508 | 38.7% |
| 10 to 14 Minutes | 75 | 5.7% |
| 15 to 19 Minutes | 60 | 4.6% |
| 20 to 24 Minutes | 56 | 4.3% |
| 25 to 29 Minutes | 5 | 0.4% |
| 30 to 34 Minutes | 51 | 3.9% |
| 35 to 39 Minutes | 34 | 2.6% |
| 40 to 44 Minutes | 5 | 0.4% |
| 45 to 59 Minutes | 0 | 0.0% |
| 60 to 89 Minutes | 38 | 2.9% |
| 90 or more Minutes | 64 | 4.9% |
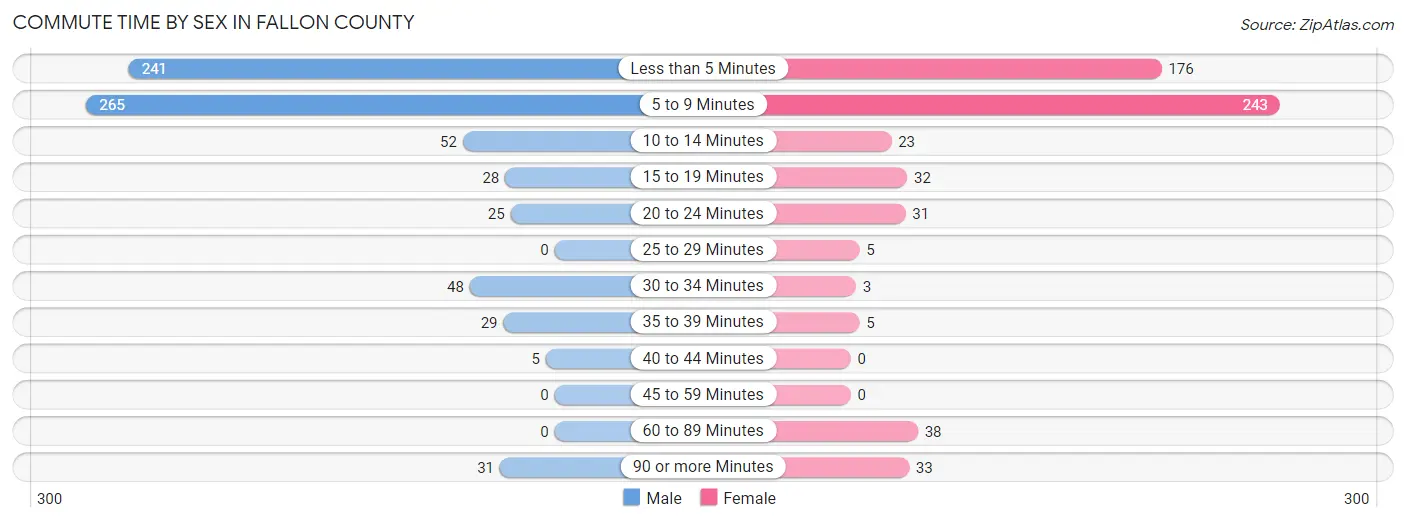
Commute Time by Sex in Fallon County
The most common commute times in Fallon County are 5 to 9 minutes (265 commuters, 36.6%) for males and 5 to 9 minutes (243 commuters, 41.3%) for females.
| Commute Time | Male | Female |
| Less than 5 Minutes | 241 (33.3%) | 176 (29.9%) |
| 5 to 9 Minutes | 265 (36.6%) | 243 (41.3%) |
| 10 to 14 Minutes | 52 (7.2%) | 23 (3.9%) |
| 15 to 19 Minutes | 28 (3.9%) | 32 (5.4%) |
| 20 to 24 Minutes | 25 (3.5%) | 31 (5.3%) |
| 25 to 29 Minutes | 0 (0.0%) | 5 (0.9%) |
| 30 to 34 Minutes | 48 (6.6%) | 3 (0.5%) |
| 35 to 39 Minutes | 29 (4.0%) | 5 (0.9%) |
| 40 to 44 Minutes | 5 (0.7%) | 0 (0.0%) |
| 45 to 59 Minutes | 0 (0.0%) | 0 (0.0%) |
| 60 to 89 Minutes | 0 (0.0%) | 38 (6.5%) |
| 90 or more Minutes | 31 (4.3%) | 33 (5.6%) |
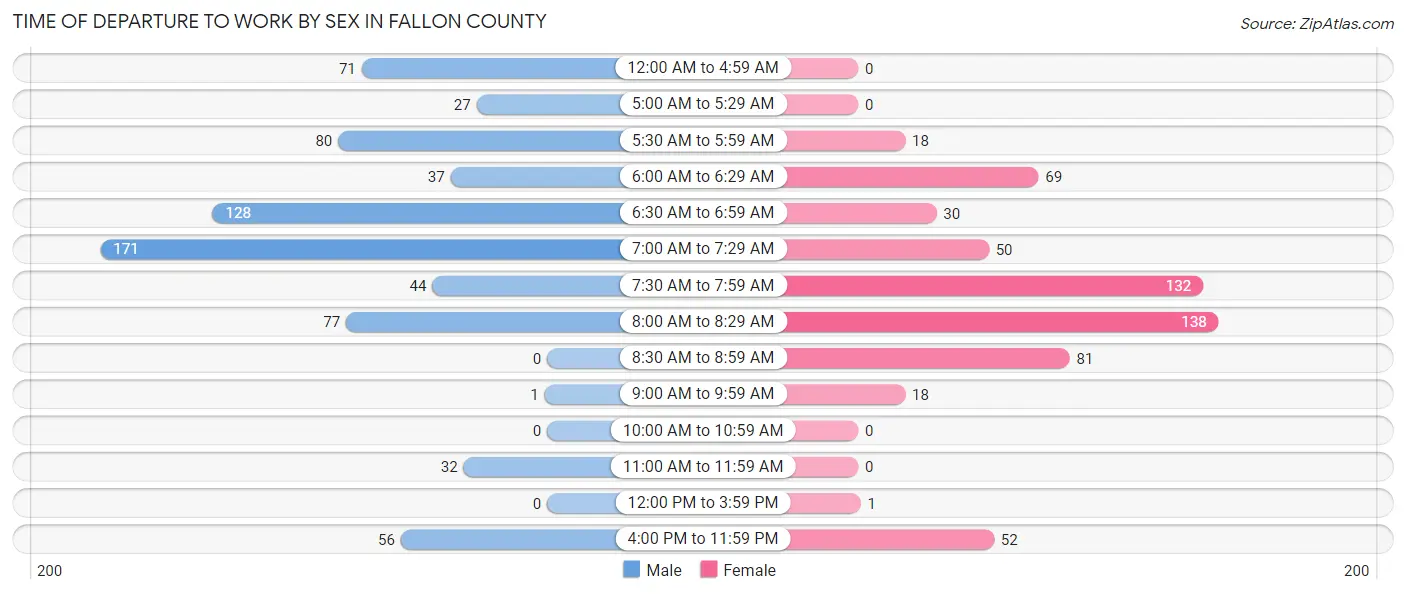
Time of Departure to Work by Sex in Fallon County
The most frequent times of departure to work in Fallon County are 7:00 AM to 7:29 AM (171, 23.6%) for males and 8:00 AM to 8:29 AM (138, 23.4%) for females.
| Time of Departure | Male | Female |
| 12:00 AM to 4:59 AM | 71 (9.8%) | 0 (0.0%) |
| 5:00 AM to 5:29 AM | 27 (3.7%) | 0 (0.0%) |
| 5:30 AM to 5:59 AM | 80 (11.1%) | 18 (3.1%) |
| 6:00 AM to 6:29 AM | 37 (5.1%) | 69 (11.7%) |
| 6:30 AM to 6:59 AM | 128 (17.7%) | 30 (5.1%) |
| 7:00 AM to 7:29 AM | 171 (23.6%) | 50 (8.5%) |
| 7:30 AM to 7:59 AM | 44 (6.1%) | 132 (22.4%) |
| 8:00 AM to 8:29 AM | 77 (10.6%) | 138 (23.4%) |
| 8:30 AM to 8:59 AM | 0 (0.0%) | 81 (13.8%) |
| 9:00 AM to 9:59 AM | 1 (0.1%) | 18 (3.1%) |
| 10:00 AM to 10:59 AM | 0 (0.0%) | 0 (0.0%) |
| 11:00 AM to 11:59 AM | 32 (4.4%) | 0 (0.0%) |
| 12:00 PM to 3:59 PM | 0 (0.0%) | 1 (0.2%) |
| 4:00 PM to 11:59 PM | 56 (7.7%) | 52 (8.8%) |
| Total | 724 (100.0%) | 589 (100.0%) |
Housing Occupancy in Fallon County
Occupancy by Ownership in Fallon County
Of the total 1,164 dwellings in Fallon County, owner-occupied units account for 839 (72.1%), while renter-occupied units make up 325 (27.9%).
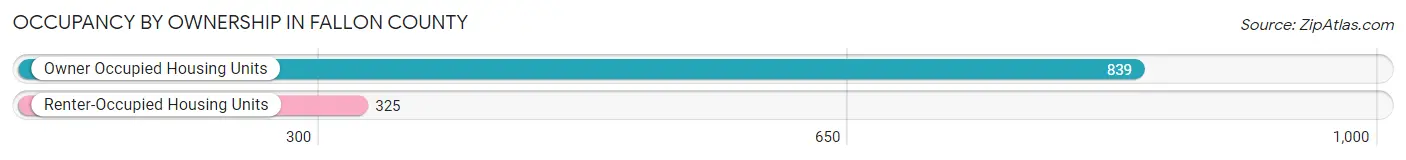
| Occupancy | # Housing Units | % Housing Units |
| Owner Occupied Housing Units | 839 | 72.1% |
| Renter-Occupied Housing Units | 325 | 27.9% |
| Total Occupied Housing Units | 1,164 | 100.0% |
Occupancy by Household Size in Fallon County
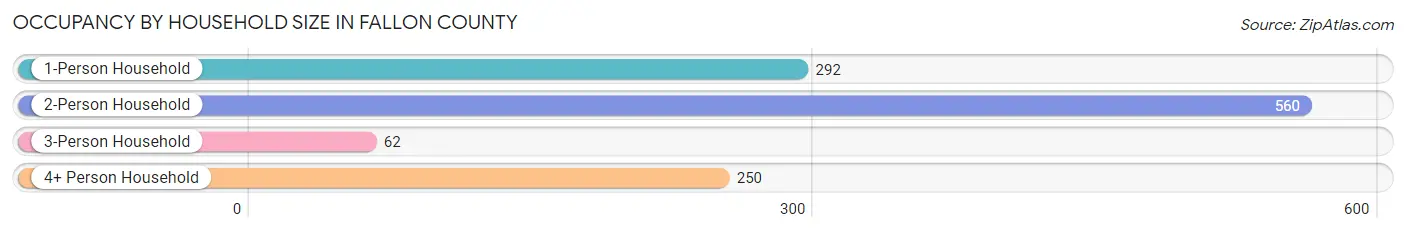
| Household Size | # Housing Units | % Housing Units |
| 1-Person Household | 292 | 25.1% |
| 2-Person Household | 560 | 48.1% |
| 3-Person Household | 62 | 5.3% |
| 4+ Person Household | 250 | 21.5% |
| Total Housing Units | 1,164 | 100.0% |
Occupancy by Ownership by Household Size in Fallon County
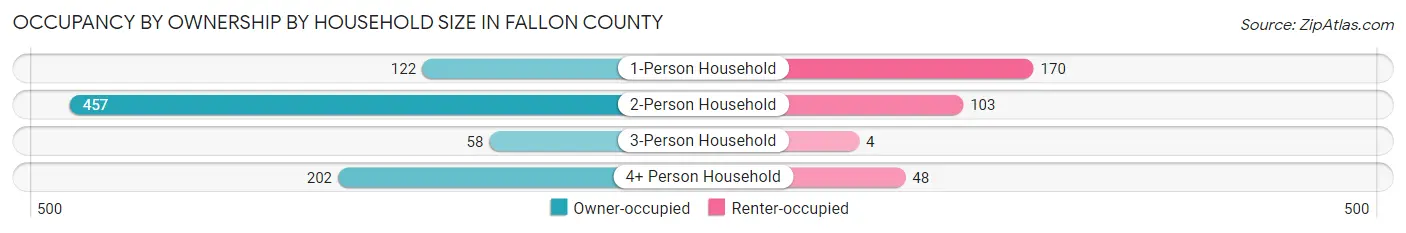
| Household Size | Owner-occupied | Renter-occupied |
| 1-Person Household | 122 (41.8%) | 170 (58.2%) |
| 2-Person Household | 457 (81.6%) | 103 (18.4%) |
| 3-Person Household | 58 (93.5%) | 4 (6.5%) |
| 4+ Person Household | 202 (80.8%) | 48 (19.2%) |
| Total Housing Units | 839 (72.1%) | 325 (27.9%) |
Occupancy by Educational Attainment in Fallon County
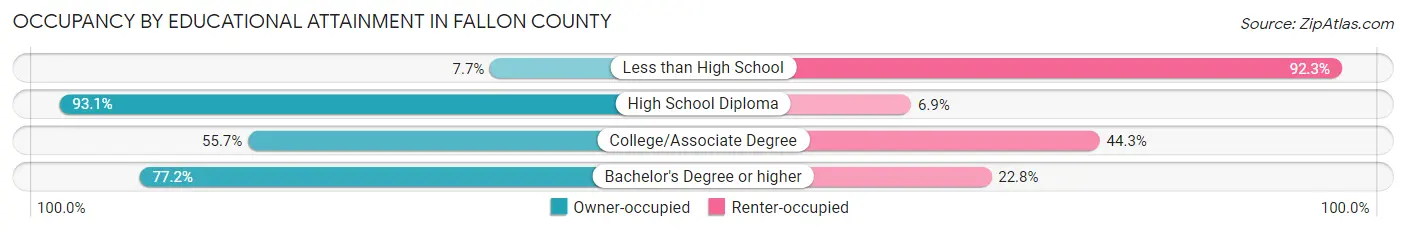
| Household Size | Owner-occupied | Renter-occupied |
| Less than High School | 2 (7.7%) | 24 (92.3%) |
| High School Diploma | 377 (93.1%) | 28 (6.9%) |
| College/Associate Degree | 274 (55.7%) | 218 (44.3%) |
| Bachelor's Degree or higher | 186 (77.2%) | 55 (22.8%) |
Occupancy by Age of Householder in Fallon County
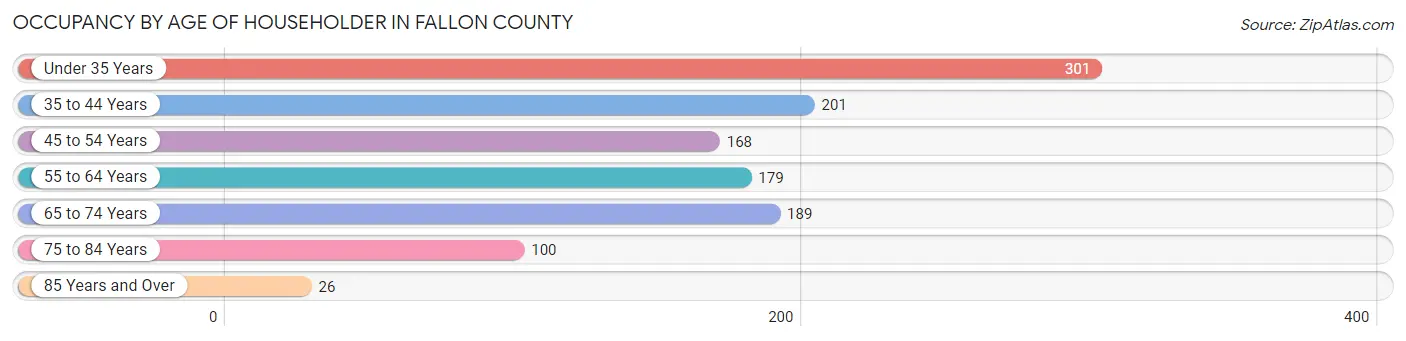
| Age Bracket | # Households | % Households |
| Under 35 Years | 301 | 25.9% |
| 35 to 44 Years | 201 | 17.3% |
| 45 to 54 Years | 168 | 14.4% |
| 55 to 64 Years | 179 | 15.4% |
| 65 to 74 Years | 189 | 16.2% |
| 75 to 84 Years | 100 | 8.6% |
| 85 Years and Over | 26 | 2.2% |
| Total | 1,164 | 100.0% |
Housing Finances in Fallon County
Median Income by Occupancy in Fallon County
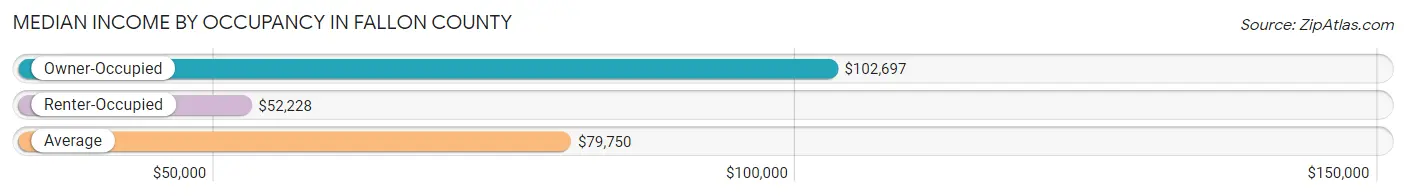
| Occupancy Type | # Households | Median Income |
| Owner-Occupied | 839 (72.1%) | $102,697 |
| Renter-Occupied | 325 (27.9%) | $52,228 |
| Average | 1,164 (100.0%) | $79,750 |
Occupancy by Householder Income Bracket in Fallon County
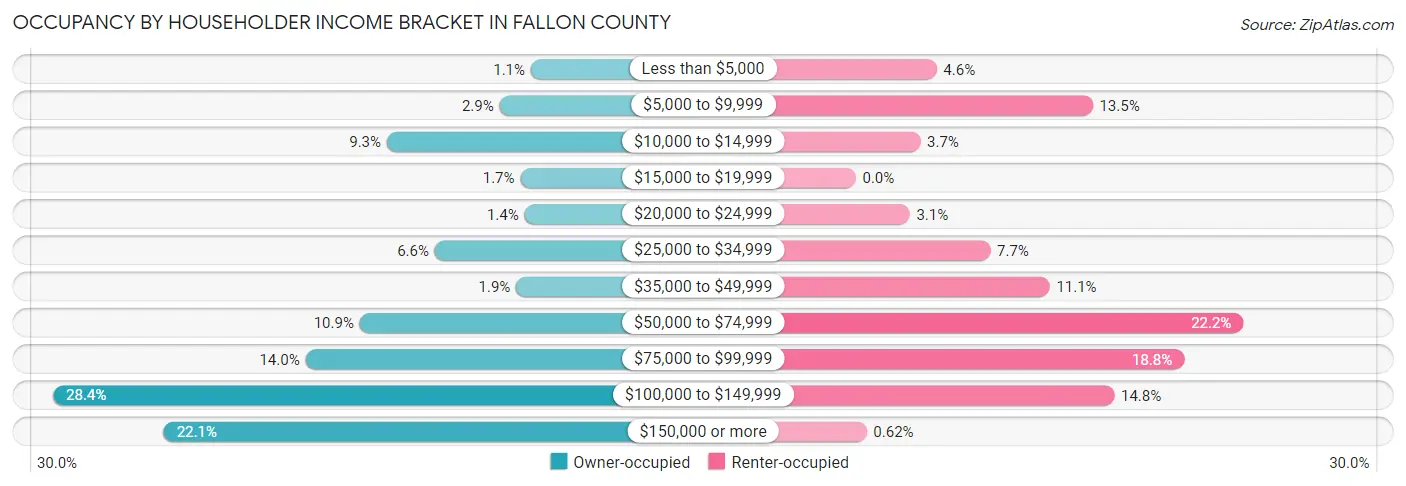
| Income Bracket | Owner-occupied | Renter-occupied |
| Less than $5,000 | 9 (1.1%) | 15 (4.6%) |
| $5,000 to $9,999 | 24 (2.9%) | 44 (13.5%) |
| $10,000 to $14,999 | 78 (9.3%) | 12 (3.7%) |
| $15,000 to $19,999 | 14 (1.7%) | 0 (0.0%) |
| $20,000 to $24,999 | 12 (1.4%) | 10 (3.1%) |
| $25,000 to $34,999 | 55 (6.6%) | 25 (7.7%) |
| $35,000 to $49,999 | 16 (1.9%) | 36 (11.1%) |
| $50,000 to $74,999 | 91 (10.8%) | 72 (22.2%) |
| $75,000 to $99,999 | 117 (14.0%) | 61 (18.8%) |
| $100,000 to $149,999 | 238 (28.4%) | 48 (14.8%) |
| $150,000 or more | 185 (22.1%) | 2 (0.6%) |
| Total | 839 (100.0%) | 325 (100.0%) |
Monthly Housing Cost Tiers in Fallon County
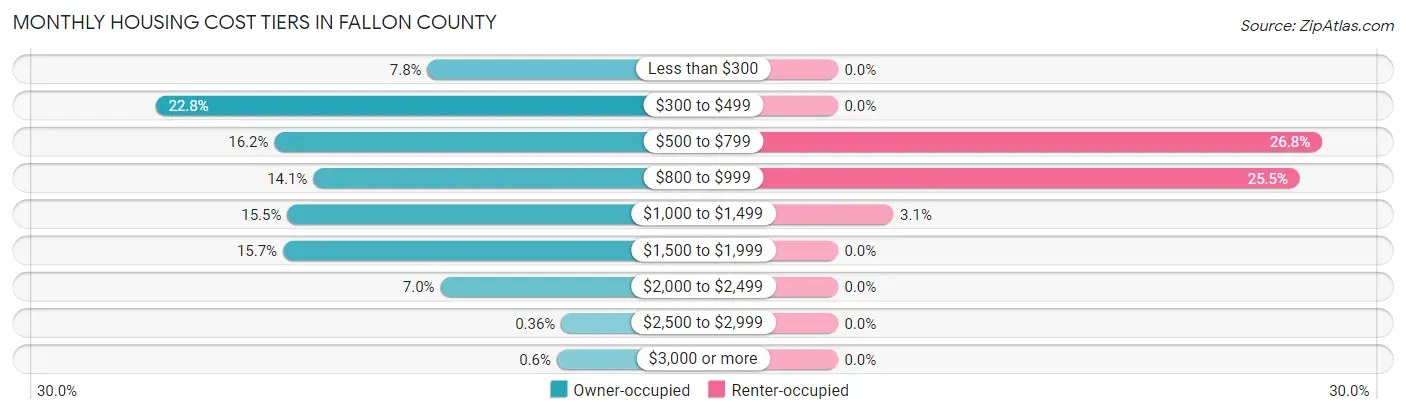
| Monthly Cost | Owner-occupied | Renter-occupied |
| Less than $300 | 65 (7.7%) | 0 (0.0%) |
| $300 to $499 | 191 (22.8%) | 0 (0.0%) |
| $500 to $799 | 136 (16.2%) | 87 (26.8%) |
| $800 to $999 | 118 (14.1%) | 83 (25.5%) |
| $1,000 to $1,499 | 130 (15.5%) | 10 (3.1%) |
| $1,500 to $1,999 | 132 (15.7%) | 0 (0.0%) |
| $2,000 to $2,499 | 59 (7.0%) | 0 (0.0%) |
| $2,500 to $2,999 | 3 (0.4%) | 0 (0.0%) |
| $3,000 or more | 5 (0.6%) | 0 (0.0%) |
| Total | 839 (100.0%) | 325 (100.0%) |
Physical Housing Characteristics in Fallon County
Housing Structures in Fallon County
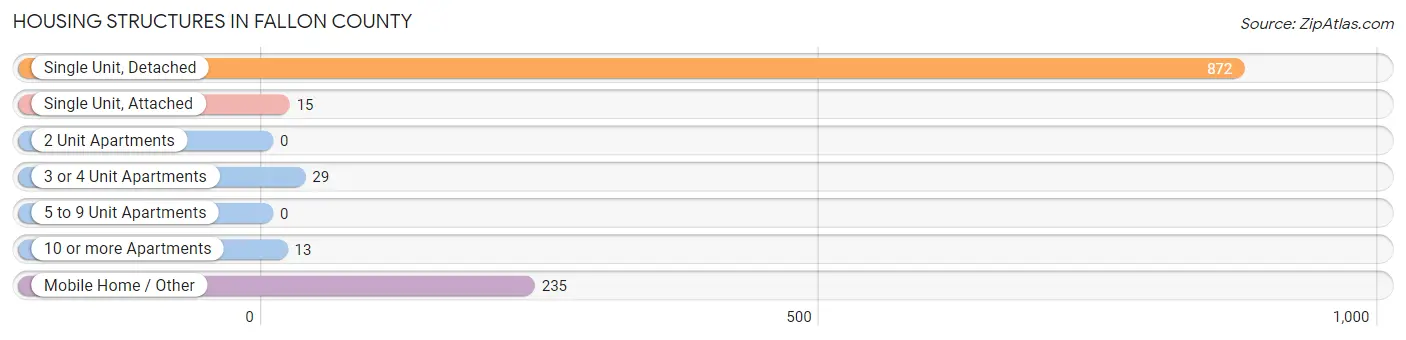
| Structure Type | # Housing Units | % Housing Units |
| Single Unit, Detached | 872 | 74.9% |
| Single Unit, Attached | 15 | 1.3% |
| 2 Unit Apartments | 0 | 0.0% |
| 3 or 4 Unit Apartments | 29 | 2.5% |
| 5 to 9 Unit Apartments | 0 | 0.0% |
| 10 or more Apartments | 13 | 1.1% |
| Mobile Home / Other | 235 | 20.2% |
| Total | 1,164 | 100.0% |
Housing Structures by Occupancy in Fallon County
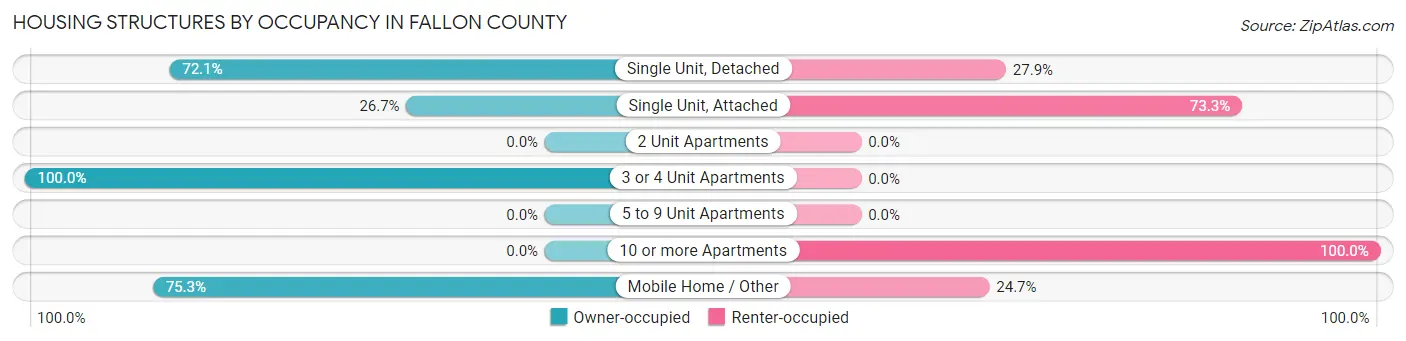
| Structure Type | Owner-occupied | Renter-occupied |
| Single Unit, Detached | 629 (72.1%) | 243 (27.9%) |
| Single Unit, Attached | 4 (26.7%) | 11 (73.3%) |
| 2 Unit Apartments | 0 (0.0%) | 0 (0.0%) |
| 3 or 4 Unit Apartments | 29 (100.0%) | 0 (0.0%) |
| 5 to 9 Unit Apartments | 0 (0.0%) | 0 (0.0%) |
| 10 or more Apartments | 0 (0.0%) | 13 (100.0%) |
| Mobile Home / Other | 177 (75.3%) | 58 (24.7%) |
| Total | 839 (72.1%) | 325 (27.9%) |
Housing Structures by Number of Rooms in Fallon County
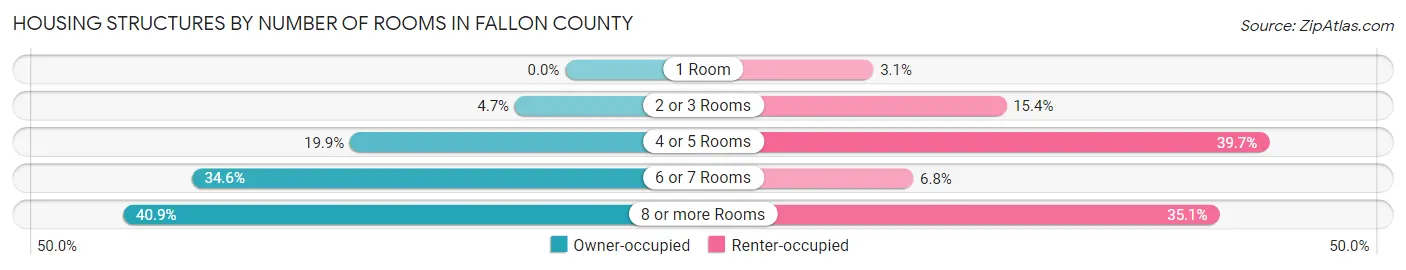
| Number of Rooms | Owner-occupied | Renter-occupied |
| 1 Room | 0 (0.0%) | 10 (3.1%) |
| 2 or 3 Rooms | 39 (4.6%) | 50 (15.4%) |
| 4 or 5 Rooms | 167 (19.9%) | 129 (39.7%) |
| 6 or 7 Rooms | 290 (34.6%) | 22 (6.8%) |
| 8 or more Rooms | 343 (40.9%) | 114 (35.1%) |
| Total | 839 (100.0%) | 325 (100.0%) |
Housing Structure by Heating Type in Fallon County
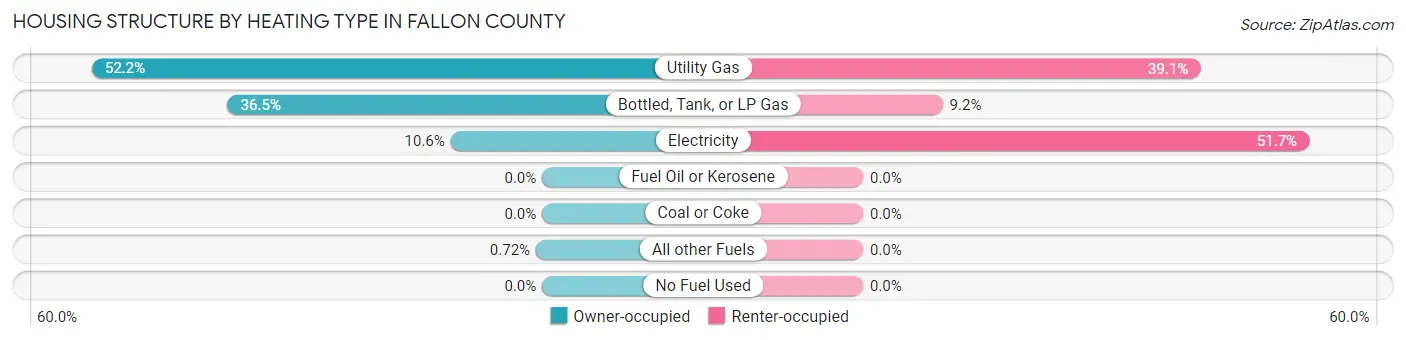
| Heating Type | Owner-occupied | Renter-occupied |
| Utility Gas | 438 (52.2%) | 127 (39.1%) |
| Bottled, Tank, or LP Gas | 306 (36.5%) | 30 (9.2%) |
| Electricity | 89 (10.6%) | 168 (51.7%) |
| Fuel Oil or Kerosene | 0 (0.0%) | 0 (0.0%) |
| Coal or Coke | 0 (0.0%) | 0 (0.0%) |
| All other Fuels | 6 (0.7%) | 0 (0.0%) |
| No Fuel Used | 0 (0.0%) | 0 (0.0%) |
| Total | 839 (100.0%) | 325 (100.0%) |
Household Vehicle Usage in Fallon County
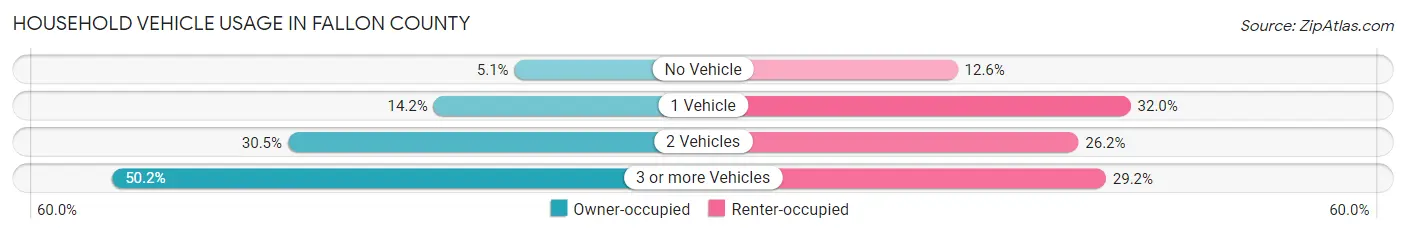
| Vehicles per Household | Owner-occupied | Renter-occupied |
| No Vehicle | 43 (5.1%) | 41 (12.6%) |
| 1 Vehicle | 119 (14.2%) | 104 (32.0%) |
| 2 Vehicles | 256 (30.5%) | 85 (26.2%) |
| 3 or more Vehicles | 421 (50.2%) | 95 (29.2%) |
| Total | 839 (100.0%) | 325 (100.0%) |
Real Estate & Mortgages in Fallon County
Real Estate and Mortgage Overview in Fallon County
| Characteristic | Without Mortgage | With Mortgage |
| Housing Units | 502 | 337 |
| Median Property Value | $237,300 | $226,300 |
| Median Household Income | $84,167 | $80 |
| Monthly Housing Costs | $528 | $5 |
| Real Estate Taxes | $1,250 | $0 |
Property Value by Mortgage Status in Fallon County
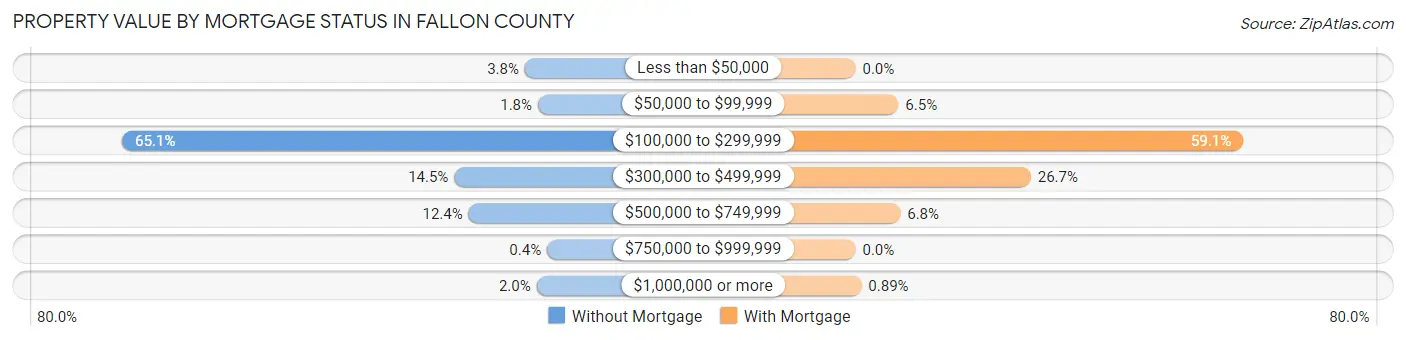
| Property Value | Without Mortgage | With Mortgage |
| Less than $50,000 | 19 (3.8%) | 0 (0.0%) |
| $50,000 to $99,999 | 9 (1.8%) | 22 (6.5%) |
| $100,000 to $299,999 | 327 (65.1%) | 199 (59.1%) |
| $300,000 to $499,999 | 73 (14.5%) | 90 (26.7%) |
| $500,000 to $749,999 | 62 (12.3%) | 23 (6.8%) |
| $750,000 to $999,999 | 2 (0.4%) | 0 (0.0%) |
| $1,000,000 or more | 10 (2.0%) | 3 (0.9%) |
| Total | 502 (100.0%) | 337 (100.0%) |
Household Income by Mortgage Status in Fallon County
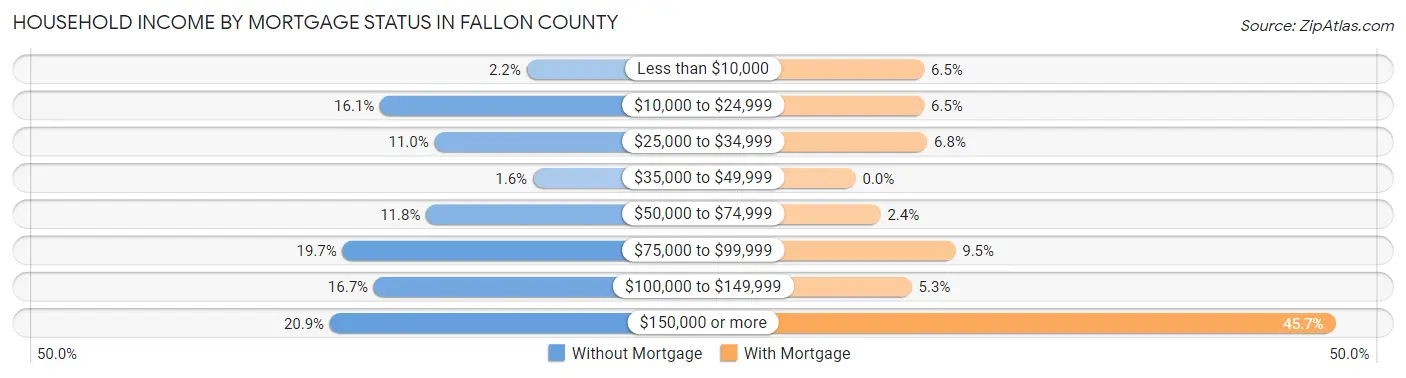
| Household Income | Without Mortgage | With Mortgage |
| Less than $10,000 | 11 (2.2%) | 22 (6.5%) |
| $10,000 to $24,999 | 81 (16.1%) | 22 (6.5%) |
| $25,000 to $34,999 | 55 (11.0%) | 23 (6.8%) |
| $35,000 to $49,999 | 8 (1.6%) | 0 (0.0%) |
| $50,000 to $74,999 | 59 (11.7%) | 8 (2.4%) |
| $75,000 to $99,999 | 99 (19.7%) | 32 (9.5%) |
| $100,000 to $149,999 | 84 (16.7%) | 18 (5.3%) |
| $150,000 or more | 105 (20.9%) | 154 (45.7%) |
| Total | 502 (100.0%) | 337 (100.0%) |
Property Value to Household Income Ratio in Fallon County
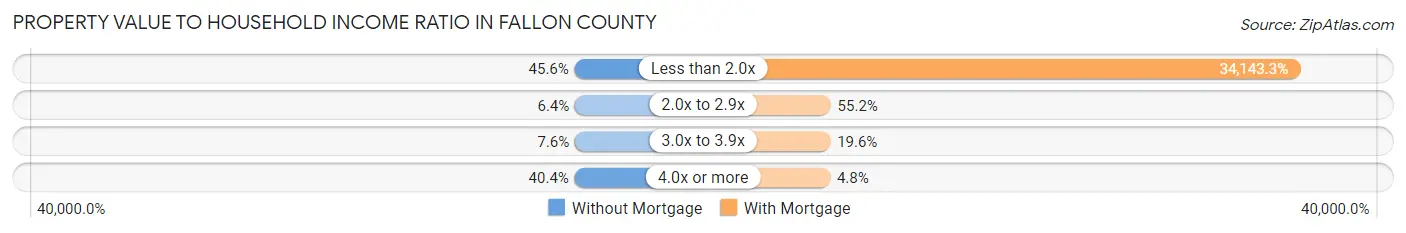
| Value-to-Income Ratio | Without Mortgage | With Mortgage |
| Less than 2.0x | 229 (45.6%) | 115,063 (34,143.3%) |
| 2.0x to 2.9x | 32 (6.4%) | 186 (55.2%) |
| 3.0x to 3.9x | 38 (7.6%) | 66 (19.6%) |
| 4.0x or more | 203 (40.4%) | 16 (4.8%) |
| Total | 502 (100.0%) | 337 (100.0%) |
Real Estate Taxes by Mortgage Status in Fallon County
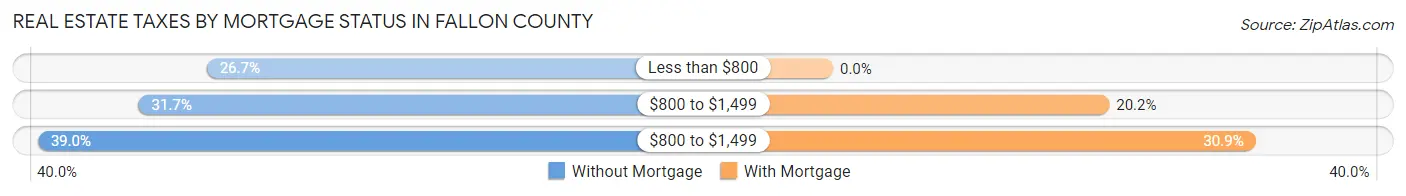
| Property Taxes | Without Mortgage | With Mortgage |
| Less than $800 | 134 (26.7%) | 0 (0.0%) |
| $800 to $1,499 | 159 (31.7%) | 68 (20.2%) |
| $800 to $1,499 | 196 (39.0%) | 104 (30.9%) |
| Total | 502 (100.0%) | 337 (100.0%) |
Health & Disability in Fallon County
Health Insurance Coverage by Age in Fallon County
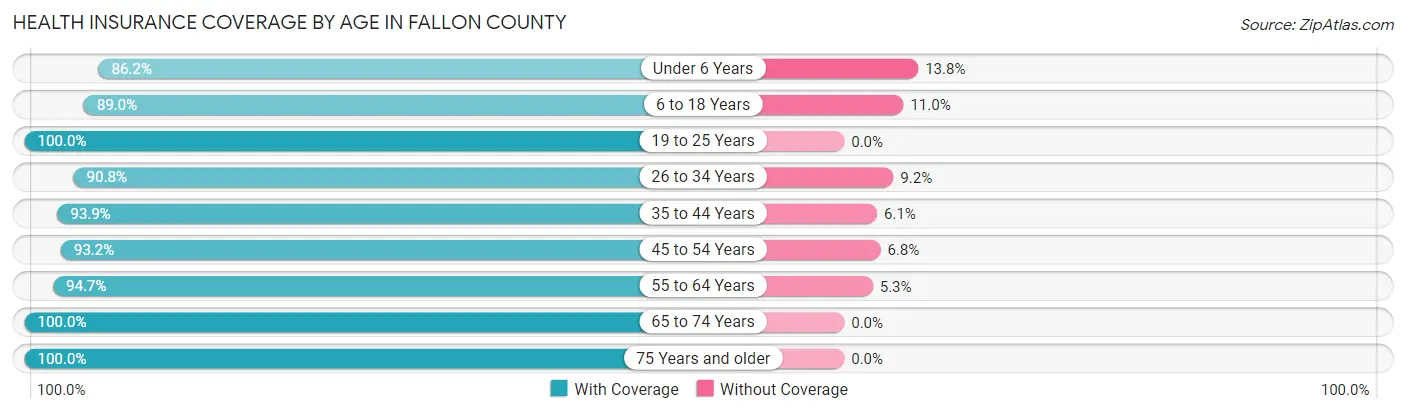
| Age Bracket | With Coverage | Without Coverage |
| Under 6 Years | 175 (86.2%) | 28 (13.8%) |
| 6 to 18 Years | 524 (89.0%) | 65 (11.0%) |
| 19 to 25 Years | 221 (100.0%) | 0 (0.0%) |
| 26 to 34 Years | 347 (90.8%) | 35 (9.2%) |
| 35 to 44 Years | 322 (93.9%) | 21 (6.1%) |
| 45 to 54 Years | 262 (93.2%) | 19 (6.8%) |
| 55 to 64 Years | 321 (94.7%) | 18 (5.3%) |
| 65 to 74 Years | 337 (100.0%) | 0 (0.0%) |
| 75 Years and older | 168 (100.0%) | 0 (0.0%) |
| Total | 2,677 (93.5%) | 186 (6.5%) |
Health Insurance Coverage by Citizenship Status in Fallon County

| Citizenship Status | With Coverage | Without Coverage |
| Native Born | 175 (86.2%) | 28 (13.8%) |
| Foreign Born, Citizen | 524 (89.0%) | 65 (11.0%) |
| Foreign Born, not a Citizen | 221 (100.0%) | 0 (0.0%) |
Health Insurance Coverage by Household Income in Fallon County
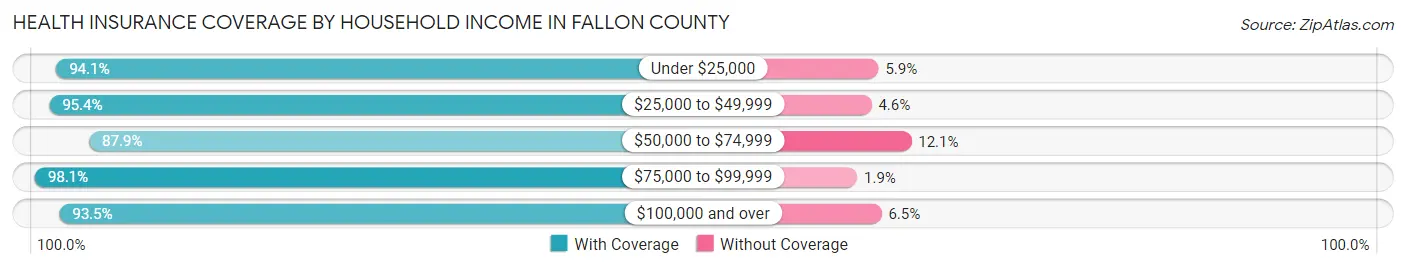
| Household Income | With Coverage | Without Coverage |
| Under $25,000 | 317 (94.1%) | 20 (5.9%) |
| $25,000 to $49,999 | 186 (95.4%) | 9 (4.6%) |
| $50,000 to $74,999 | 466 (87.9%) | 64 (12.1%) |
| $75,000 to $99,999 | 507 (98.1%) | 10 (1.9%) |
| $100,000 and over | 1,193 (93.5%) | 83 (6.5%) |
Public vs Private Health Insurance Coverage by Age in Fallon County
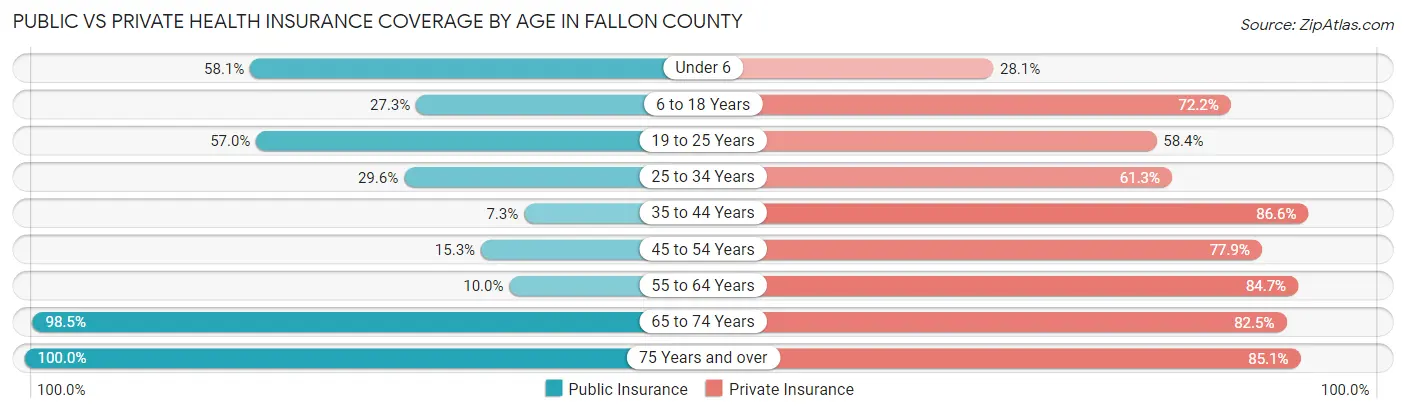
| Age Bracket | Public Insurance | Private Insurance |
| Under 6 | 118 (58.1%) | 57 (28.1%) |
| 6 to 18 Years | 161 (27.3%) | 425 (72.2%) |
| 19 to 25 Years | 126 (57.0%) | 129 (58.4%) |
| 25 to 34 Years | 113 (29.6%) | 234 (61.3%) |
| 35 to 44 Years | 25 (7.3%) | 297 (86.6%) |
| 45 to 54 Years | 43 (15.3%) | 219 (77.9%) |
| 55 to 64 Years | 34 (10.0%) | 287 (84.7%) |
| 65 to 74 Years | 332 (98.5%) | 278 (82.5%) |
| 75 Years and over | 168 (100.0%) | 143 (85.1%) |
| Total | 1,120 (39.1%) | 2,069 (72.3%) |
Disability Status by Sex by Age in Fallon County
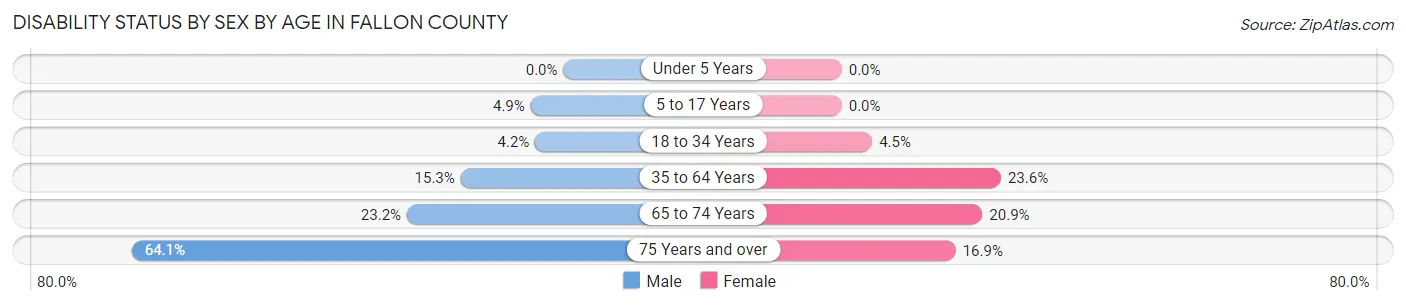
| Age Bracket | Male | Female |
| Under 5 Years | 0 (0.0%) | 0 (0.0%) |
| 5 to 17 Years | 14 (4.9%) | 0 (0.0%) |
| 18 to 34 Years | 13 (4.2%) | 15 (4.5%) |
| 35 to 64 Years | 74 (15.3%) | 113 (23.6%) |
| 65 to 74 Years | 36 (23.2%) | 38 (20.9%) |
| 75 Years and over | 66 (64.1%) | 11 (16.9%) |
Disability Class by Sex by Age in Fallon County
Disability Class: Hearing Difficulty
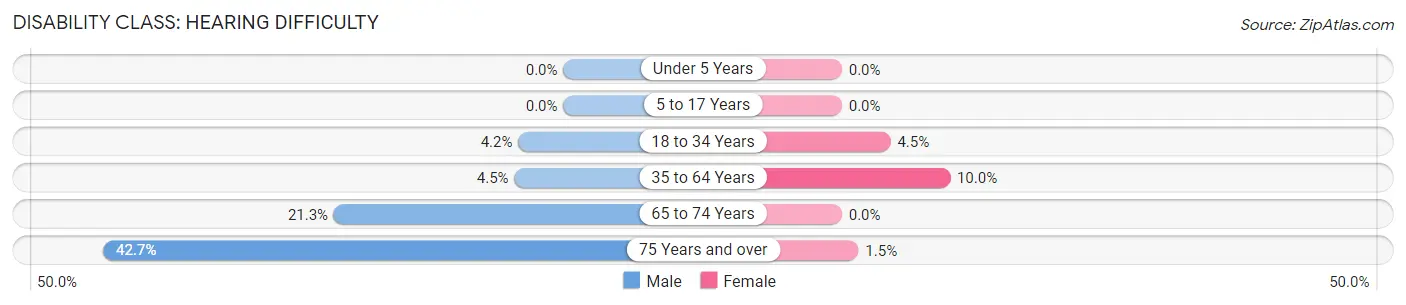
| Age Bracket | Male | Female |
| Under 5 Years | 0 (0.0%) | 0 (0.0%) |
| 5 to 17 Years | 0 (0.0%) | 0 (0.0%) |
| 18 to 34 Years | 13 (4.2%) | 15 (4.5%) |
| 35 to 64 Years | 22 (4.5%) | 48 (10.0%) |
| 65 to 74 Years | 33 (21.3%) | 0 (0.0%) |
| 75 Years and over | 44 (42.7%) | 1 (1.5%) |
Disability Class: Vision Difficulty
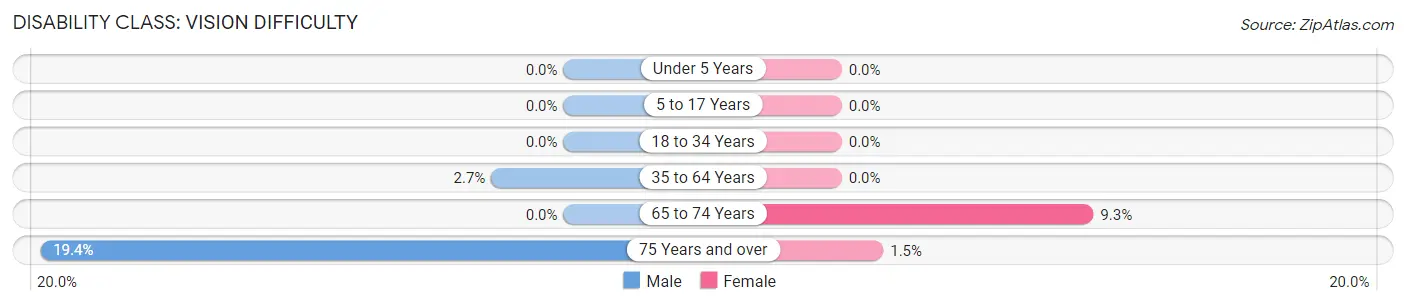
| Age Bracket | Male | Female |
| Under 5 Years | 0 (0.0%) | 0 (0.0%) |
| 5 to 17 Years | 0 (0.0%) | 0 (0.0%) |
| 18 to 34 Years | 0 (0.0%) | 0 (0.0%) |
| 35 to 64 Years | 13 (2.7%) | 0 (0.0%) |
| 65 to 74 Years | 0 (0.0%) | 17 (9.3%) |
| 75 Years and over | 20 (19.4%) | 1 (1.5%) |
Disability Class: Cognitive Difficulty
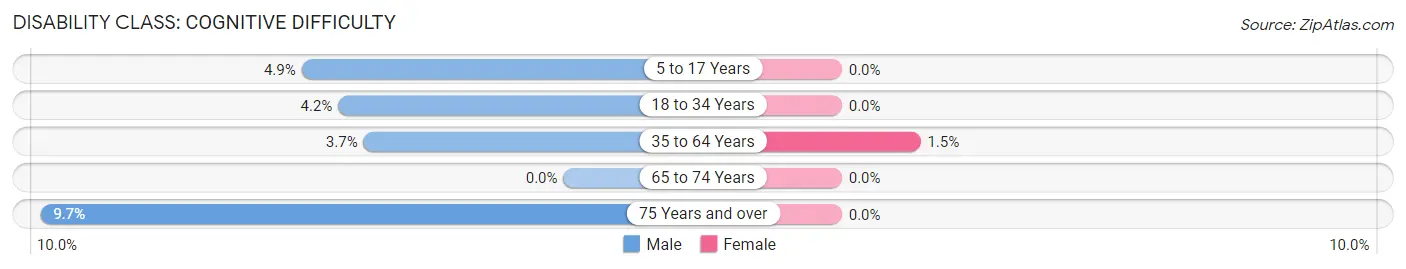
| Age Bracket | Male | Female |
| 5 to 17 Years | 14 (4.9%) | 0 (0.0%) |
| 18 to 34 Years | 13 (4.2%) | 0 (0.0%) |
| 35 to 64 Years | 18 (3.7%) | 7 (1.5%) |
| 65 to 74 Years | 0 (0.0%) | 0 (0.0%) |
| 75 Years and over | 10 (9.7%) | 0 (0.0%) |
Disability Class: Ambulatory Difficulty
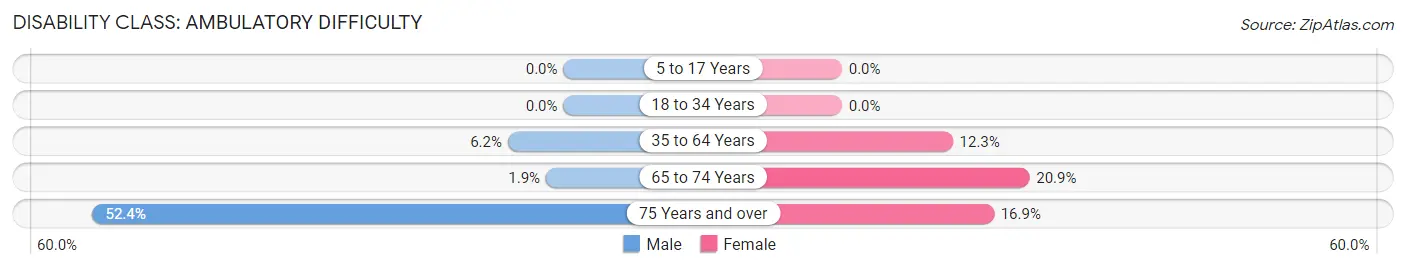
| Age Bracket | Male | Female |
| 5 to 17 Years | 0 (0.0%) | 0 (0.0%) |
| 18 to 34 Years | 0 (0.0%) | 0 (0.0%) |
| 35 to 64 Years | 30 (6.2%) | 59 (12.3%) |
| 65 to 74 Years | 3 (1.9%) | 38 (20.9%) |
| 75 Years and over | 54 (52.4%) | 11 (16.9%) |
Disability Class: Self-Care Difficulty
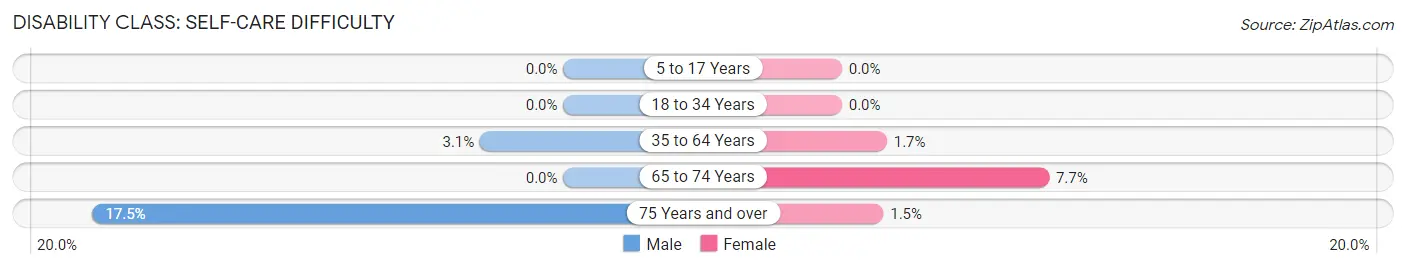
| Age Bracket | Male | Female |
| 5 to 17 Years | 0 (0.0%) | 0 (0.0%) |
| 18 to 34 Years | 0 (0.0%) | 0 (0.0%) |
| 35 to 64 Years | 15 (3.1%) | 8 (1.7%) |
| 65 to 74 Years | 0 (0.0%) | 14 (7.7%) |
| 75 Years and over | 18 (17.5%) | 1 (1.5%) |
Technology Access in Fallon County
Computing Device Access in Fallon County
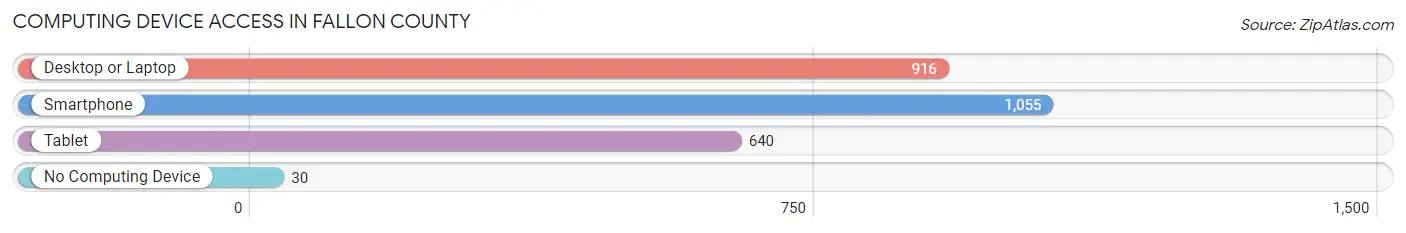
| Device Type | # Households | % Households |
| Desktop or Laptop | 916 | 78.7% |
| Smartphone | 1,055 | 90.6% |
| Tablet | 640 | 55.0% |
| No Computing Device | 30 | 2.6% |
| Total | 1,164 | 100.0% |
Internet Access in Fallon County
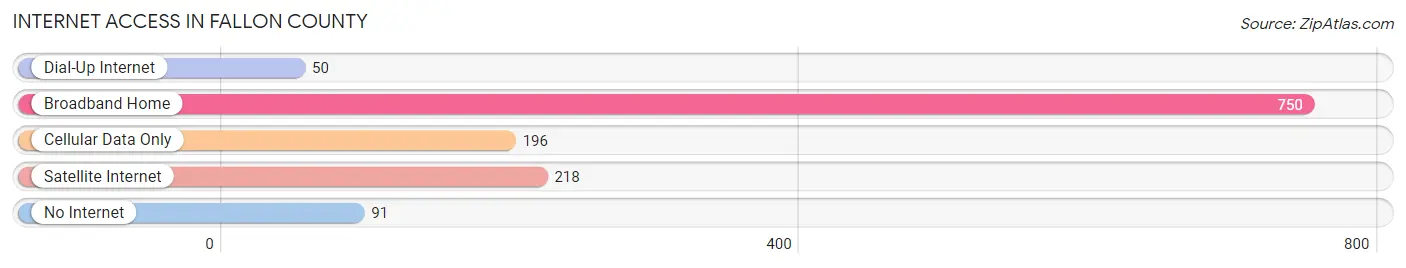
| Internet Type | # Households | % Households |
| Dial-Up Internet | 50 | 4.3% |
| Broadband Home | 750 | 64.4% |
| Cellular Data Only | 196 | 16.8% |
| Satellite Internet | 218 | 18.7% |
| No Internet | 91 | 7.8% |
| Total | 1,164 | 100.0% |
Fallon County Summary
Fallon County, Montana is located in the northeastern corner of the state and is bordered by North Dakota to the east and Canada to the north. It is the sixth largest county in Montana, covering an area of 2,845 square miles. The county seat is Baker, and the largest city is Baker.
History
The area that is now Fallon County was first inhabited by Native American tribes, including the Sioux, Cheyenne, and Crow. The first white settlers arrived in the area in the late 1800s, and the county was officially established in 1913.
The county was named after Benjamin O. Fallon, a prominent rancher and politician who served as a state senator from 1909 to 1913. He was also a member of the Montana Constitutional Convention in 1889.
Geography
Fallon County is located in the northeastern corner of Montana and is bordered by North Dakota to the east and Canada to the north. It is the sixth largest county in Montana, covering an area of 2,845 square miles. The county is mostly flat, with rolling hills in the east and south. The terrain is mostly grassland, with some areas of sagebrush and juniper.
The county is home to several rivers, including the Yellowstone, Missouri, and Milk Rivers. The county also contains several lakes, including Lake Sakakawea, Lake Audubon, and Lake Oahe.
Economy
The economy of Fallon County is largely based on agriculture and ranching. The county is home to several large ranches, including the Fallon County Cattle Company and the Fallon County Sheep Company.
The county is also home to several oil and gas fields, including the Bakken Formation. Oil and gas production is a major industry in the county, and it is estimated that the county produces over 1 million barrels of oil per day.
The county is also home to several wind farms which generate electricity for the region
Demographics
As of the 2010 census, the population of Fallon County was 7,845. The population is mostly white (94.3%), with small percentages of Native American (2.2%), African American (0.7%), and Asian (0.4%) populations.
The median household income in the county is $45,813, and the median home value is $133,400. The unemployment rate is 4.2%.
Conclusion
Fallon County, Montana is a rural county located in the northeastern corner of the state. It is home to several large ranches and oil and gas fields, and is a major producer of oil and gas. The population of the county is mostly white, with small percentages of Native American, African American, and Asian populations. The median household income is $45,813, and the median home value is $133,400.
Common Questions
What is the Total Population of Fallon County?
Total Population of Fallon County is 2,941.
What is the Total Male Population of Fallon County?
Total Male Population of Fallon County is 1,448.
What is the Total Female Population of Fallon County?
Total Female Population of Fallon County is 1,493.
What is the Ratio of Males per 100 Females in Fallon County?
There are 96.99 Males per 100 Females in Fallon County.
What is the Ratio of Females per 100 Males in Fallon County?
There are 103.11 Females per 100 Males in Fallon County.
What is the Median Population Age in Fallon County?
Median Population Age in Fallon County is 37.2 Years.
What is the Average Family Size in Fallon County
Average Family Size in Fallon County is 3.1 People.
What is the Average Household Size in Fallon County
Average Household Size in Fallon County is 2.5 People.
What is Per Capita Income in Fallon County?
Per Capita income in Fallon County is $42,516.
What is the Median Family Income in Fallon County?
Median Family Income in Fallon County is $112,540.
What is the Median Household income in Fallon County?
Median Household Income in Fallon County is $79,750.
What is Income or Wage Gap in Fallon County?
Income or Wage Gap in Fallon County is 57.4%.
Women in Fallon County earn 42.6 cents for every dollar earned by a man.
What is Inequality or Gini Index in Fallon County?
Inequality or Gini Index in Fallon County is 0.46.
How Large is the Labor Force in Fallon County?
There are 1,426 People in the Labor Forcein in Fallon County.
What is the Percentage of People in the Labor Force in Fallon County?
64.4% of People are in the Labor Force in Fallon County.