Daniels County, MT
Daniels County Overview
1,535
TOTAL POPULATION
775
MALE POPULATION
760
FEMALE POPULATION
101.97
MALES / 100 FEMALES
98.06
FEMALES / 100 MALES
52.4
MEDIAN AGE
3.0
AVG FAMILY SIZE
2.1
AVG HOUSEHOLD SIZE
$33,757
PER CAPITA INCOME
$83,580
AVG FAMILY INCOME
$47,378
AVG HOUSEHOLD INCOME
23.2%
WAGE / INCOME GAP [ % ]
76.8¢/ $1
WAGE / INCOME GAP [ $ ]
0.40
INEQUALITY / GINI INDEX
796
LABOR FORCE [ PEOPLE ]
60.7%
PERCENT IN LABOR FORCE
1.5%
UNEMPLOYMENT RATE
Daniels County Area Codes
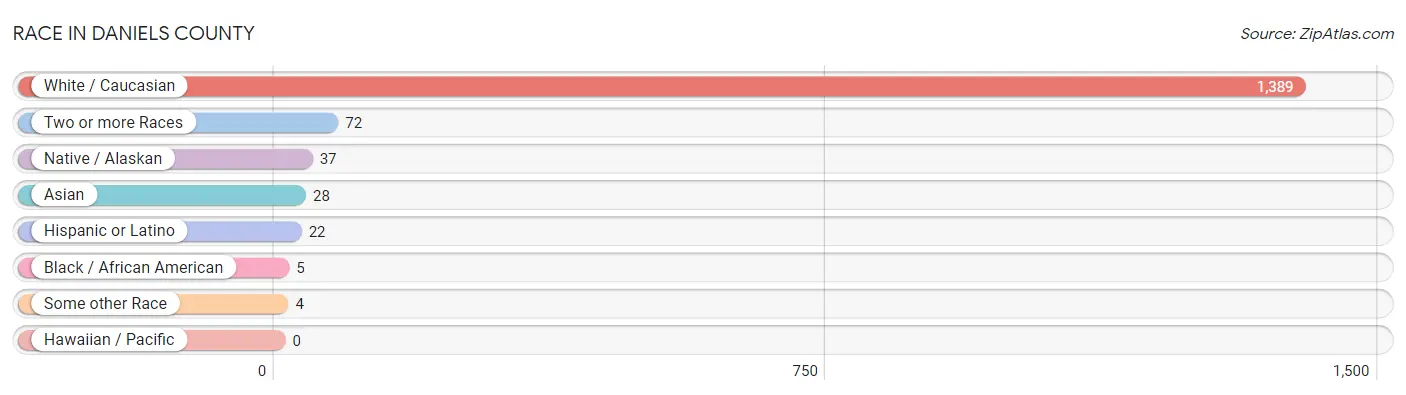
Race in Daniels County
The most populous races in Daniels County are White / Caucasian (1,389 | 90.5%), Two or more Races (72 | 4.7%), and Native / Alaskan (37 | 2.4%).
| Race | # Population | % Population |
| Asian | 28 | 1.8% |
| Black / African American | 5 | 0.3% |
| Hawaiian / Pacific | 0 | 0.0% |
| Hispanic or Latino | 22 | 1.4% |
| Native / Alaskan | 37 | 2.4% |
| White / Caucasian | 1,389 | 90.5% |
| Two or more Races | 72 | 4.7% |
| Some other Race | 4 | 0.3% |
| Total | 1,535 | 100.0% |
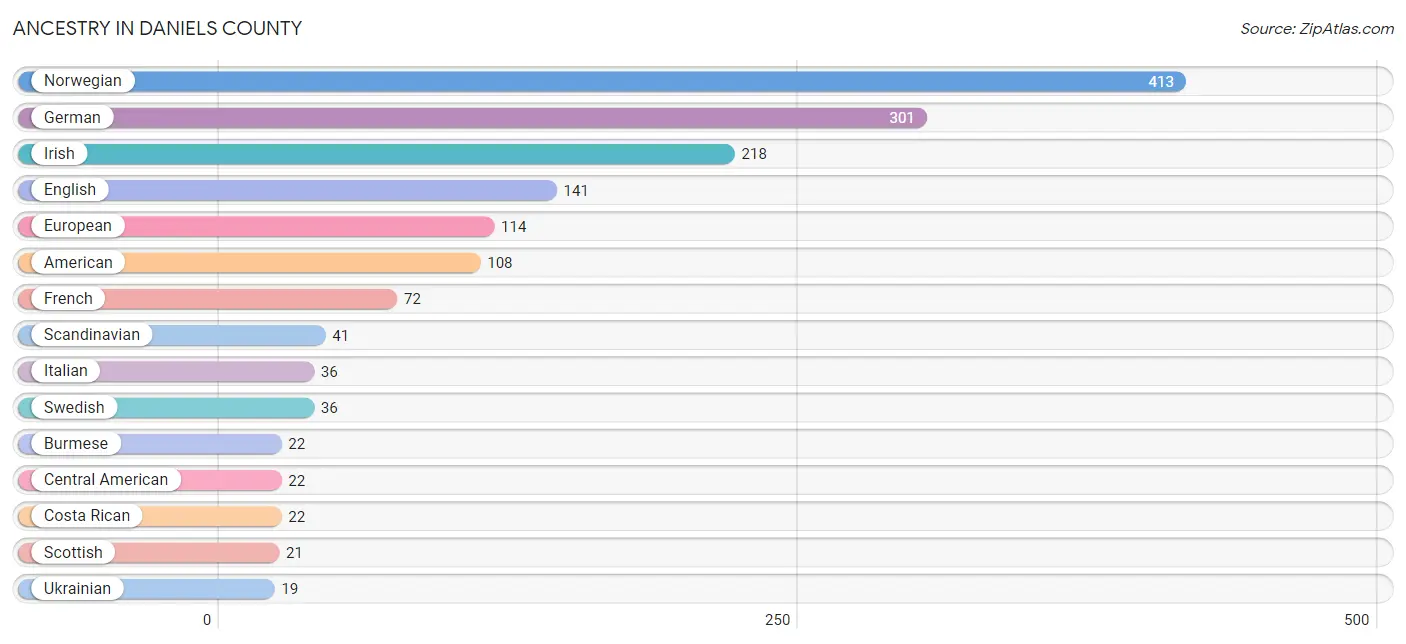
Ancestry in Daniels County
The most populous ancestries reported in Daniels County are Norwegian (413 | 26.9%), German (301 | 19.6%), Irish (218 | 14.2%), English (141 | 9.2%), and European (114 | 7.4%), together accounting for 77.3% of all Daniels County residents.
| Ancestry | # Population | % Population |
| American | 108 | 7.0% |
| Australian | 3 | 0.2% |
| Blackfeet | 1 | 0.1% |
| Burmese | 22 | 1.4% |
| Canadian | 10 | 0.6% |
| Central American | 22 | 1.4% |
| Cheyenne | 9 | 0.6% |
| Costa Rican | 22 | 1.4% |
| Crow | 1 | 0.1% |
| Czech | 8 | 0.5% |
| Danish | 17 | 1.1% |
| Dutch | 10 | 0.6% |
| English | 141 | 9.2% |
| European | 114 | 7.4% |
| French | 72 | 4.7% |
| French Canadian | 17 | 1.1% |
| German | 301 | 19.6% |
| Greek | 8 | 0.5% |
| Icelander | 1 | 0.1% |
| Indian (Asian) | 15 | 1.0% |
| Irish | 218 | 14.2% |
| Italian | 36 | 2.4% |
| Latvian | 3 | 0.2% |
| Northern European | 7 | 0.5% |
| Norwegian | 413 | 26.9% |
| Pakistani | 3 | 0.2% |
| Romanian | 5 | 0.3% |
| Scandinavian | 41 | 2.7% |
| Scotch-Irish | 13 | 0.9% |
| Scottish | 21 | 1.4% |
| Swedish | 36 | 2.4% |
| Swiss | 7 | 0.5% |
| Ukrainian | 19 | 1.2% | View All 33 Rows |
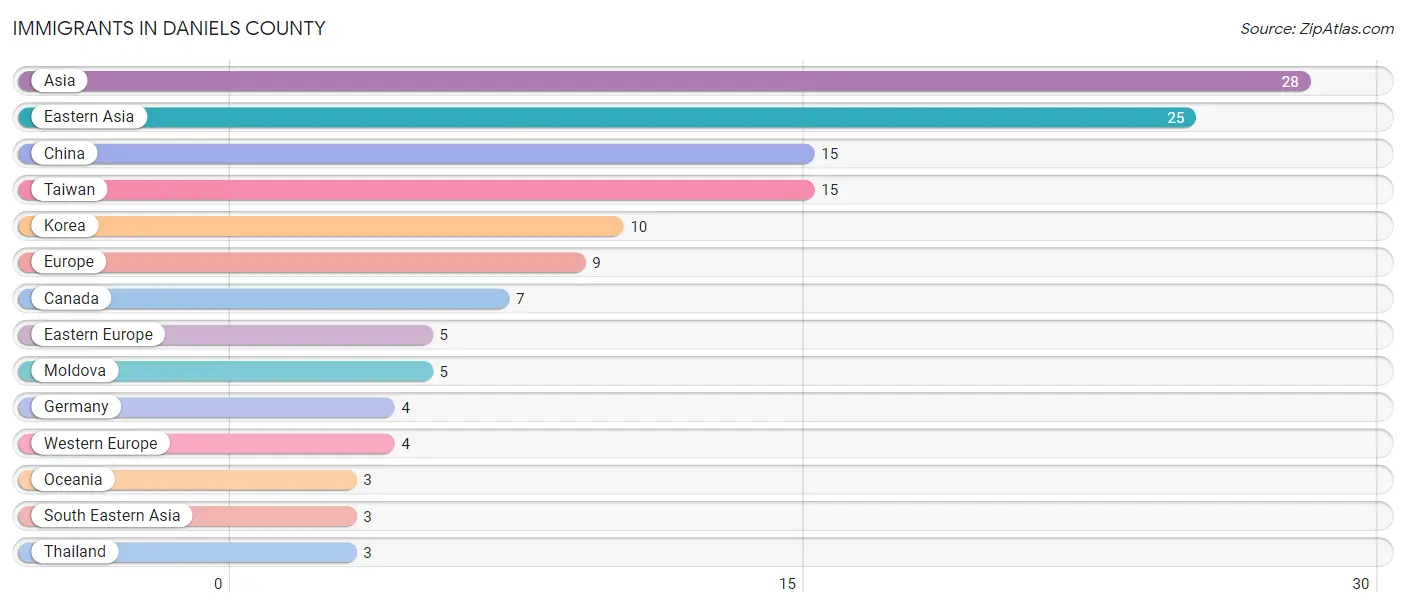
Immigrants in Daniels County
The most numerous immigrant groups reported in Daniels County came from Asia (28 | 1.8%), Eastern Asia (25 | 1.6%), China (15 | 1.0%), Taiwan (15 | 1.0%), and Korea (10 | 0.6%), together accounting for 6.1% of all Daniels County residents.
| Immigration Origin | # Population | % Population |
| Asia | 28 | 1.8% |
| Canada | 7 | 0.5% |
| China | 15 | 1.0% |
| Eastern Asia | 25 | 1.6% |
| Eastern Europe | 5 | 0.3% |
| Europe | 9 | 0.6% |
| Germany | 4 | 0.3% |
| Korea | 10 | 0.6% |
| Moldova | 5 | 0.3% |
| Oceania | 3 | 0.2% |
| South Eastern Asia | 3 | 0.2% |
| Taiwan | 15 | 1.0% |
| Thailand | 3 | 0.2% |
| Western Europe | 4 | 0.3% | View All 14 Rows |
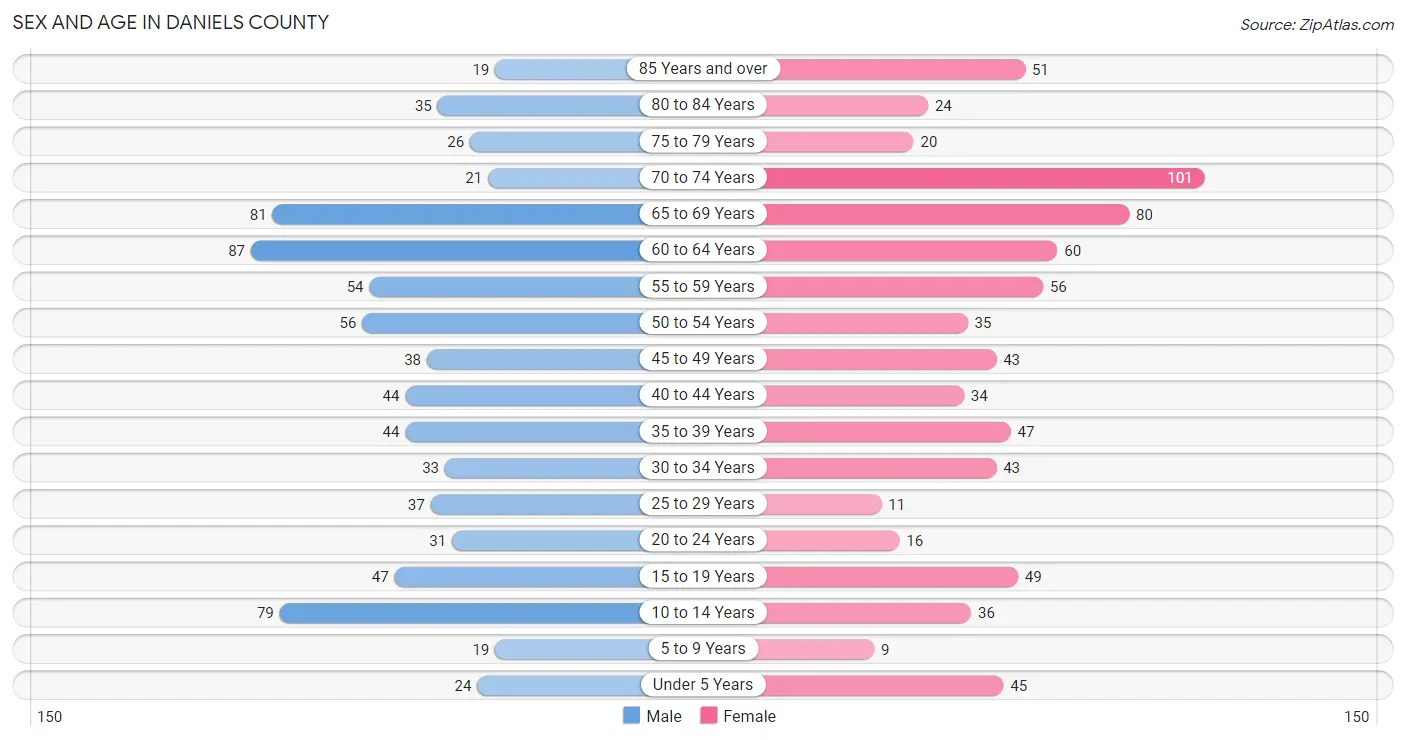
Sex and Age in Daniels County
Sex and Age in Daniels County
The most populous age groups in Daniels County are 60 to 64 Years (87 | 11.2%) for men and 70 to 74 Years (101 | 13.3%) for women.
| Age Bracket | Male | Female |
| Under 5 Years | 24 (3.1%) | 45 (5.9%) |
| 5 to 9 Years | 19 (2.5%) | 9 (1.2%) |
| 10 to 14 Years | 79 (10.2%) | 36 (4.7%) |
| 15 to 19 Years | 47 (6.1%) | 49 (6.5%) |
| 20 to 24 Years | 31 (4.0%) | 16 (2.1%) |
| 25 to 29 Years | 37 (4.8%) | 11 (1.5%) |
| 30 to 34 Years | 33 (4.3%) | 43 (5.7%) |
| 35 to 39 Years | 44 (5.7%) | 47 (6.2%) |
| 40 to 44 Years | 44 (5.7%) | 34 (4.5%) |
| 45 to 49 Years | 38 (4.9%) | 43 (5.7%) |
| 50 to 54 Years | 56 (7.2%) | 35 (4.6%) |
| 55 to 59 Years | 54 (7.0%) | 56 (7.4%) |
| 60 to 64 Years | 87 (11.2%) | 60 (7.9%) |
| 65 to 69 Years | 81 (10.4%) | 80 (10.5%) |
| 70 to 74 Years | 21 (2.7%) | 101 (13.3%) |
| 75 to 79 Years | 26 (3.4%) | 20 (2.6%) |
| 80 to 84 Years | 35 (4.5%) | 24 (3.2%) |
| 85 Years and over | 19 (2.5%) | 51 (6.7%) |
| Total | 775 (100.0%) | 760 (100.0%) |
Families and Households in Daniels County
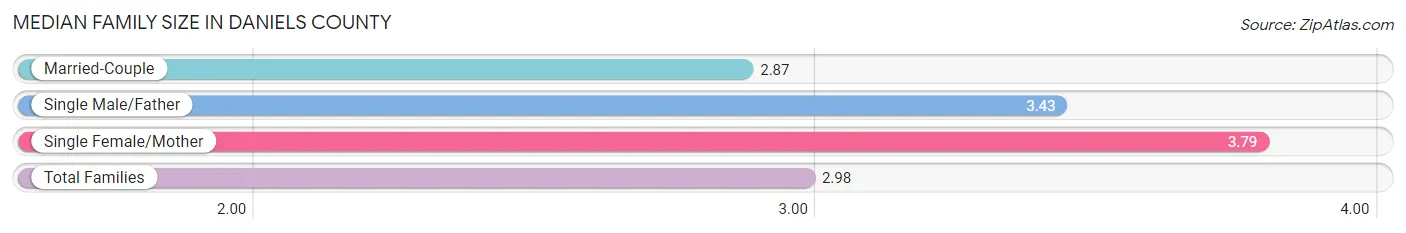
Median Family Size in Daniels County
The median family size in Daniels County is 2.98 persons per family, with single female/mother families (34 | 9.0%) accounting for the largest median family size of 3.79 persons per family. On the other hand, married-couple families (322 | 85.4%) represent the smallest median family size with 2.87 persons per family.
| Family Type | # Families | Family Size |
| Married-Couple | 322 (85.4%) | 2.87 |
| Single Male/Father | 21 (5.6%) | 3.43 |
| Single Female/Mother | 34 (9.0%) | 3.79 |
| Total Families | 377 (100.0%) | 2.98 |
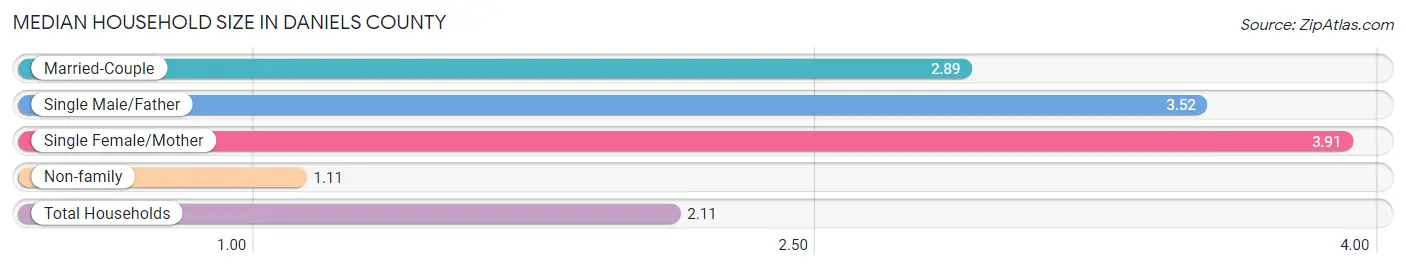
Median Household Size in Daniels County
The median household size in Daniels County is 2.11 persons per household, with single female/mother households (34 | 4.8%) accounting for the largest median household size of 3.91 persons per household. non-family households (337 | 47.2%) represent the smallest median household size with 1.11 persons per household.
| Household Type | # Households | Household Size |
| Married-Couple | 322 (45.1%) | 2.89 |
| Single Male/Father | 21 (2.9%) | 3.52 |
| Single Female/Mother | 34 (4.8%) | 3.91 |
| Non-family | 337 (47.2%) | 1.11 |
| Total Households | 714 (100.0%) | 2.11 |
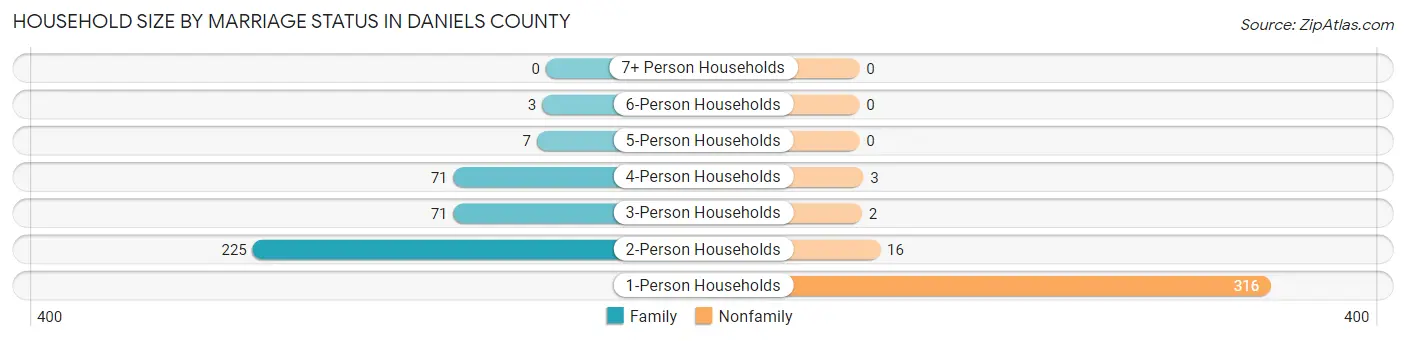
Household Size by Marriage Status in Daniels County
Out of a total of 714 households in Daniels County, 377 (52.8%) are family households, while 337 (47.2%) are nonfamily households. The most numerous type of family households are 2-person households, comprising 225, and the most common type of nonfamily households are 1-person households, comprising 316.
| Household Size | Family Households | Nonfamily Households |
| 1-Person Households | - | 316 (44.3%) |
| 2-Person Households | 225 (31.5%) | 16 (2.2%) |
| 3-Person Households | 71 (9.9%) | 2 (0.3%) |
| 4-Person Households | 71 (9.9%) | 3 (0.4%) |
| 5-Person Households | 7 (1.0%) | 0 (0.0%) |
| 6-Person Households | 3 (0.4%) | 0 (0.0%) |
| 7+ Person Households | 0 (0.0%) | 0 (0.0%) |
| Total | 377 (52.8%) | 337 (47.2%) |
Female Fertility in Daniels County
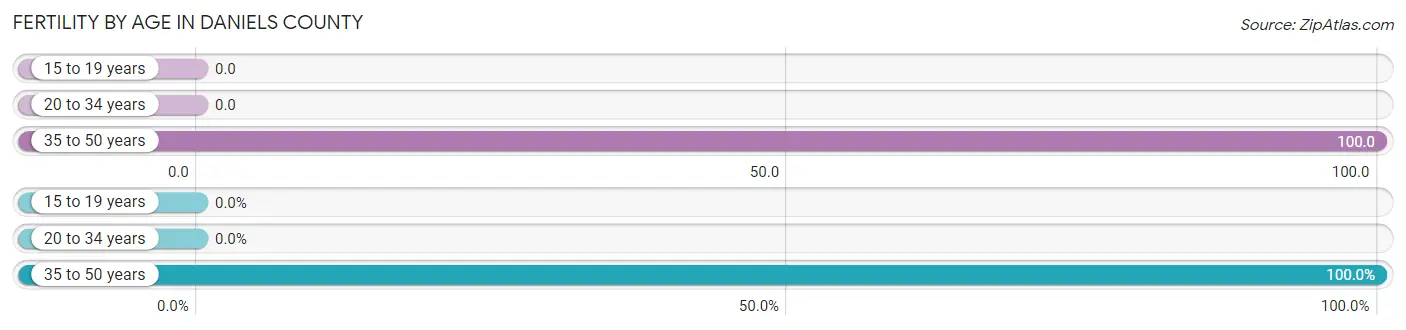
Fertility by Age in Daniels County
Average fertility rate in Daniels County is 52.0 births per 1,000 women. Women in the age bracket of 35 to 50 years have the highest fertility rate with 100.0 births per 1,000 women. Women in the age bracket of 35 to 50 years acount for 100.0% of all women with births.
| Age Bracket | Women with Births | Births / 1,000 Women |
| 15 to 19 years | 0 (0.0%) | 0.0 |
| 20 to 34 years | 0 (0.0%) | 0.0 |
| 35 to 50 years | 13 (100.0%) | 100.0 |
| Total | 13 (100.0%) | 52.0 |
Fertility by Age by Marriage Status in Daniels County
23.1% of women with births (13) in Daniels County are married. The highest percentage of unmarried women with births falls into 35 to 50 years age bracket with 76.9% of them unmarried at the time of birth, while the lowest percentage of unmarried women with births belong to 35 to 50 years age bracket with 76.9% of them unmarried.
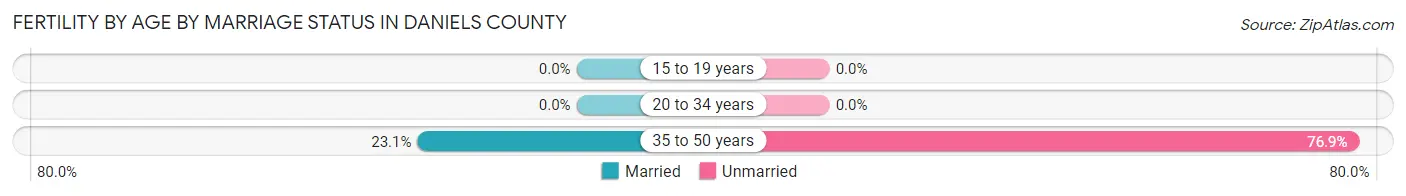
| Age Bracket | Married | Unmarried |
| 15 to 19 years | 0 (0.0%) | 0 (0.0%) |
| 20 to 34 years | 0 (0.0%) | 0 (0.0%) |
| 35 to 50 years | 3 (23.1%) | 10 (76.9%) |
| Total | 3 (23.1%) | 10 (76.9%) |
Fertility by Education in Daniels County
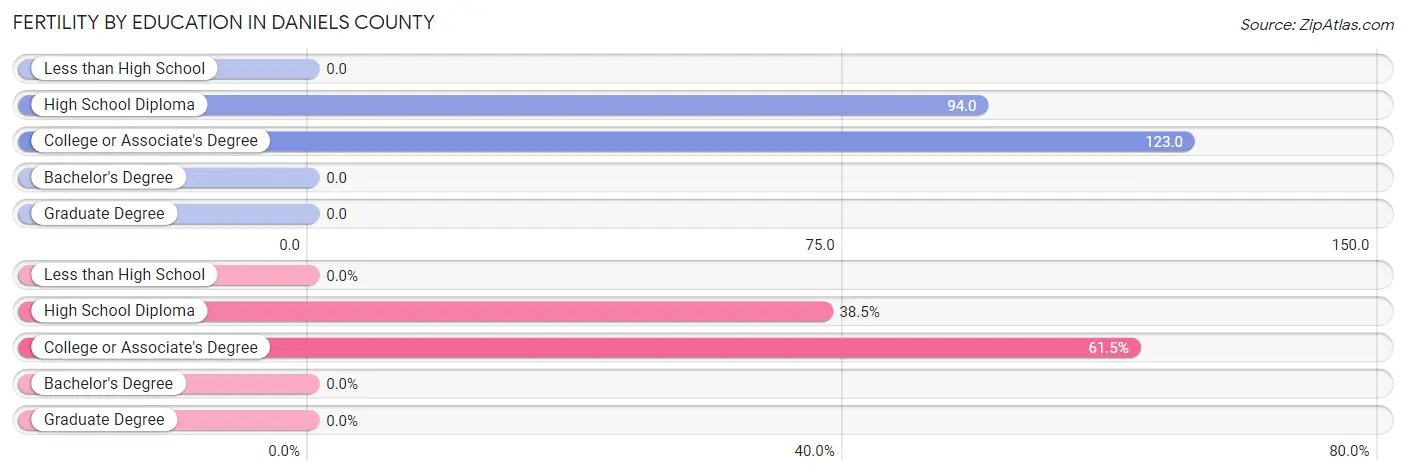
| Educational Attainment | Women with Births | Births / 1,000 Women |
| Less than High School | 0 (0.0%) | 0.0 |
| High School Diploma | 5 (38.5%) | 94.0 |
| College or Associate's Degree | 8 (61.5%) | 123.0 |
| Bachelor's Degree | 0 (0.0%) | 0.0 |
| Graduate Degree | 0 (0.0%) | 0.0 |
| Total | 13 (100.0%) | 52.0 |
Fertility by Education by Marriage Status in Daniels County
76.9% of women with births in Daniels County are unmarried. Women with the educational attainment of college or associate's degree are most likely to be married with 37.5% of them married at childbirth, while women with the educational attainment of high school diploma are least likely to be married with 100.0% of them unmarried at childbirth.
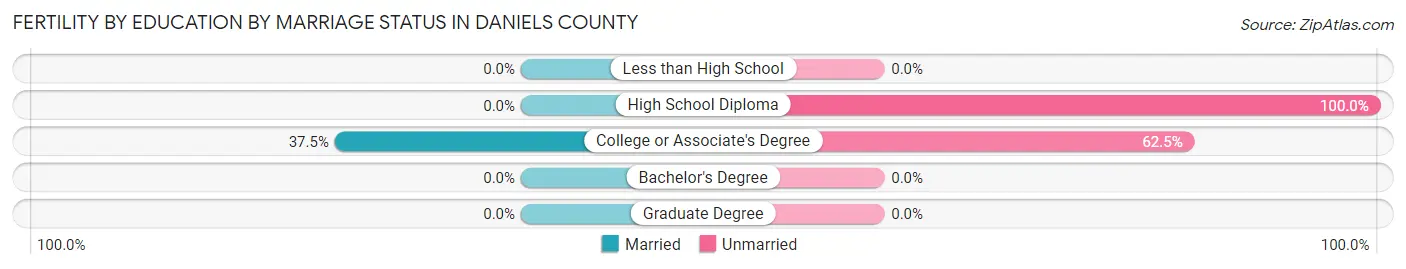
| Educational Attainment | Married | Unmarried |
| Less than High School | 0 (0.0%) | 0 (0.0%) |
| High School Diploma | 0 (0.0%) | 5 (100.0%) |
| College or Associate's Degree | 3 (37.5%) | 5 (62.5%) |
| Bachelor's Degree | 0 (0.0%) | 0 (0.0%) |
| Graduate Degree | 0 (0.0%) | 0 (0.0%) |
| Total | 3 (23.1%) | 10 (76.9%) |
Income in Daniels County
Income Overview in Daniels County
Per Capita Income in Daniels County is $33,757, while median incomes of families and households are $83,580 and $47,378 respectively.
| Characteristic | Number | Measure |
| Per Capita Income | 1,535 | $33,757 |
| Median Family Income | 377 | $83,580 |
| Mean Family Income | 377 | $88,321 |
| Median Household Income | 714 | $47,378 |
| Mean Household Income | 714 | $67,209 |
| Income Deficit | 377 | $0 |
| Wage / Income Gap (%) | 1,535 | 23.19% |
| Wage / Income Gap ($) | 1,535 | 76.81¢ per $1 |
| Gini / Inequality Index | 1,535 | 0.40 |
Earnings by Sex in Daniels County
Average Earnings in Daniels County are $35,446, $37,619 for men and $28,897 for women, a difference of 23.2%.
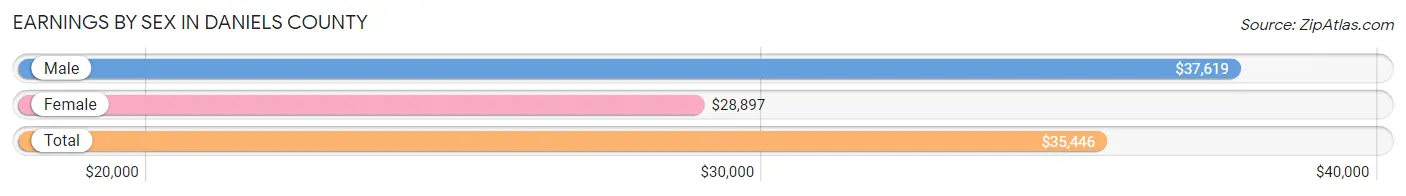
| Sex | Number | Average Earnings |
| Male | 508 (59.7%) | $37,619 |
| Female | 343 (40.3%) | $28,897 |
| Total | 851 (100.0%) | $35,446 |
Earnings by Sex by Income Bracket in Daniels County
The most common earnings brackets in Daniels County are $35,000 to $39,999 for men (79 | 15.5%) and $25,000 to $29,999 for women (40 | 11.7%).
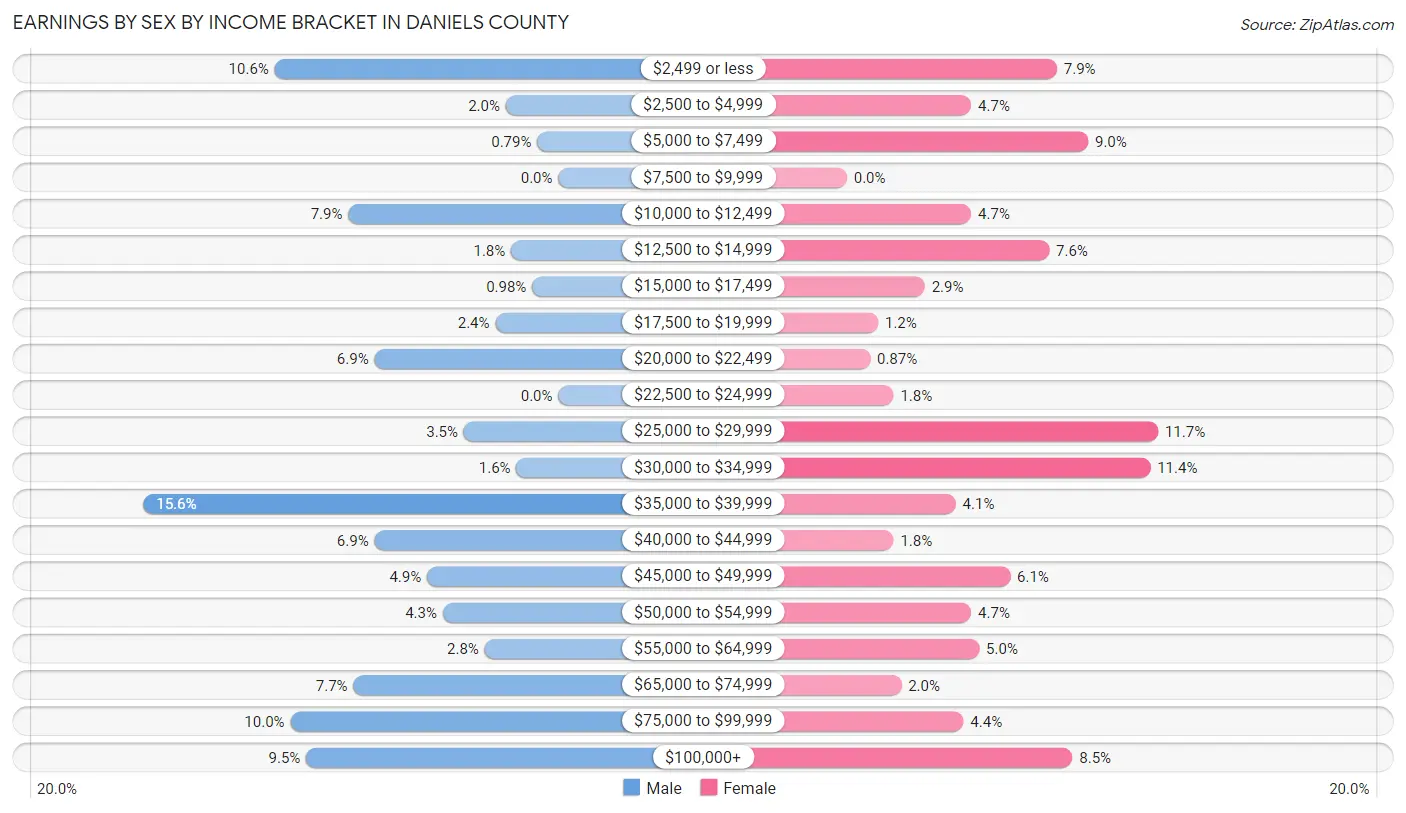
| Income | Male | Female |
| $2,499 or less | 54 (10.6%) | 27 (7.9%) |
| $2,500 to $4,999 | 10 (2.0%) | 16 (4.7%) |
| $5,000 to $7,499 | 4 (0.8%) | 31 (9.0%) |
| $7,500 to $9,999 | 0 (0.0%) | 0 (0.0%) |
| $10,000 to $12,499 | 40 (7.9%) | 16 (4.7%) |
| $12,500 to $14,999 | 9 (1.8%) | 26 (7.6%) |
| $15,000 to $17,499 | 5 (1.0%) | 10 (2.9%) |
| $17,500 to $19,999 | 12 (2.4%) | 4 (1.2%) |
| $20,000 to $22,499 | 35 (6.9%) | 3 (0.9%) |
| $22,500 to $24,999 | 0 (0.0%) | 6 (1.8%) |
| $25,000 to $29,999 | 18 (3.5%) | 40 (11.7%) |
| $30,000 to $34,999 | 8 (1.6%) | 39 (11.4%) |
| $35,000 to $39,999 | 79 (15.5%) | 14 (4.1%) |
| $40,000 to $44,999 | 35 (6.9%) | 6 (1.8%) |
| $45,000 to $49,999 | 25 (4.9%) | 21 (6.1%) |
| $50,000 to $54,999 | 22 (4.3%) | 16 (4.7%) |
| $55,000 to $64,999 | 14 (2.8%) | 17 (5.0%) |
| $65,000 to $74,999 | 39 (7.7%) | 7 (2.0%) |
| $75,000 to $99,999 | 51 (10.0%) | 15 (4.4%) |
| $100,000+ | 48 (9.5%) | 29 (8.5%) |
| Total | 508 (100.0%) | 343 (100.0%) |
Earnings by Sex by Educational Attainment in Daniels County
Average earnings in Daniels County are $41,364 for men and $29,632 for women, a difference of 28.4%. Men with an educational attainment of graduate degree enjoy the highest average annual earnings of $56,071, while those with high school diploma education earn the least with $40,313. Women with an educational attainment of bachelor's degree earn the most with the average annual earnings of $30,833, while those with high school diploma education have the smallest earnings of $25,568.
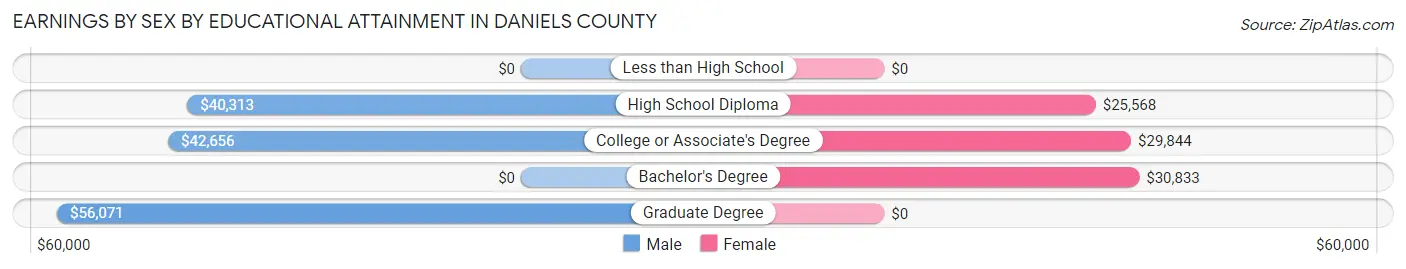
| Educational Attainment | Male Income | Female Income |
| Less than High School | - | - |
| High School Diploma | $40,313 | $25,568 |
| College or Associate's Degree | $42,656 | $29,844 |
| Bachelor's Degree | - | - |
| Graduate Degree | $56,071 | $0 |
| Total | $41,364 | $29,632 |
Family Income in Daniels County
Family Income Brackets in Daniels County
According to the Daniels County family income data, there are 86 families falling into the $100,000 to $149,999 income range, which is the most common income bracket and makes up 22.8% of all families.
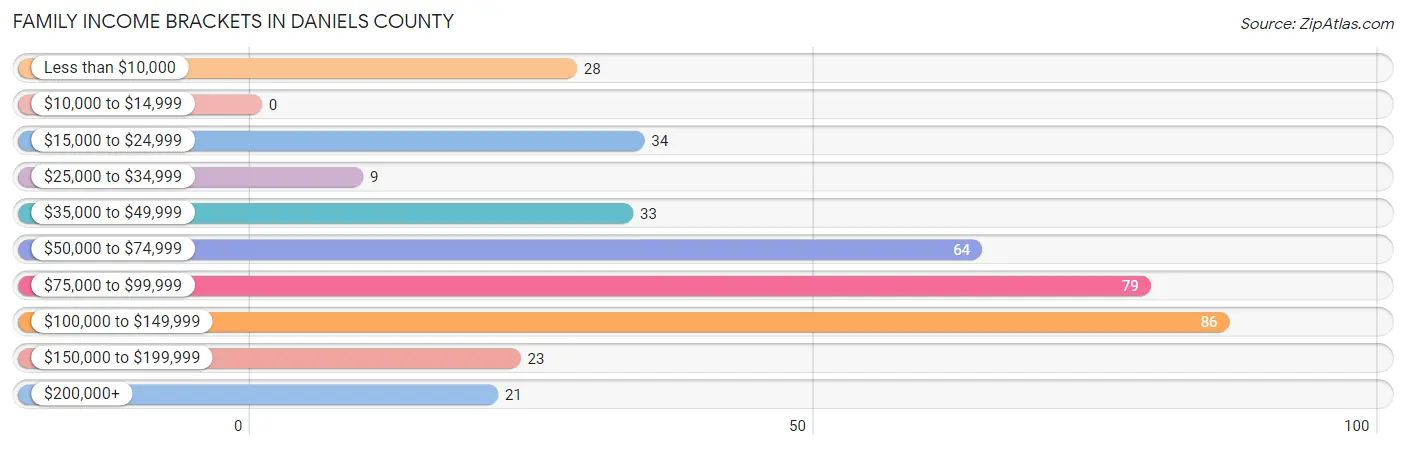
| Income Bracket | # Families | % Families |
| Less than $10,000 | 28 | 7.4% |
| $10,000 to $14,999 | 0 | 0.0% |
| $15,000 to $24,999 | 34 | 9.0% |
| $25,000 to $34,999 | 9 | 2.4% |
| $35,000 to $49,999 | 33 | 8.8% |
| $50,000 to $74,999 | 64 | 17.0% |
| $75,000 to $99,999 | 79 | 21.0% |
| $100,000 to $149,999 | 86 | 22.8% |
| $150,000 to $199,999 | 23 | 6.1% |
| $200,000+ | 21 | 5.6% |
Family Income by Famaliy Size in Daniels County
4-person families (69 | 18.3%) account for the highest median family income in Daniels County with $106,875 per family, while 2-person families (234 | 62.1%) have the highest median income of $38,438 per family member.
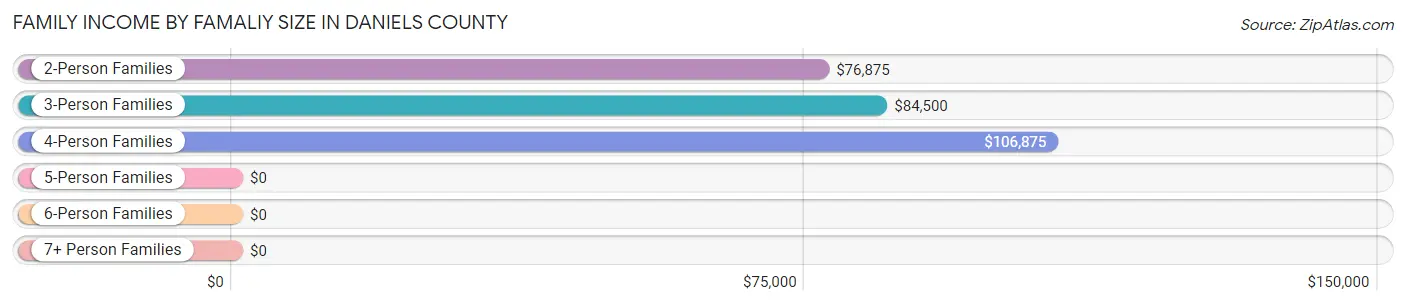
| Income Bracket | # Families | Median Income |
| 2-Person Families | 234 (62.1%) | $76,875 |
| 3-Person Families | 64 (17.0%) | $84,500 |
| 4-Person Families | 69 (18.3%) | $106,875 |
| 5-Person Families | 7 (1.9%) | $0 |
| 6-Person Families | 3 (0.8%) | $0 |
| 7+ Person Families | 0 (0.0%) | $0 |
| Total | 377 (100.0%) | $83,580 |
Family Income by Number of Earners in Daniels County
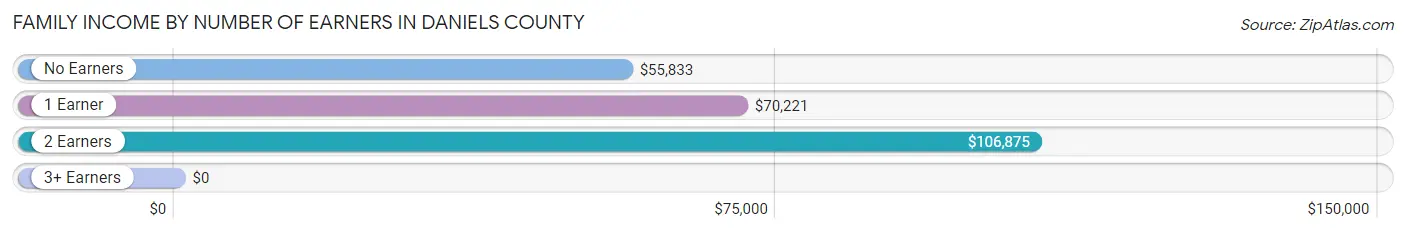
| Number of Earners | # Families | Median Income |
| No Earners | 58 (15.4%) | $55,833 |
| 1 Earner | 119 (31.6%) | $70,221 |
| 2 Earners | 161 (42.7%) | $106,875 |
| 3+ Earners | 39 (10.3%) | $0 |
| Total | 377 (100.0%) | $83,580 |
Household Income in Daniels County
Household Income Brackets in Daniels County
With 152 households falling in the category, the $35,000 to $49,999 income range is the most frequent in Daniels County, accounting for 21.3% of all households. In contrast, only 20 households (2.8%) fall into the $10,000 to $14,999 income bracket, making it the least populous group.
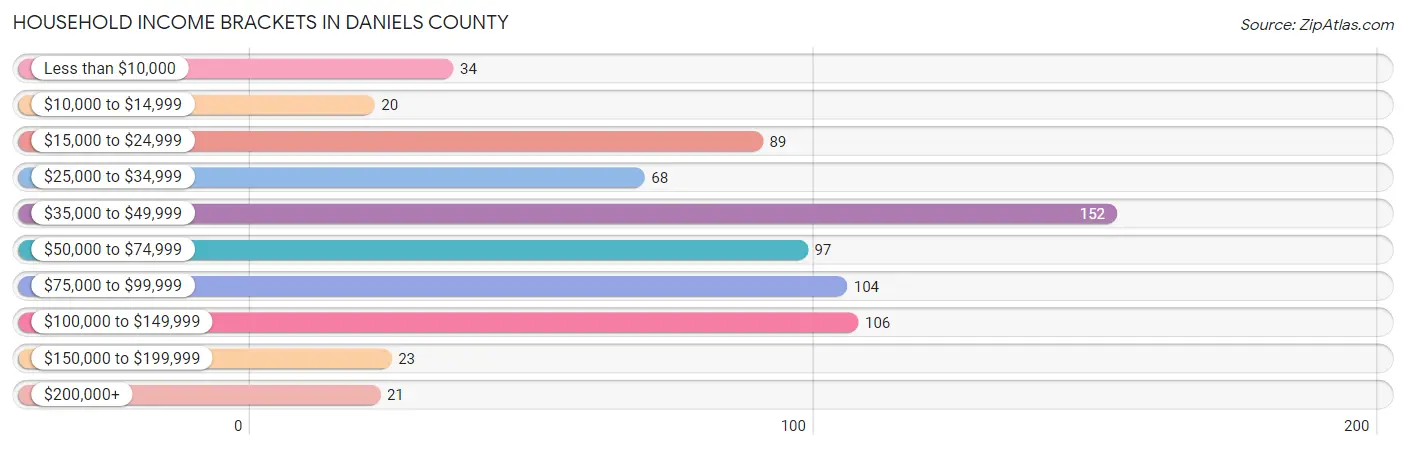
| Income Bracket | # Households | % Households |
| Less than $10,000 | 34 | 4.8% |
| $10,000 to $14,999 | 20 | 2.8% |
| $15,000 to $24,999 | 89 | 12.5% |
| $25,000 to $34,999 | 68 | 9.5% |
| $35,000 to $49,999 | 152 | 21.3% |
| $50,000 to $74,999 | 97 | 13.6% |
| $75,000 to $99,999 | 104 | 14.6% |
| $100,000 to $149,999 | 106 | 14.8% |
| $150,000 to $199,999 | 23 | 3.2% |
| $200,000+ | 21 | 2.9% |
Household Income by Householder Age in Daniels County
The median household income in Daniels County is $47,378, with the highest median household income of $76,607 found in the 25 to 44 years age bracket for the primary householder. A total of 155 households (21.7%) fall into this category. Meanwhile, the 15 to 24 years age bracket for the primary householder has the lowest median household income of $0, with 7 households (1.0%) in this group.
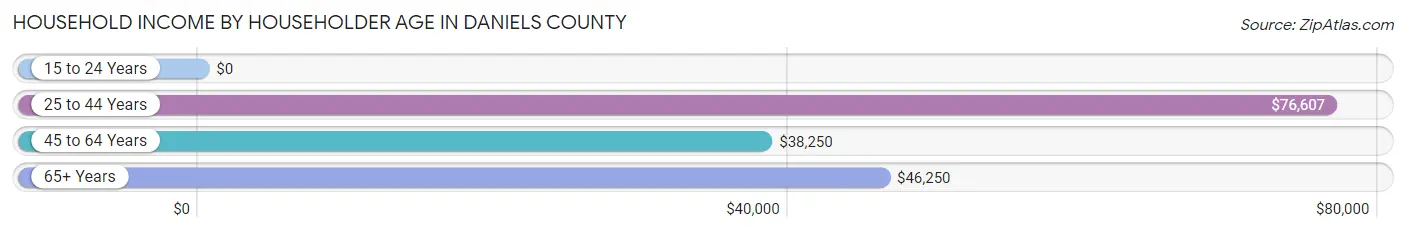
| Income Bracket | # Households | Median Income |
| 15 to 24 Years | 7 (1.0%) | $0 |
| 25 to 44 Years | 155 (21.7%) | $76,607 |
| 45 to 64 Years | 233 (32.6%) | $38,250 |
| 65+ Years | 319 (44.7%) | $46,250 |
| Total | 714 (100.0%) | $47,378 |
Poverty in Daniels County
Income Below Poverty by Sex and Age in Daniels County
With 14.3% poverty level for males and 10.0% for females among the residents of Daniels County, 16 and 17 year old males and 45 to 54 year old females are the most vulnerable to poverty, with 21 males (75.0%) and 32 females (41.0%) in their respective age groups living below the poverty level.
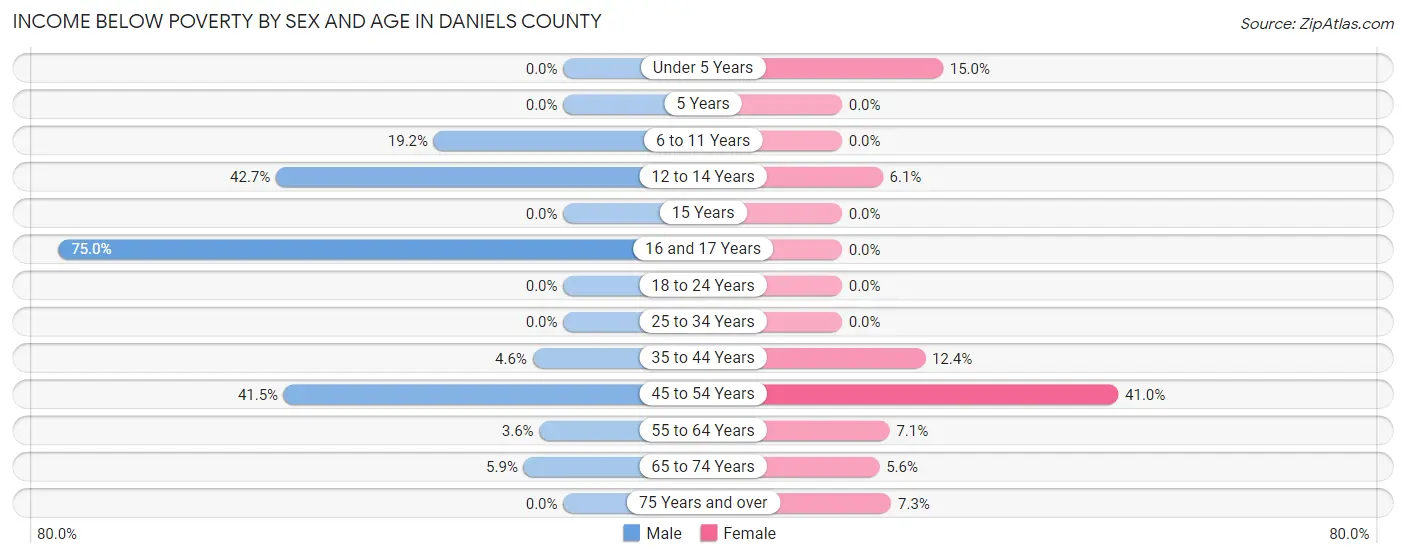
| Age Bracket | Male | Female |
| Under 5 Years | 0 (0.0%) | 6 (15.0%) |
| 5 Years | 0 (0.0%) | 0 (0.0%) |
| 6 to 11 Years | 5 (19.2%) | 0 (0.0%) |
| 12 to 14 Years | 29 (42.6%) | 2 (6.1%) |
| 15 Years | 0 (0.0%) | 0 (0.0%) |
| 16 and 17 Years | 21 (75.0%) | 0 (0.0%) |
| 18 to 24 Years | 0 (0.0%) | 0 (0.0%) |
| 25 to 34 Years | 0 (0.0%) | 0 (0.0%) |
| 35 to 44 Years | 4 (4.5%) | 10 (12.3%) |
| 45 to 54 Years | 39 (41.5%) | 32 (41.0%) |
| 55 to 64 Years | 5 (3.5%) | 8 (7.1%) |
| 65 to 74 Years | 6 (5.9%) | 10 (5.6%) |
| 75 Years and over | 0 (0.0%) | 6 (7.3%) |
| Total | 109 (14.3%) | 74 (10.0%) |
Income Above Poverty by Sex and Age in Daniels County
According to the poverty statistics in Daniels County, males aged under 5 years and females aged 5 years are the age groups that are most secure financially, with 100.0% of males and 100.0% of females in these age groups living above the poverty line.
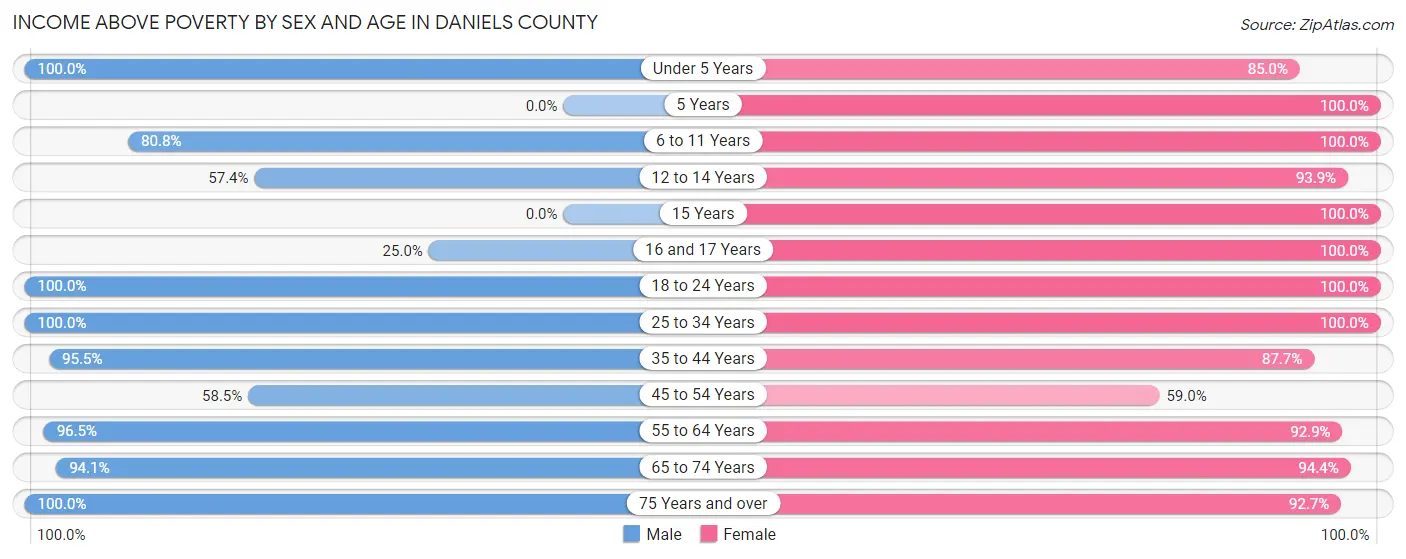
| Age Bracket | Male | Female |
| Under 5 Years | 24 (100.0%) | 34 (85.0%) |
| 5 Years | 0 (0.0%) | 3 (100.0%) |
| 6 to 11 Years | 21 (80.8%) | 9 (100.0%) |
| 12 to 14 Years | 39 (57.4%) | 31 (93.9%) |
| 15 Years | 0 (0.0%) | 12 (100.0%) |
| 16 and 17 Years | 7 (25.0%) | 34 (100.0%) |
| 18 to 24 Years | 50 (100.0%) | 19 (100.0%) |
| 25 to 34 Years | 70 (100.0%) | 54 (100.0%) |
| 35 to 44 Years | 84 (95.5%) | 71 (87.6%) |
| 45 to 54 Years | 55 (58.5%) | 46 (59.0%) |
| 55 to 64 Years | 136 (96.5%) | 105 (92.9%) |
| 65 to 74 Years | 96 (94.1%) | 170 (94.4%) |
| 75 Years and over | 72 (100.0%) | 76 (92.7%) |
| Total | 654 (85.7%) | 664 (90.0%) |
Income Below Poverty Among Married-Couple Families in Daniels County
The poverty statistics for married-couple families in Daniels County show that 8.1% or 26 of the total 322 families live below the poverty line. Families with 1 or 2 children have the highest poverty rate of 14.6%, comprising of 12 families. On the other hand, families with 3 or 4 children have the lowest poverty rate of 0.0%, which includes 0 families.
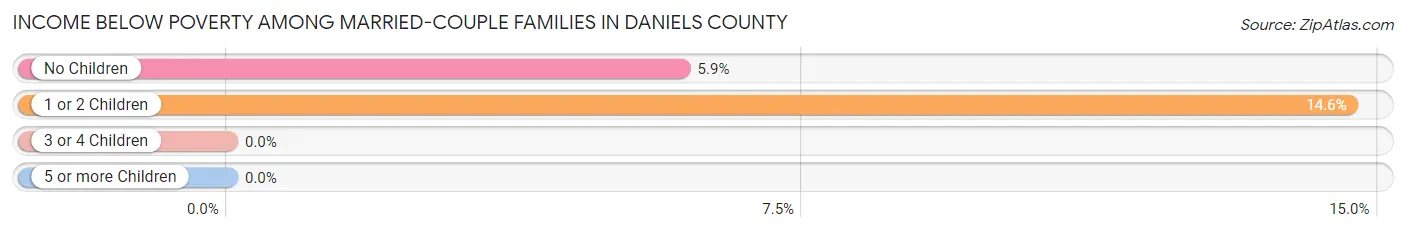
| Children | Above Poverty | Below Poverty |
| No Children | 223 (94.1%) | 14 (5.9%) |
| 1 or 2 Children | 70 (85.4%) | 12 (14.6%) |
| 3 or 4 Children | 3 (100.0%) | 0 (0.0%) |
| 5 or more Children | 0 (0.0%) | 0 (0.0%) |
| Total | 296 (91.9%) | 26 (8.1%) |
Income Below Poverty Among Single-Parent Households in Daniels County
According to the poverty data in Daniels County, 42.9% or 9 single-father households and 29.4% or 10 single-mother households are living below the poverty line. Among single-father households, those with 1 or 2 children have the highest poverty rate, with 9 households (56.2%) experiencing poverty. Likewise, among single-mother households, those with 1 or 2 children have the highest poverty rate, with 10 households (41.7%) falling below the poverty line.
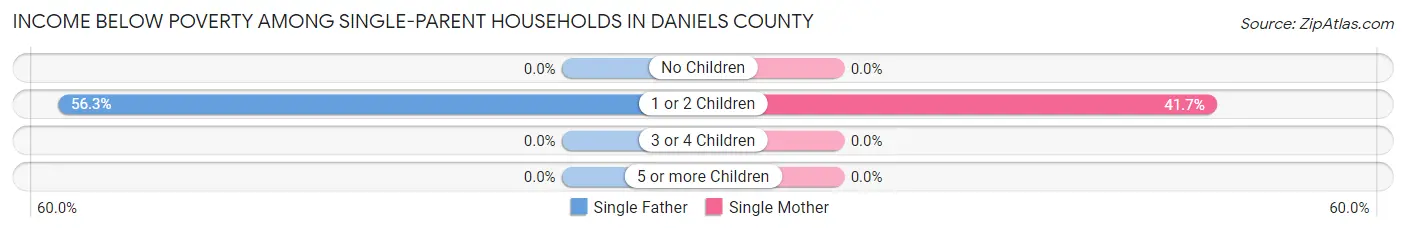
| Children | Single Father | Single Mother |
| No Children | 0 (0.0%) | 0 (0.0%) |
| 1 or 2 Children | 9 (56.2%) | 10 (41.7%) |
| 3 or 4 Children | 0 (0.0%) | 0 (0.0%) |
| 5 or more Children | 0 (0.0%) | 0 (0.0%) |
| Total | 9 (42.9%) | 10 (29.4%) |
Income Below Poverty Among Married-Couple vs Single-Parent Households in Daniels County
The poverty data for Daniels County shows that 26 of the married-couple family households (8.1%) and 19 of the single-parent households (34.5%) are living below the poverty level. Within the married-couple family households, those with 1 or 2 children have the highest poverty rate, with 12 households (14.6%) falling below the poverty line. Among the single-parent households, those with 1 or 2 children have the highest poverty rate, with 19 household (47.5%) living below poverty.
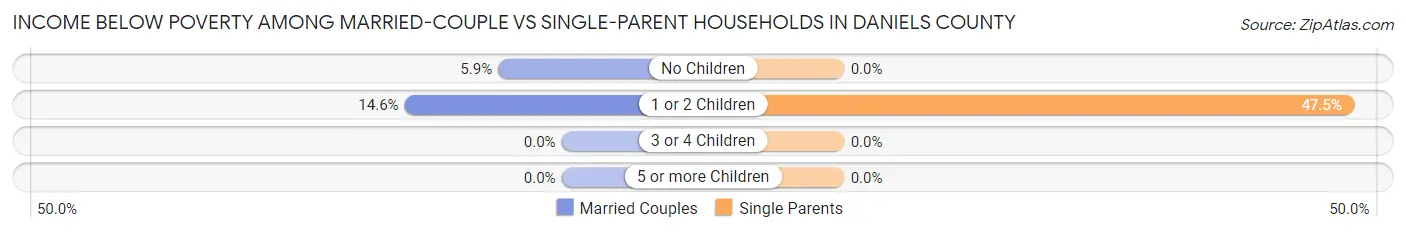
| Children | Married-Couple Families | Single-Parent Households |
| No Children | 14 (5.9%) | 0 (0.0%) |
| 1 or 2 Children | 12 (14.6%) | 19 (47.5%) |
| 3 or 4 Children | 0 (0.0%) | 0 (0.0%) |
| 5 or more Children | 0 (0.0%) | 0 (0.0%) |
| Total | 26 (8.1%) | 19 (34.5%) |
Employment Characteristics in Daniels County
Employment by Class of Employer in Daniels County
Among the 762 employed individuals in Daniels County, private company employees (305 | 40.0%), self-employed (not incorporated) (127 | 16.7%), and self-employed (incorporated) (103 | 13.5%) make up the most common classes of employment.
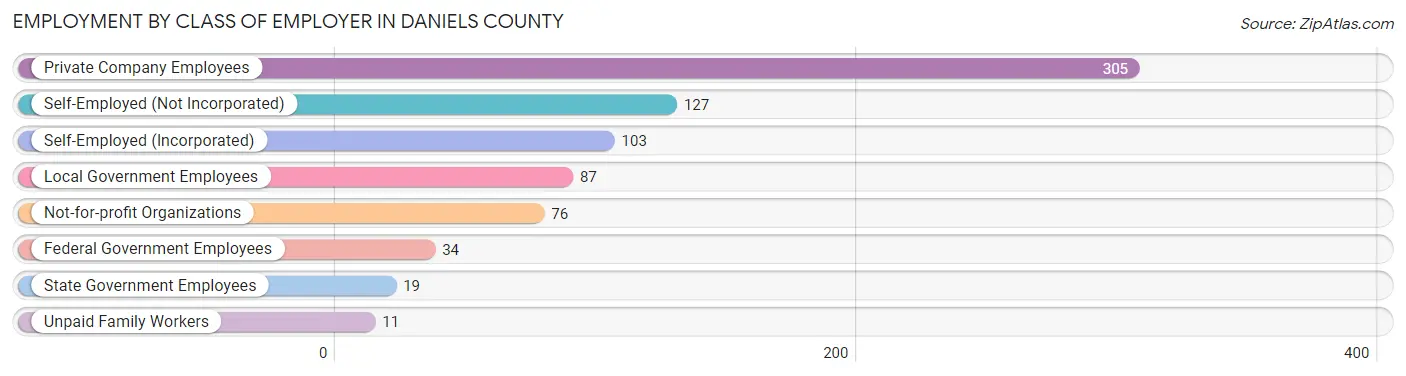
| Employer Class | # Employees | % Employees |
| Private Company Employees | 305 | 40.0% |
| Self-Employed (Incorporated) | 103 | 13.5% |
| Self-Employed (Not Incorporated) | 127 | 16.7% |
| Not-for-profit Organizations | 76 | 10.0% |
| Local Government Employees | 87 | 11.4% |
| State Government Employees | 19 | 2.5% |
| Federal Government Employees | 34 | 4.5% |
| Unpaid Family Workers | 11 | 1.4% |
| Total | 762 | 100.0% |
Employment Status by Age in Daniels County
According to the labor force statistics for Daniels County, out of the total population over 16 years of age (1,311), 60.7% or 796 individuals are in the labor force, with 1.5% or 12 of them unemployed. The age group with the highest labor force participation rate is 25 to 29 years, with 100.0% or 48 individuals in the labor force. Within the labor force, the 35 to 44 years age range has the highest percentage of unemployed individuals, with 5.8% or 9 of them being unemployed.
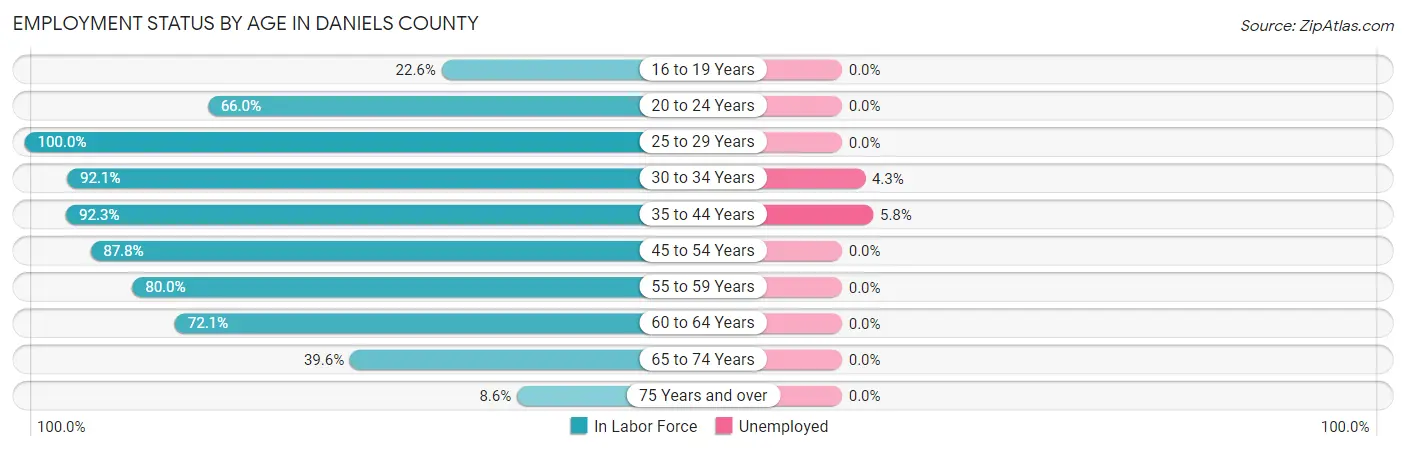
| Age Bracket | In Labor Force | Unemployed |
| 16 to 19 Years | 19 (22.6%) | 0 (0.0%) |
| 20 to 24 Years | 31 (66.0%) | 0 (0.0%) |
| 25 to 29 Years | 48 (100.0%) | 0 (0.0%) |
| 30 to 34 Years | 70 (92.1%) | 3 (4.3%) |
| 35 to 44 Years | 156 (92.3%) | 9 (5.8%) |
| 45 to 54 Years | 151 (87.8%) | 0 (0.0%) |
| 55 to 59 Years | 88 (80.0%) | 0 (0.0%) |
| 60 to 64 Years | 106 (72.1%) | 0 (0.0%) |
| 65 to 74 Years | 112 (39.6%) | 0 (0.0%) |
| 75 Years and over | 15 (8.6%) | 0 (0.0%) |
| Total | 796 (60.7%) | 12 (1.5%) |
Employment Status by Educational Attainment in Daniels County
According to labor force statistics for Daniels County, 85.7% of individuals (619) out of the total population between 25 and 64 years of age (722) are in the labor force, with 1.9% or 12 of them being unemployed. The group with the highest labor force participation rate are those with the educational attainment of bachelor's degree or higher, with 92.8% or 194 individuals in the labor force. Within the labor force, individuals with bachelor's degree or higher education have the highest percentage of unemployment, with 2.6% or 5 of them being unemployed.
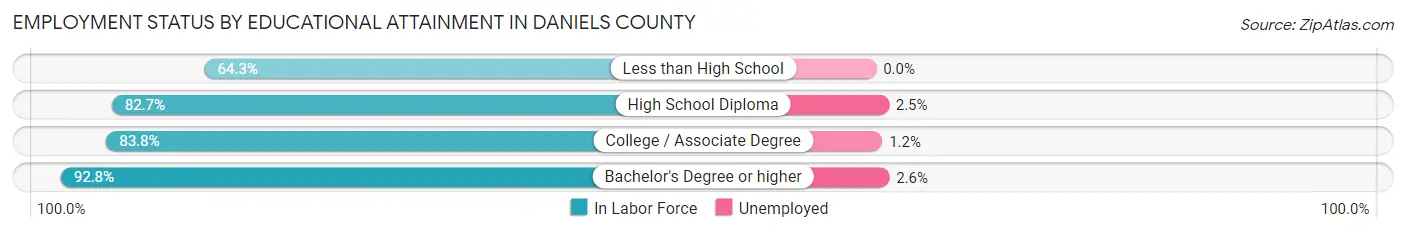
| Educational Attainment | In Labor Force | Unemployed |
| Less than High School | 9 (64.3%) | 0 (0.0%) |
| High School Diploma | 163 (82.7%) | 5 (2.5%) |
| College / Associate Degree | 253 (83.8%) | 4 (1.2%) |
| Bachelor's Degree or higher | 194 (92.8%) | 5 (2.6%) |
| Total | 619 (85.7%) | 14 (1.9%) |
Employment Occupations by Sex in Daniels County
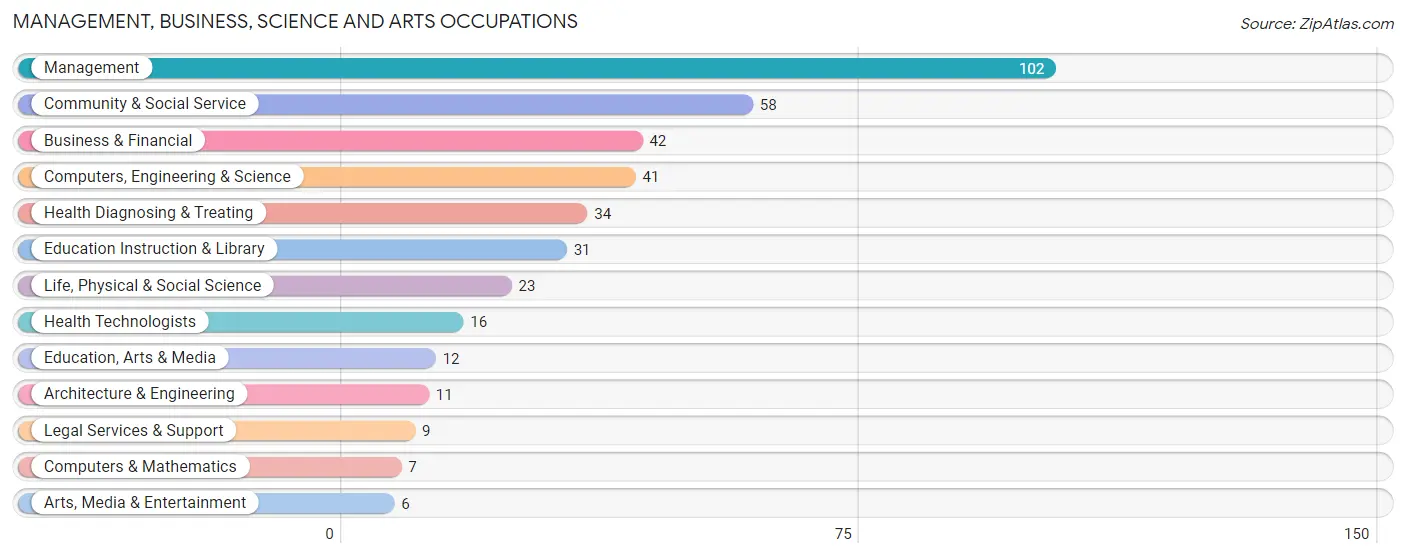
Management, Business, Science and Arts Occupations
The most common Management, Business, Science and Arts occupations in Daniels County are Management (102 | 13.0%), Community & Social Service (58 | 7.4%), Business & Financial (42 | 5.4%), Computers, Engineering & Science (41 | 5.2%), and Health Diagnosing & Treating (34 | 4.3%).
Management, Business, Science and Arts Occupations by Sex
Within the Management, Business, Science and Arts occupations in Daniels County, the most male-oriented occupations are Architecture & Engineering (100.0%), Management (85.3%), and Arts, Media & Entertainment (66.7%), while the most female-oriented occupations are Computers & Mathematics (100.0%), Education, Arts & Media (100.0%), and Health Diagnosing & Treating (100.0%).
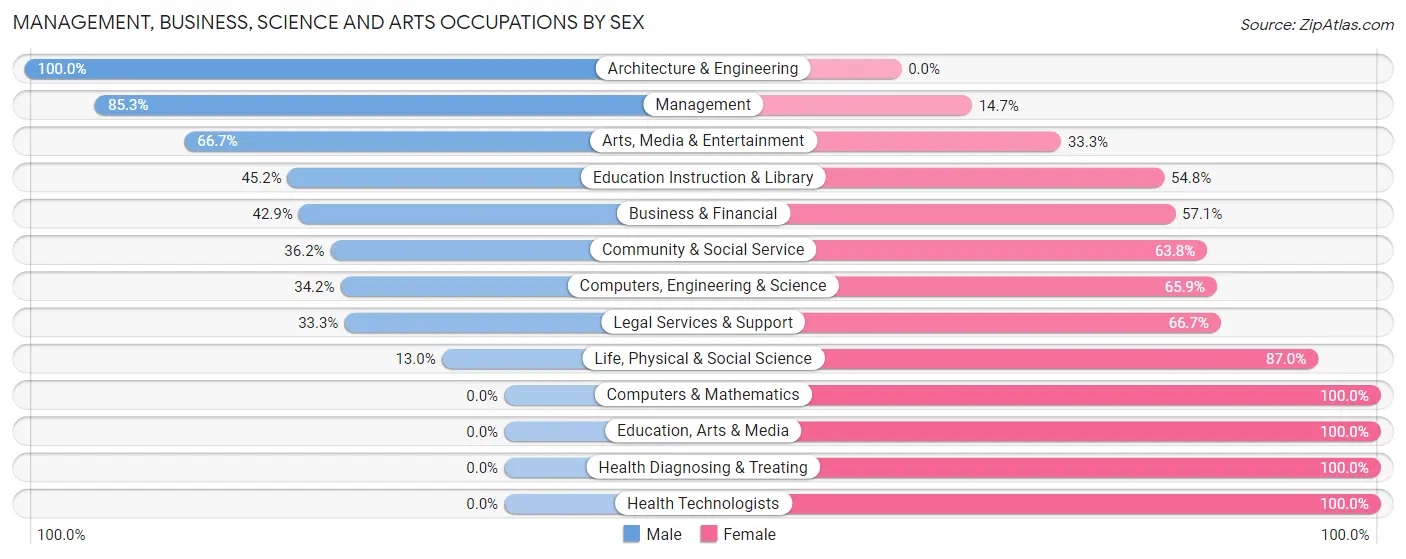
| Occupation | Male | Female |
| Management | 87 (85.3%) | 15 (14.7%) |
| Business & Financial | 18 (42.9%) | 24 (57.1%) |
| Computers, Engineering & Science | 14 (34.2%) | 27 (65.8%) |
| Computers & Mathematics | 0 (0.0%) | 7 (100.0%) |
| Architecture & Engineering | 11 (100.0%) | 0 (0.0%) |
| Life, Physical & Social Science | 3 (13.0%) | 20 (87.0%) |
| Community & Social Service | 21 (36.2%) | 37 (63.8%) |
| Education, Arts & Media | 0 (0.0%) | 12 (100.0%) |
| Legal Services & Support | 3 (33.3%) | 6 (66.7%) |
| Education Instruction & Library | 14 (45.2%) | 17 (54.8%) |
| Arts, Media & Entertainment | 4 (66.7%) | 2 (33.3%) |
| Health Diagnosing & Treating | 0 (0.0%) | 34 (100.0%) |
| Health Technologists | 0 (0.0%) | 16 (100.0%) |
| Total (Category) | 140 (50.5%) | 137 (49.5%) |
| Total (Overall) | 458 (58.4%) | 326 (41.6%) |
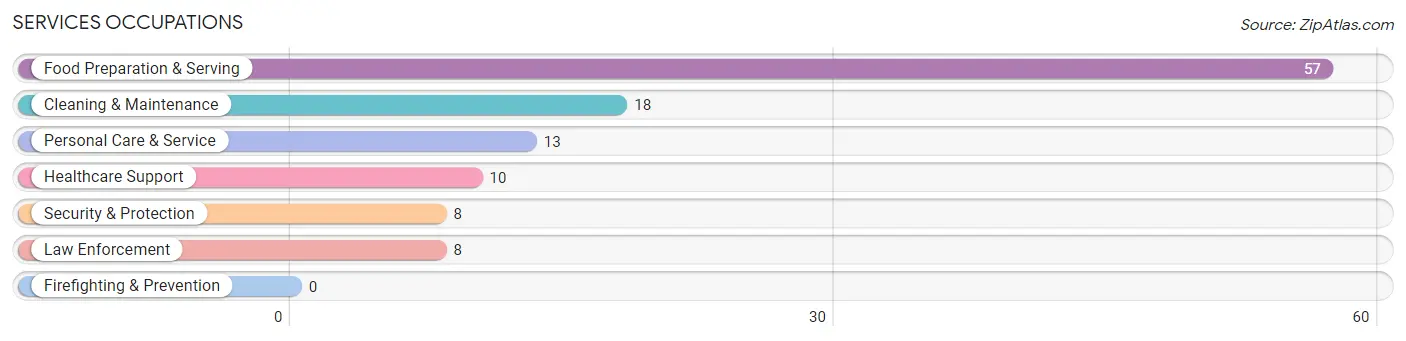
Services Occupations
The most common Services occupations in Daniels County are Food Preparation & Serving (57 | 7.3%), Cleaning & Maintenance (18 | 2.3%), Personal Care & Service (13 | 1.7%), Healthcare Support (10 | 1.3%), and Security & Protection (8 | 1.0%).
Services Occupations by Sex
Within the Services occupations in Daniels County, the most male-oriented occupations are Security & Protection (100.0%), Law Enforcement (100.0%), and Food Preparation & Serving (56.1%), while the most female-oriented occupations are Healthcare Support (100.0%), Personal Care & Service (84.6%), and Cleaning & Maintenance (50.0%).
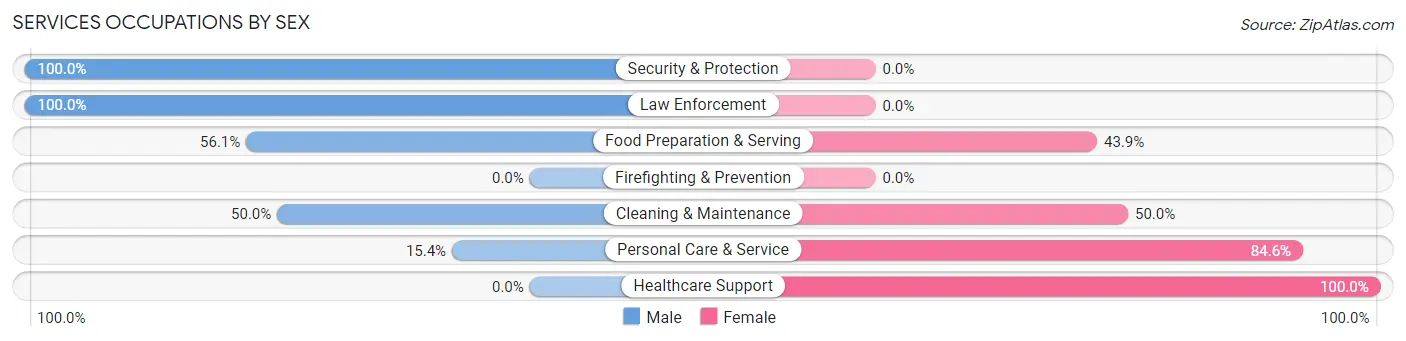
| Occupation | Male | Female |
| Healthcare Support | 0 (0.0%) | 10 (100.0%) |
| Security & Protection | 8 (100.0%) | 0 (0.0%) |
| Firefighting & Prevention | 0 (0.0%) | 0 (0.0%) |
| Law Enforcement | 8 (100.0%) | 0 (0.0%) |
| Food Preparation & Serving | 32 (56.1%) | 25 (43.9%) |
| Cleaning & Maintenance | 9 (50.0%) | 9 (50.0%) |
| Personal Care & Service | 2 (15.4%) | 11 (84.6%) |
| Total (Category) | 51 (48.1%) | 55 (51.9%) |
| Total (Overall) | 458 (58.4%) | 326 (41.6%) |
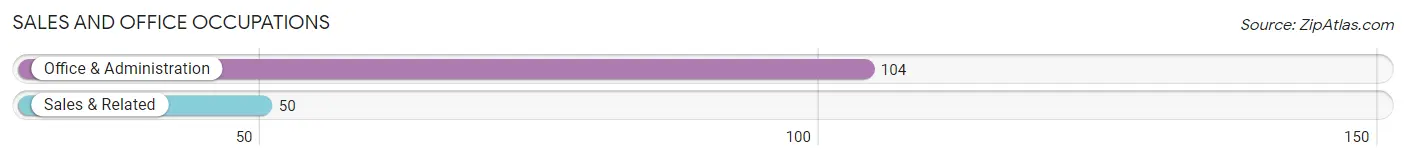
Sales and Office Occupations
The most common Sales and Office occupations in Daniels County are Office & Administration (104 | 13.3%), and Sales & Related (50 | 6.4%).
Sales and Office Occupations by Sex
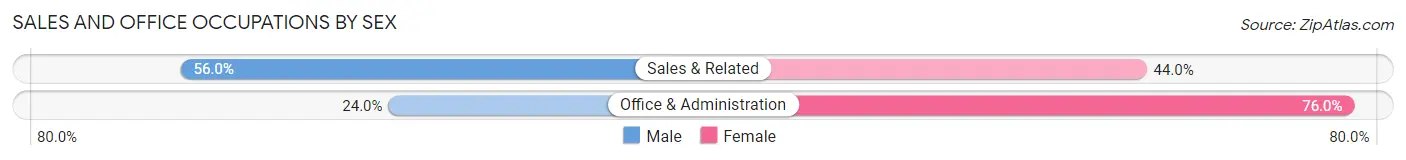
| Occupation | Male | Female |
| Sales & Related | 28 (56.0%) | 22 (44.0%) |
| Office & Administration | 25 (24.0%) | 79 (76.0%) |
| Total (Category) | 53 (34.4%) | 101 (65.6%) |
| Total (Overall) | 458 (58.4%) | 326 (41.6%) |
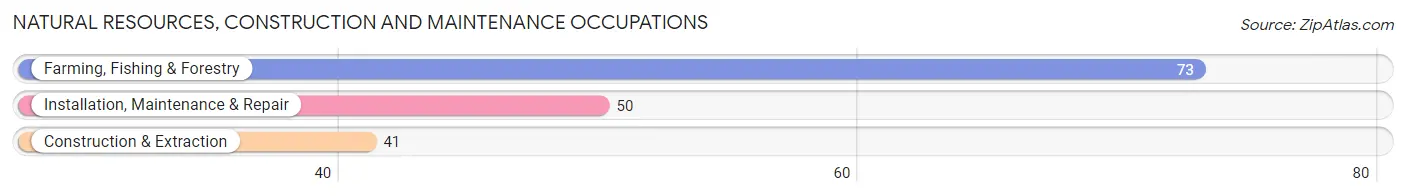
Natural Resources, Construction and Maintenance Occupations
The most common Natural Resources, Construction and Maintenance occupations in Daniels County are Farming, Fishing & Forestry (73 | 9.3%), Installation, Maintenance & Repair (50 | 6.4%), and Construction & Extraction (41 | 5.2%).
Natural Resources, Construction and Maintenance Occupations by Sex
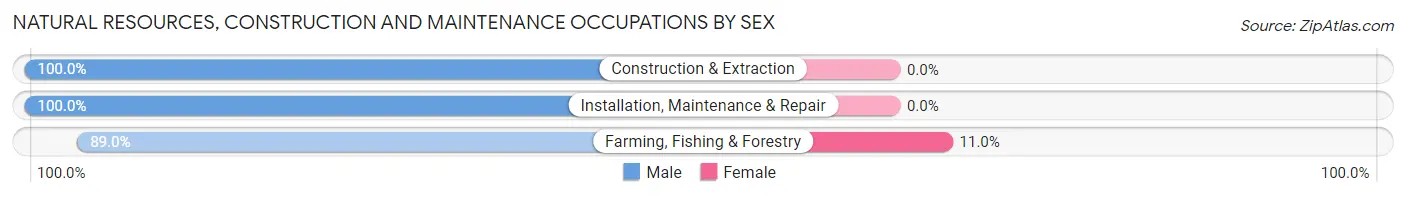
| Occupation | Male | Female |
| Farming, Fishing & Forestry | 65 (89.0%) | 8 (11.0%) |
| Construction & Extraction | 41 (100.0%) | 0 (0.0%) |
| Installation, Maintenance & Repair | 50 (100.0%) | 0 (0.0%) |
| Total (Category) | 156 (95.1%) | 8 (4.9%) |
| Total (Overall) | 458 (58.4%) | 326 (41.6%) |
Production, Transportation and Moving Occupations
The most common Production, Transportation and Moving occupations in Daniels County are Material Moving (36 | 4.6%), Production (25 | 3.2%), and Transportation (22 | 2.8%).
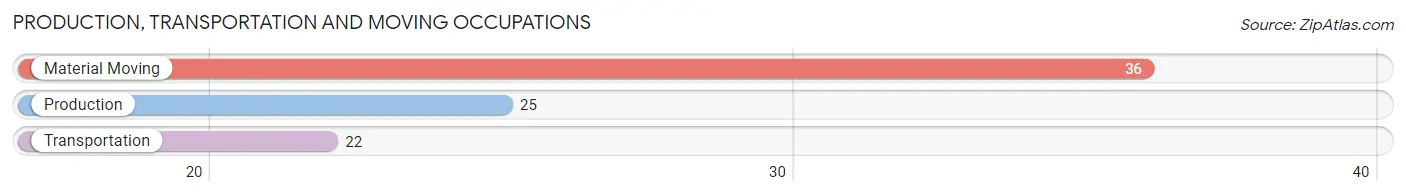
Production, Transportation and Moving Occupations by Sex
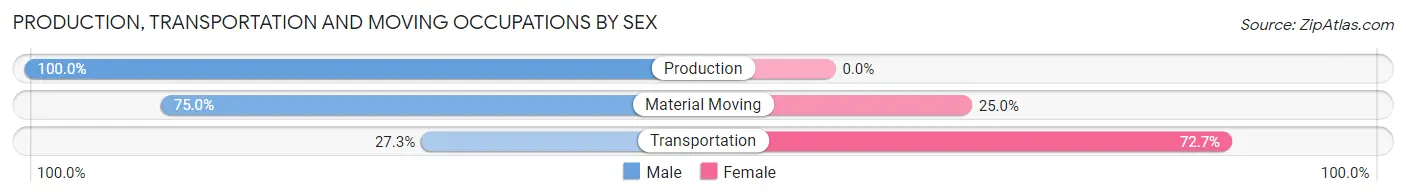
| Occupation | Male | Female |
| Production | 25 (100.0%) | 0 (0.0%) |
| Transportation | 6 (27.3%) | 16 (72.7%) |
| Material Moving | 27 (75.0%) | 9 (25.0%) |
| Total (Category) | 58 (69.9%) | 25 (30.1%) |
| Total (Overall) | 458 (58.4%) | 326 (41.6%) |
Employment Industries by Sex in Daniels County
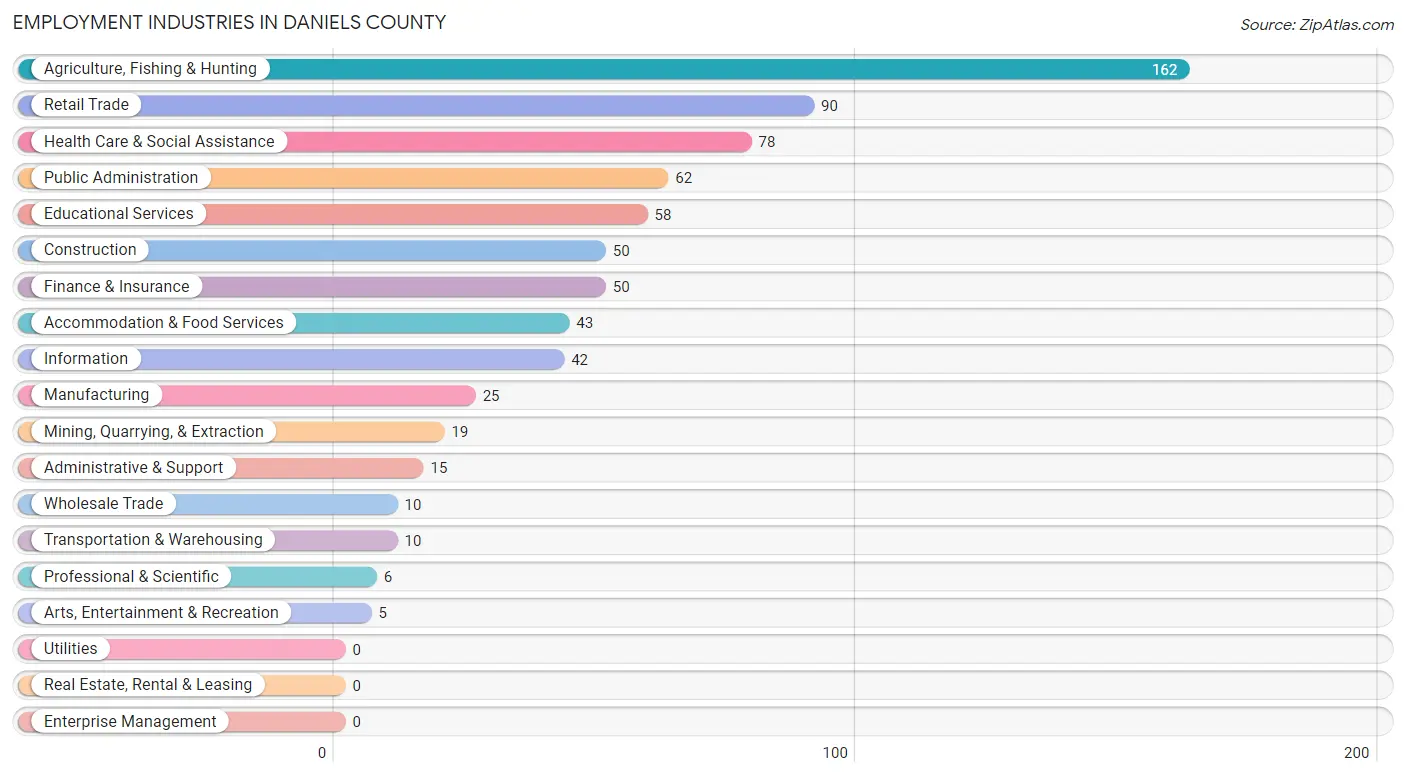
Employment Industries in Daniels County
The major employment industries in Daniels County include Agriculture, Fishing & Hunting (162 | 20.7%), Retail Trade (90 | 11.5%), Health Care & Social Assistance (78 | 10.0%), Public Administration (62 | 7.9%), and Educational Services (58 | 7.4%).
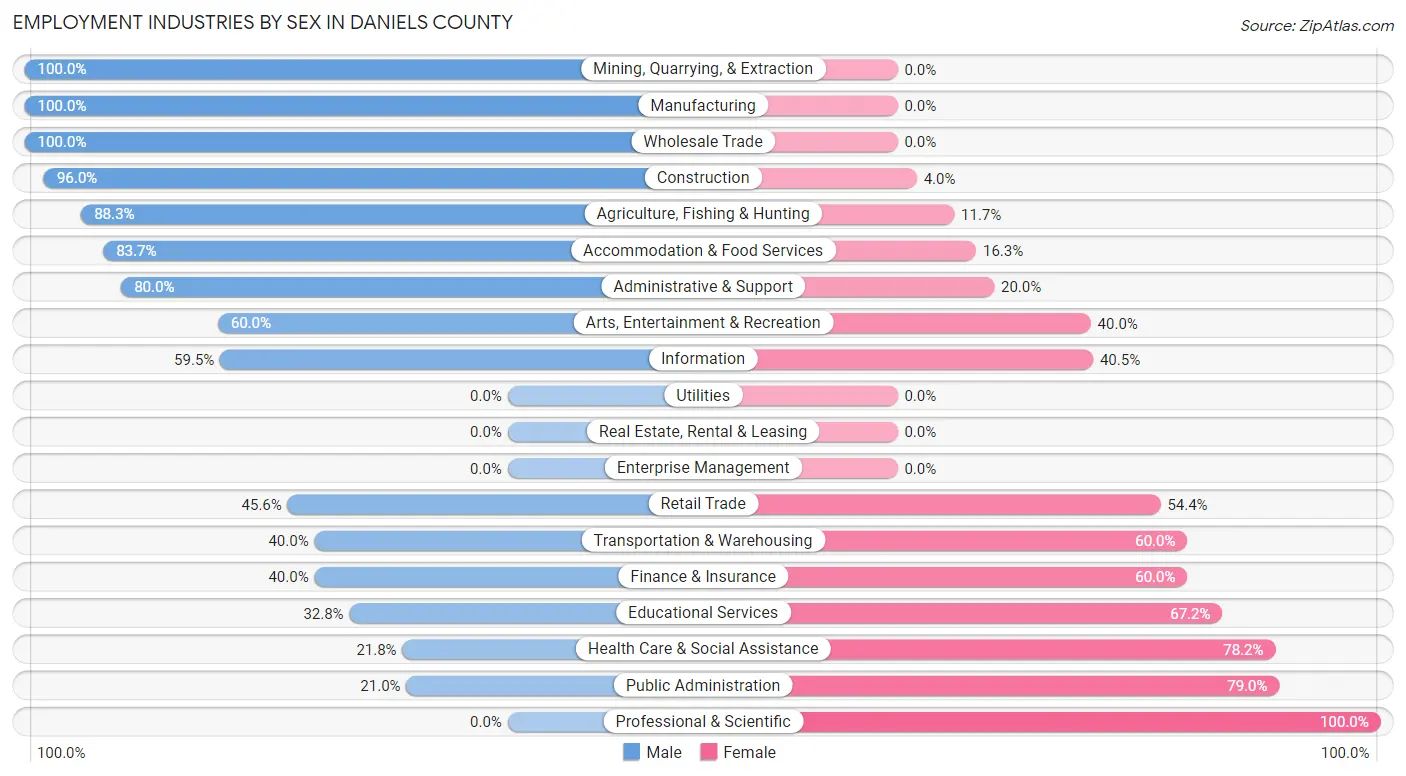
Employment Industries by Sex in Daniels County
The Daniels County industries that see more men than women are Mining, Quarrying, & Extraction (100.0%), Manufacturing (100.0%), and Wholesale Trade (100.0%), whereas the industries that tend to have a higher number of women are Professional & Scientific (100.0%), Public Administration (79.0%), and Health Care & Social Assistance (78.2%).
| Industry | Male | Female |
| Agriculture, Fishing & Hunting | 143 (88.3%) | 19 (11.7%) |
| Mining, Quarrying, & Extraction | 19 (100.0%) | 0 (0.0%) |
| Construction | 48 (96.0%) | 2 (4.0%) |
| Manufacturing | 25 (100.0%) | 0 (0.0%) |
| Wholesale Trade | 10 (100.0%) | 0 (0.0%) |
| Retail Trade | 41 (45.6%) | 49 (54.4%) |
| Transportation & Warehousing | 4 (40.0%) | 6 (60.0%) |
| Utilities | 0 (0.0%) | 0 (0.0%) |
| Information | 25 (59.5%) | 17 (40.5%) |
| Finance & Insurance | 20 (40.0%) | 30 (60.0%) |
| Real Estate, Rental & Leasing | 0 (0.0%) | 0 (0.0%) |
| Professional & Scientific | 0 (0.0%) | 6 (100.0%) |
| Enterprise Management | 0 (0.0%) | 0 (0.0%) |
| Administrative & Support | 12 (80.0%) | 3 (20.0%) |
| Educational Services | 19 (32.8%) | 39 (67.2%) |
| Health Care & Social Assistance | 17 (21.8%) | 61 (78.2%) |
| Arts, Entertainment & Recreation | 3 (60.0%) | 2 (40.0%) |
| Accommodation & Food Services | 36 (83.7%) | 7 (16.3%) |
| Public Administration | 13 (21.0%) | 49 (79.0%) |
| Total | 458 (58.4%) | 326 (41.6%) |
Education in Daniels County
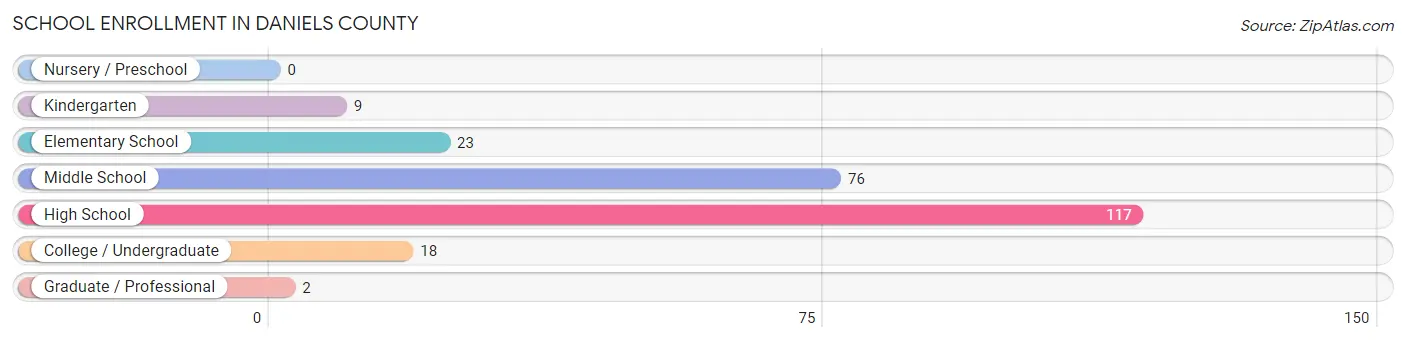
School Enrollment in Daniels County
The most common levels of schooling among the 245 students in Daniels County are high school (117 | 47.8%), middle school (76 | 31.0%), and elementary school (23 | 9.4%).
| School Level | # Students | % Students |
| Nursery / Preschool | 0 | 0.0% |
| Kindergarten | 9 | 3.7% |
| Elementary School | 23 | 9.4% |
| Middle School | 76 | 31.0% |
| High School | 117 | 47.8% |
| College / Undergraduate | 18 | 7.3% |
| Graduate / Professional | 2 | 0.8% |
| Total | 245 | 100.0% |
School Enrollment by Age by Funding Source in Daniels County
Out of a total of 245 students who are enrolled in schools in Daniels County, 27 (11.0%) attend a private institution, while the remaining 218 (89.0%) are enrolled in public schools. The age group of 35 years and over has the highest likelihood of being enrolled in private schools, with 5 (45.5% in the age bracket) enrolled. Conversely, the age group of 25 to 34 year olds has the lowest likelihood of being enrolled in a private school, with 9 (100.0% in the age bracket) attending a public institution.
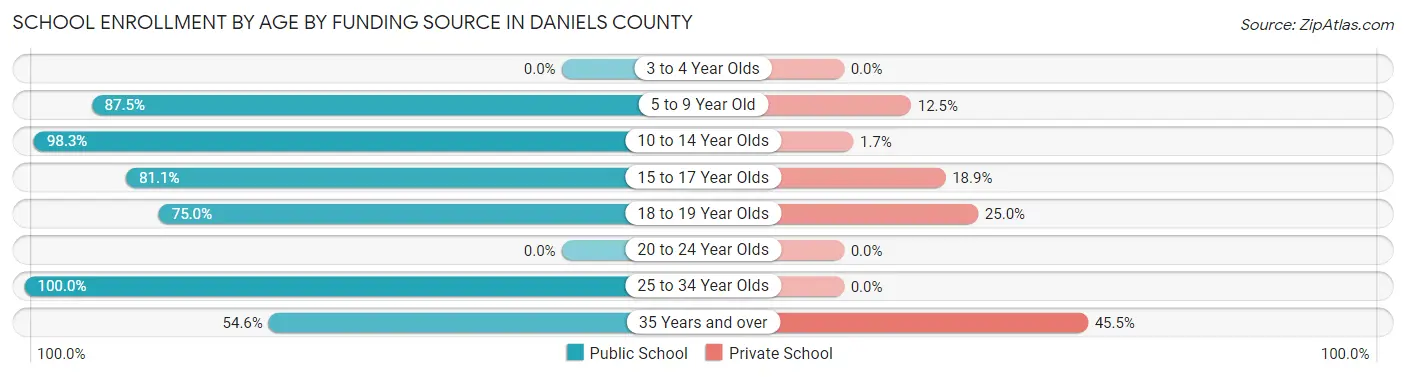
| Age Bracket | Public School | Private School |
| 3 to 4 Year Olds | 0 (0.0%) | 0 (0.0%) |
| 5 to 9 Year Old | 21 (87.5%) | 3 (12.5%) |
| 10 to 14 Year Olds | 113 (98.3%) | 2 (1.7%) |
| 15 to 17 Year Olds | 60 (81.1%) | 14 (18.9%) |
| 18 to 19 Year Olds | 9 (75.0%) | 3 (25.0%) |
| 20 to 24 Year Olds | 0 (0.0%) | 0 (0.0%) |
| 25 to 34 Year Olds | 9 (100.0%) | 0 (0.0%) |
| 35 Years and over | 6 (54.5%) | 5 (45.5%) |
| Total | 218 (89.0%) | 27 (11.0%) |
Educational Attainment by Field of Study in Daniels County
Education (108 | 31.3%), business (70 | 20.3%), bio, nature & agricultural (36 | 10.4%), social sciences (36 | 10.4%), and arts & humanities (29 | 8.4%) are the most common fields of study among 345 individuals in Daniels County who have obtained a bachelor's degree or higher.
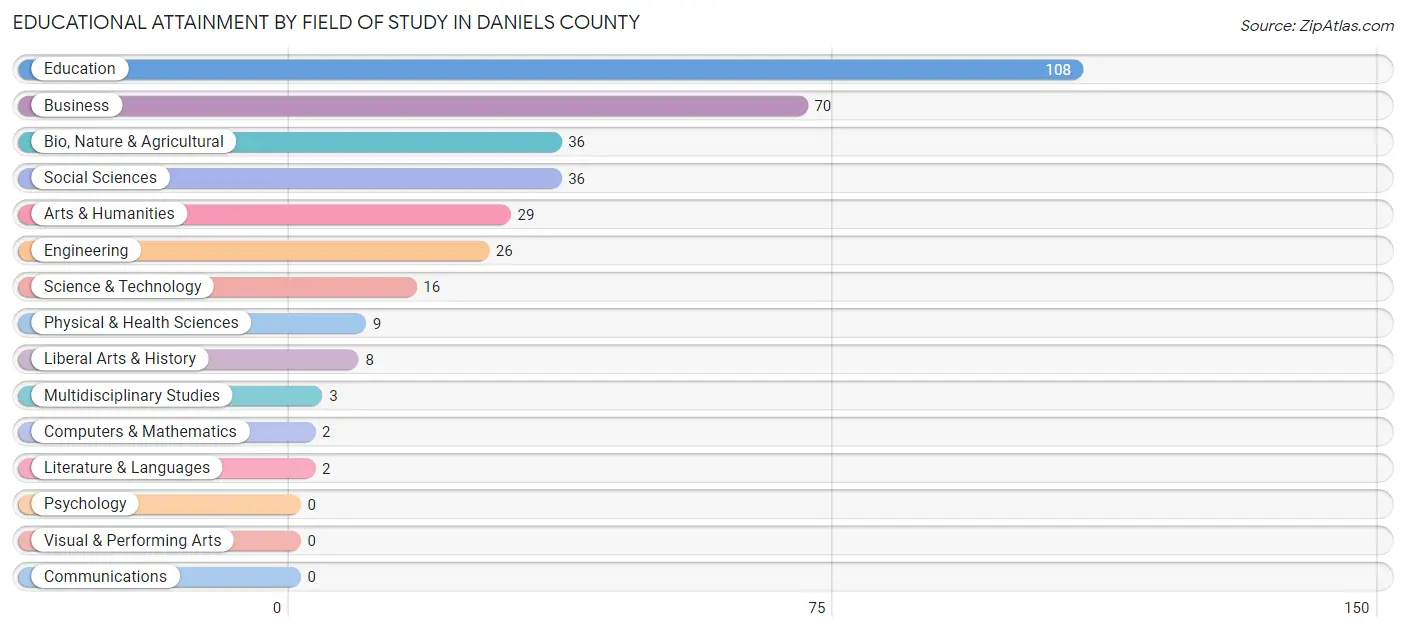
| Field of Study | # Graduates | % Graduates |
| Computers & Mathematics | 2 | 0.6% |
| Bio, Nature & Agricultural | 36 | 10.4% |
| Physical & Health Sciences | 9 | 2.6% |
| Psychology | 0 | 0.0% |
| Social Sciences | 36 | 10.4% |
| Engineering | 26 | 7.5% |
| Multidisciplinary Studies | 3 | 0.9% |
| Science & Technology | 16 | 4.6% |
| Business | 70 | 20.3% |
| Education | 108 | 31.3% |
| Literature & Languages | 2 | 0.6% |
| Liberal Arts & History | 8 | 2.3% |
| Visual & Performing Arts | 0 | 0.0% |
| Communications | 0 | 0.0% |
| Arts & Humanities | 29 | 8.4% |
| Total | 345 | 100.0% |
Transportation & Commute in Daniels County
Vehicle Availability by Sex in Daniels County
The most prevalent vehicle ownership categories in Daniels County are males with 2 vehicles (146, accounting for 32.7%) and females with 2 vehicles (135, making up 46.2%).
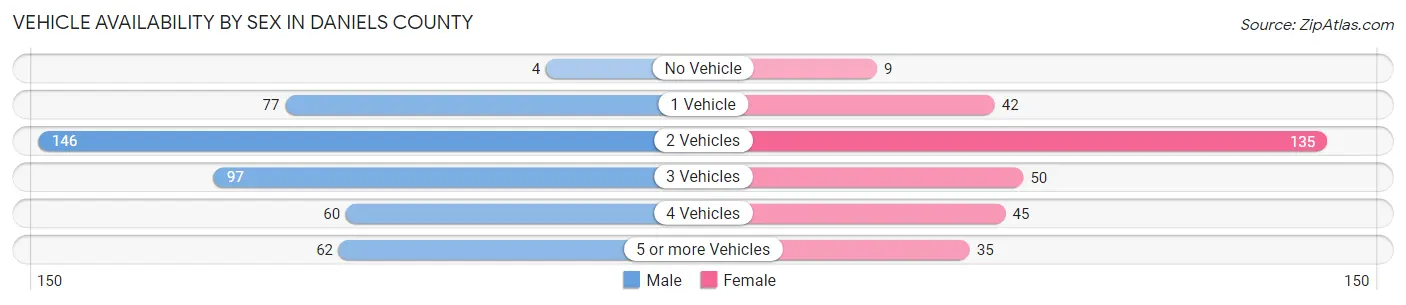
| Vehicles Available | Male | Female |
| No Vehicle | 4 (0.9%) | 9 (2.9%) |
| 1 Vehicle | 77 (17.3%) | 42 (13.3%) |
| 2 Vehicles | 146 (32.7%) | 135 (42.7%) |
| 3 Vehicles | 97 (21.7%) | 50 (15.8%) |
| 4 Vehicles | 60 (13.5%) | 45 (14.2%) |
| 5 or more Vehicles | 62 (13.9%) | 35 (11.1%) |
| Total | 446 (100.0%) | 316 (100.0%) |
Commute Time in Daniels County
The most frequently occuring commute durations in Daniels County are 5 to 9 minutes (195 commuters, 28.8%), less than 5 minutes (157 commuters, 23.2%), and 10 to 14 minutes (121 commuters, 17.9%).
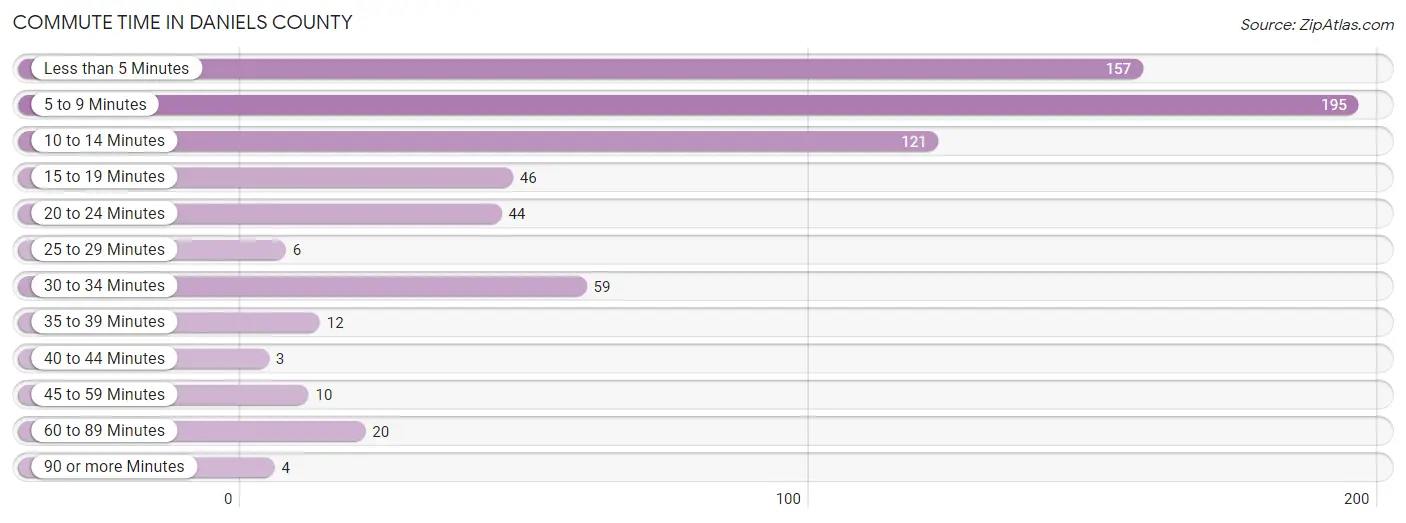
| Commute Time | # Commuters | % Commuters |
| Less than 5 Minutes | 157 | 23.2% |
| 5 to 9 Minutes | 195 | 28.8% |
| 10 to 14 Minutes | 121 | 17.9% |
| 15 to 19 Minutes | 46 | 6.8% |
| 20 to 24 Minutes | 44 | 6.5% |
| 25 to 29 Minutes | 6 | 0.9% |
| 30 to 34 Minutes | 59 | 8.7% |
| 35 to 39 Minutes | 12 | 1.8% |
| 40 to 44 Minutes | 3 | 0.4% |
| 45 to 59 Minutes | 10 | 1.5% |
| 60 to 89 Minutes | 20 | 2.9% |
| 90 or more Minutes | 4 | 0.6% |
Commute Time by Sex in Daniels County
The most common commute times in Daniels County are less than 5 minutes (113 commuters, 28.4%) for males and 5 to 9 minutes (93 commuters, 33.3%) for females.
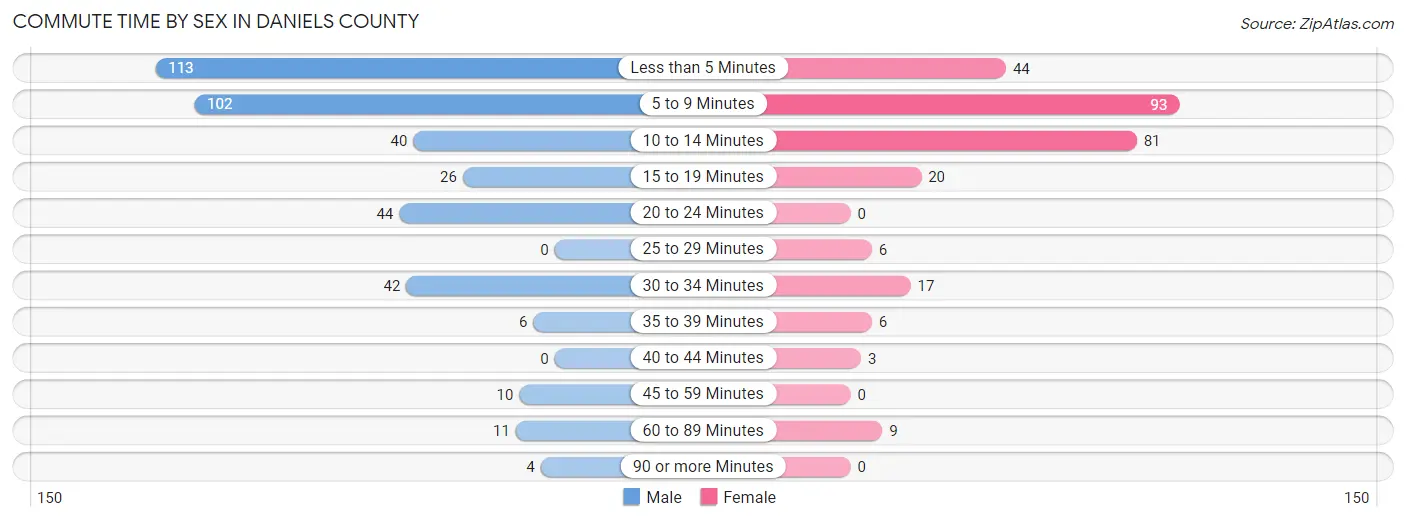
| Commute Time | Male | Female |
| Less than 5 Minutes | 113 (28.4%) | 44 (15.8%) |
| 5 to 9 Minutes | 102 (25.6%) | 93 (33.3%) |
| 10 to 14 Minutes | 40 (10.1%) | 81 (29.0%) |
| 15 to 19 Minutes | 26 (6.5%) | 20 (7.2%) |
| 20 to 24 Minutes | 44 (11.1%) | 0 (0.0%) |
| 25 to 29 Minutes | 0 (0.0%) | 6 (2.1%) |
| 30 to 34 Minutes | 42 (10.5%) | 17 (6.1%) |
| 35 to 39 Minutes | 6 (1.5%) | 6 (2.1%) |
| 40 to 44 Minutes | 0 (0.0%) | 3 (1.1%) |
| 45 to 59 Minutes | 10 (2.5%) | 0 (0.0%) |
| 60 to 89 Minutes | 11 (2.8%) | 9 (3.2%) |
| 90 or more Minutes | 4 (1.0%) | 0 (0.0%) |
Time of Departure to Work by Sex in Daniels County
The most frequent times of departure to work in Daniels County are 7:30 AM to 7:59 AM (124, 31.2%) for males and 7:30 AM to 7:59 AM (68, 24.4%) for females.
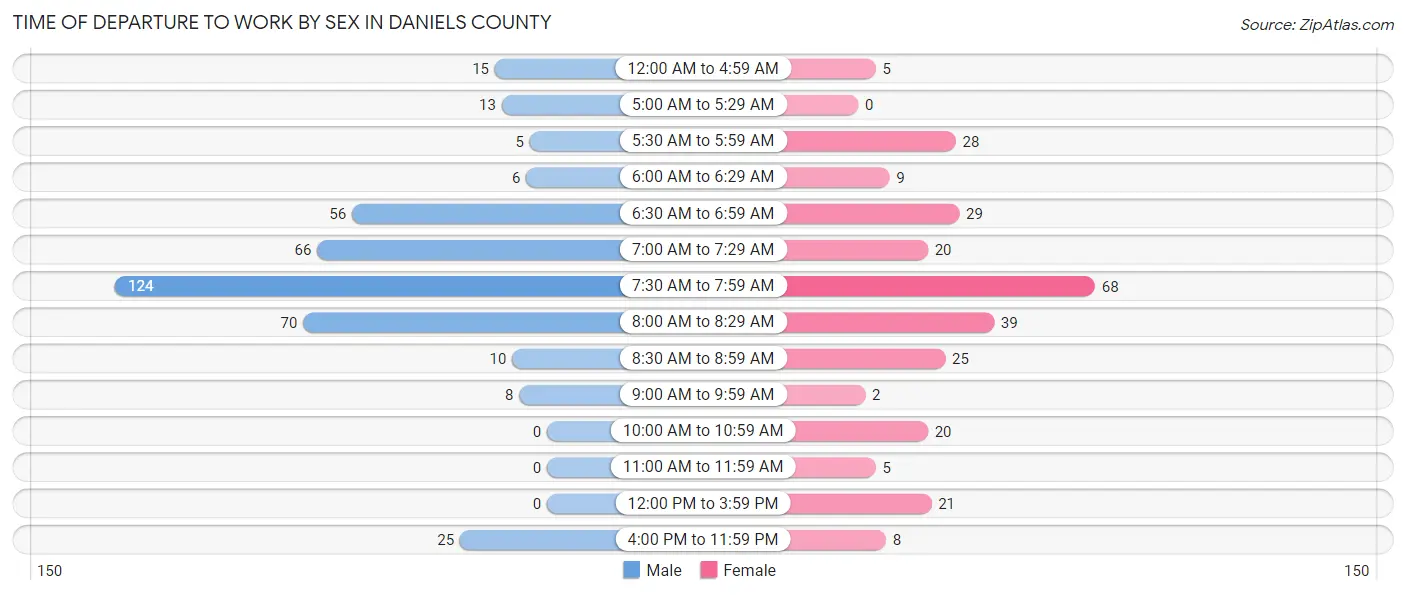
| Time of Departure | Male | Female |
| 12:00 AM to 4:59 AM | 15 (3.8%) | 5 (1.8%) |
| 5:00 AM to 5:29 AM | 13 (3.3%) | 0 (0.0%) |
| 5:30 AM to 5:59 AM | 5 (1.3%) | 28 (10.0%) |
| 6:00 AM to 6:29 AM | 6 (1.5%) | 9 (3.2%) |
| 6:30 AM to 6:59 AM | 56 (14.1%) | 29 (10.4%) |
| 7:00 AM to 7:29 AM | 66 (16.6%) | 20 (7.2%) |
| 7:30 AM to 7:59 AM | 124 (31.2%) | 68 (24.4%) |
| 8:00 AM to 8:29 AM | 70 (17.6%) | 39 (14.0%) |
| 8:30 AM to 8:59 AM | 10 (2.5%) | 25 (9.0%) |
| 9:00 AM to 9:59 AM | 8 (2.0%) | 2 (0.7%) |
| 10:00 AM to 10:59 AM | 0 (0.0%) | 20 (7.2%) |
| 11:00 AM to 11:59 AM | 0 (0.0%) | 5 (1.8%) |
| 12:00 PM to 3:59 PM | 0 (0.0%) | 21 (7.5%) |
| 4:00 PM to 11:59 PM | 25 (6.3%) | 8 (2.9%) |
| Total | 398 (100.0%) | 279 (100.0%) |
Housing Occupancy in Daniels County
Occupancy by Ownership in Daniels County
Of the total 714 dwellings in Daniels County, owner-occupied units account for 576 (80.7%), while renter-occupied units make up 138 (19.3%).
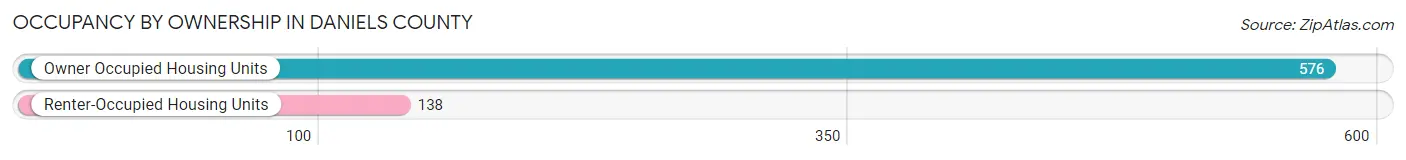
| Occupancy | # Housing Units | % Housing Units |
| Owner Occupied Housing Units | 576 | 80.7% |
| Renter-Occupied Housing Units | 138 | 19.3% |
| Total Occupied Housing Units | 714 | 100.0% |
Occupancy by Household Size in Daniels County
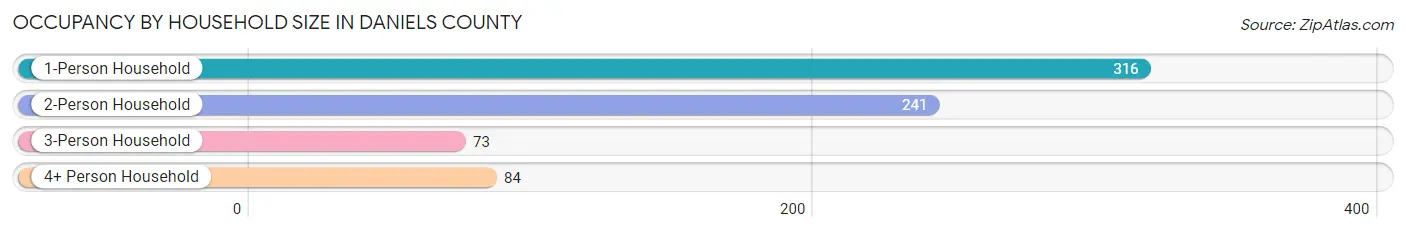
| Household Size | # Housing Units | % Housing Units |
| 1-Person Household | 316 | 44.3% |
| 2-Person Household | 241 | 33.8% |
| 3-Person Household | 73 | 10.2% |
| 4+ Person Household | 84 | 11.8% |
| Total Housing Units | 714 | 100.0% |
Occupancy by Ownership by Household Size in Daniels County
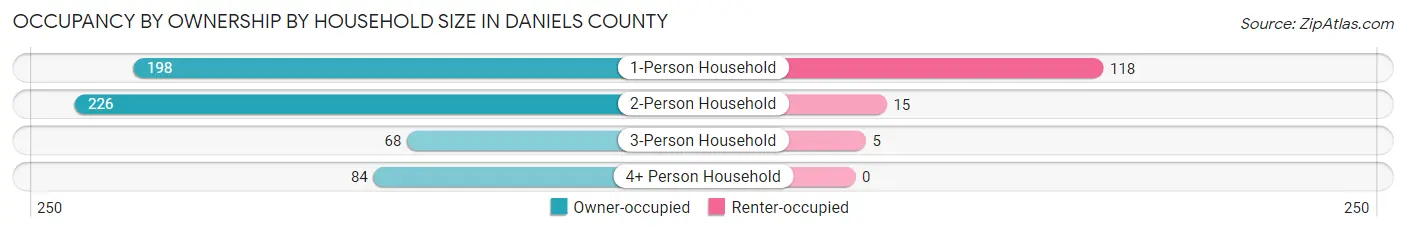
| Household Size | Owner-occupied | Renter-occupied |
| 1-Person Household | 198 (62.7%) | 118 (37.3%) |
| 2-Person Household | 226 (93.8%) | 15 (6.2%) |
| 3-Person Household | 68 (93.1%) | 5 (6.9%) |
| 4+ Person Household | 84 (100.0%) | 0 (0.0%) |
| Total Housing Units | 576 (80.7%) | 138 (19.3%) |
Occupancy by Educational Attainment in Daniels County
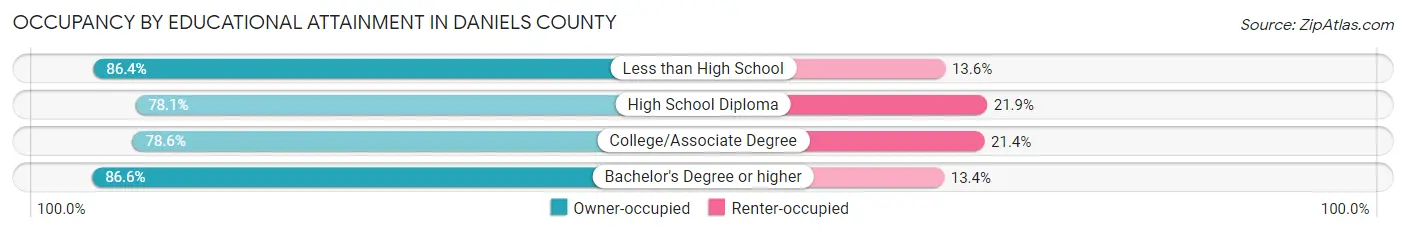
| Household Size | Owner-occupied | Renter-occupied |
| Less than High School | 19 (86.4%) | 3 (13.6%) |
| High School Diploma | 178 (78.1%) | 50 (21.9%) |
| College/Associate Degree | 224 (78.6%) | 61 (21.4%) |
| Bachelor's Degree or higher | 155 (86.6%) | 24 (13.4%) |
Occupancy by Age of Householder in Daniels County
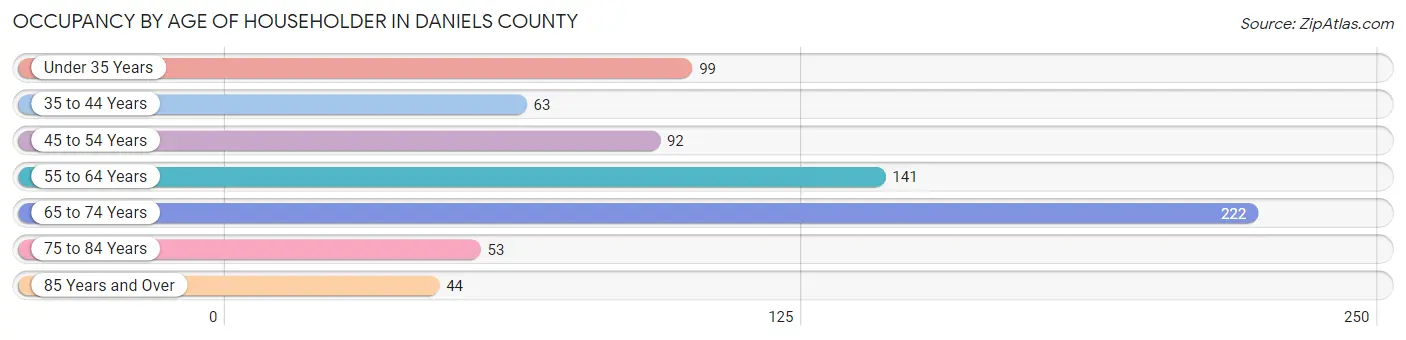
| Age Bracket | # Households | % Households |
| Under 35 Years | 99 | 13.9% |
| 35 to 44 Years | 63 | 8.8% |
| 45 to 54 Years | 92 | 12.9% |
| 55 to 64 Years | 141 | 19.8% |
| 65 to 74 Years | 222 | 31.1% |
| 75 to 84 Years | 53 | 7.4% |
| 85 Years and Over | 44 | 6.2% |
| Total | 714 | 100.0% |
Housing Finances in Daniels County
Median Income by Occupancy in Daniels County
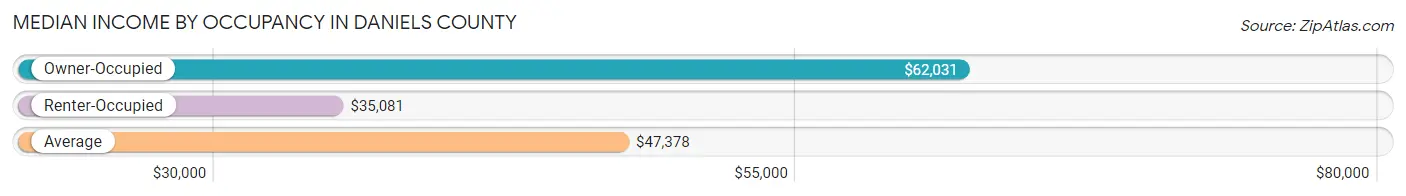
| Occupancy Type | # Households | Median Income |
| Owner-Occupied | 576 (80.7%) | $62,031 |
| Renter-Occupied | 138 (19.3%) | $35,081 |
| Average | 714 (100.0%) | $47,378 |
Occupancy by Householder Income Bracket in Daniels County
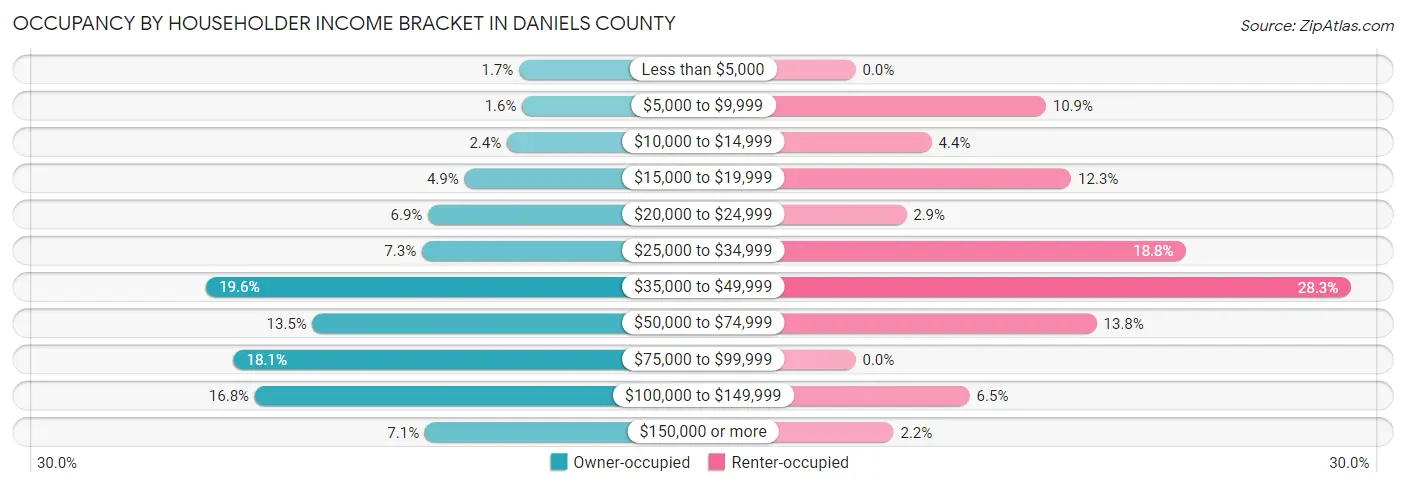
| Income Bracket | Owner-occupied | Renter-occupied |
| Less than $5,000 | 10 (1.7%) | 0 (0.0%) |
| $5,000 to $9,999 | 9 (1.6%) | 15 (10.9%) |
| $10,000 to $14,999 | 14 (2.4%) | 6 (4.3%) |
| $15,000 to $19,999 | 28 (4.9%) | 17 (12.3%) |
| $20,000 to $24,999 | 40 (6.9%) | 4 (2.9%) |
| $25,000 to $34,999 | 42 (7.3%) | 26 (18.8%) |
| $35,000 to $49,999 | 113 (19.6%) | 39 (28.3%) |
| $50,000 to $74,999 | 78 (13.5%) | 19 (13.8%) |
| $75,000 to $99,999 | 104 (18.1%) | 0 (0.0%) |
| $100,000 to $149,999 | 97 (16.8%) | 9 (6.5%) |
| $150,000 or more | 41 (7.1%) | 3 (2.2%) |
| Total | 576 (100.0%) | 138 (100.0%) |
Monthly Housing Cost Tiers in Daniels County
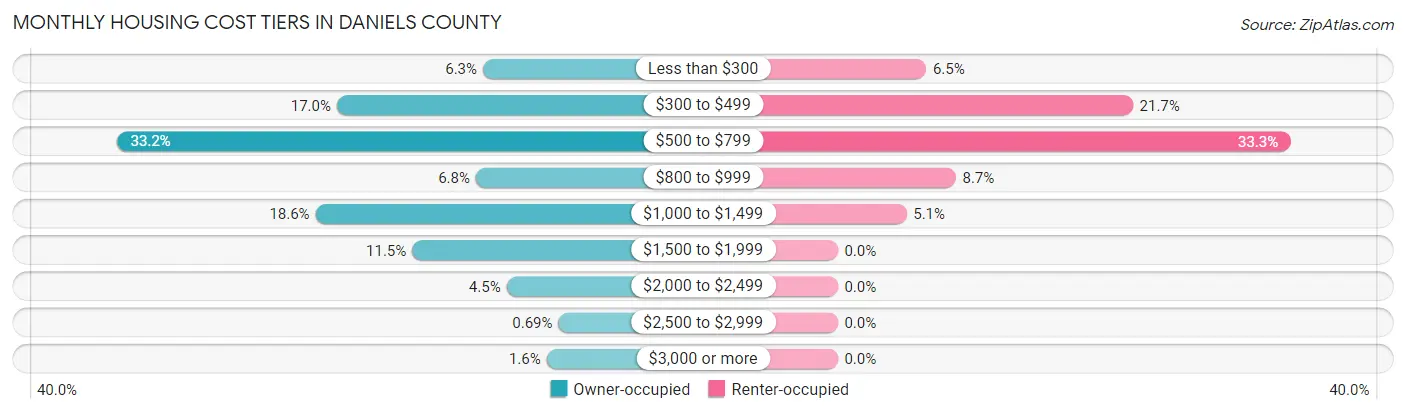
| Monthly Cost | Owner-occupied | Renter-occupied |
| Less than $300 | 36 (6.2%) | 9 (6.5%) |
| $300 to $499 | 98 (17.0%) | 30 (21.7%) |
| $500 to $799 | 191 (33.2%) | 46 (33.3%) |
| $800 to $999 | 39 (6.8%) | 12 (8.7%) |
| $1,000 to $1,499 | 107 (18.6%) | 7 (5.1%) |
| $1,500 to $1,999 | 66 (11.5%) | 0 (0.0%) |
| $2,000 to $2,499 | 26 (4.5%) | 0 (0.0%) |
| $2,500 to $2,999 | 4 (0.7%) | 0 (0.0%) |
| $3,000 or more | 9 (1.6%) | 0 (0.0%) |
| Total | 576 (100.0%) | 138 (100.0%) |
Physical Housing Characteristics in Daniels County
Housing Structures in Daniels County
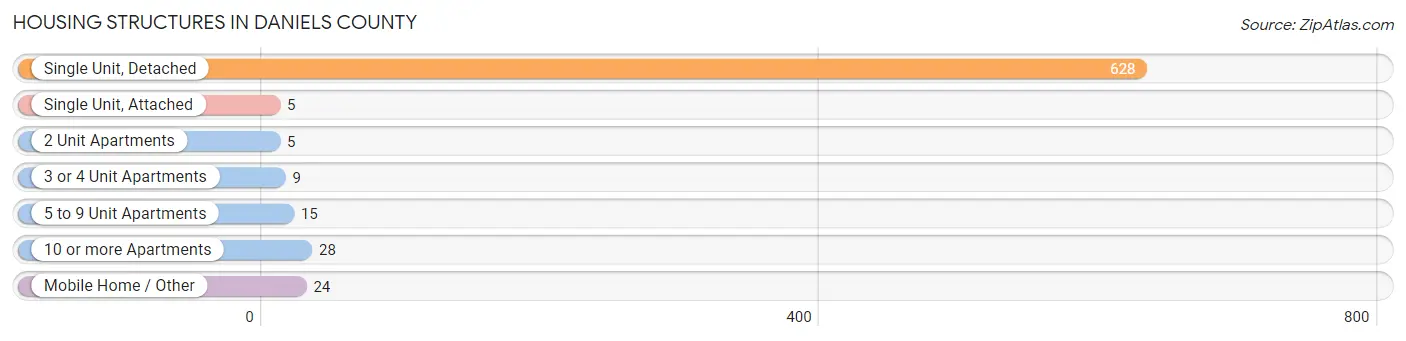
| Structure Type | # Housing Units | % Housing Units |
| Single Unit, Detached | 628 | 88.0% |
| Single Unit, Attached | 5 | 0.7% |
| 2 Unit Apartments | 5 | 0.7% |
| 3 or 4 Unit Apartments | 9 | 1.3% |
| 5 to 9 Unit Apartments | 15 | 2.1% |
| 10 or more Apartments | 28 | 3.9% |
| Mobile Home / Other | 24 | 3.4% |
| Total | 714 | 100.0% |
Housing Structures by Occupancy in Daniels County
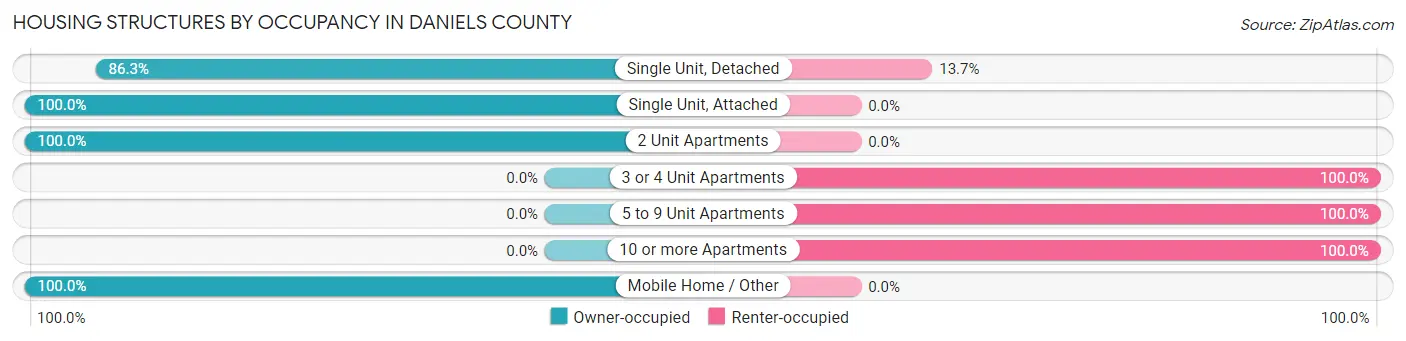
| Structure Type | Owner-occupied | Renter-occupied |
| Single Unit, Detached | 542 (86.3%) | 86 (13.7%) |
| Single Unit, Attached | 5 (100.0%) | 0 (0.0%) |
| 2 Unit Apartments | 5 (100.0%) | 0 (0.0%) |
| 3 or 4 Unit Apartments | 0 (0.0%) | 9 (100.0%) |
| 5 to 9 Unit Apartments | 0 (0.0%) | 15 (100.0%) |
| 10 or more Apartments | 0 (0.0%) | 28 (100.0%) |
| Mobile Home / Other | 24 (100.0%) | 0 (0.0%) |
| Total | 576 (80.7%) | 138 (19.3%) |
Housing Structures by Number of Rooms in Daniels County
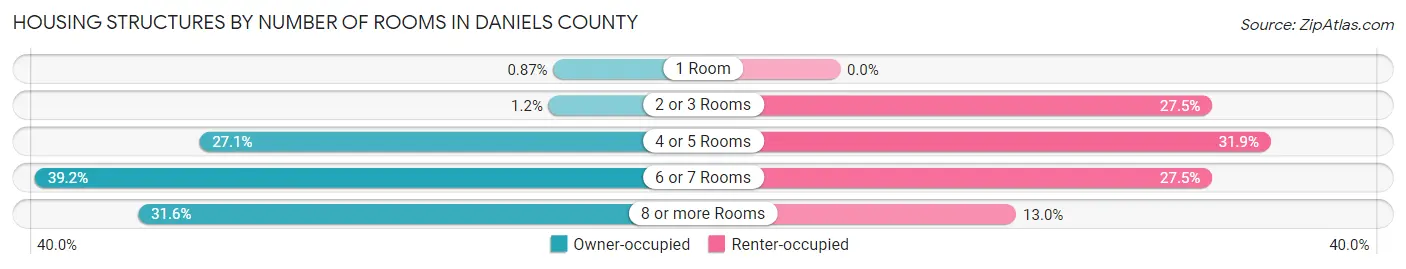
| Number of Rooms | Owner-occupied | Renter-occupied |
| 1 Room | 5 (0.9%) | 0 (0.0%) |
| 2 or 3 Rooms | 7 (1.2%) | 38 (27.5%) |
| 4 or 5 Rooms | 156 (27.1%) | 44 (31.9%) |
| 6 or 7 Rooms | 226 (39.2%) | 38 (27.5%) |
| 8 or more Rooms | 182 (31.6%) | 18 (13.0%) |
| Total | 576 (100.0%) | 138 (100.0%) |
Housing Structure by Heating Type in Daniels County
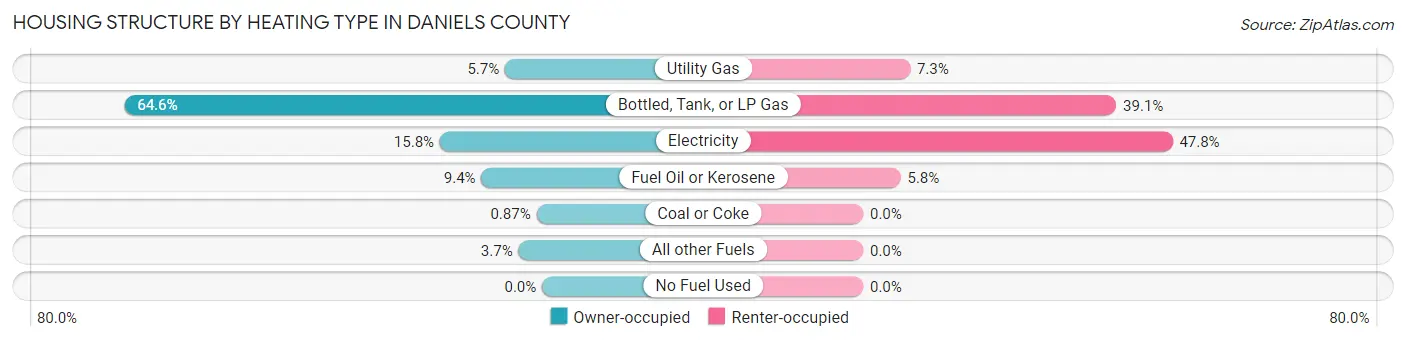
| Heating Type | Owner-occupied | Renter-occupied |
| Utility Gas | 33 (5.7%) | 10 (7.2%) |
| Bottled, Tank, or LP Gas | 372 (64.6%) | 54 (39.1%) |
| Electricity | 91 (15.8%) | 66 (47.8%) |
| Fuel Oil or Kerosene | 54 (9.4%) | 8 (5.8%) |
| Coal or Coke | 5 (0.9%) | 0 (0.0%) |
| All other Fuels | 21 (3.6%) | 0 (0.0%) |
| No Fuel Used | 0 (0.0%) | 0 (0.0%) |
| Total | 576 (100.0%) | 138 (100.0%) |
Household Vehicle Usage in Daniels County
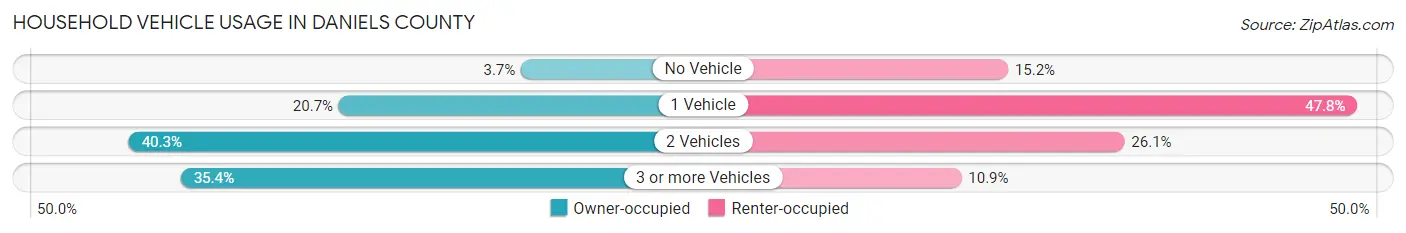
| Vehicles per Household | Owner-occupied | Renter-occupied |
| No Vehicle | 21 (3.6%) | 21 (15.2%) |
| 1 Vehicle | 119 (20.7%) | 66 (47.8%) |
| 2 Vehicles | 232 (40.3%) | 36 (26.1%) |
| 3 or more Vehicles | 204 (35.4%) | 15 (10.9%) |
| Total | 576 (100.0%) | 138 (100.0%) |
Real Estate & Mortgages in Daniels County
Real Estate and Mortgage Overview in Daniels County
| Characteristic | Without Mortgage | With Mortgage |
| Housing Units | 372 | 204 |
| Median Property Value | $150,800 | $203,700 |
| Median Household Income | $47,179 | $19 |
| Monthly Housing Costs | $549 | $9 |
| Real Estate Taxes | $1,275 | $10 |
Property Value by Mortgage Status in Daniels County
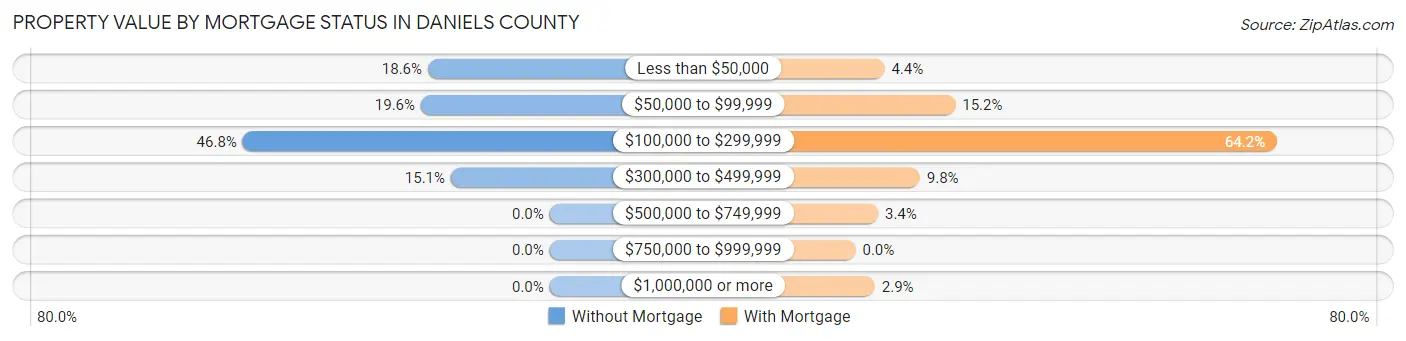
| Property Value | Without Mortgage | With Mortgage |
| Less than $50,000 | 69 (18.5%) | 9 (4.4%) |
| $50,000 to $99,999 | 73 (19.6%) | 31 (15.2%) |
| $100,000 to $299,999 | 174 (46.8%) | 131 (64.2%) |
| $300,000 to $499,999 | 56 (15.0%) | 20 (9.8%) |
| $500,000 to $749,999 | 0 (0.0%) | 7 (3.4%) |
| $750,000 to $999,999 | 0 (0.0%) | 0 (0.0%) |
| $1,000,000 or more | 0 (0.0%) | 6 (2.9%) |
| Total | 372 (100.0%) | 204 (100.0%) |
Household Income by Mortgage Status in Daniels County
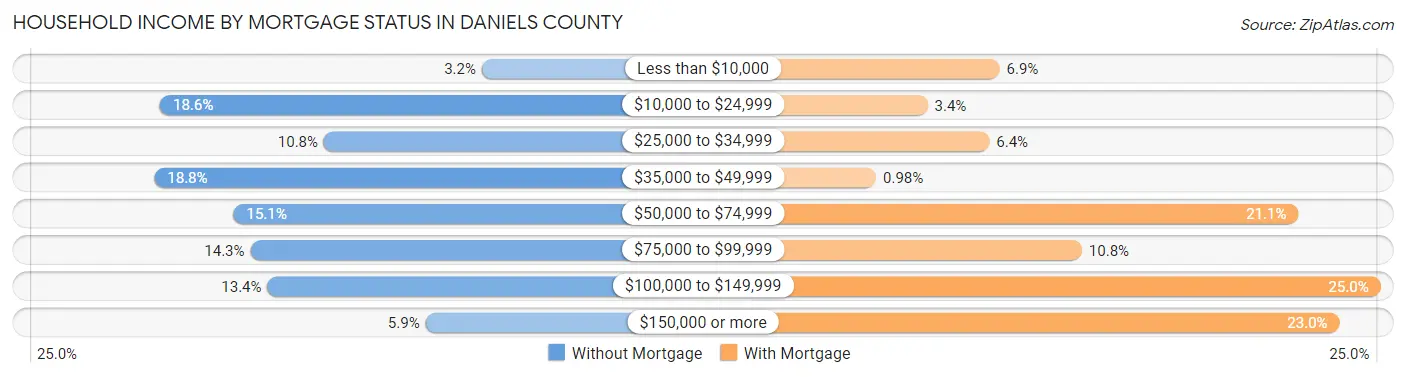
| Household Income | Without Mortgage | With Mortgage |
| Less than $10,000 | 12 (3.2%) | 14 (6.9%) |
| $10,000 to $24,999 | 69 (18.5%) | 7 (3.4%) |
| $25,000 to $34,999 | 40 (10.7%) | 13 (6.4%) |
| $35,000 to $49,999 | 70 (18.8%) | 2 (1.0%) |
| $50,000 to $74,999 | 56 (15.0%) | 43 (21.1%) |
| $75,000 to $99,999 | 53 (14.2%) | 22 (10.8%) |
| $100,000 to $149,999 | 50 (13.4%) | 51 (25.0%) |
| $150,000 or more | 22 (5.9%) | 47 (23.0%) |
| Total | 372 (100.0%) | 204 (100.0%) |
Property Value to Household Income Ratio in Daniels County
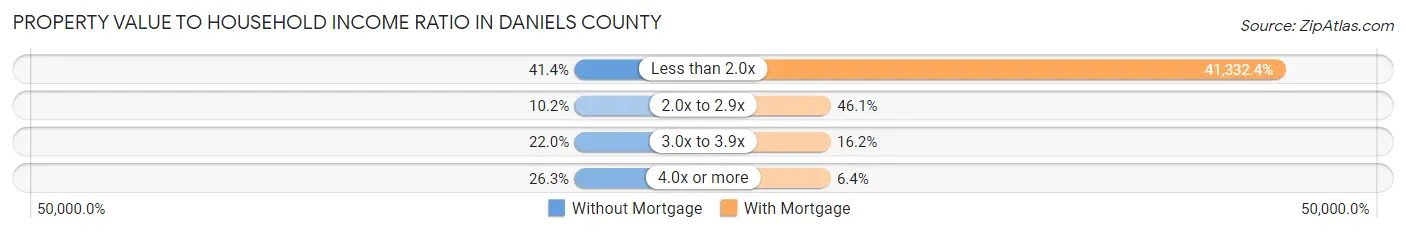
| Value-to-Income Ratio | Without Mortgage | With Mortgage |
| Less than 2.0x | 154 (41.4%) | 84,318 (41,332.4%) |
| 2.0x to 2.9x | 38 (10.2%) | 94 (46.1%) |
| 3.0x to 3.9x | 82 (22.0%) | 33 (16.2%) |
| 4.0x or more | 98 (26.3%) | 13 (6.4%) |
| Total | 372 (100.0%) | 204 (100.0%) |
Real Estate Taxes by Mortgage Status in Daniels County
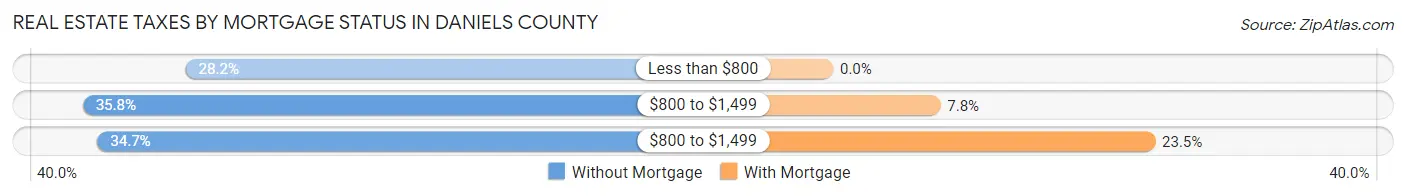
| Property Taxes | Without Mortgage | With Mortgage |
| Less than $800 | 105 (28.2%) | 0 (0.0%) |
| $800 to $1,499 | 133 (35.7%) | 16 (7.8%) |
| $800 to $1,499 | 129 (34.7%) | 48 (23.5%) |
| Total | 372 (100.0%) | 204 (100.0%) |
Health & Disability in Daniels County
Health Insurance Coverage by Age in Daniels County
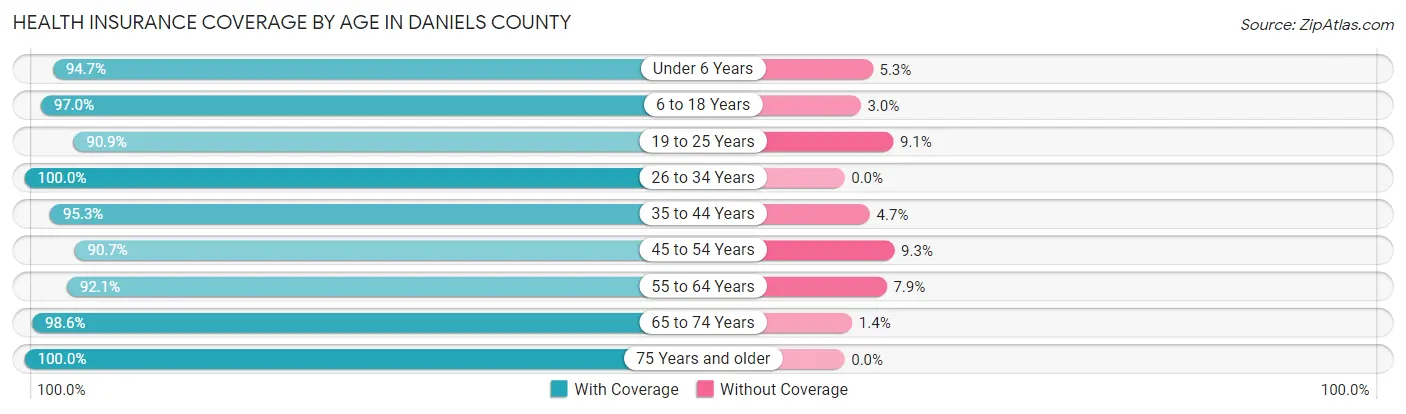
| Age Bracket | With Coverage | Without Coverage |
| Under 6 Years | 72 (94.7%) | 4 (5.3%) |
| 6 to 18 Years | 225 (97.0%) | 7 (3.0%) |
| 19 to 25 Years | 50 (90.9%) | 5 (9.1%) |
| 26 to 34 Years | 116 (100.0%) | 0 (0.0%) |
| 35 to 44 Years | 161 (95.3%) | 8 (4.7%) |
| 45 to 54 Years | 156 (90.7%) | 16 (9.3%) |
| 55 to 64 Years | 234 (92.1%) | 20 (7.9%) |
| 65 to 74 Years | 278 (98.6%) | 4 (1.4%) |
| 75 Years and older | 154 (100.0%) | 0 (0.0%) |
| Total | 1,446 (95.8%) | 64 (4.2%) |
Health Insurance Coverage by Citizenship Status in Daniels County
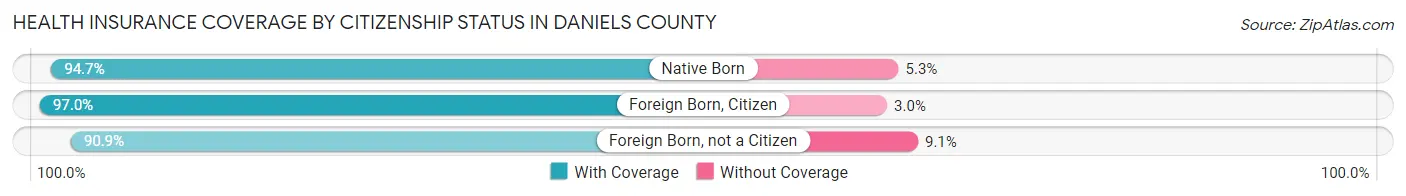
| Citizenship Status | With Coverage | Without Coverage |
| Native Born | 72 (94.7%) | 4 (5.3%) |
| Foreign Born, Citizen | 225 (97.0%) | 7 (3.0%) |
| Foreign Born, not a Citizen | 50 (90.9%) | 5 (9.1%) |
Health Insurance Coverage by Household Income in Daniels County
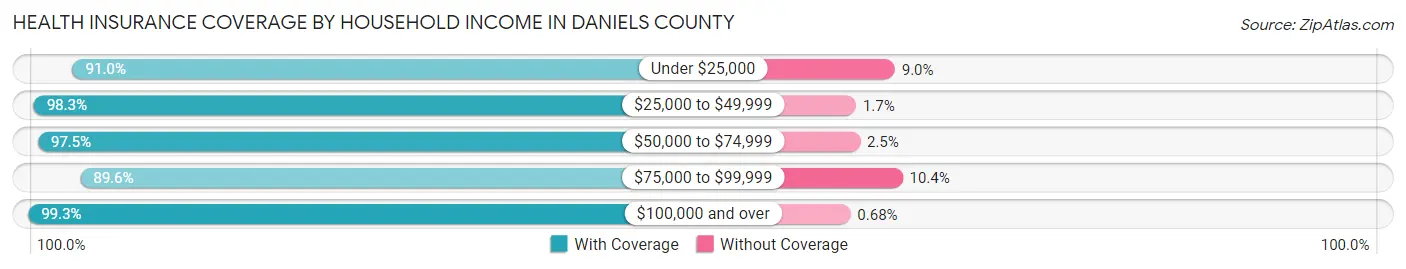
| Household Income | With Coverage | Without Coverage |
| Under $25,000 | 243 (91.0%) | 24 (9.0%) |
| $25,000 to $49,999 | 342 (98.3%) | 6 (1.7%) |
| $50,000 to $74,999 | 197 (97.5%) | 5 (2.5%) |
| $75,000 to $99,999 | 223 (89.6%) | 26 (10.4%) |
| $100,000 and over | 441 (99.3%) | 3 (0.7%) |
Public vs Private Health Insurance Coverage by Age in Daniels County
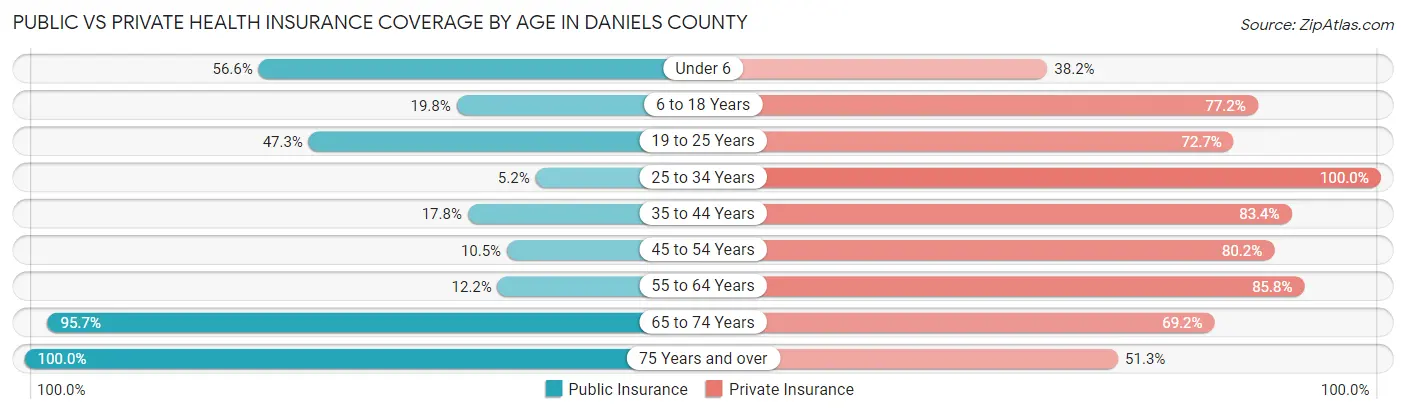
| Age Bracket | Public Insurance | Private Insurance |
| Under 6 | 43 (56.6%) | 29 (38.2%) |
| 6 to 18 Years | 46 (19.8%) | 179 (77.2%) |
| 19 to 25 Years | 26 (47.3%) | 40 (72.7%) |
| 25 to 34 Years | 6 (5.2%) | 116 (100.0%) |
| 35 to 44 Years | 30 (17.7%) | 141 (83.4%) |
| 45 to 54 Years | 18 (10.5%) | 138 (80.2%) |
| 55 to 64 Years | 31 (12.2%) | 218 (85.8%) |
| 65 to 74 Years | 270 (95.7%) | 195 (69.2%) |
| 75 Years and over | 154 (100.0%) | 79 (51.3%) |
| Total | 624 (41.3%) | 1,135 (75.2%) |
Disability Status by Sex by Age in Daniels County
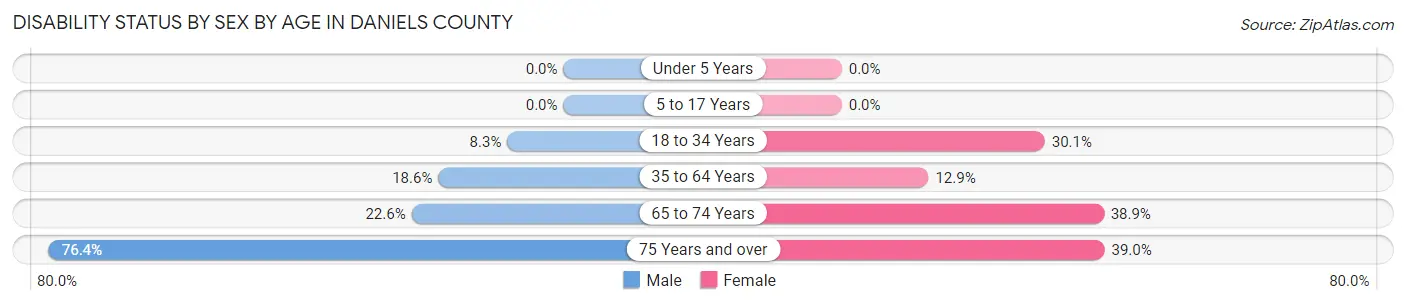
| Age Bracket | Male | Female |
| Under 5 Years | 0 (0.0%) | 0 (0.0%) |
| 5 to 17 Years | 0 (0.0%) | 0 (0.0%) |
| 18 to 34 Years | 10 (8.3%) | 22 (30.1%) |
| 35 to 64 Years | 60 (18.6%) | 35 (12.9%) |
| 65 to 74 Years | 23 (22.6%) | 70 (38.9%) |
| 75 Years and over | 55 (76.4%) | 32 (39.0%) |
Disability Class by Sex by Age in Daniels County
Disability Class: Hearing Difficulty
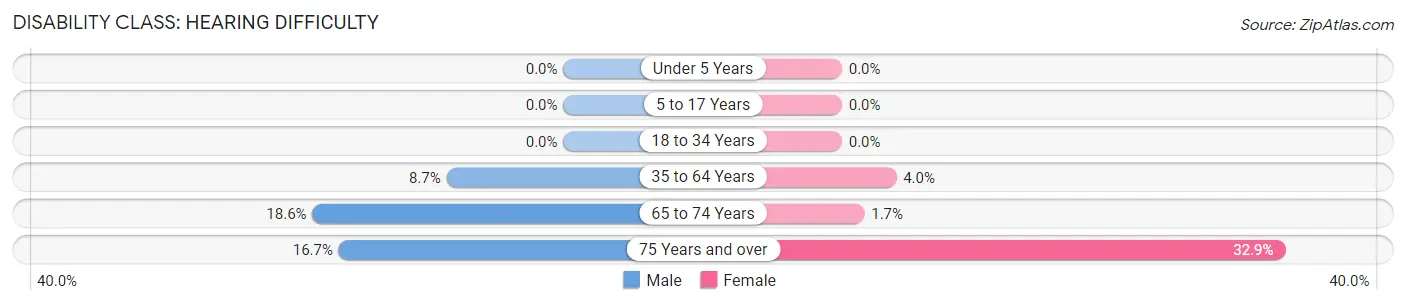
| Age Bracket | Male | Female |
| Under 5 Years | 0 (0.0%) | 0 (0.0%) |
| 5 to 17 Years | 0 (0.0%) | 0 (0.0%) |
| 18 to 34 Years | 0 (0.0%) | 0 (0.0%) |
| 35 to 64 Years | 28 (8.7%) | 11 (4.0%) |
| 65 to 74 Years | 19 (18.6%) | 3 (1.7%) |
| 75 Years and over | 12 (16.7%) | 27 (32.9%) |
Disability Class: Vision Difficulty
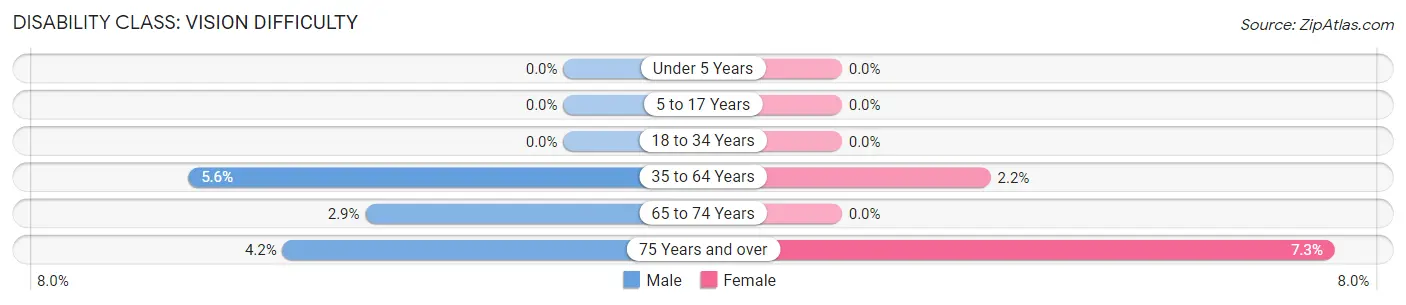
| Age Bracket | Male | Female |
| Under 5 Years | 0 (0.0%) | 0 (0.0%) |
| 5 to 17 Years | 0 (0.0%) | 0 (0.0%) |
| 18 to 34 Years | 0 (0.0%) | 0 (0.0%) |
| 35 to 64 Years | 18 (5.6%) | 6 (2.2%) |
| 65 to 74 Years | 3 (2.9%) | 0 (0.0%) |
| 75 Years and over | 3 (4.2%) | 6 (7.3%) |
Disability Class: Cognitive Difficulty
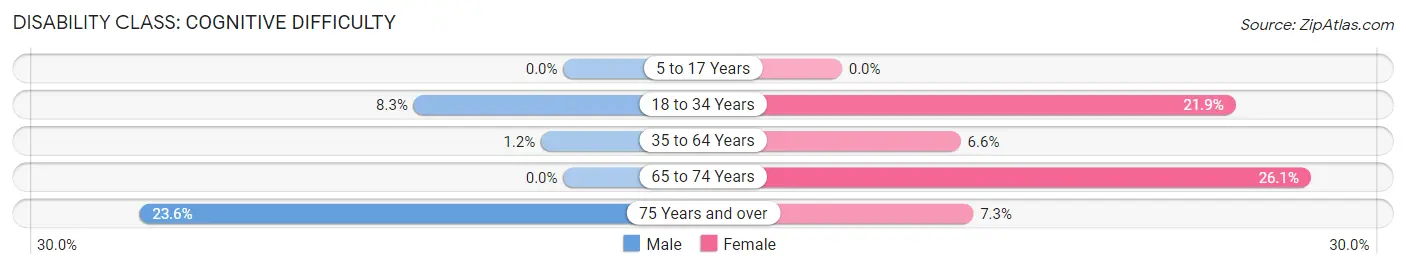
| Age Bracket | Male | Female |
| 5 to 17 Years | 0 (0.0%) | 0 (0.0%) |
| 18 to 34 Years | 10 (8.3%) | 16 (21.9%) |
| 35 to 64 Years | 4 (1.2%) | 18 (6.6%) |
| 65 to 74 Years | 0 (0.0%) | 47 (26.1%) |
| 75 Years and over | 17 (23.6%) | 6 (7.3%) |
Disability Class: Ambulatory Difficulty
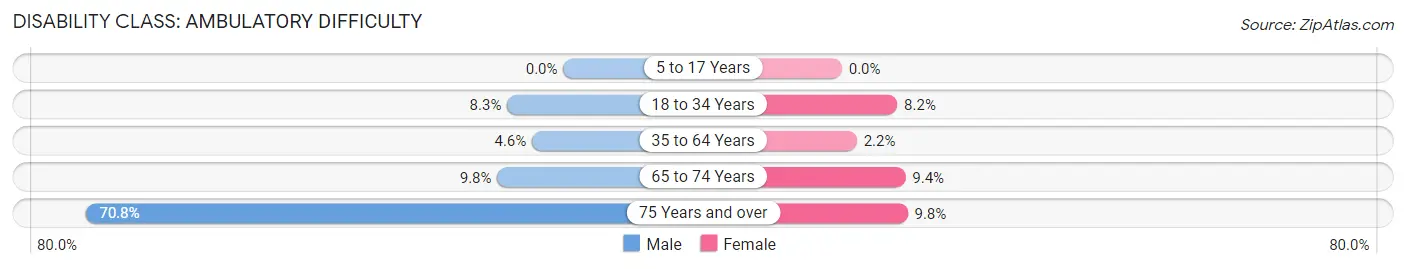
| Age Bracket | Male | Female |
| 5 to 17 Years | 0 (0.0%) | 0 (0.0%) |
| 18 to 34 Years | 10 (8.3%) | 6 (8.2%) |
| 35 to 64 Years | 15 (4.6%) | 6 (2.2%) |
| 65 to 74 Years | 10 (9.8%) | 17 (9.4%) |
| 75 Years and over | 51 (70.8%) | 8 (9.8%) |
Disability Class: Self-Care Difficulty
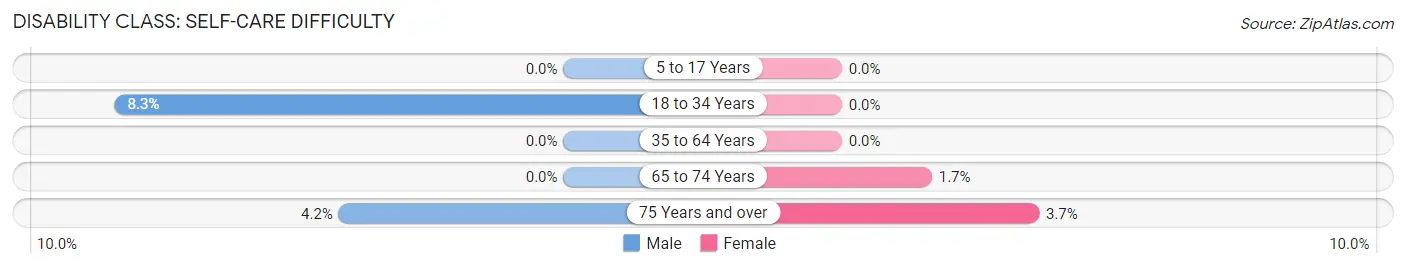
| Age Bracket | Male | Female |
| 5 to 17 Years | 0 (0.0%) | 0 (0.0%) |
| 18 to 34 Years | 10 (8.3%) | 0 (0.0%) |
| 35 to 64 Years | 0 (0.0%) | 0 (0.0%) |
| 65 to 74 Years | 0 (0.0%) | 3 (1.7%) |
| 75 Years and over | 3 (4.2%) | 3 (3.7%) |
Technology Access in Daniels County
Computing Device Access in Daniels County
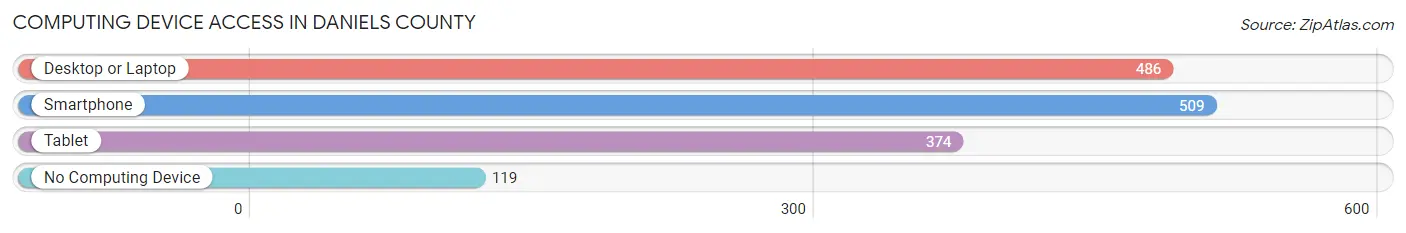
| Device Type | # Households | % Households |
| Desktop or Laptop | 486 | 68.1% |
| Smartphone | 509 | 71.3% |
| Tablet | 374 | 52.4% |
| No Computing Device | 119 | 16.7% |
| Total | 714 | 100.0% |
Internet Access in Daniels County
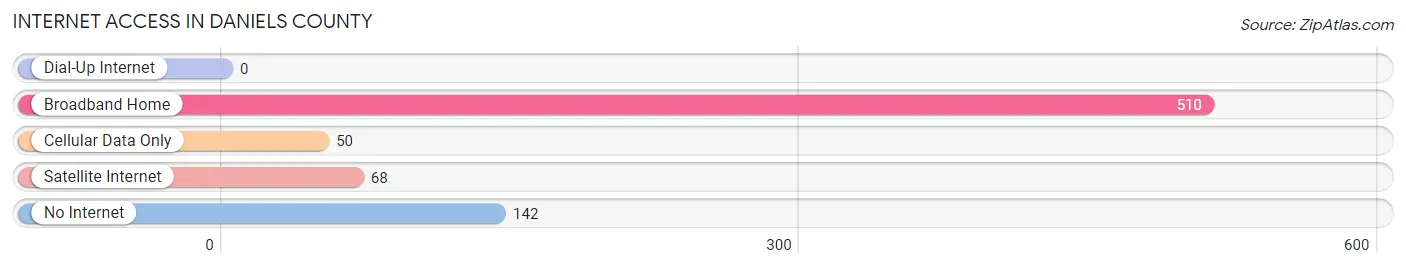
| Internet Type | # Households | % Households |
| Dial-Up Internet | 0 | 0.0% |
| Broadband Home | 510 | 71.4% |
| Cellular Data Only | 50 | 7.0% |
| Satellite Internet | 68 | 9.5% |
| No Internet | 142 | 19.9% |
| Total | 714 | 100.0% |
Daniels County Summary
Daniels County is located in the northeastern corner of Montana, bordered by Canada to the north and the state of North Dakota to the east. It is part of the Fort Peck Indian Reservation, and is the smallest county in the state, with a total area of only 544 square miles. The county seat is Scobey, and the population was 1,845 at the 2010 census.
History
Daniels County was created in 1914 from parts of Sheridan and Valley counties. It was named after former Montana Governor Joseph K. Toole's father-in-law, John Daniels. The county was originally populated by Native Americans, primarily the Assiniboine and Sioux tribes. The first white settlers arrived in the area in the late 1800s, and the county was officially organized in 1915.
Geography
Daniels County is located in the northeastern corner of Montana, bordered by Canada to the north and the state of North Dakota to the east. It is part of the Fort Peck Indian Reservation, and is the smallest county in the state, with a total area of only 544 square miles. The county is mostly flat, with rolling hills in the east and south. The terrain is mostly grassland, with some areas of forest. The county is home to several small lakes, including Lake Elwell, Lake Francis, and Lake Scobey.
Economy
The economy of Daniels County is largely based on agriculture and ranching. The county is home to several large cattle ranches, as well as smaller farms that produce wheat, barley, oats, and hay. The county also has a small manufacturing sector, with several small businesses producing furniture, clothing, and other goods. The county is also home to several oil and gas wells, which provide a significant source of revenue.
Demographics
As of the 2010 census, there were 1,845 people, 745 households, and 486 families residing in the county. The population density was 3.4 people per square mile. The racial makeup of the county was 94.2% White, 0.2% African American, 2.3% Native American, 0.2% Asian, 0.1% Pacific Islander, 0.7% from other races, and 2.3% from two or more races. Hispanic or Latino of any race were 1.7% of the population.
The median income for a household in the county was $31,250, and the median income for a family was $37,500. The per capita income for the county was $15,945. About 16.2% of families and 20.2% of the population were below the poverty line, including 28.2% of those under age 18 and 11.2% of those age 65 or over.
Common Questions
What is the Total Population of Daniels County?
Total Population of Daniels County is 1,535.
What is the Total Male Population of Daniels County?
Total Male Population of Daniels County is 775.
What is the Total Female Population of Daniels County?
Total Female Population of Daniels County is 760.
What is the Ratio of Males per 100 Females in Daniels County?
There are 101.97 Males per 100 Females in Daniels County.
What is the Ratio of Females per 100 Males in Daniels County?
There are 98.06 Females per 100 Males in Daniels County.
What is the Median Population Age in Daniels County?
Median Population Age in Daniels County is 52.4 Years.
What is the Average Family Size in Daniels County
Average Family Size in Daniels County is 3.0 People.
What is the Average Household Size in Daniels County
Average Household Size in Daniels County is 2.1 People.
What is Per Capita Income in Daniels County?
Per Capita income in Daniels County is $33,757.
What is the Median Family Income in Daniels County?
Median Family Income in Daniels County is $83,580.
What is the Median Household income in Daniels County?
Median Household Income in Daniels County is $47,378.
What is Income or Wage Gap in Daniels County?
Income or Wage Gap in Daniels County is 23.2%.
Women in Daniels County earn 76.8 cents for every dollar earned by a man.
What is Inequality or Gini Index in Daniels County?
Inequality or Gini Index in Daniels County is 0.40.
How Large is the Labor Force in Daniels County?
There are 796 People in the Labor Forcein in Daniels County.
What is the Percentage of People in the Labor Force in Daniels County?
60.7% of People are in the Labor Force in Daniels County.
What is the Unemployment Rate in Daniels County?
Unemployment Rate in Daniels County is 1.5%.