Carter County, MT
Carter County Map
Carter County Overview
1,332
TOTAL POPULATION
698
MALE POPULATION
634
FEMALE POPULATION
110.09
MALES / 100 FEMALES
90.83
FEMALES / 100 MALES
56.8
MEDIAN AGE
3.1
AVG FAMILY SIZE
2.2
AVG HOUSEHOLD SIZE
$28,824
PER CAPITA INCOME
$61,181
AVG FAMILY INCOME
$46,486
AVG HOUSEHOLD INCOME
27.0%
WAGE / INCOME GAP [ % ]
73.0¢/ $1
WAGE / INCOME GAP [ $ ]
0.44
INEQUALITY / GINI INDEX
678
LABOR FORCE [ PEOPLE ]
60.2%
PERCENT IN LABOR FORCE
2.4%
UNEMPLOYMENT RATE
Carter County Area Codes
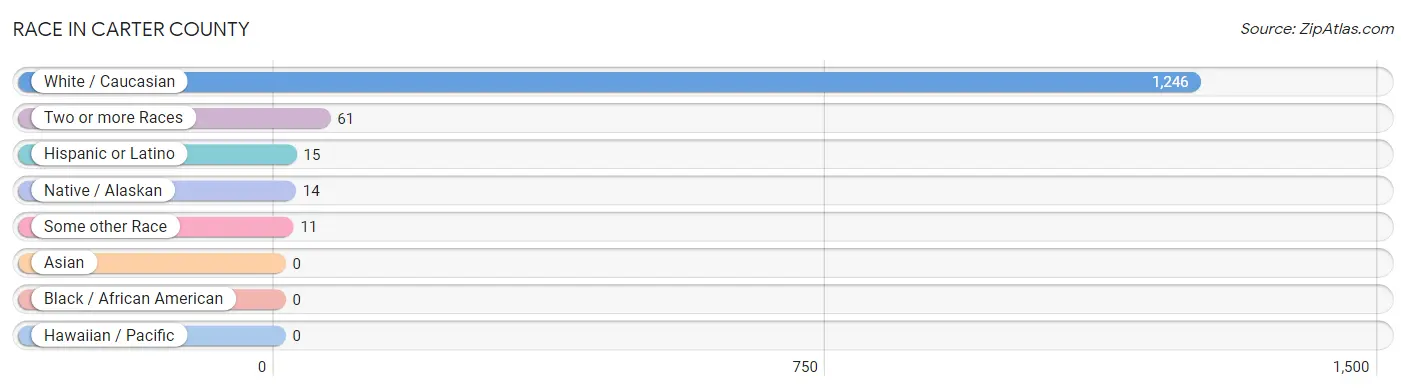
Race in Carter County
The most populous races in Carter County are White / Caucasian (1,246 | 93.5%), Two or more Races (61 | 4.6%), and Hispanic or Latino (15 | 1.1%).
| Race | # Population | % Population |
| Asian | 0 | 0.0% |
| Black / African American | 0 | 0.0% |
| Hawaiian / Pacific | 0 | 0.0% |
| Hispanic or Latino | 15 | 1.1% |
| Native / Alaskan | 14 | 1.1% |
| White / Caucasian | 1,246 | 93.5% |
| Two or more Races | 61 | 4.6% |
| Some other Race | 11 | 0.8% |
| Total | 1,332 | 100.0% |
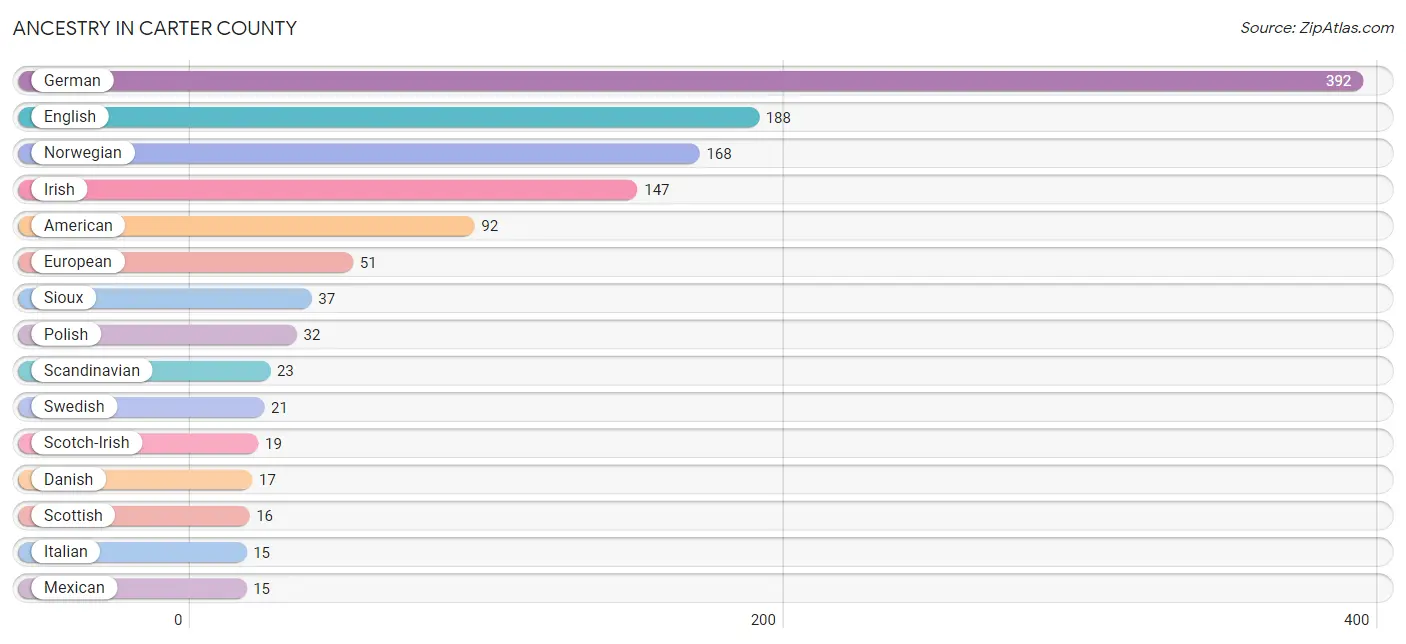
Ancestry in Carter County
The most populous ancestries reported in Carter County are German (392 | 29.4%), English (188 | 14.1%), Norwegian (168 | 12.6%), Irish (147 | 11.0%), and American (92 | 6.9%), together accounting for 74.1% of all Carter County residents.
| Ancestry | # Population | % Population |
| American | 92 | 6.9% |
| Austrian | 4 | 0.3% |
| Basque | 2 | 0.2% |
| Blackfeet | 1 | 0.1% |
| British | 5 | 0.4% |
| Czech | 7 | 0.5% |
| Danish | 17 | 1.3% |
| Dutch | 6 | 0.4% |
| English | 188 | 14.1% |
| European | 51 | 3.8% |
| Finnish | 7 | 0.5% |
| French | 12 | 0.9% |
| French Canadian | 12 | 0.9% |
| German | 392 | 29.4% |
| Hungarian | 6 | 0.4% |
| Irish | 147 | 11.0% |
| Italian | 15 | 1.1% |
| Mexican | 15 | 1.1% |
| Norwegian | 168 | 12.6% |
| Polish | 32 | 2.4% |
| Scandinavian | 23 | 1.7% |
| Scotch-Irish | 19 | 1.4% |
| Scottish | 16 | 1.2% |
| Sioux | 37 | 2.8% |
| Swedish | 21 | 1.6% |
| Welsh | 10 | 0.7% | View All 26 Rows |
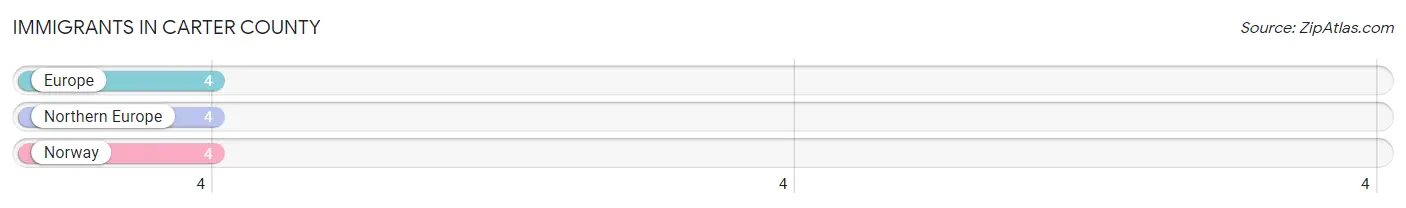
Immigrants in Carter County
The most numerous immigrant groups reported in Carter County came from Europe (4 | 0.3%), Northern Europe (4 | 0.3%), and Norway (4 | 0.3%), together accounting for 0.9% of all Carter County residents.
| Immigration Origin | # Population | % Population |
| Europe | 4 | 0.3% |
| Northern Europe | 4 | 0.3% |
| Norway | 4 | 0.3% | View All 3 Rows |
Sex and Age in Carter County
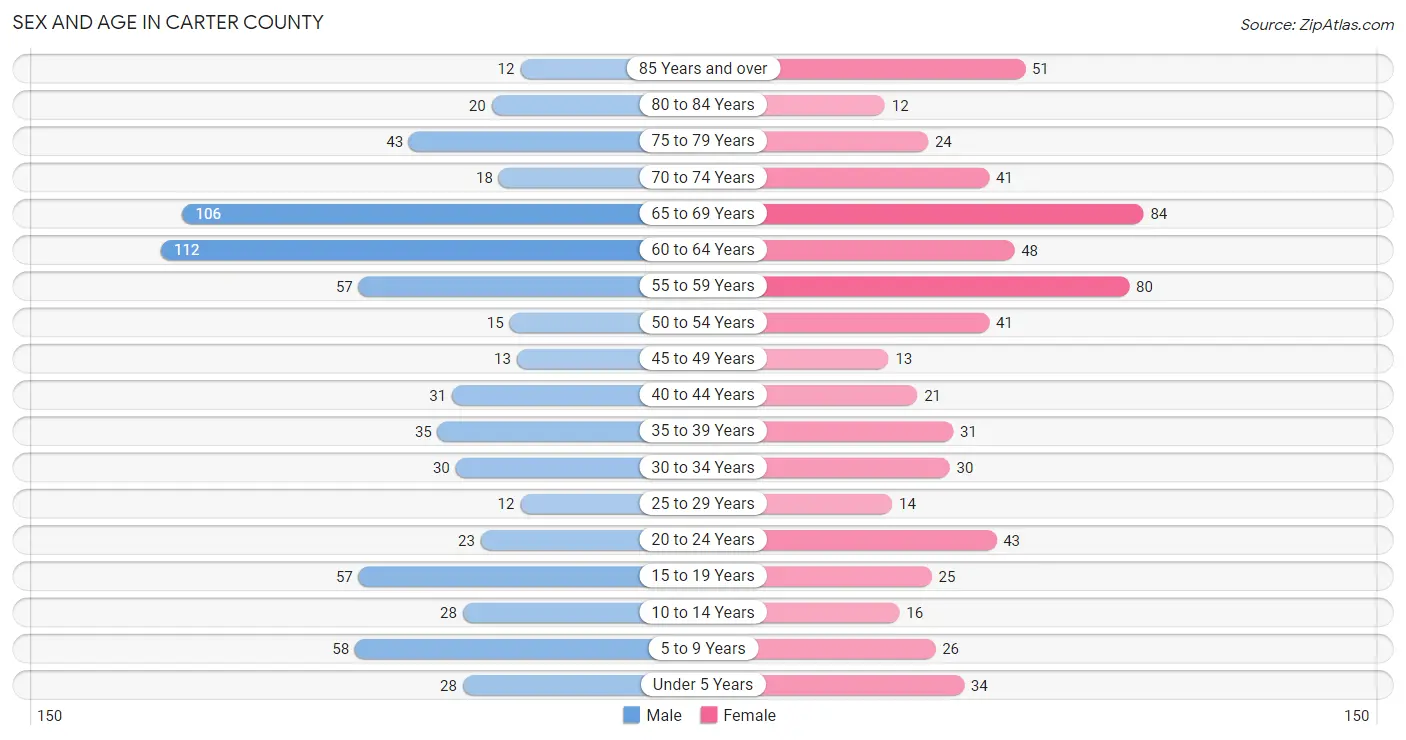
Sex and Age in Carter County
The most populous age groups in Carter County are 60 to 64 Years (112 | 16.1%) for men and 65 to 69 Years (84 | 13.3%) for women.
| Age Bracket | Male | Female |
| Under 5 Years | 28 (4.0%) | 34 (5.4%) |
| 5 to 9 Years | 58 (8.3%) | 26 (4.1%) |
| 10 to 14 Years | 28 (4.0%) | 16 (2.5%) |
| 15 to 19 Years | 57 (8.2%) | 25 (3.9%) |
| 20 to 24 Years | 23 (3.3%) | 43 (6.8%) |
| 25 to 29 Years | 12 (1.7%) | 14 (2.2%) |
| 30 to 34 Years | 30 (4.3%) | 30 (4.7%) |
| 35 to 39 Years | 35 (5.0%) | 31 (4.9%) |
| 40 to 44 Years | 31 (4.4%) | 21 (3.3%) |
| 45 to 49 Years | 13 (1.9%) | 13 (2.1%) |
| 50 to 54 Years | 15 (2.1%) | 41 (6.5%) |
| 55 to 59 Years | 57 (8.2%) | 80 (12.6%) |
| 60 to 64 Years | 112 (16.1%) | 48 (7.6%) |
| 65 to 69 Years | 106 (15.2%) | 84 (13.3%) |
| 70 to 74 Years | 18 (2.6%) | 41 (6.5%) |
| 75 to 79 Years | 43 (6.2%) | 24 (3.8%) |
| 80 to 84 Years | 20 (2.9%) | 12 (1.9%) |
| 85 Years and over | 12 (1.7%) | 51 (8.0%) |
| Total | 698 (100.0%) | 634 (100.0%) |
Families and Households in Carter County
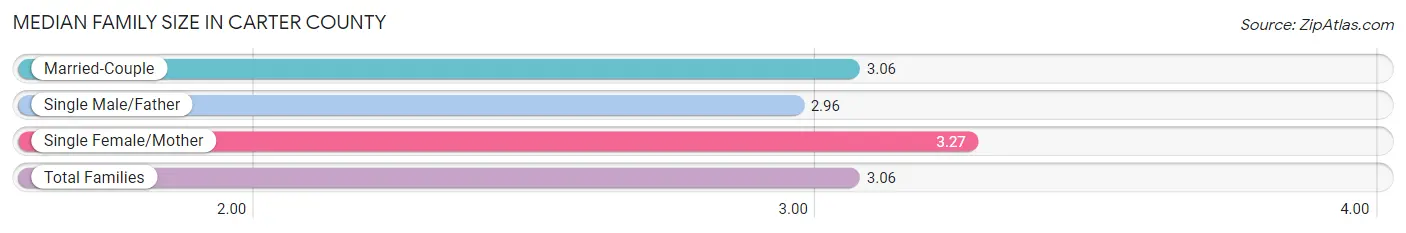
Median Family Size in Carter County
The median family size in Carter County is 3.06 persons per family, with single female/mother families (15 | 4.5%) accounting for the largest median family size of 3.27 persons per family. On the other hand, single male/father families (23 | 7.0%) represent the smallest median family size with 2.96 persons per family.
| Family Type | # Families | Family Size |
| Married-Couple | 292 (88.5%) | 3.06 |
| Single Male/Father | 23 (7.0%) | 2.96 |
| Single Female/Mother | 15 (4.5%) | 3.27 |
| Total Families | 330 (100.0%) | 3.06 |
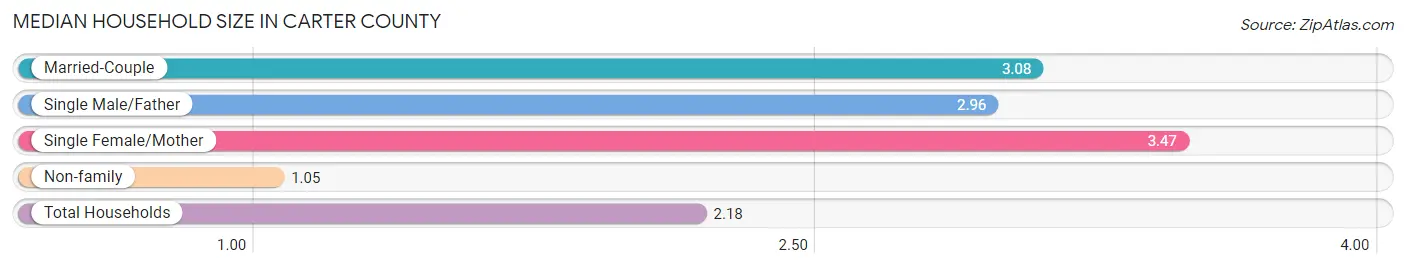
Median Household Size in Carter County
The median household size in Carter County is 2.18 persons per household, with single female/mother households (15 | 2.5%) accounting for the largest median household size of 3.47 persons per household. non-family households (268 | 44.8%) represent the smallest median household size with 1.05 persons per household.
| Household Type | # Households | Household Size |
| Married-Couple | 292 (48.8%) | 3.08 |
| Single Male/Father | 23 (3.8%) | 2.96 |
| Single Female/Mother | 15 (2.5%) | 3.47 |
| Non-family | 268 (44.8%) | 1.05 |
| Total Households | 598 (100.0%) | 2.18 |
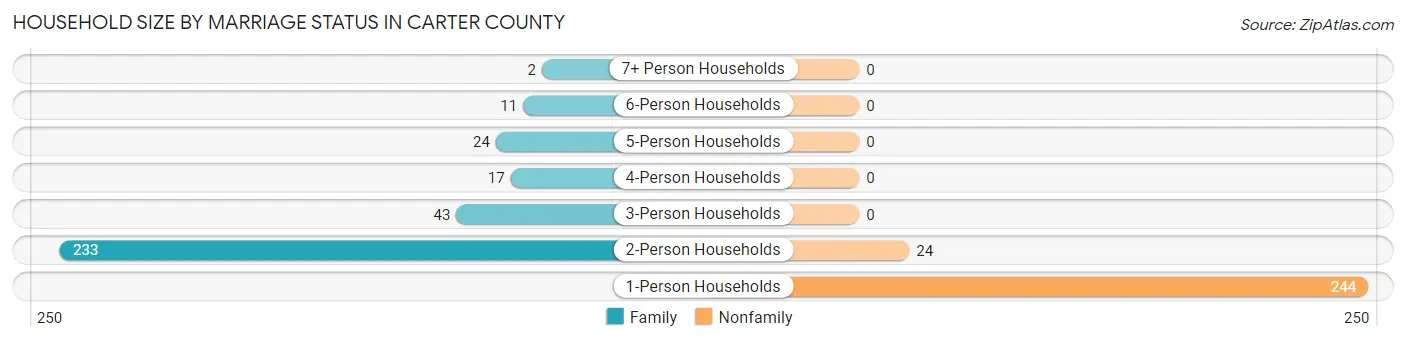
Household Size by Marriage Status in Carter County
Out of a total of 598 households in Carter County, 330 (55.2%) are family households, while 268 (44.8%) are nonfamily households. The most numerous type of family households are 2-person households, comprising 233, and the most common type of nonfamily households are 1-person households, comprising 244.
| Household Size | Family Households | Nonfamily Households |
| 1-Person Households | - | 244 (40.8%) |
| 2-Person Households | 233 (39.0%) | 24 (4.0%) |
| 3-Person Households | 43 (7.2%) | 0 (0.0%) |
| 4-Person Households | 17 (2.8%) | 0 (0.0%) |
| 5-Person Households | 24 (4.0%) | 0 (0.0%) |
| 6-Person Households | 11 (1.8%) | 0 (0.0%) |
| 7+ Person Households | 2 (0.3%) | 0 (0.0%) |
| Total | 330 (55.2%) | 268 (44.8%) |
Female Fertility in Carter County
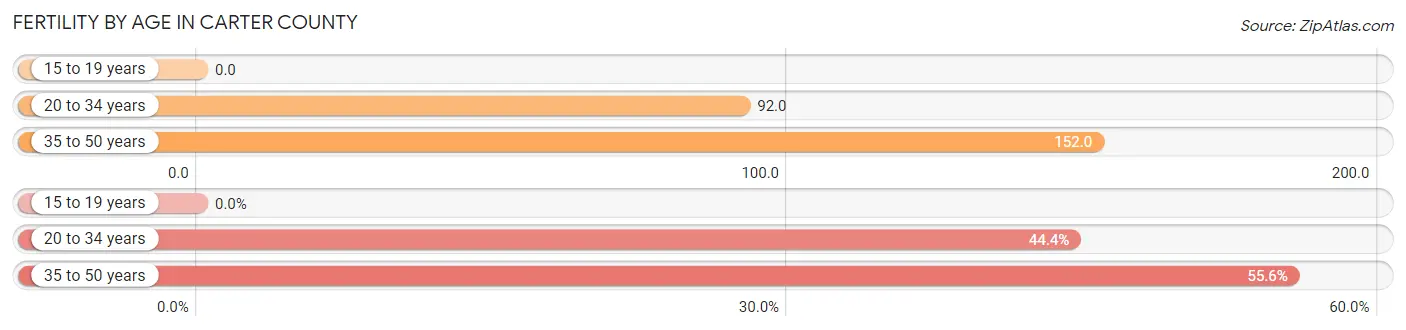
Fertility by Age in Carter County
Average fertility rate in Carter County is 101.0 births per 1,000 women. Women in the age bracket of 35 to 50 years have the highest fertility rate with 152.0 births per 1,000 women. Women in the age bracket of 35 to 50 years acount for 55.6% of all women with births.
| Age Bracket | Women with Births | Births / 1,000 Women |
| 15 to 19 years | 0 (0.0%) | 0.0 |
| 20 to 34 years | 8 (44.4%) | 92.0 |
| 35 to 50 years | 10 (55.6%) | 152.0 |
| Total | 18 (100.0%) | 101.0 |
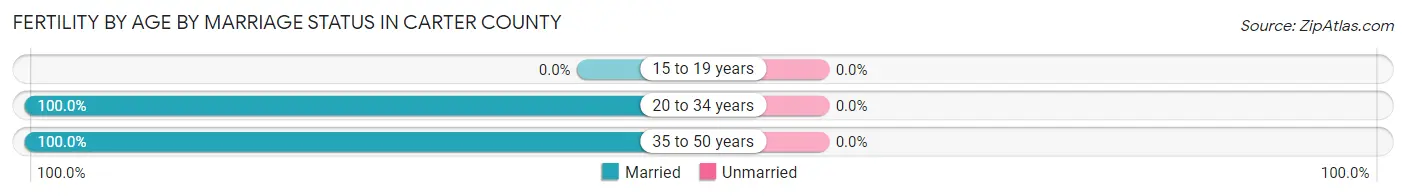
Fertility by Age by Marriage Status in Carter County
| Age Bracket | Married | Unmarried |
| 15 to 19 years | 0 (0.0%) | 0 (0.0%) |
| 20 to 34 years | 8 (100.0%) | 0 (0.0%) |
| 35 to 50 years | 10 (100.0%) | 0 (0.0%) |
| Total | 18 (100.0%) | 0 (0.0%) |
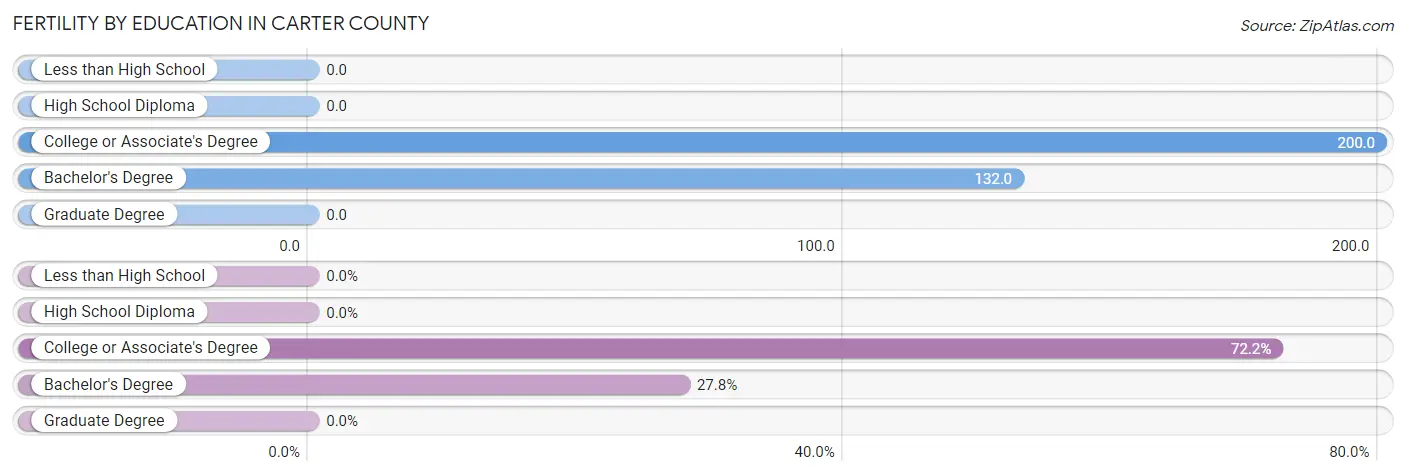
Fertility by Education in Carter County
| Educational Attainment | Women with Births | Births / 1,000 Women |
| Less than High School | 0 (0.0%) | 0.0 |
| High School Diploma | 0 (0.0%) | 0.0 |
| College or Associate's Degree | 13 (72.2%) | 200.0 |
| Bachelor's Degree | 5 (27.8%) | 132.0 |
| Graduate Degree | 0 (0.0%) | 0.0 |
| Total | 18 (100.0%) | 101.0 |
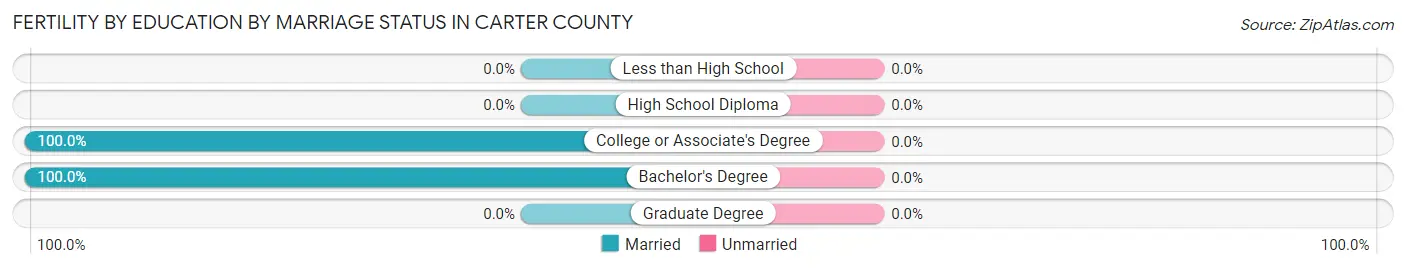
Fertility by Education by Marriage Status in Carter County
| Educational Attainment | Married | Unmarried |
| Less than High School | 0 (0.0%) | 0 (0.0%) |
| High School Diploma | 0 (0.0%) | 0 (0.0%) |
| College or Associate's Degree | 13 (100.0%) | 0 (0.0%) |
| Bachelor's Degree | 5 (100.0%) | 0 (0.0%) |
| Graduate Degree | 0 (0.0%) | 0 (0.0%) |
| Total | 18 (100.0%) | 0 (0.0%) |
Income in Carter County
Income Overview in Carter County
Per Capita Income in Carter County is $28,824, while median incomes of families and households are $61,181 and $46,486 respectively.
| Characteristic | Number | Measure |
| Per Capita Income | 1,332 | $28,824 |
| Median Family Income | 330 | $61,181 |
| Mean Family Income | 330 | $83,030 |
| Median Household Income | 598 | $46,486 |
| Mean Household Income | 598 | $61,341 |
| Income Deficit | 330 | $0 |
| Wage / Income Gap (%) | 1,332 | 27.05% |
| Wage / Income Gap ($) | 1,332 | 72.95¢ per $1 |
| Gini / Inequality Index | 1,332 | 0.44 |
Earnings by Sex in Carter County
Average Earnings in Carter County are $28,373, $30,200 for men and $22,031 for women, a difference of 27.1%.
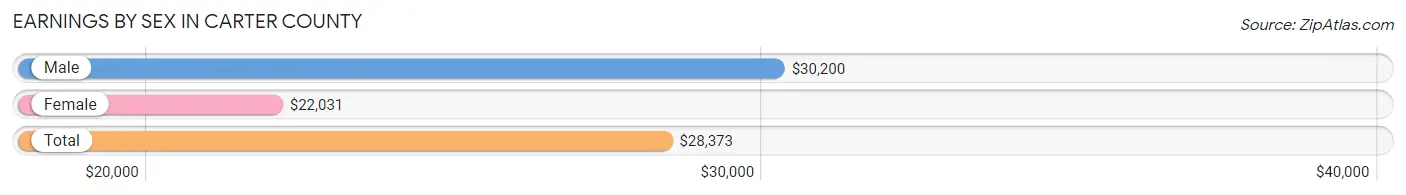
| Sex | Number | Average Earnings |
| Male | 434 (59.1%) | $30,200 |
| Female | 300 (40.9%) | $22,031 |
| Total | 734 (100.0%) | $28,373 |
Earnings by Sex by Income Bracket in Carter County
The most common earnings brackets in Carter County are $25,000 to $29,999 for men (69 | 15.9%) and $10,000 to $12,499 for women (32 | 10.7%).
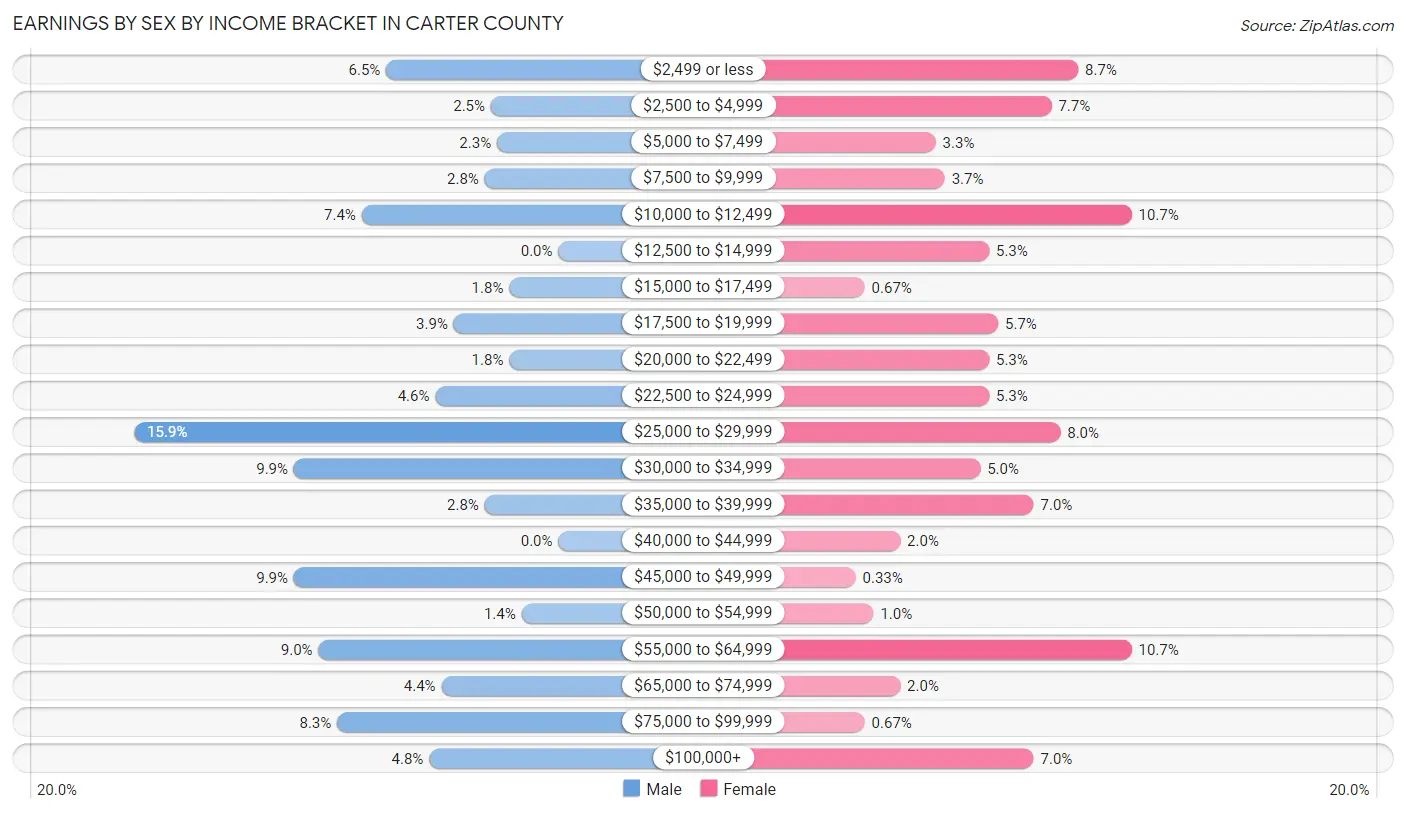
| Income | Male | Female |
| $2,499 or less | 28 (6.5%) | 26 (8.7%) |
| $2,500 to $4,999 | 11 (2.5%) | 23 (7.7%) |
| $5,000 to $7,499 | 10 (2.3%) | 10 (3.3%) |
| $7,500 to $9,999 | 12 (2.8%) | 11 (3.7%) |
| $10,000 to $12,499 | 32 (7.4%) | 32 (10.7%) |
| $12,500 to $14,999 | 0 (0.0%) | 16 (5.3%) |
| $15,000 to $17,499 | 8 (1.8%) | 2 (0.7%) |
| $17,500 to $19,999 | 17 (3.9%) | 17 (5.7%) |
| $20,000 to $22,499 | 8 (1.8%) | 16 (5.3%) |
| $22,500 to $24,999 | 20 (4.6%) | 16 (5.3%) |
| $25,000 to $29,999 | 69 (15.9%) | 24 (8.0%) |
| $30,000 to $34,999 | 43 (9.9%) | 15 (5.0%) |
| $35,000 to $39,999 | 12 (2.8%) | 21 (7.0%) |
| $40,000 to $44,999 | 0 (0.0%) | 6 (2.0%) |
| $45,000 to $49,999 | 43 (9.9%) | 1 (0.3%) |
| $50,000 to $54,999 | 6 (1.4%) | 3 (1.0%) |
| $55,000 to $64,999 | 39 (9.0%) | 32 (10.7%) |
| $65,000 to $74,999 | 19 (4.4%) | 6 (2.0%) |
| $75,000 to $99,999 | 36 (8.3%) | 2 (0.7%) |
| $100,000+ | 21 (4.8%) | 21 (7.0%) |
| Total | 434 (100.0%) | 300 (100.0%) |
Earnings by Sex by Educational Attainment in Carter County
Average earnings in Carter County are $31,250 for men and $26,518 for women, a difference of 15.1%. Men with an educational attainment of college or associate's degree enjoy the highest average annual earnings of $45,114, while those with bachelor's degree education earn the least with $26,528. Women with an educational attainment of graduate degree earn the most with the average annual earnings of $38,250, while those with high school diploma education have the smallest earnings of $13,125.
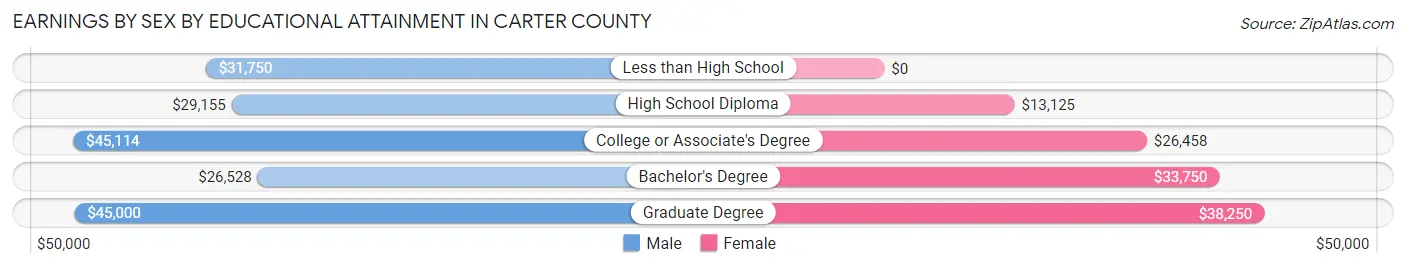
| Educational Attainment | Male Income | Female Income |
| Less than High School | $31,750 | $0 |
| High School Diploma | $29,155 | $13,125 |
| College or Associate's Degree | $45,114 | $26,458 |
| Bachelor's Degree | $26,528 | $33,750 |
| Graduate Degree | $45,000 | $38,250 |
| Total | $31,250 | $26,518 |
Family Income in Carter County
Family Income Brackets in Carter County
According to the Carter County family income data, there are 76 families falling into the $35,000 to $49,999 income range, which is the most common income bracket and makes up 23.0% of all families.
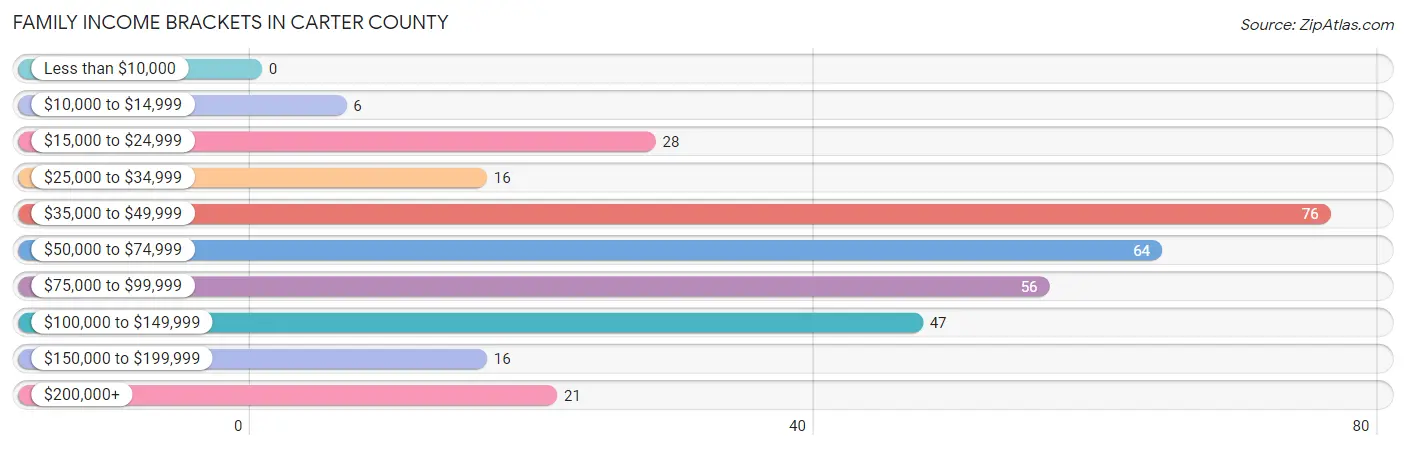
| Income Bracket | # Families | % Families |
| Less than $10,000 | 0 | 0.0% |
| $10,000 to $14,999 | 6 | 1.8% |
| $15,000 to $24,999 | 28 | 8.5% |
| $25,000 to $34,999 | 16 | 4.8% |
| $35,000 to $49,999 | 76 | 23.0% |
| $50,000 to $74,999 | 64 | 19.4% |
| $75,000 to $99,999 | 56 | 17.0% |
| $100,000 to $149,999 | 47 | 14.2% |
| $150,000 to $199,999 | 16 | 4.8% |
| $200,000+ | 21 | 6.4% |
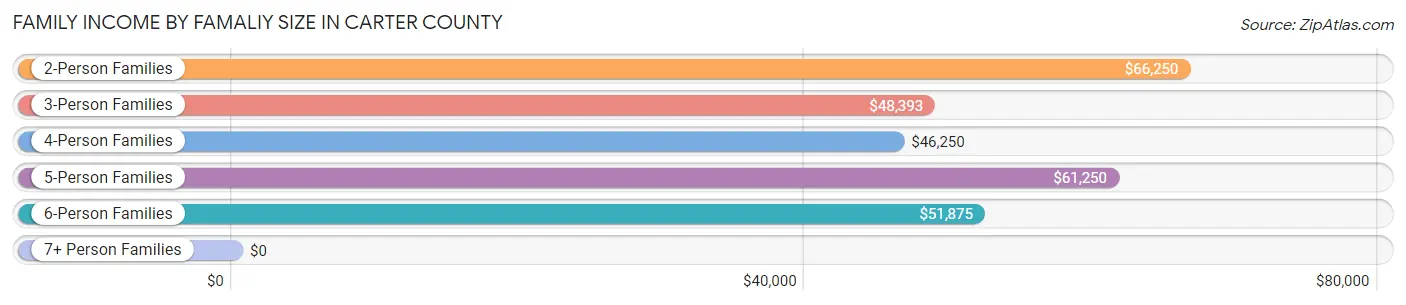
Family Income by Famaliy Size in Carter County
2-person families (234 | 70.9%) account for the highest median family income in Carter County with $66,250 per family, while 2-person families (234 | 70.9%) have the highest median income of $33,125 per family member.
| Income Bracket | # Families | Median Income |
| 2-Person Families | 234 (70.9%) | $66,250 |
| 3-Person Families | 42 (12.7%) | $48,393 |
| 4-Person Families | 17 (5.1%) | $46,250 |
| 5-Person Families | 24 (7.3%) | $61,250 |
| 6-Person Families | 13 (3.9%) | $51,875 |
| 7+ Person Families | 0 (0.0%) | $0 |
| Total | 330 (100.0%) | $61,181 |
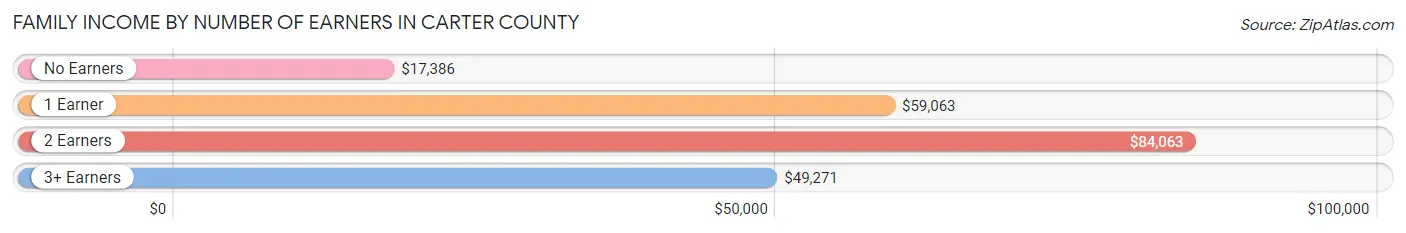
Family Income by Number of Earners in Carter County
The median family income in Carter County is $61,181, with families comprising 2 earners (157) having the highest median family income of $84,063, while families with no earners (33) have the lowest median family income of $17,386, accounting for 47.6% and 10.0% of families, respectively.
| Number of Earners | # Families | Median Income |
| No Earners | 33 (10.0%) | $17,386 |
| 1 Earner | 119 (36.1%) | $59,063 |
| 2 Earners | 157 (47.6%) | $84,063 |
| 3+ Earners | 21 (6.4%) | $49,271 |
| Total | 330 (100.0%) | $61,181 |
Household Income in Carter County
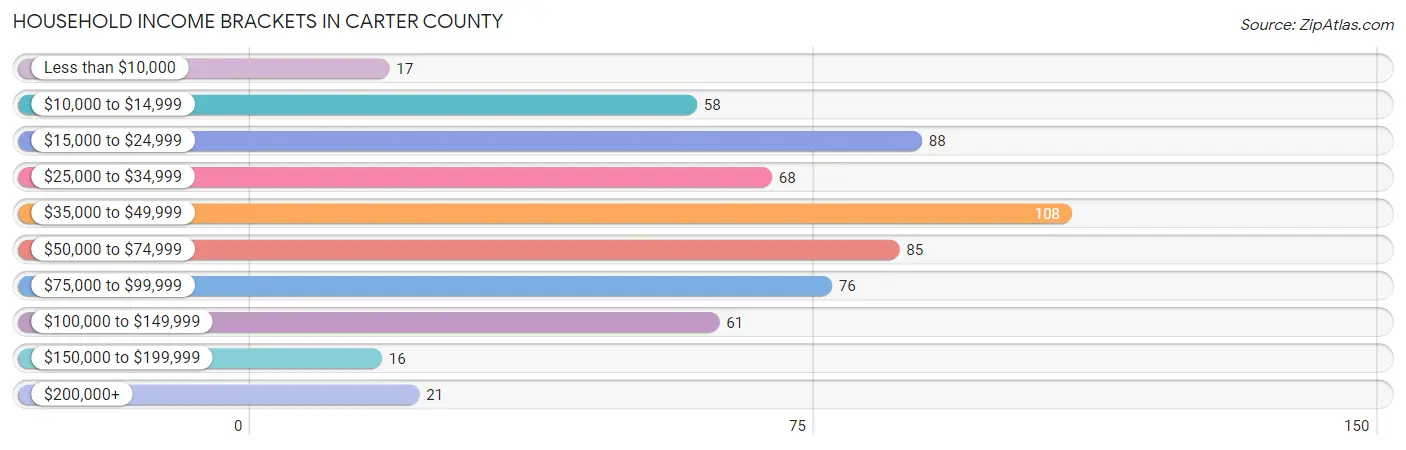
Household Income Brackets in Carter County
With 108 households falling in the category, the $35,000 to $49,999 income range is the most frequent in Carter County, accounting for 18.1% of all households. In contrast, only 16 households (2.7%) fall into the $150,000 to $199,999 income bracket, making it the least populous group.
| Income Bracket | # Households | % Households |
| Less than $10,000 | 17 | 2.8% |
| $10,000 to $14,999 | 58 | 9.7% |
| $15,000 to $24,999 | 88 | 14.7% |
| $25,000 to $34,999 | 68 | 11.4% |
| $35,000 to $49,999 | 108 | 18.1% |
| $50,000 to $74,999 | 85 | 14.2% |
| $75,000 to $99,999 | 76 | 12.7% |
| $100,000 to $149,999 | 61 | 10.2% |
| $150,000 to $199,999 | 16 | 2.7% |
| $200,000+ | 21 | 3.5% |
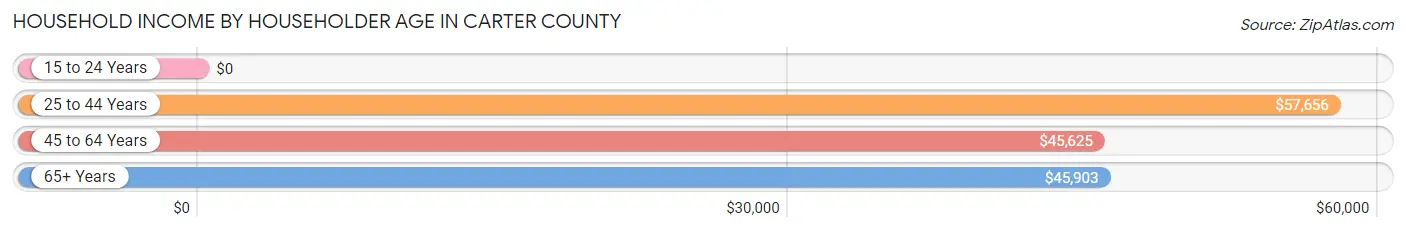
Household Income by Householder Age in Carter County
The median household income in Carter County is $46,486, with the highest median household income of $57,656 found in the 25 to 44 years age bracket for the primary householder. A total of 127 households (21.2%) fall into this category. Meanwhile, the 15 to 24 years age bracket for the primary householder has the lowest median household income of $0, with 25 households (4.2%) in this group.
| Income Bracket | # Households | Median Income |
| 15 to 24 Years | 25 (4.2%) | $0 |
| 25 to 44 Years | 127 (21.2%) | $57,656 |
| 45 to 64 Years | 211 (35.3%) | $45,625 |
| 65+ Years | 235 (39.3%) | $45,903 |
| Total | 598 (100.0%) | $46,486 |
Poverty in Carter County
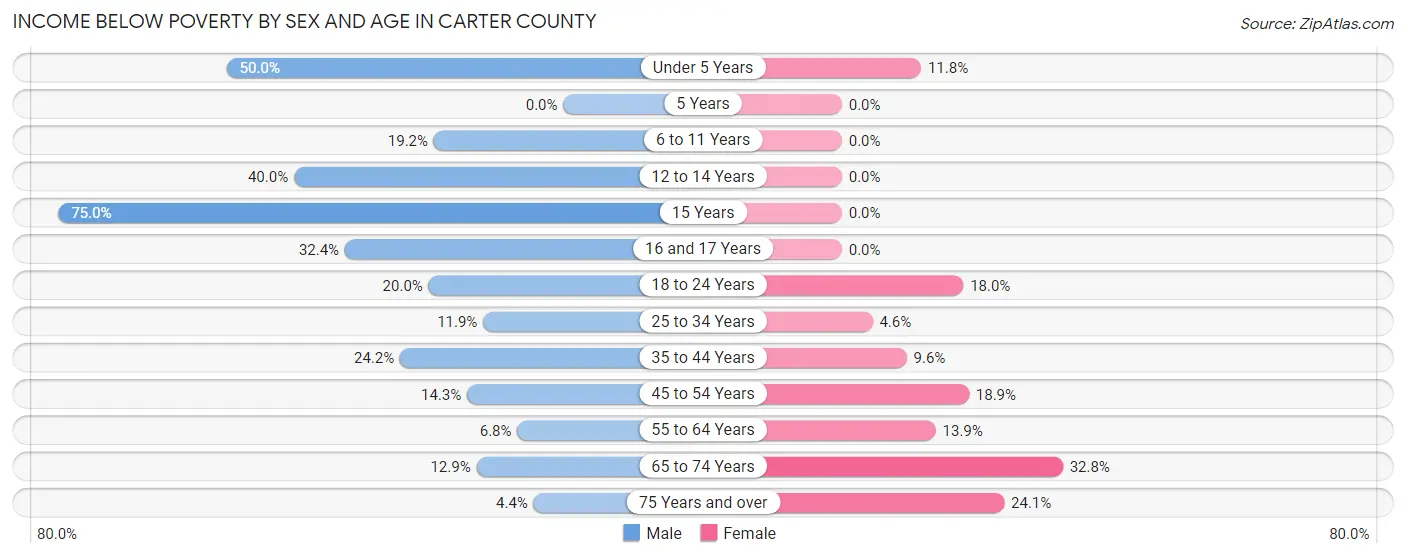
Income Below Poverty by Sex and Age in Carter County
With 16.4% poverty level for males and 17.7% for females among the residents of Carter County, 15 year old males and 65 to 74 year old females are the most vulnerable to poverty, with 6 males (75.0%) and 41 females (32.8%) in their respective age groups living below the poverty level.
| Age Bracket | Male | Female |
| Under 5 Years | 14 (50.0%) | 4 (11.8%) |
| 5 Years | 0 (0.0%) | 0 (0.0%) |
| 6 to 11 Years | 10 (19.2%) | 0 (0.0%) |
| 12 to 14 Years | 8 (40.0%) | 0 (0.0%) |
| 15 Years | 6 (75.0%) | 0 (0.0%) |
| 16 and 17 Years | 12 (32.4%) | 0 (0.0%) |
| 18 to 24 Years | 7 (20.0%) | 11 (18.0%) |
| 25 to 34 Years | 5 (11.9%) | 2 (4.5%) |
| 35 to 44 Years | 16 (24.2%) | 5 (9.6%) |
| 45 to 54 Years | 4 (14.3%) | 10 (18.9%) |
| 55 to 64 Years | 11 (6.8%) | 17 (13.9%) |
| 65 to 74 Years | 16 (12.9%) | 41 (32.8%) |
| 75 Years and over | 3 (4.4%) | 20 (24.1%) |
| Total | 112 (16.4%) | 110 (17.7%) |
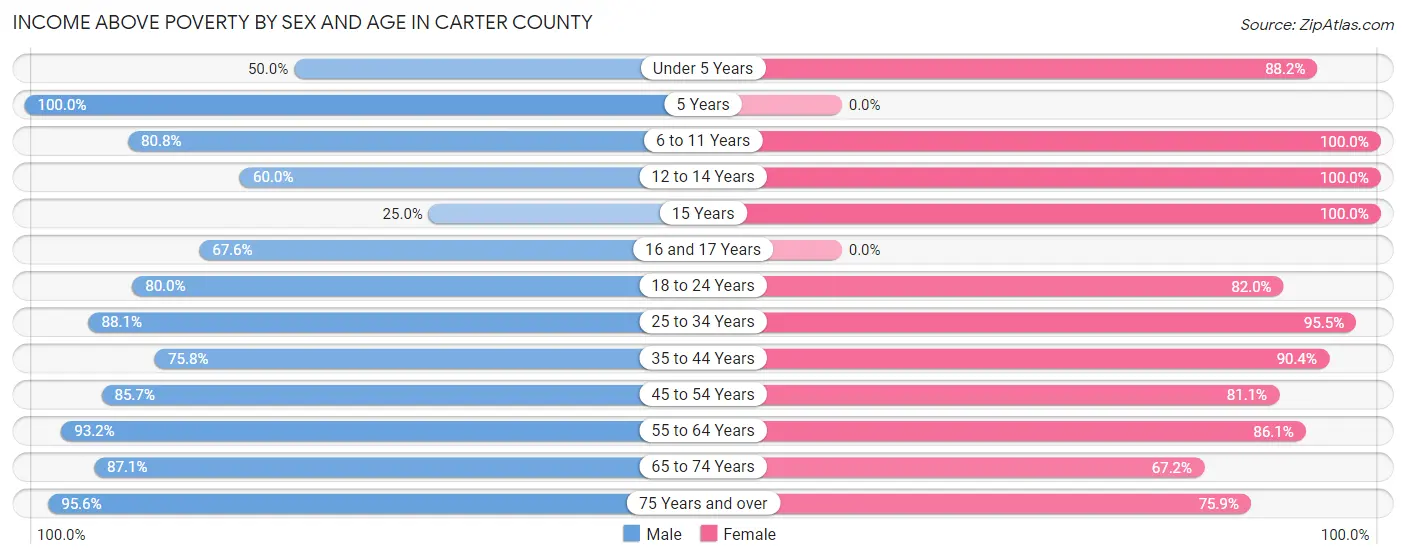
Income Above Poverty by Sex and Age in Carter County
According to the poverty statistics in Carter County, males aged 5 years and females aged 6 to 11 years are the age groups that are most secure financially, with 100.0% of males and 100.0% of females in these age groups living above the poverty line.
| Age Bracket | Male | Female |
| Under 5 Years | 14 (50.0%) | 30 (88.2%) |
| 5 Years | 14 (100.0%) | 0 (0.0%) |
| 6 to 11 Years | 42 (80.8%) | 39 (100.0%) |
| 12 to 14 Years | 12 (60.0%) | 3 (100.0%) |
| 15 Years | 2 (25.0%) | 7 (100.0%) |
| 16 and 17 Years | 25 (67.6%) | 0 (0.0%) |
| 18 to 24 Years | 28 (80.0%) | 50 (82.0%) |
| 25 to 34 Years | 37 (88.1%) | 42 (95.5%) |
| 35 to 44 Years | 50 (75.8%) | 47 (90.4%) |
| 45 to 54 Years | 24 (85.7%) | 43 (81.1%) |
| 55 to 64 Years | 150 (93.2%) | 105 (86.1%) |
| 65 to 74 Years | 108 (87.1%) | 84 (67.2%) |
| 75 Years and over | 65 (95.6%) | 63 (75.9%) |
| Total | 571 (83.6%) | 513 (82.3%) |
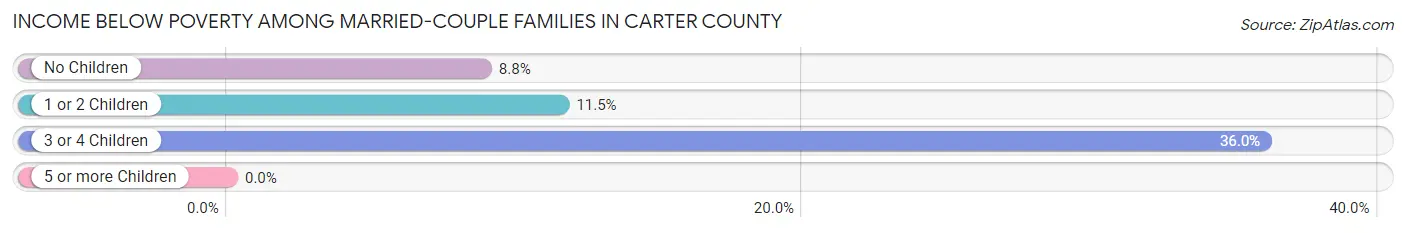
Income Below Poverty Among Married-Couple Families in Carter County
The poverty statistics for married-couple families in Carter County show that 11.6% or 34 of the total 292 families live below the poverty line. Families with 3 or 4 children have the highest poverty rate of 36.0%, comprising of 9 families. On the other hand, families with no children have the lowest poverty rate of 8.8%, which includes 19 families.
| Children | Above Poverty | Below Poverty |
| No Children | 196 (91.2%) | 19 (8.8%) |
| 1 or 2 Children | 46 (88.5%) | 6 (11.5%) |
| 3 or 4 Children | 16 (64.0%) | 9 (36.0%) |
| 5 or more Children | 0 (0.0%) | 0 (0.0%) |
| Total | 258 (88.4%) | 34 (11.6%) |
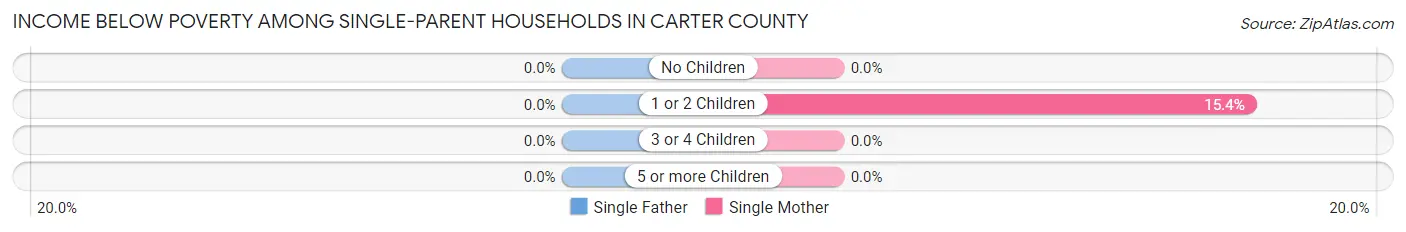
Income Below Poverty Among Single-Parent Households in Carter County
| Children | Single Father | Single Mother |
| No Children | 0 (0.0%) | 0 (0.0%) |
| 1 or 2 Children | 0 (0.0%) | 2 (15.4%) |
| 3 or 4 Children | 0 (0.0%) | 0 (0.0%) |
| 5 or more Children | 0 (0.0%) | 0 (0.0%) |
| Total | 0 (0.0%) | 2 (13.3%) |
Income Below Poverty Among Married-Couple vs Single-Parent Households in Carter County
The poverty data for Carter County shows that 34 of the married-couple family households (11.6%) and 2 of the single-parent households (5.3%) are living below the poverty level. Within the married-couple family households, those with 3 or 4 children have the highest poverty rate, with 9 households (36.0%) falling below the poverty line. Among the single-parent households, those with 1 or 2 children have the highest poverty rate, with 2 household (15.4%) living below poverty.
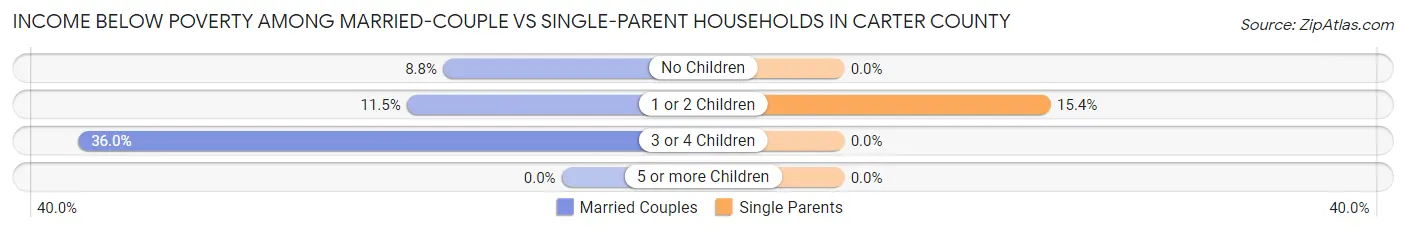
| Children | Married-Couple Families | Single-Parent Households |
| No Children | 19 (8.8%) | 0 (0.0%) |
| 1 or 2 Children | 6 (11.5%) | 2 (15.4%) |
| 3 or 4 Children | 9 (36.0%) | 0 (0.0%) |
| 5 or more Children | 0 (0.0%) | 0 (0.0%) |
| Total | 34 (11.6%) | 2 (5.3%) |
Employment Characteristics in Carter County
Employment by Class of Employer in Carter County
Among the 648 employed individuals in Carter County, self-employed (not incorporated) (242 | 37.3%), private company employees (203 | 31.3%), and local government employees (69 | 10.6%) make up the most common classes of employment.
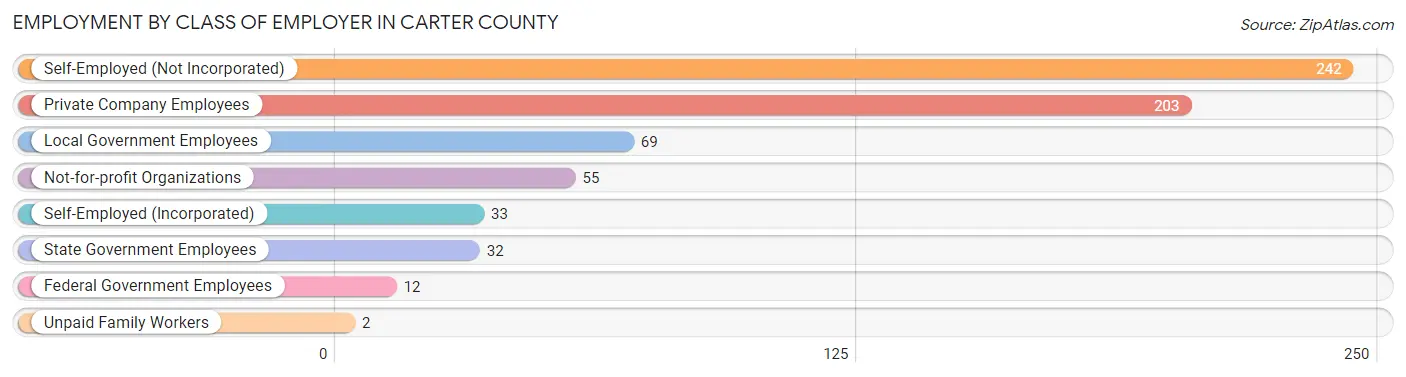
| Employer Class | # Employees | % Employees |
| Private Company Employees | 203 | 31.3% |
| Self-Employed (Incorporated) | 33 | 5.1% |
| Self-Employed (Not Incorporated) | 242 | 37.3% |
| Not-for-profit Organizations | 55 | 8.5% |
| Local Government Employees | 69 | 10.6% |
| State Government Employees | 32 | 4.9% |
| Federal Government Employees | 12 | 1.8% |
| Unpaid Family Workers | 2 | 0.3% |
| Total | 648 | 100.0% |
Employment Status by Age in Carter County
According to the labor force statistics for Carter County, out of the total population over 16 years of age (1,127), 60.2% or 678 individuals are in the labor force, with 2.4% or 16 of them unemployed. The age group with the highest labor force participation rate is 25 to 29 years, with 100.0% or 26 individuals in the labor force. Within the labor force, the 20 to 24 years age range has the highest percentage of unemployed individuals, with 27.9% or 12 of them being unemployed.
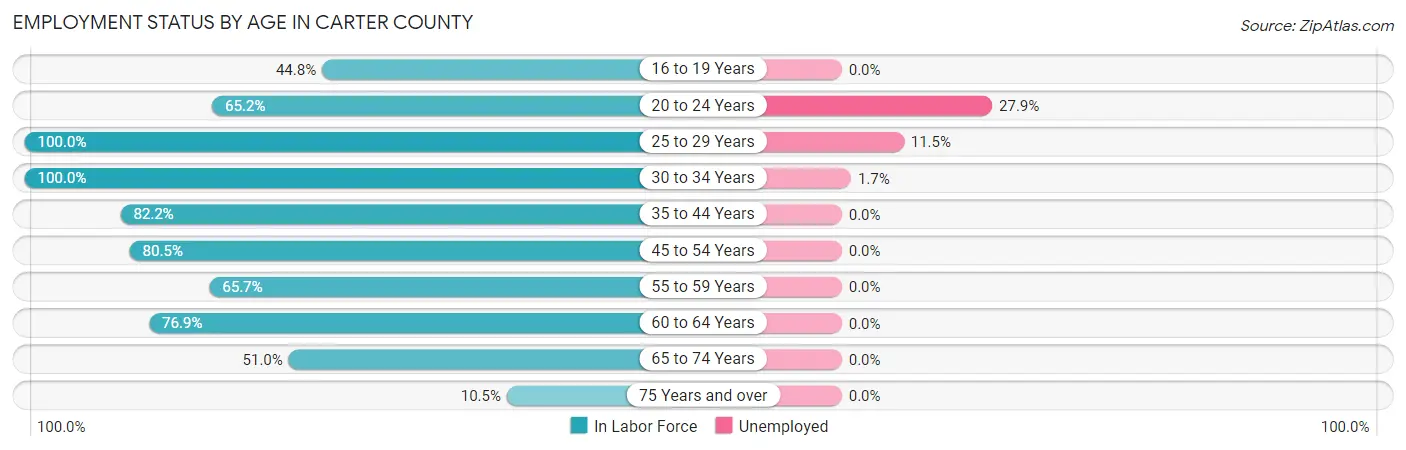
| Age Bracket | In Labor Force | Unemployed |
| 16 to 19 Years | 30 (44.8%) | 0 (0.0%) |
| 20 to 24 Years | 43 (65.2%) | 12 (27.9%) |
| 25 to 29 Years | 26 (100.0%) | 3 (11.5%) |
| 30 to 34 Years | 60 (100.0%) | 1 (1.7%) |
| 35 to 44 Years | 97 (82.2%) | 0 (0.0%) |
| 45 to 54 Years | 66 (80.5%) | 0 (0.0%) |
| 55 to 59 Years | 90 (65.7%) | 0 (0.0%) |
| 60 to 64 Years | 123 (76.9%) | 0 (0.0%) |
| 65 to 74 Years | 127 (51.0%) | 0 (0.0%) |
| 75 Years and over | 17 (10.5%) | 0 (0.0%) |
| Total | 678 (60.2%) | 16 (2.4%) |
Employment Status by Educational Attainment in Carter County
According to labor force statistics for Carter County, 79.2% of individuals (462) out of the total population between 25 and 64 years of age (583) are in the labor force, with 0.9% or 4 of them being unemployed. The group with the highest labor force participation rate are those with the educational attainment of high school diploma, with 85.6% or 137 individuals in the labor force. Within the labor force, individuals with bachelor's degree or higher education have the highest percentage of unemployment, with 2.5% or 3 of them being unemployed.
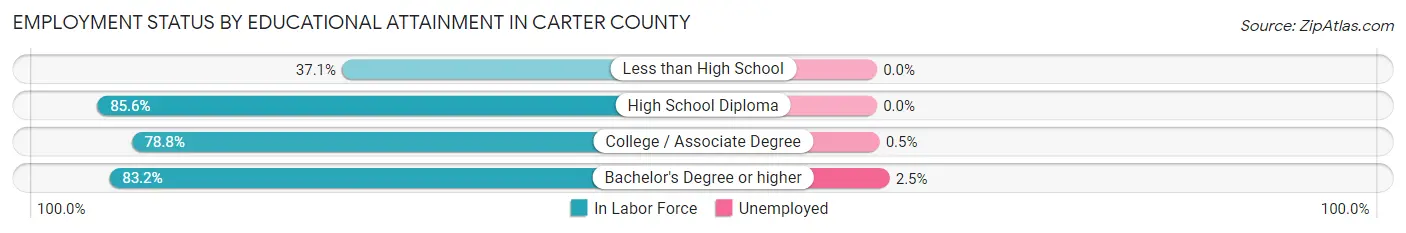
| Educational Attainment | In Labor Force | Unemployed |
| Less than High School | 13 (37.1%) | 0 (0.0%) |
| High School Diploma | 137 (85.6%) | 0 (0.0%) |
| College / Associate Degree | 193 (78.8%) | 1 (0.5%) |
| Bachelor's Degree or higher | 119 (83.2%) | 4 (2.5%) |
| Total | 462 (79.2%) | 5 (0.9%) |
Employment Occupations by Sex in Carter County
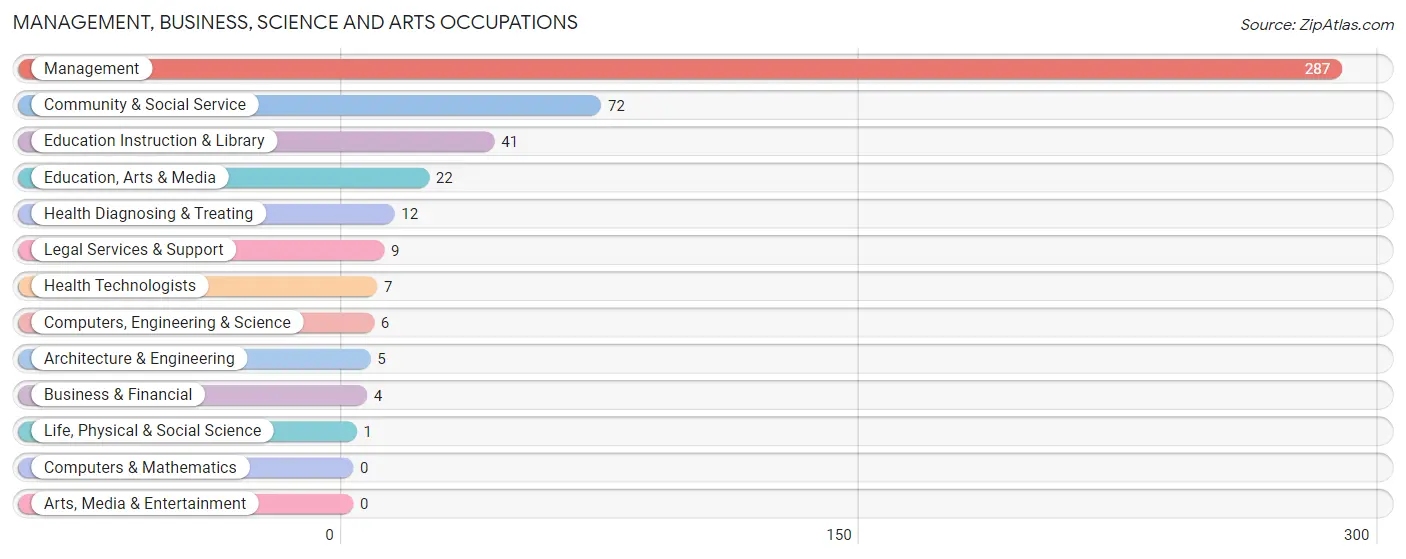
Management, Business, Science and Arts Occupations
The most common Management, Business, Science and Arts occupations in Carter County are Management (287 | 43.3%), Community & Social Service (72 | 10.9%), Education Instruction & Library (41 | 6.2%), Education, Arts & Media (22 | 3.3%), and Health Diagnosing & Treating (12 | 1.8%).
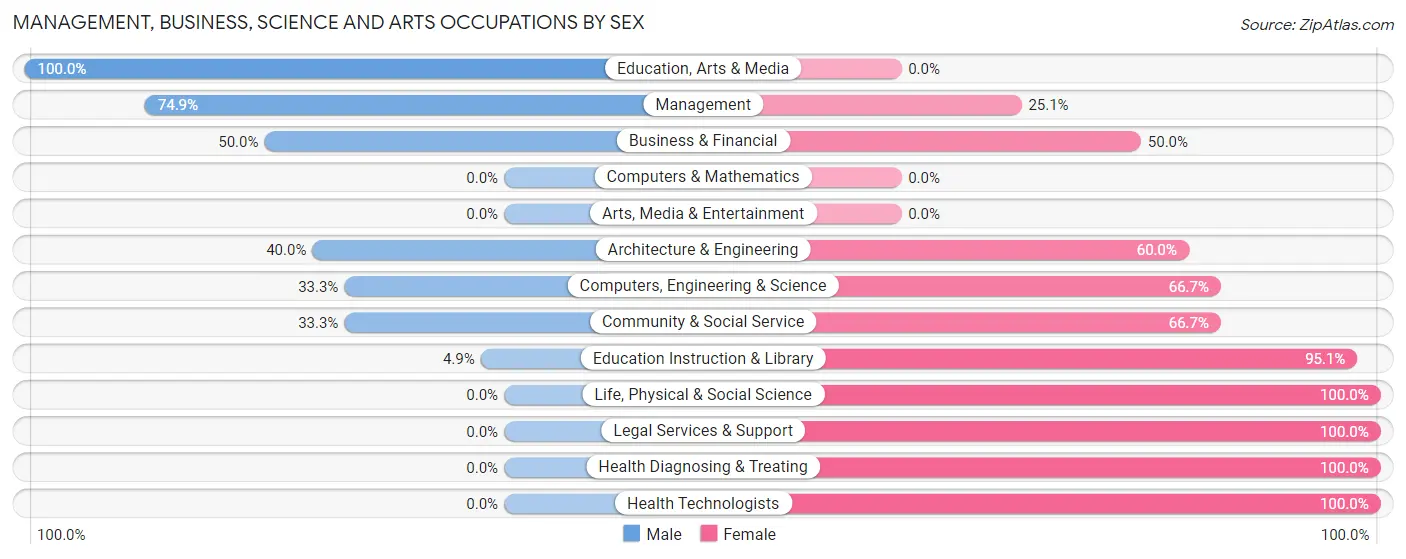
Management, Business, Science and Arts Occupations by Sex
Within the Management, Business, Science and Arts occupations in Carter County, the most male-oriented occupations are Education, Arts & Media (100.0%), Management (74.9%), and Business & Financial (50.0%), while the most female-oriented occupations are Life, Physical & Social Science (100.0%), Legal Services & Support (100.0%), and Health Diagnosing & Treating (100.0%).
| Occupation | Male | Female |
| Management | 215 (74.9%) | 72 (25.1%) |
| Business & Financial | 2 (50.0%) | 2 (50.0%) |
| Computers, Engineering & Science | 2 (33.3%) | 4 (66.7%) |
| Computers & Mathematics | 0 (0.0%) | 0 (0.0%) |
| Architecture & Engineering | 2 (40.0%) | 3 (60.0%) |
| Life, Physical & Social Science | 0 (0.0%) | 1 (100.0%) |
| Community & Social Service | 24 (33.3%) | 48 (66.7%) |
| Education, Arts & Media | 22 (100.0%) | 0 (0.0%) |
| Legal Services & Support | 0 (0.0%) | 9 (100.0%) |
| Education Instruction & Library | 2 (4.9%) | 39 (95.1%) |
| Arts, Media & Entertainment | 0 (0.0%) | 0 (0.0%) |
| Health Diagnosing & Treating | 0 (0.0%) | 12 (100.0%) |
| Health Technologists | 0 (0.0%) | 7 (100.0%) |
| Total (Category) | 243 (63.8%) | 138 (36.2%) |
| Total (Overall) | 397 (59.9%) | 266 (40.1%) |
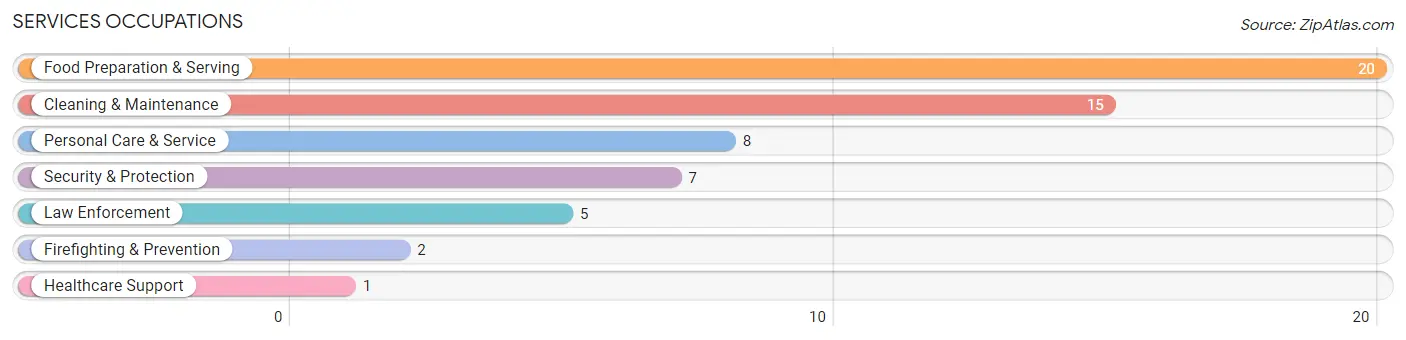
Services Occupations
The most common Services occupations in Carter County are Food Preparation & Serving (20 | 3.0%), Cleaning & Maintenance (15 | 2.3%), Personal Care & Service (8 | 1.2%), Security & Protection (7 | 1.1%), and Law Enforcement (5 | 0.7%).
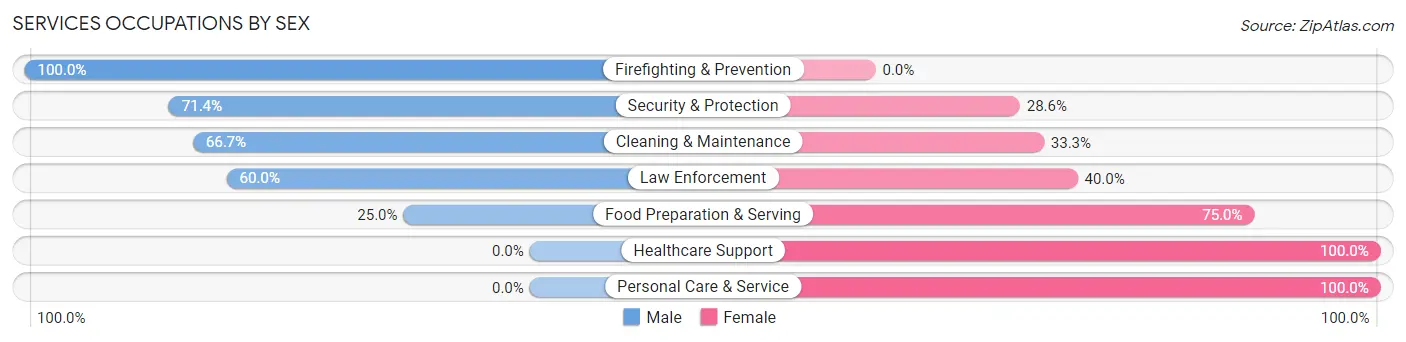
Services Occupations by Sex
Within the Services occupations in Carter County, the most male-oriented occupations are Firefighting & Prevention (100.0%), Security & Protection (71.4%), and Cleaning & Maintenance (66.7%), while the most female-oriented occupations are Healthcare Support (100.0%), Personal Care & Service (100.0%), and Food Preparation & Serving (75.0%).
| Occupation | Male | Female |
| Healthcare Support | 0 (0.0%) | 1 (100.0%) |
| Security & Protection | 5 (71.4%) | 2 (28.6%) |
| Firefighting & Prevention | 2 (100.0%) | 0 (0.0%) |
| Law Enforcement | 3 (60.0%) | 2 (40.0%) |
| Food Preparation & Serving | 5 (25.0%) | 15 (75.0%) |
| Cleaning & Maintenance | 10 (66.7%) | 5 (33.3%) |
| Personal Care & Service | 0 (0.0%) | 8 (100.0%) |
| Total (Category) | 20 (39.2%) | 31 (60.8%) |
| Total (Overall) | 397 (59.9%) | 266 (40.1%) |
Sales and Office Occupations
The most common Sales and Office occupations in Carter County are Office & Administration (49 | 7.4%), and Sales & Related (35 | 5.3%).
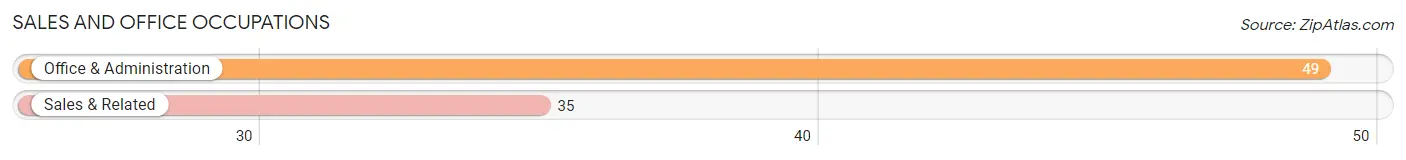
Sales and Office Occupations by Sex
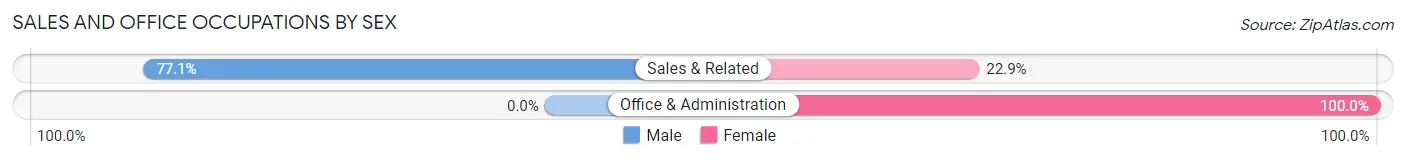
| Occupation | Male | Female |
| Sales & Related | 27 (77.1%) | 8 (22.9%) |
| Office & Administration | 0 (0.0%) | 49 (100.0%) |
| Total (Category) | 27 (32.1%) | 57 (67.9%) |
| Total (Overall) | 397 (59.9%) | 266 (40.1%) |
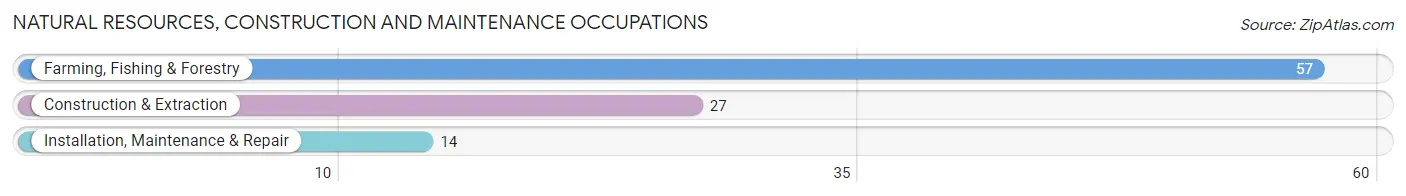
Natural Resources, Construction and Maintenance Occupations
The most common Natural Resources, Construction and Maintenance occupations in Carter County are Farming, Fishing & Forestry (57 | 8.6%), Construction & Extraction (27 | 4.1%), and Installation, Maintenance & Repair (14 | 2.1%).
Natural Resources, Construction and Maintenance Occupations by Sex
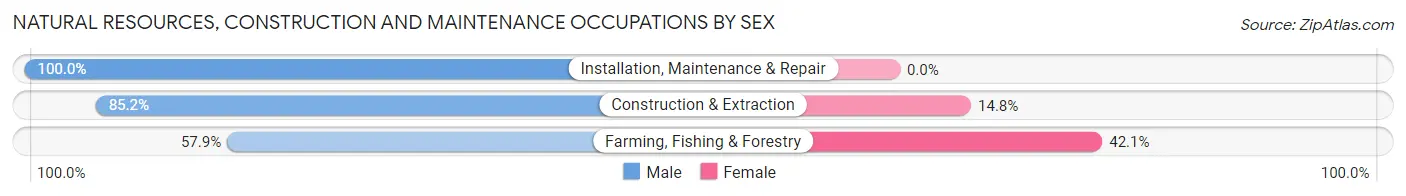
| Occupation | Male | Female |
| Farming, Fishing & Forestry | 33 (57.9%) | 24 (42.1%) |
| Construction & Extraction | 23 (85.2%) | 4 (14.8%) |
| Installation, Maintenance & Repair | 14 (100.0%) | 0 (0.0%) |
| Total (Category) | 70 (71.4%) | 28 (28.6%) |
| Total (Overall) | 397 (59.9%) | 266 (40.1%) |
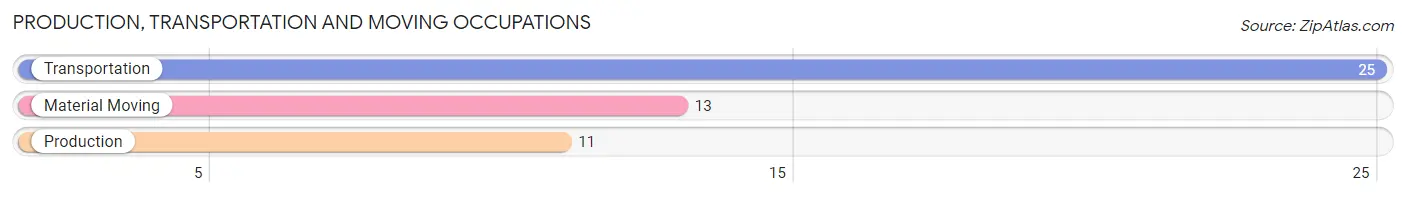
Production, Transportation and Moving Occupations
The most common Production, Transportation and Moving occupations in Carter County are Transportation (25 | 3.8%), Material Moving (13 | 2.0%), and Production (11 | 1.7%).
Production, Transportation and Moving Occupations by Sex
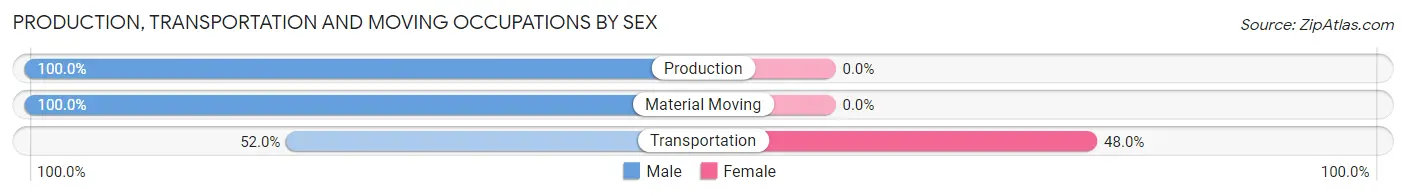
| Occupation | Male | Female |
| Production | 11 (100.0%) | 0 (0.0%) |
| Transportation | 13 (52.0%) | 12 (48.0%) |
| Material Moving | 13 (100.0%) | 0 (0.0%) |
| Total (Category) | 37 (75.5%) | 12 (24.5%) |
| Total (Overall) | 397 (59.9%) | 266 (40.1%) |
Employment Industries by Sex in Carter County
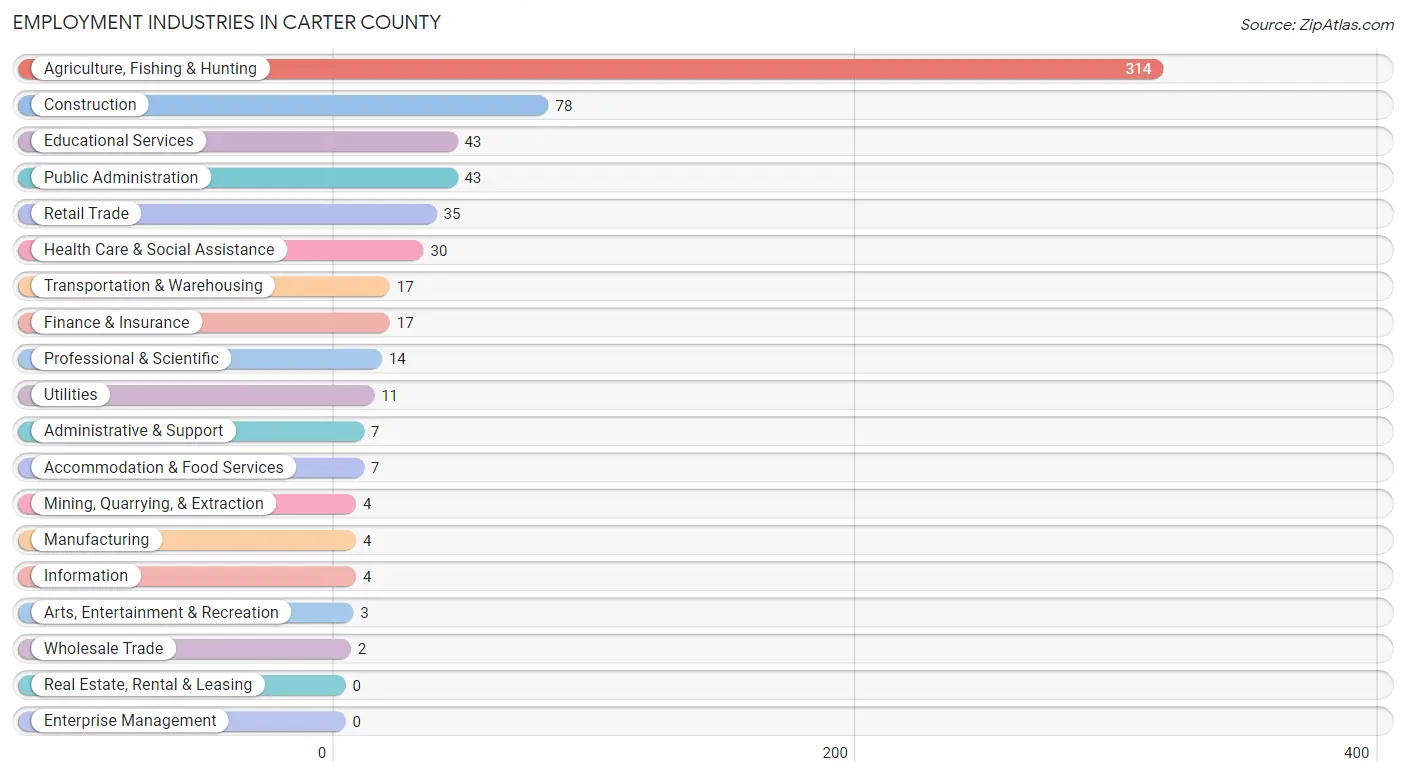
Employment Industries in Carter County
The major employment industries in Carter County include Agriculture, Fishing & Hunting (314 | 47.4%), Construction (78 | 11.8%), Educational Services (43 | 6.5%), Public Administration (43 | 6.5%), and Retail Trade (35 | 5.3%).
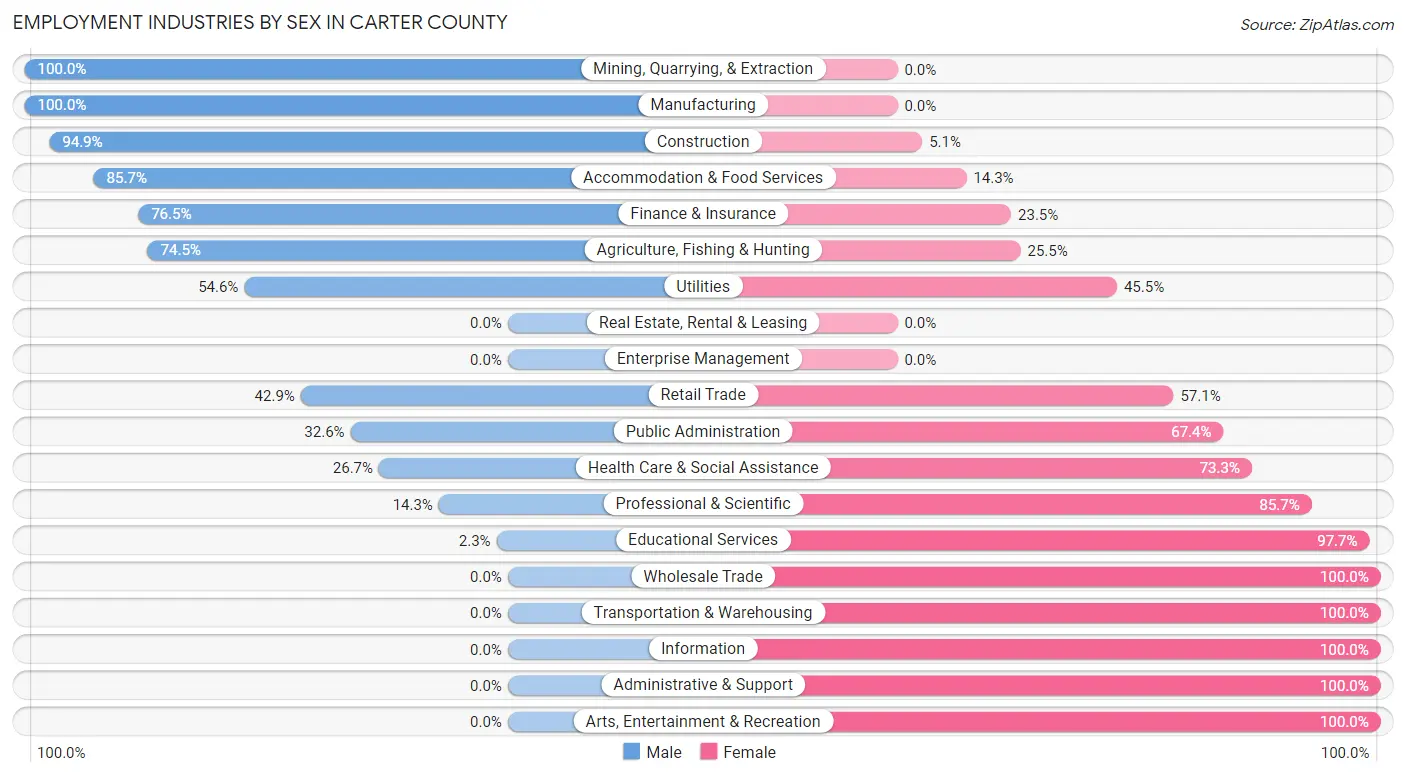
Employment Industries by Sex in Carter County
The Carter County industries that see more men than women are Mining, Quarrying, & Extraction (100.0%), Manufacturing (100.0%), and Construction (94.9%), whereas the industries that tend to have a higher number of women are Wholesale Trade (100.0%), Transportation & Warehousing (100.0%), and Information (100.0%).
| Industry | Male | Female |
| Agriculture, Fishing & Hunting | 234 (74.5%) | 80 (25.5%) |
| Mining, Quarrying, & Extraction | 4 (100.0%) | 0 (0.0%) |
| Construction | 74 (94.9%) | 4 (5.1%) |
| Manufacturing | 4 (100.0%) | 0 (0.0%) |
| Wholesale Trade | 0 (0.0%) | 2 (100.0%) |
| Retail Trade | 15 (42.9%) | 20 (57.1%) |
| Transportation & Warehousing | 0 (0.0%) | 17 (100.0%) |
| Utilities | 6 (54.5%) | 5 (45.5%) |
| Information | 0 (0.0%) | 4 (100.0%) |
| Finance & Insurance | 13 (76.5%) | 4 (23.5%) |
| Real Estate, Rental & Leasing | 0 (0.0%) | 0 (0.0%) |
| Professional & Scientific | 2 (14.3%) | 12 (85.7%) |
| Enterprise Management | 0 (0.0%) | 0 (0.0%) |
| Administrative & Support | 0 (0.0%) | 7 (100.0%) |
| Educational Services | 1 (2.3%) | 42 (97.7%) |
| Health Care & Social Assistance | 8 (26.7%) | 22 (73.3%) |
| Arts, Entertainment & Recreation | 0 (0.0%) | 3 (100.0%) |
| Accommodation & Food Services | 6 (85.7%) | 1 (14.3%) |
| Public Administration | 14 (32.6%) | 29 (67.4%) |
| Total | 397 (59.9%) | 266 (40.1%) |
Education in Carter County
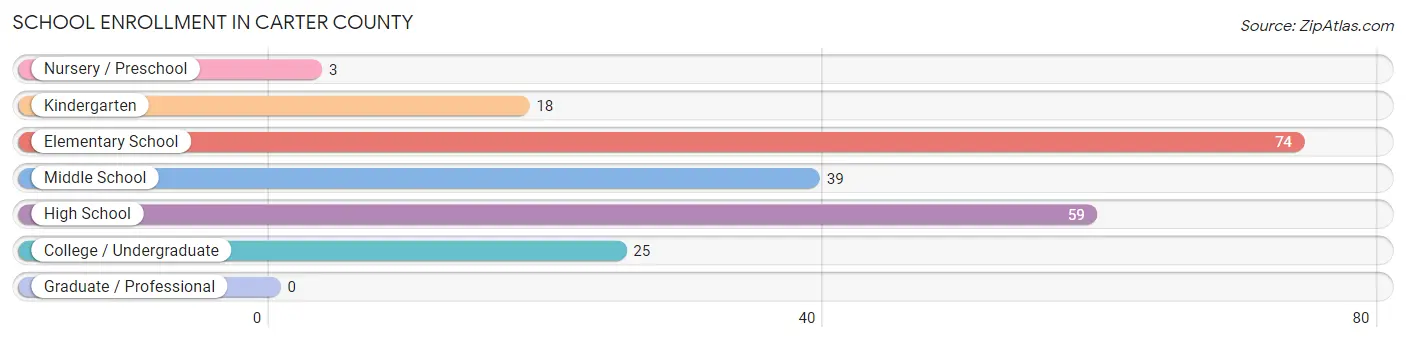
School Enrollment in Carter County
The most common levels of schooling among the 218 students in Carter County are elementary school (74 | 33.9%), high school (59 | 27.1%), and middle school (39 | 17.9%).
| School Level | # Students | % Students |
| Nursery / Preschool | 3 | 1.4% |
| Kindergarten | 18 | 8.3% |
| Elementary School | 74 | 33.9% |
| Middle School | 39 | 17.9% |
| High School | 59 | 27.1% |
| College / Undergraduate | 25 | 11.5% |
| Graduate / Professional | 0 | 0.0% |
| Total | 218 | 100.0% |
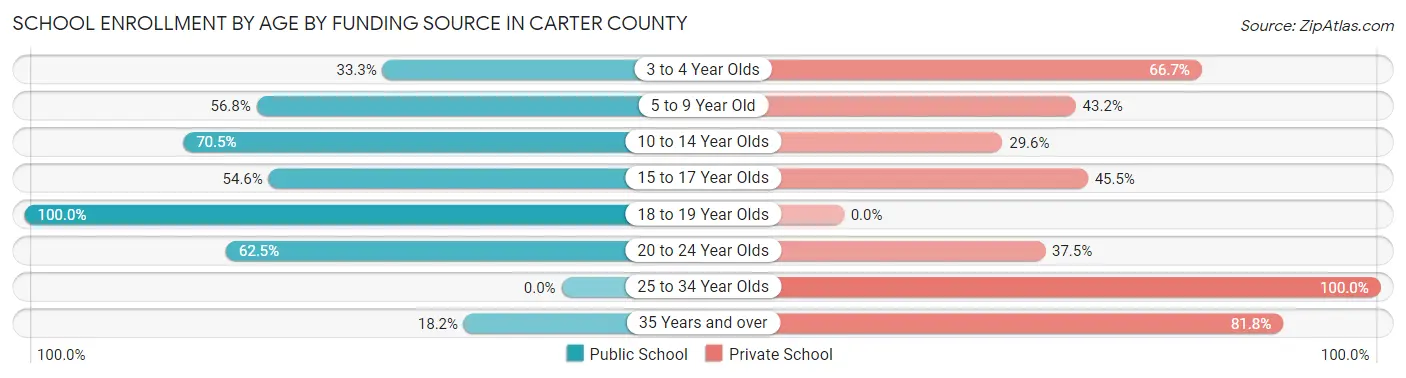
School Enrollment by Age by Funding Source in Carter County
Out of a total of 218 students who are enrolled in schools in Carter County, 89 (40.8%) attend a private institution, while the remaining 129 (59.2%) are enrolled in public schools. The age group of 25 to 34 year olds has the highest likelihood of being enrolled in private schools, with 4 (100.0% in the age bracket) enrolled. Conversely, the age group of 18 to 19 year olds has the lowest likelihood of being enrolled in a private school, with 15 (100.0% in the age bracket) attending a public institution.
| Age Bracket | Public School | Private School |
| 3 to 4 Year Olds | 1 (33.3%) | 2 (66.7%) |
| 5 to 9 Year Old | 46 (56.8%) | 35 (43.2%) |
| 10 to 14 Year Olds | 31 (70.5%) | 13 (29.5%) |
| 15 to 17 Year Olds | 24 (54.5%) | 20 (45.5%) |
| 18 to 19 Year Olds | 15 (100.0%) | 0 (0.0%) |
| 20 to 24 Year Olds | 10 (62.5%) | 6 (37.5%) |
| 25 to 34 Year Olds | 0 (0.0%) | 4 (100.0%) |
| 35 Years and over | 2 (18.2%) | 9 (81.8%) |
| Total | 129 (59.2%) | 89 (40.8%) |
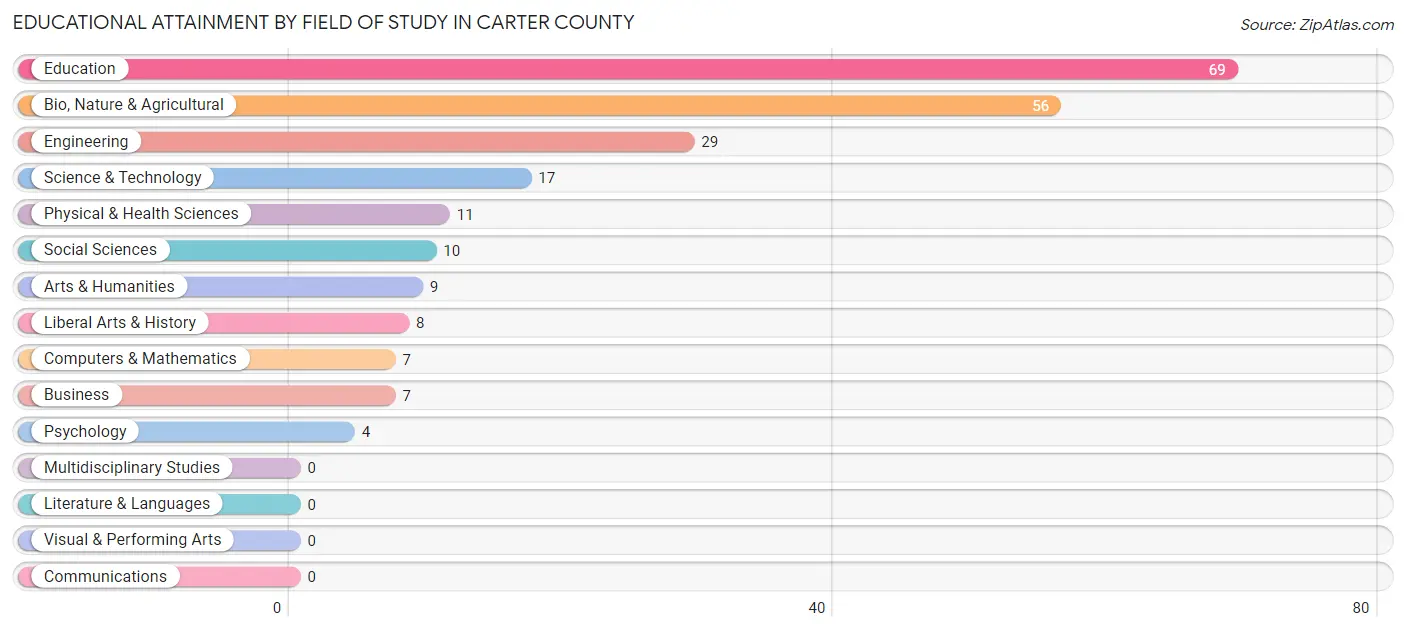
Educational Attainment by Field of Study in Carter County
Education (69 | 30.4%), bio, nature & agricultural (56 | 24.7%), engineering (29 | 12.8%), science & technology (17 | 7.5%), and physical & health sciences (11 | 4.9%) are the most common fields of study among 227 individuals in Carter County who have obtained a bachelor's degree or higher.
| Field of Study | # Graduates | % Graduates |
| Computers & Mathematics | 7 | 3.1% |
| Bio, Nature & Agricultural | 56 | 24.7% |
| Physical & Health Sciences | 11 | 4.9% |
| Psychology | 4 | 1.8% |
| Social Sciences | 10 | 4.4% |
| Engineering | 29 | 12.8% |
| Multidisciplinary Studies | 0 | 0.0% |
| Science & Technology | 17 | 7.5% |
| Business | 7 | 3.1% |
| Education | 69 | 30.4% |
| Literature & Languages | 0 | 0.0% |
| Liberal Arts & History | 8 | 3.5% |
| Visual & Performing Arts | 0 | 0.0% |
| Communications | 0 | 0.0% |
| Arts & Humanities | 9 | 4.0% |
| Total | 227 | 100.0% |
Transportation & Commute in Carter County
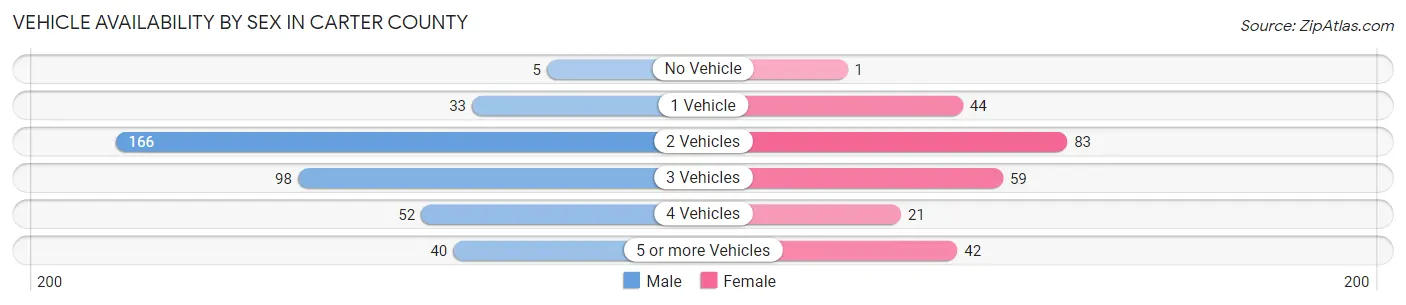
Vehicle Availability by Sex in Carter County
The most prevalent vehicle ownership categories in Carter County are males with 2 vehicles (166, accounting for 42.1%) and females with 2 vehicles (83, making up 66.4%).
| Vehicles Available | Male | Female |
| No Vehicle | 5 (1.3%) | 1 (0.4%) |
| 1 Vehicle | 33 (8.4%) | 44 (17.6%) |
| 2 Vehicles | 166 (42.1%) | 83 (33.2%) |
| 3 Vehicles | 98 (24.9%) | 59 (23.6%) |
| 4 Vehicles | 52 (13.2%) | 21 (8.4%) |
| 5 or more Vehicles | 40 (10.2%) | 42 (16.8%) |
| Total | 394 (100.0%) | 250 (100.0%) |
Commute Time in Carter County
The most frequently occuring commute durations in Carter County are 5 to 9 minutes (152 commuters, 34.2%), less than 5 minutes (96 commuters, 21.6%), and 30 to 34 minutes (69 commuters, 15.5%).
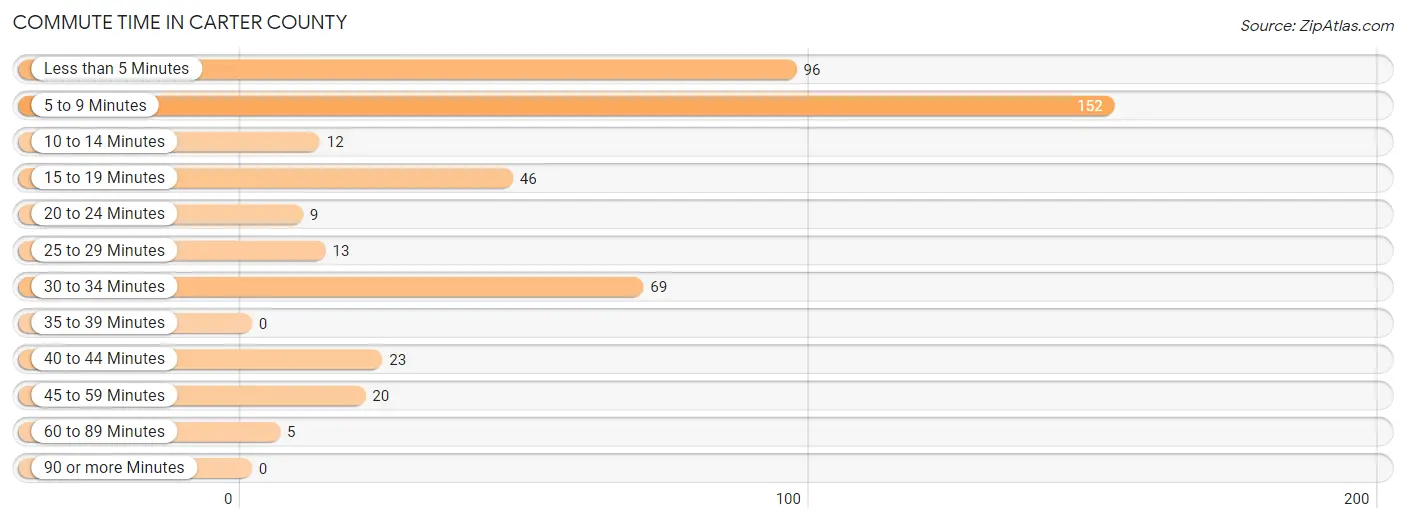
| Commute Time | # Commuters | % Commuters |
| Less than 5 Minutes | 96 | 21.6% |
| 5 to 9 Minutes | 152 | 34.2% |
| 10 to 14 Minutes | 12 | 2.7% |
| 15 to 19 Minutes | 46 | 10.3% |
| 20 to 24 Minutes | 9 | 2.0% |
| 25 to 29 Minutes | 13 | 2.9% |
| 30 to 34 Minutes | 69 | 15.5% |
| 35 to 39 Minutes | 0 | 0.0% |
| 40 to 44 Minutes | 23 | 5.2% |
| 45 to 59 Minutes | 20 | 4.5% |
| 60 to 89 Minutes | 5 | 1.1% |
| 90 or more Minutes | 0 | 0.0% |
Commute Time by Sex in Carter County
The most common commute times in Carter County are 5 to 9 minutes (103 commuters, 37.4%) for males and 5 to 9 minutes (49 commuters, 28.8%) for females.
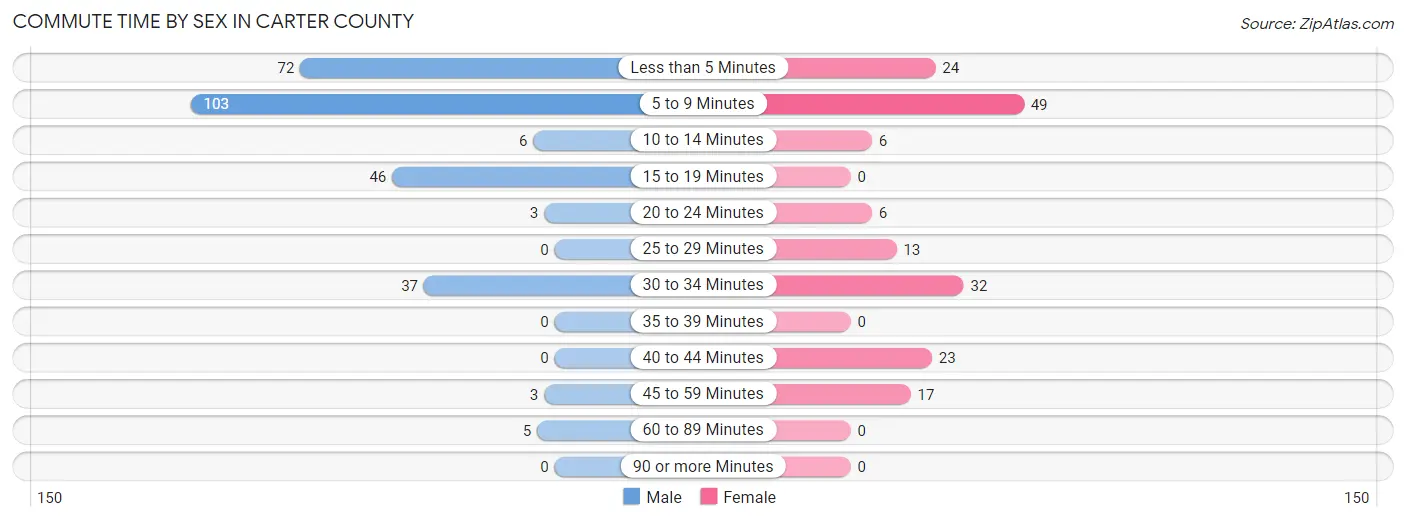
| Commute Time | Male | Female |
| Less than 5 Minutes | 72 (26.2%) | 24 (14.1%) |
| 5 to 9 Minutes | 103 (37.4%) | 49 (28.8%) |
| 10 to 14 Minutes | 6 (2.2%) | 6 (3.5%) |
| 15 to 19 Minutes | 46 (16.7%) | 0 (0.0%) |
| 20 to 24 Minutes | 3 (1.1%) | 6 (3.5%) |
| 25 to 29 Minutes | 0 (0.0%) | 13 (7.6%) |
| 30 to 34 Minutes | 37 (13.5%) | 32 (18.8%) |
| 35 to 39 Minutes | 0 (0.0%) | 0 (0.0%) |
| 40 to 44 Minutes | 0 (0.0%) | 23 (13.5%) |
| 45 to 59 Minutes | 3 (1.1%) | 17 (10.0%) |
| 60 to 89 Minutes | 5 (1.8%) | 0 (0.0%) |
| 90 or more Minutes | 0 (0.0%) | 0 (0.0%) |
Time of Departure to Work by Sex in Carter County
The most frequent times of departure to work in Carter County are 7:30 AM to 7:59 AM (102, 37.1%) for males and 7:30 AM to 7:59 AM (46, 27.1%) for females.
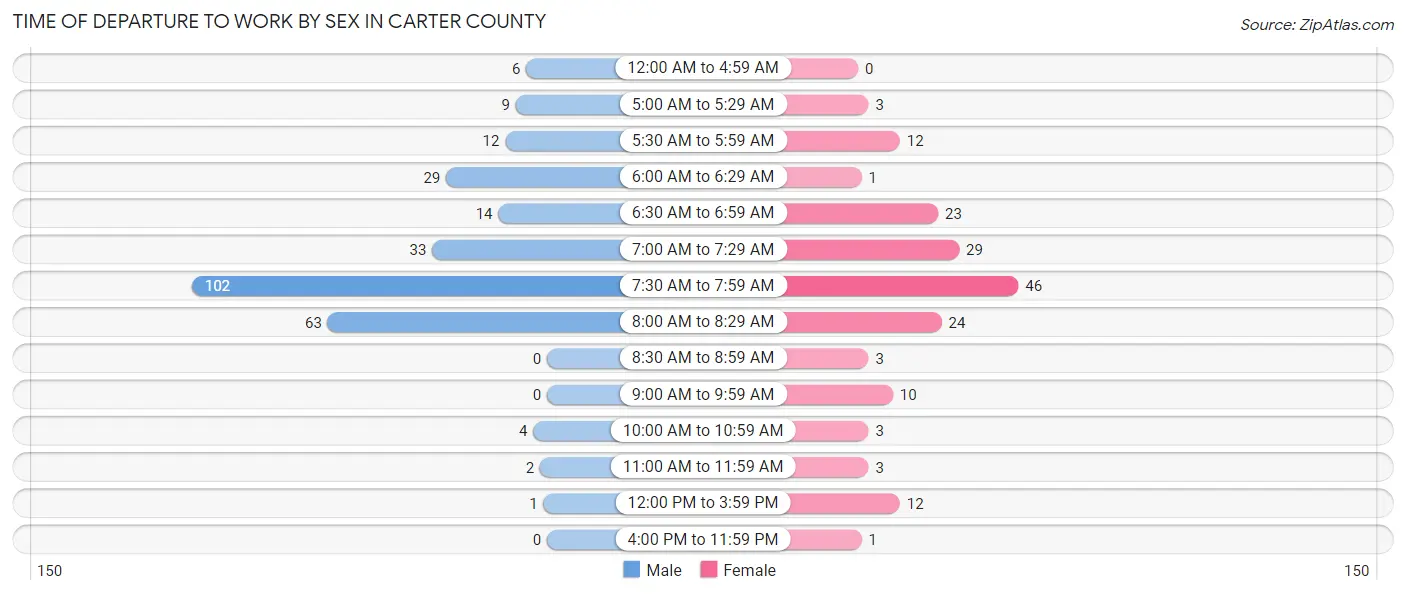
| Time of Departure | Male | Female |
| 12:00 AM to 4:59 AM | 6 (2.2%) | 0 (0.0%) |
| 5:00 AM to 5:29 AM | 9 (3.3%) | 3 (1.8%) |
| 5:30 AM to 5:59 AM | 12 (4.4%) | 12 (7.1%) |
| 6:00 AM to 6:29 AM | 29 (10.5%) | 1 (0.6%) |
| 6:30 AM to 6:59 AM | 14 (5.1%) | 23 (13.5%) |
| 7:00 AM to 7:29 AM | 33 (12.0%) | 29 (17.1%) |
| 7:30 AM to 7:59 AM | 102 (37.1%) | 46 (27.1%) |
| 8:00 AM to 8:29 AM | 63 (22.9%) | 24 (14.1%) |
| 8:30 AM to 8:59 AM | 0 (0.0%) | 3 (1.8%) |
| 9:00 AM to 9:59 AM | 0 (0.0%) | 10 (5.9%) |
| 10:00 AM to 10:59 AM | 4 (1.5%) | 3 (1.8%) |
| 11:00 AM to 11:59 AM | 2 (0.7%) | 3 (1.8%) |
| 12:00 PM to 3:59 PM | 1 (0.4%) | 12 (7.1%) |
| 4:00 PM to 11:59 PM | 0 (0.0%) | 1 (0.6%) |
| Total | 275 (100.0%) | 170 (100.0%) |
Housing Occupancy in Carter County
Occupancy by Ownership in Carter County
Of the total 598 dwellings in Carter County, owner-occupied units account for 380 (63.5%), while renter-occupied units make up 218 (36.4%).
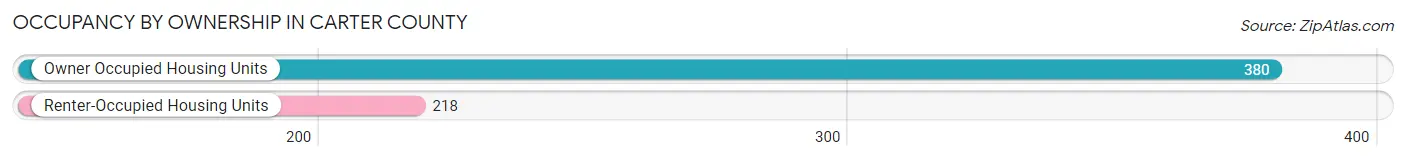
| Occupancy | # Housing Units | % Housing Units |
| Owner Occupied Housing Units | 380 | 63.5% |
| Renter-Occupied Housing Units | 218 | 36.4% |
| Total Occupied Housing Units | 598 | 100.0% |
Occupancy by Household Size in Carter County
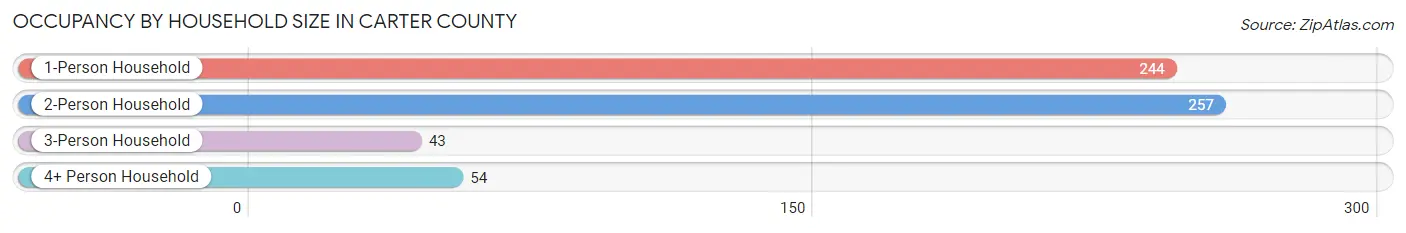
| Household Size | # Housing Units | % Housing Units |
| 1-Person Household | 244 | 40.8% |
| 2-Person Household | 257 | 43.0% |
| 3-Person Household | 43 | 7.2% |
| 4+ Person Household | 54 | 9.0% |
| Total Housing Units | 598 | 100.0% |
Occupancy by Ownership by Household Size in Carter County
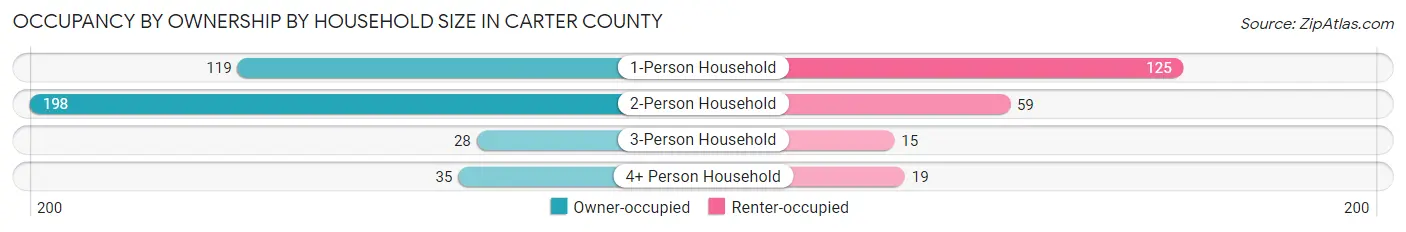
| Household Size | Owner-occupied | Renter-occupied |
| 1-Person Household | 119 (48.8%) | 125 (51.2%) |
| 2-Person Household | 198 (77.0%) | 59 (23.0%) |
| 3-Person Household | 28 (65.1%) | 15 (34.9%) |
| 4+ Person Household | 35 (64.8%) | 19 (35.2%) |
| Total Housing Units | 380 (63.5%) | 218 (36.4%) |
Occupancy by Educational Attainment in Carter County
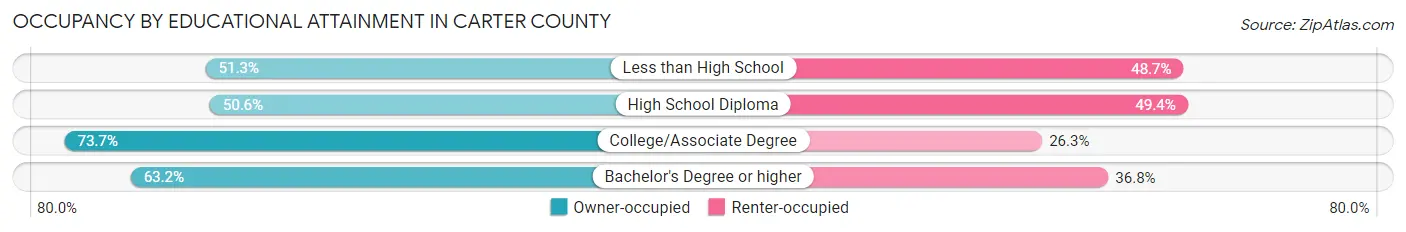
| Household Size | Owner-occupied | Renter-occupied |
| Less than High School | 20 (51.3%) | 19 (48.7%) |
| High School Diploma | 83 (50.6%) | 81 (49.4%) |
| College/Associate Degree | 193 (73.7%) | 69 (26.3%) |
| Bachelor's Degree or higher | 84 (63.2%) | 49 (36.8%) |
Occupancy by Age of Householder in Carter County
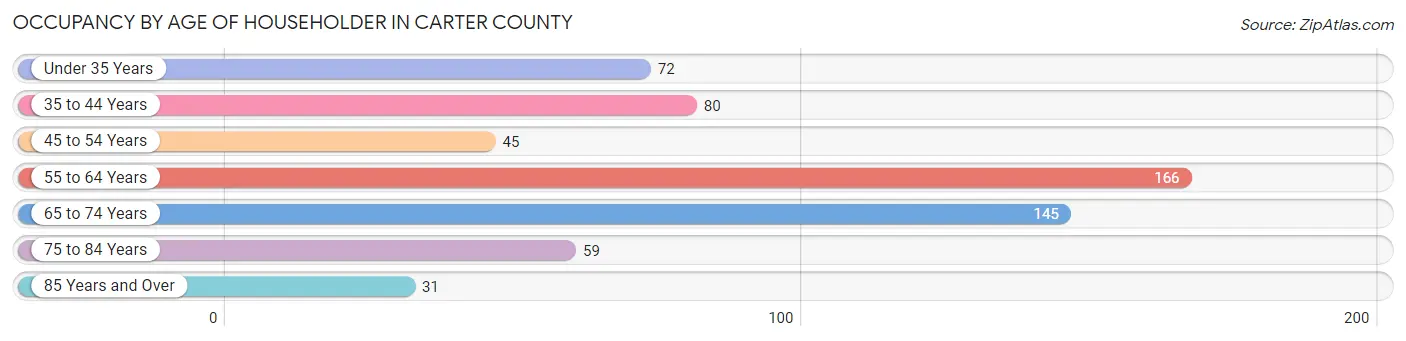
| Age Bracket | # Households | % Households |
| Under 35 Years | 72 | 12.0% |
| 35 to 44 Years | 80 | 13.4% |
| 45 to 54 Years | 45 | 7.5% |
| 55 to 64 Years | 166 | 27.8% |
| 65 to 74 Years | 145 | 24.2% |
| 75 to 84 Years | 59 | 9.9% |
| 85 Years and Over | 31 | 5.2% |
| Total | 598 | 100.0% |
Housing Finances in Carter County
Median Income by Occupancy in Carter County
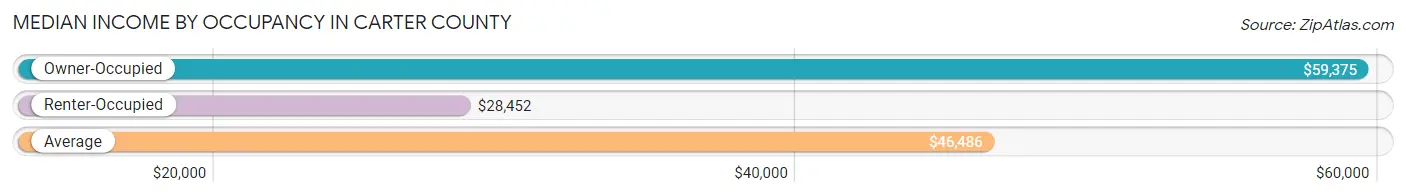
| Occupancy Type | # Households | Median Income |
| Owner-Occupied | 380 (63.5%) | $59,375 |
| Renter-Occupied | 218 (36.4%) | $28,452 |
| Average | 598 (100.0%) | $46,486 |
Occupancy by Householder Income Bracket in Carter County
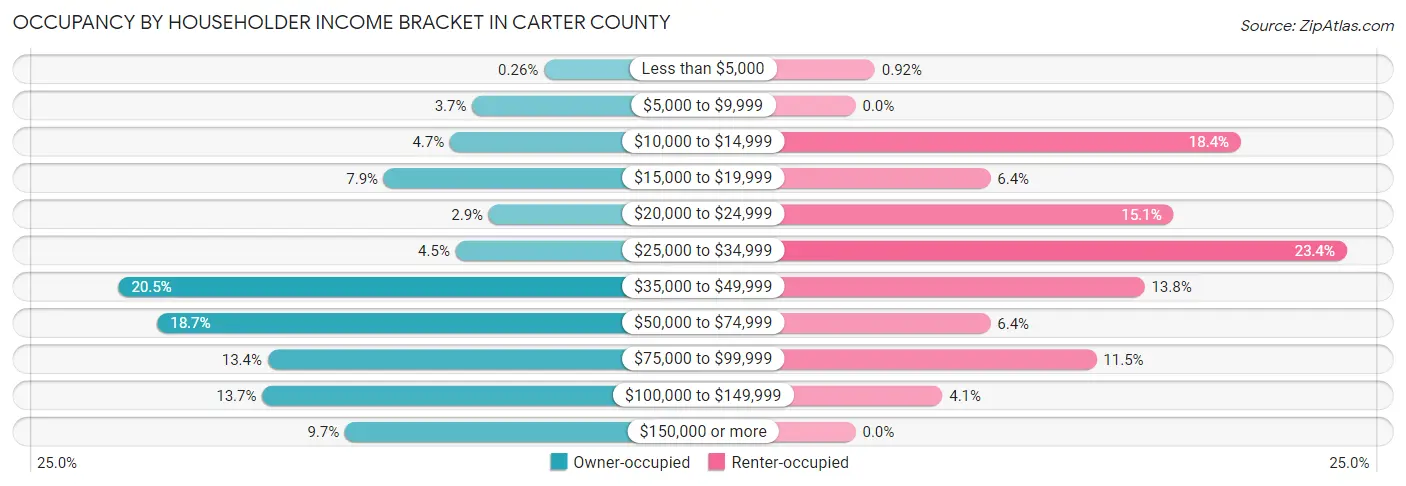
| Income Bracket | Owner-occupied | Renter-occupied |
| Less than $5,000 | 1 (0.3%) | 2 (0.9%) |
| $5,000 to $9,999 | 14 (3.7%) | 0 (0.0%) |
| $10,000 to $14,999 | 18 (4.7%) | 40 (18.3%) |
| $15,000 to $19,999 | 30 (7.9%) | 14 (6.4%) |
| $20,000 to $24,999 | 11 (2.9%) | 33 (15.1%) |
| $25,000 to $34,999 | 17 (4.5%) | 51 (23.4%) |
| $35,000 to $49,999 | 78 (20.5%) | 30 (13.8%) |
| $50,000 to $74,999 | 71 (18.7%) | 14 (6.4%) |
| $75,000 to $99,999 | 51 (13.4%) | 25 (11.5%) |
| $100,000 to $149,999 | 52 (13.7%) | 9 (4.1%) |
| $150,000 or more | 37 (9.7%) | 0 (0.0%) |
| Total | 380 (100.0%) | 218 (100.0%) |
Monthly Housing Cost Tiers in Carter County
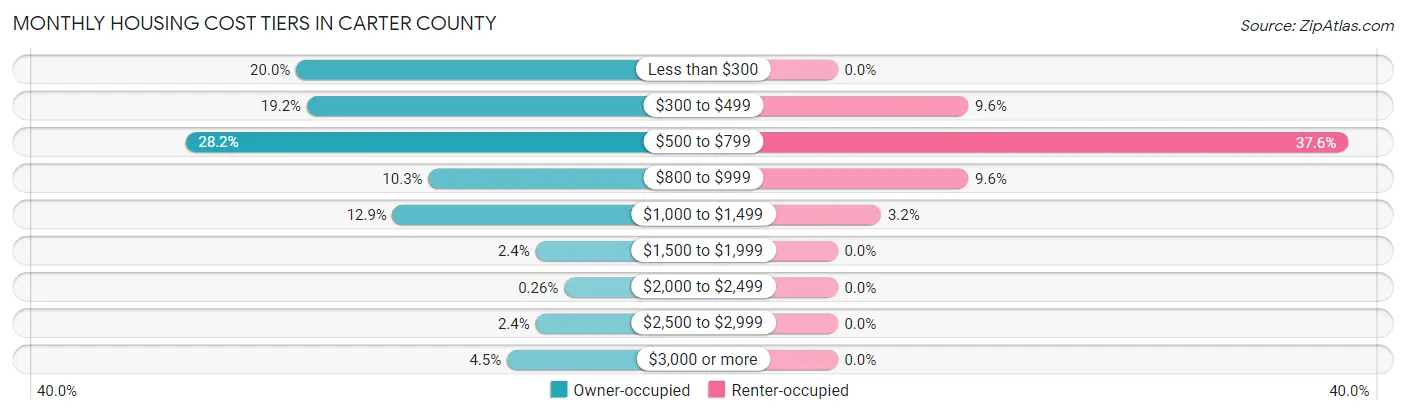
| Monthly Cost | Owner-occupied | Renter-occupied |
| Less than $300 | 76 (20.0%) | 0 (0.0%) |
| $300 to $499 | 73 (19.2%) | 21 (9.6%) |
| $500 to $799 | 107 (28.2%) | 82 (37.6%) |
| $800 to $999 | 39 (10.3%) | 21 (9.6%) |
| $1,000 to $1,499 | 49 (12.9%) | 7 (3.2%) |
| $1,500 to $1,999 | 9 (2.4%) | 0 (0.0%) |
| $2,000 to $2,499 | 1 (0.3%) | 0 (0.0%) |
| $2,500 to $2,999 | 9 (2.4%) | 0 (0.0%) |
| $3,000 or more | 17 (4.5%) | 0 (0.0%) |
| Total | 380 (100.0%) | 218 (100.0%) |
Physical Housing Characteristics in Carter County
Housing Structures in Carter County
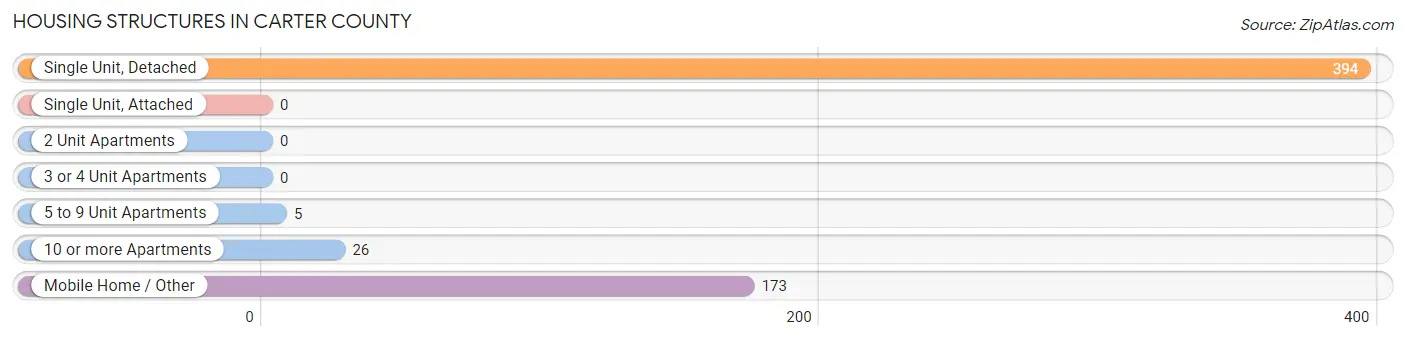
| Structure Type | # Housing Units | % Housing Units |
| Single Unit, Detached | 394 | 65.9% |
| Single Unit, Attached | 0 | 0.0% |
| 2 Unit Apartments | 0 | 0.0% |
| 3 or 4 Unit Apartments | 0 | 0.0% |
| 5 to 9 Unit Apartments | 5 | 0.8% |
| 10 or more Apartments | 26 | 4.3% |
| Mobile Home / Other | 173 | 28.9% |
| Total | 598 | 100.0% |
Housing Structures by Occupancy in Carter County
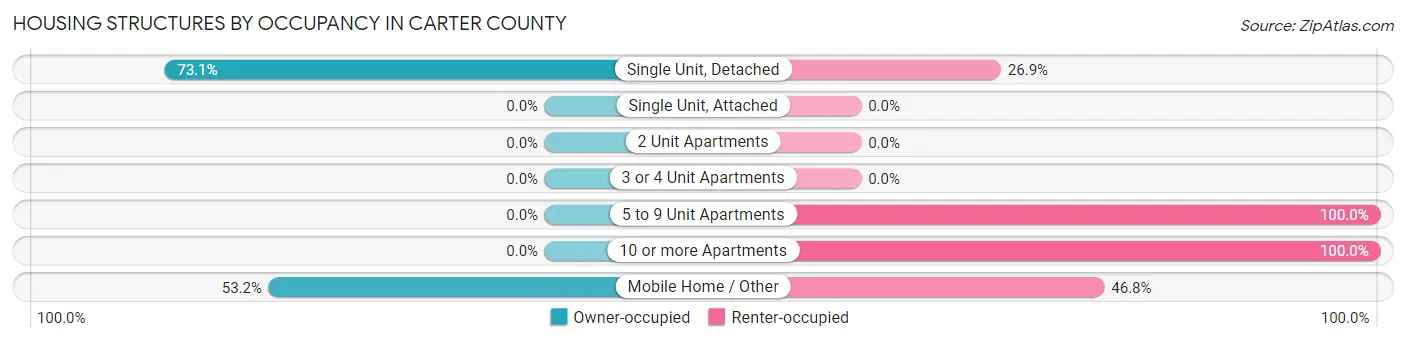
| Structure Type | Owner-occupied | Renter-occupied |
| Single Unit, Detached | 288 (73.1%) | 106 (26.9%) |
| Single Unit, Attached | 0 (0.0%) | 0 (0.0%) |
| 2 Unit Apartments | 0 (0.0%) | 0 (0.0%) |
| 3 or 4 Unit Apartments | 0 (0.0%) | 0 (0.0%) |
| 5 to 9 Unit Apartments | 0 (0.0%) | 5 (100.0%) |
| 10 or more Apartments | 0 (0.0%) | 26 (100.0%) |
| Mobile Home / Other | 92 (53.2%) | 81 (46.8%) |
| Total | 380 (63.5%) | 218 (36.4%) |
Housing Structures by Number of Rooms in Carter County
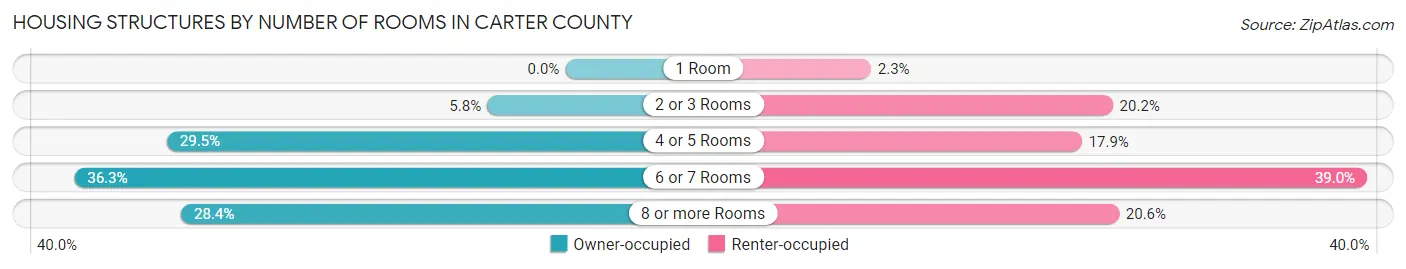
| Number of Rooms | Owner-occupied | Renter-occupied |
| 1 Room | 0 (0.0%) | 5 (2.3%) |
| 2 or 3 Rooms | 22 (5.8%) | 44 (20.2%) |
| 4 or 5 Rooms | 112 (29.5%) | 39 (17.9%) |
| 6 or 7 Rooms | 138 (36.3%) | 85 (39.0%) |
| 8 or more Rooms | 108 (28.4%) | 45 (20.6%) |
| Total | 380 (100.0%) | 218 (100.0%) |
Housing Structure by Heating Type in Carter County
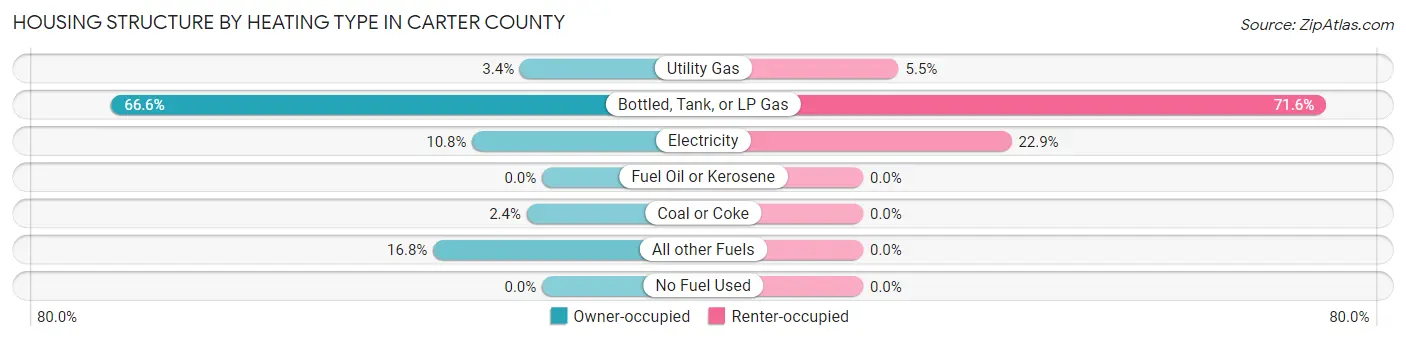
| Heating Type | Owner-occupied | Renter-occupied |
| Utility Gas | 13 (3.4%) | 12 (5.5%) |
| Bottled, Tank, or LP Gas | 253 (66.6%) | 156 (71.6%) |
| Electricity | 41 (10.8%) | 50 (22.9%) |
| Fuel Oil or Kerosene | 0 (0.0%) | 0 (0.0%) |
| Coal or Coke | 9 (2.4%) | 0 (0.0%) |
| All other Fuels | 64 (16.8%) | 0 (0.0%) |
| No Fuel Used | 0 (0.0%) | 0 (0.0%) |
| Total | 380 (100.0%) | 218 (100.0%) |
Household Vehicle Usage in Carter County
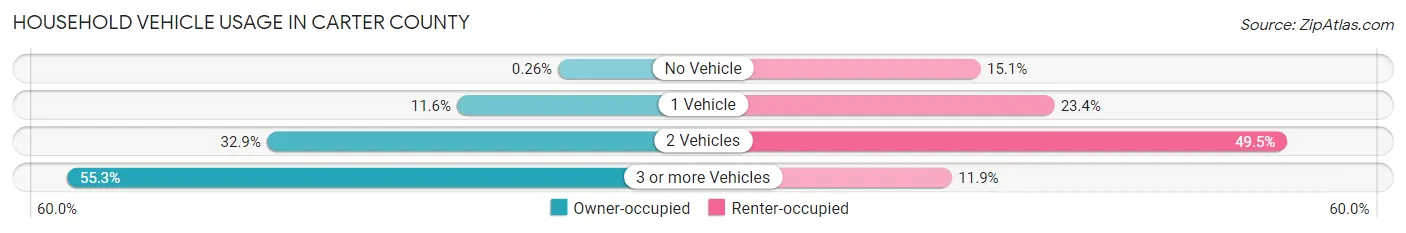
| Vehicles per Household | Owner-occupied | Renter-occupied |
| No Vehicle | 1 (0.3%) | 33 (15.1%) |
| 1 Vehicle | 44 (11.6%) | 51 (23.4%) |
| 2 Vehicles | 125 (32.9%) | 108 (49.5%) |
| 3 or more Vehicles | 210 (55.3%) | 26 (11.9%) |
| Total | 380 (100.0%) | 218 (100.0%) |
Real Estate & Mortgages in Carter County
Real Estate and Mortgage Overview in Carter County
| Characteristic | Without Mortgage | With Mortgage |
| Housing Units | 298 | 82 |
| Median Property Value | $144,300 | $0 |
| Median Household Income | $58,333 | $2 |
| Monthly Housing Costs | $500 | $17 |
| Real Estate Taxes | $744 | $4 |
Property Value by Mortgage Status in Carter County
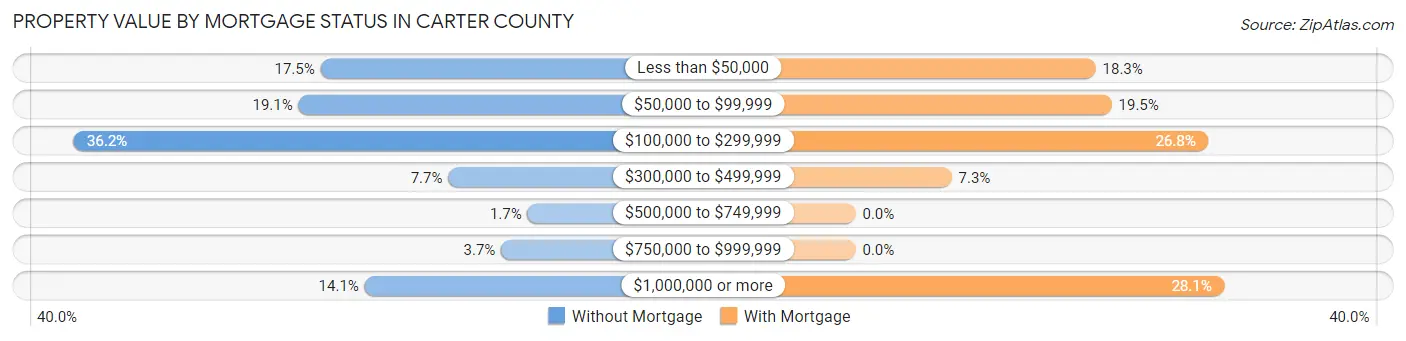
| Property Value | Without Mortgage | With Mortgage |
| Less than $50,000 | 52 (17.4%) | 15 (18.3%) |
| $50,000 to $99,999 | 57 (19.1%) | 16 (19.5%) |
| $100,000 to $299,999 | 108 (36.2%) | 22 (26.8%) |
| $300,000 to $499,999 | 23 (7.7%) | 6 (7.3%) |
| $500,000 to $749,999 | 5 (1.7%) | 0 (0.0%) |
| $750,000 to $999,999 | 11 (3.7%) | 0 (0.0%) |
| $1,000,000 or more | 42 (14.1%) | 23 (28.1%) |
| Total | 298 (100.0%) | 82 (100.0%) |
Household Income by Mortgage Status in Carter County
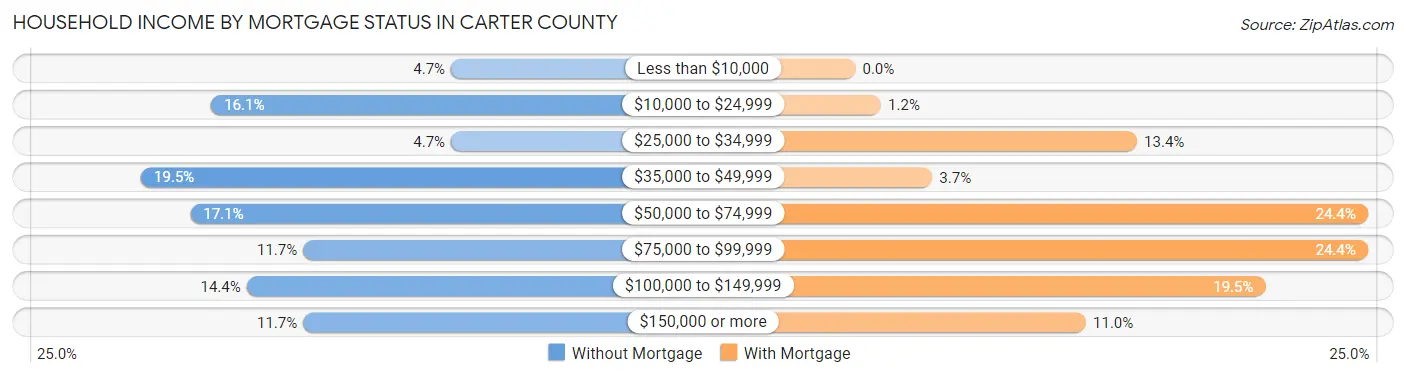
| Household Income | Without Mortgage | With Mortgage |
| Less than $10,000 | 14 (4.7%) | 0 (0.0%) |
| $10,000 to $24,999 | 48 (16.1%) | 1 (1.2%) |
| $25,000 to $34,999 | 14 (4.7%) | 11 (13.4%) |
| $35,000 to $49,999 | 58 (19.5%) | 3 (3.7%) |
| $50,000 to $74,999 | 51 (17.1%) | 20 (24.4%) |
| $75,000 to $99,999 | 35 (11.7%) | 20 (24.4%) |
| $100,000 to $149,999 | 43 (14.4%) | 16 (19.5%) |
| $150,000 or more | 35 (11.7%) | 9 (11.0%) |
| Total | 298 (100.0%) | 82 (100.0%) |
Property Value to Household Income Ratio in Carter County
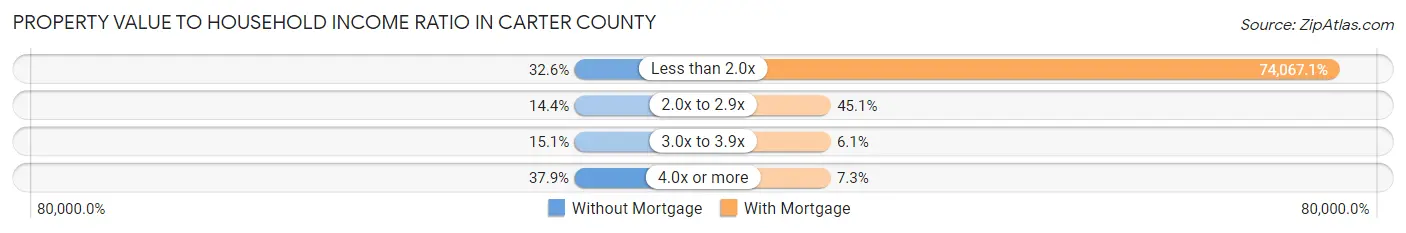
| Value-to-Income Ratio | Without Mortgage | With Mortgage |
| Less than 2.0x | 97 (32.6%) | 60,735 (74,067.1%) |
| 2.0x to 2.9x | 43 (14.4%) | 37 (45.1%) |
| 3.0x to 3.9x | 45 (15.1%) | 5 (6.1%) |
| 4.0x or more | 113 (37.9%) | 6 (7.3%) |
| Total | 298 (100.0%) | 82 (100.0%) |
Real Estate Taxes by Mortgage Status in Carter County
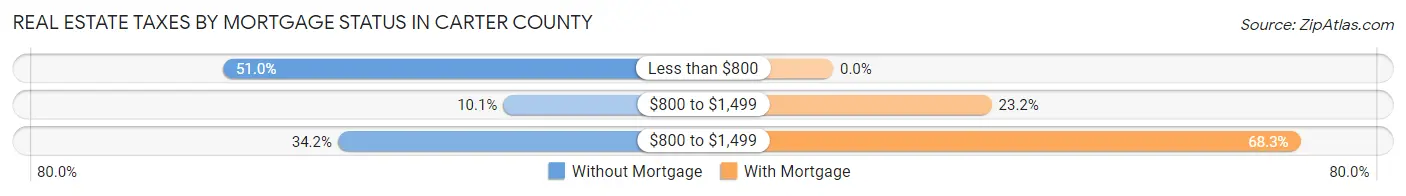
| Property Taxes | Without Mortgage | With Mortgage |
| Less than $800 | 152 (51.0%) | 0 (0.0%) |
| $800 to $1,499 | 30 (10.1%) | 19 (23.2%) |
| $800 to $1,499 | 102 (34.2%) | 56 (68.3%) |
| Total | 298 (100.0%) | 82 (100.0%) |
Health & Disability in Carter County
Health Insurance Coverage by Age in Carter County
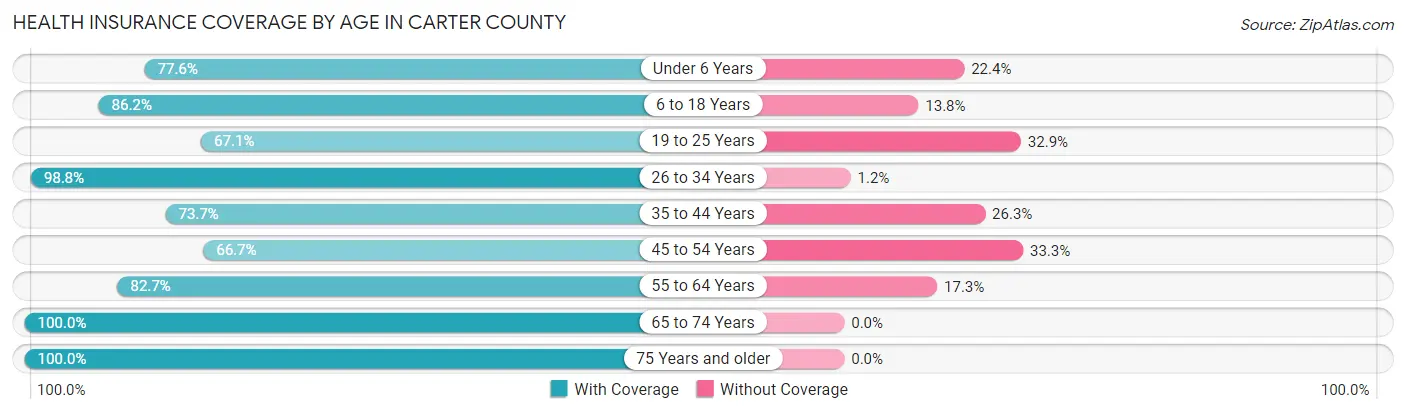
| Age Bracket | With Coverage | Without Coverage |
| Under 6 Years | 59 (77.6%) | 17 (22.4%) |
| 6 to 18 Years | 156 (86.2%) | 25 (13.8%) |
| 19 to 25 Years | 55 (67.1%) | 27 (32.9%) |
| 26 to 34 Years | 84 (98.8%) | 1 (1.2%) |
| 35 to 44 Years | 87 (73.7%) | 31 (26.3%) |
| 45 to 54 Years | 54 (66.7%) | 27 (33.3%) |
| 55 to 64 Years | 234 (82.7%) | 49 (17.3%) |
| 65 to 74 Years | 249 (100.0%) | 0 (0.0%) |
| 75 Years and older | 151 (100.0%) | 0 (0.0%) |
| Total | 1,129 (86.5%) | 177 (13.6%) |
Health Insurance Coverage by Citizenship Status in Carter County
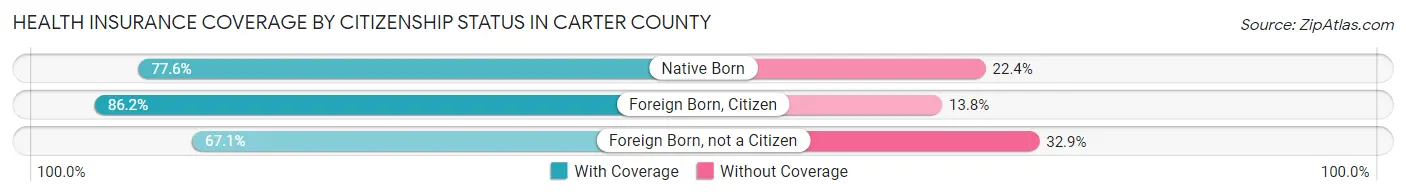
| Citizenship Status | With Coverage | Without Coverage |
| Native Born | 59 (77.6%) | 17 (22.4%) |
| Foreign Born, Citizen | 156 (86.2%) | 25 (13.8%) |
| Foreign Born, not a Citizen | 55 (67.1%) | 27 (32.9%) |
Health Insurance Coverage by Household Income in Carter County
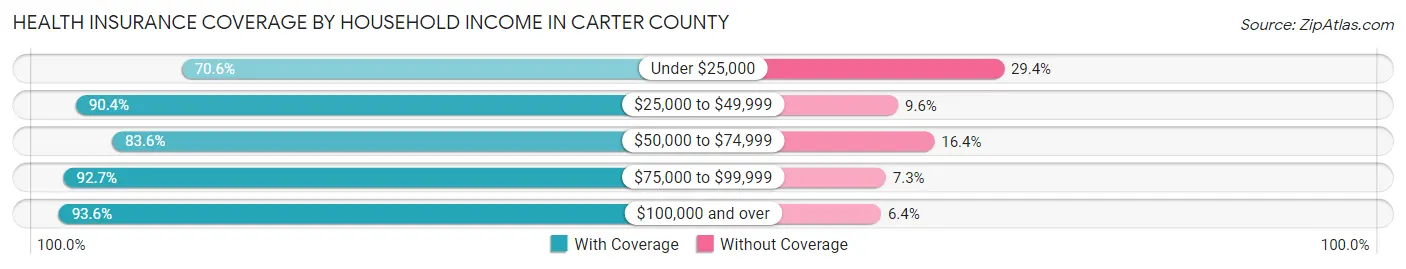
| Household Income | With Coverage | Without Coverage |
| Under $25,000 | 163 (70.6%) | 68 (29.4%) |
| $25,000 to $49,999 | 367 (90.4%) | 39 (9.6%) |
| $50,000 to $74,999 | 209 (83.6%) | 41 (16.4%) |
| $75,000 to $99,999 | 152 (92.7%) | 12 (7.3%) |
| $100,000 and over | 234 (93.6%) | 16 (6.4%) |
Public vs Private Health Insurance Coverage by Age in Carter County
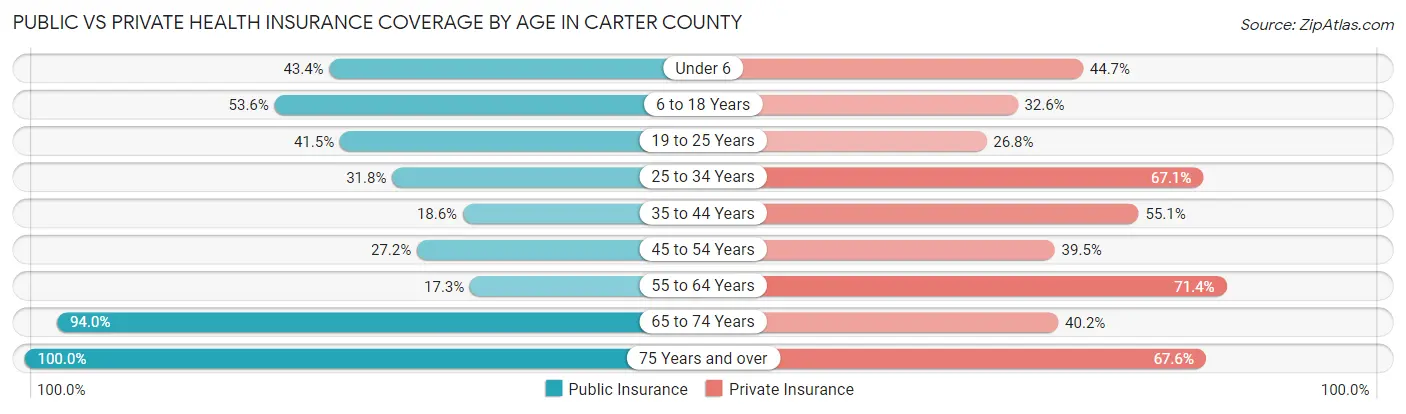
| Age Bracket | Public Insurance | Private Insurance |
| Under 6 | 33 (43.4%) | 34 (44.7%) |
| 6 to 18 Years | 97 (53.6%) | 59 (32.6%) |
| 19 to 25 Years | 34 (41.5%) | 22 (26.8%) |
| 25 to 34 Years | 27 (31.8%) | 57 (67.1%) |
| 35 to 44 Years | 22 (18.6%) | 65 (55.1%) |
| 45 to 54 Years | 22 (27.2%) | 32 (39.5%) |
| 55 to 64 Years | 49 (17.3%) | 202 (71.4%) |
| 65 to 74 Years | 234 (94.0%) | 100 (40.2%) |
| 75 Years and over | 151 (100.0%) | 102 (67.5%) |
| Total | 669 (51.2%) | 673 (51.5%) |
Disability Status by Sex by Age in Carter County
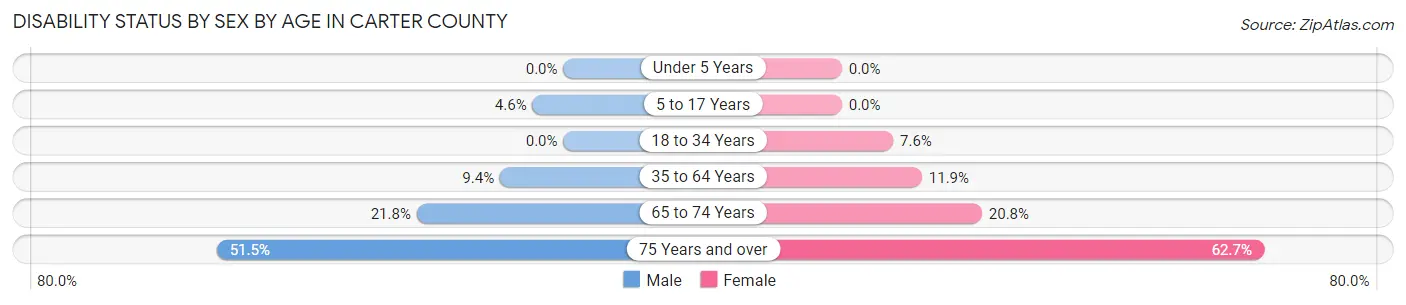
| Age Bracket | Male | Female |
| Under 5 Years | 0 (0.0%) | 0 (0.0%) |
| 5 to 17 Years | 6 (4.6%) | 0 (0.0%) |
| 18 to 34 Years | 0 (0.0%) | 8 (7.6%) |
| 35 to 64 Years | 24 (9.4%) | 27 (11.9%) |
| 65 to 74 Years | 27 (21.8%) | 26 (20.8%) |
| 75 Years and over | 35 (51.5%) | 52 (62.6%) |
Disability Class by Sex by Age in Carter County
Disability Class: Hearing Difficulty
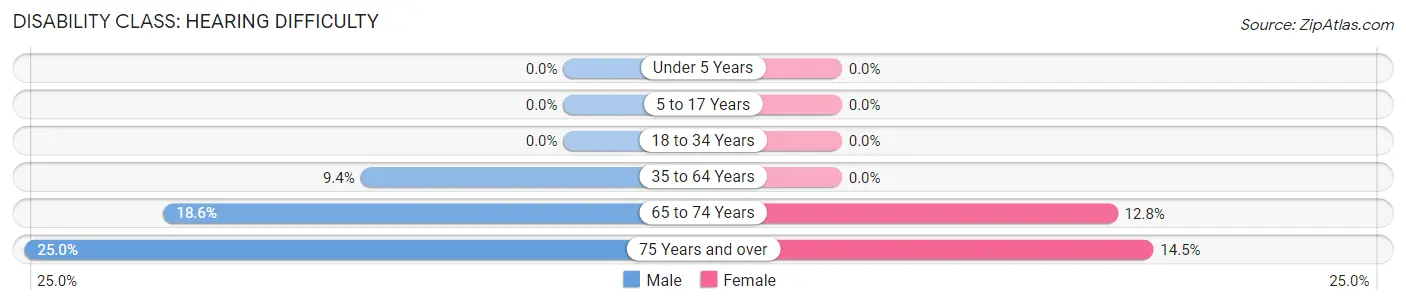
| Age Bracket | Male | Female |
| Under 5 Years | 0 (0.0%) | 0 (0.0%) |
| 5 to 17 Years | 0 (0.0%) | 0 (0.0%) |
| 18 to 34 Years | 0 (0.0%) | 0 (0.0%) |
| 35 to 64 Years | 24 (9.4%) | 0 (0.0%) |
| 65 to 74 Years | 23 (18.5%) | 16 (12.8%) |
| 75 Years and over | 17 (25.0%) | 12 (14.5%) |
Disability Class: Vision Difficulty
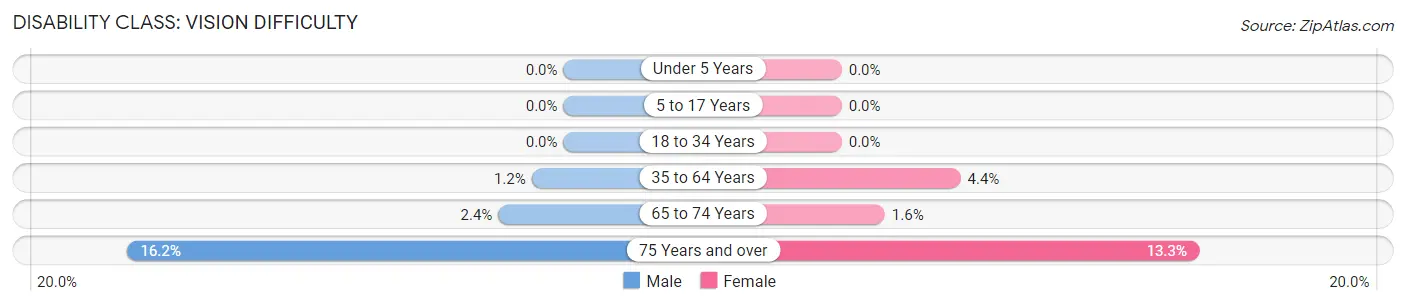
| Age Bracket | Male | Female |
| Under 5 Years | 0 (0.0%) | 0 (0.0%) |
| 5 to 17 Years | 0 (0.0%) | 0 (0.0%) |
| 18 to 34 Years | 0 (0.0%) | 0 (0.0%) |
| 35 to 64 Years | 3 (1.2%) | 10 (4.4%) |
| 65 to 74 Years | 3 (2.4%) | 2 (1.6%) |
| 75 Years and over | 11 (16.2%) | 11 (13.3%) |
Disability Class: Cognitive Difficulty
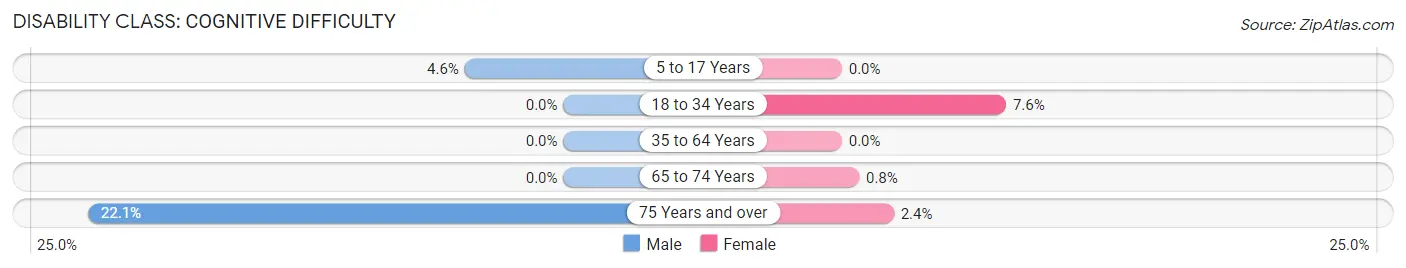
| Age Bracket | Male | Female |
| 5 to 17 Years | 6 (4.6%) | 0 (0.0%) |
| 18 to 34 Years | 0 (0.0%) | 8 (7.6%) |
| 35 to 64 Years | 0 (0.0%) | 0 (0.0%) |
| 65 to 74 Years | 0 (0.0%) | 1 (0.8%) |
| 75 Years and over | 15 (22.1%) | 2 (2.4%) |
Disability Class: Ambulatory Difficulty
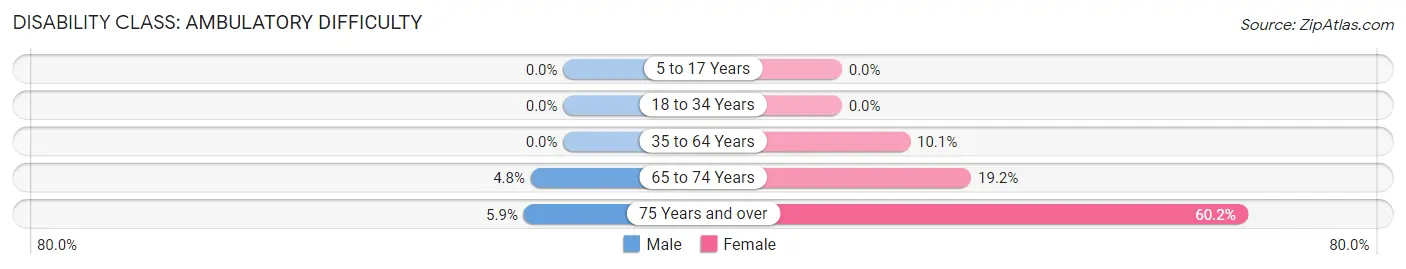
| Age Bracket | Male | Female |
| 5 to 17 Years | 0 (0.0%) | 0 (0.0%) |
| 18 to 34 Years | 0 (0.0%) | 0 (0.0%) |
| 35 to 64 Years | 0 (0.0%) | 23 (10.1%) |
| 65 to 74 Years | 6 (4.8%) | 24 (19.2%) |
| 75 Years and over | 4 (5.9%) | 50 (60.2%) |
Disability Class: Self-Care Difficulty

| Age Bracket | Male | Female |
| 5 to 17 Years | 0 (0.0%) | 0 (0.0%) |
| 18 to 34 Years | 0 (0.0%) | 0 (0.0%) |
| 35 to 64 Years | 0 (0.0%) | 17 (7.5%) |
| 65 to 74 Years | 0 (0.0%) | 10 (8.0%) |
| 75 Years and over | 17 (25.0%) | 0 (0.0%) |
Technology Access in Carter County
Computing Device Access in Carter County
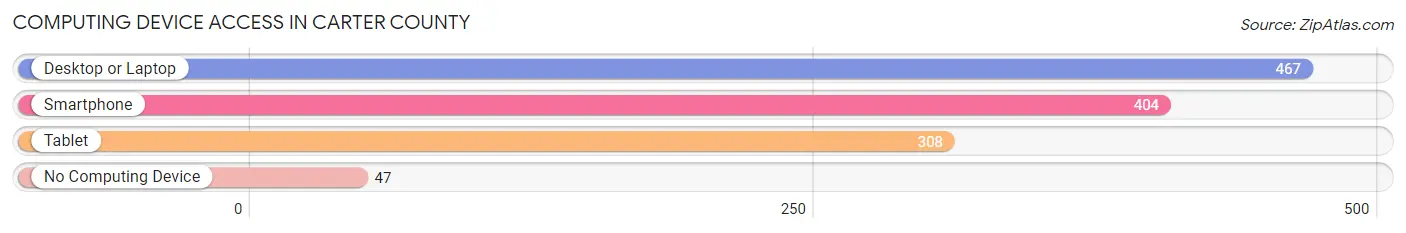
| Device Type | # Households | % Households |
| Desktop or Laptop | 467 | 78.1% |
| Smartphone | 404 | 67.6% |
| Tablet | 308 | 51.5% |
| No Computing Device | 47 | 7.9% |
| Total | 598 | 100.0% |
Internet Access in Carter County
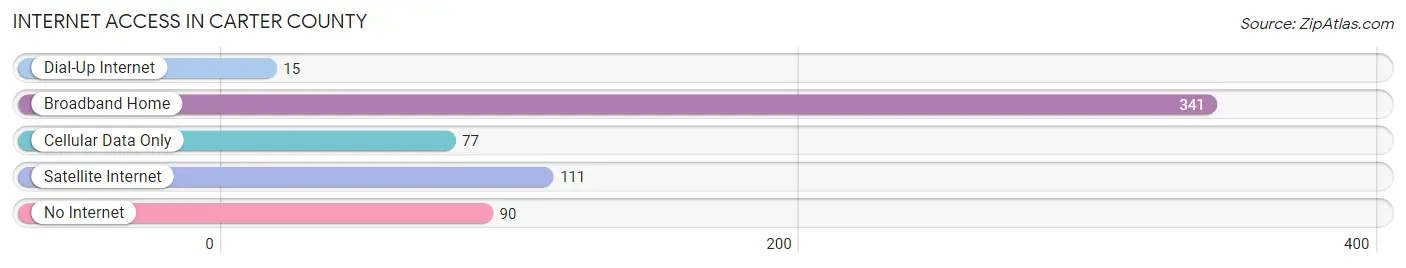
| Internet Type | # Households | % Households |
| Dial-Up Internet | 15 | 2.5% |
| Broadband Home | 341 | 57.0% |
| Cellular Data Only | 77 | 12.9% |
| Satellite Internet | 111 | 18.6% |
| No Internet | 90 | 15.0% |
| Total | 598 | 100.0% |
Carter County Summary
County History
Carter County is located in the southeastern corner of Montana, and is bordered by Fallon County to the north, Powder River County to the east, and Wyoming to the south and west. The county was established in 1919, and was named after Thomas H. Carter, a former U.S. Senator from Montana.
The area that is now Carter County was originally inhabited by the Crow and Northern Cheyenne tribes. The first white settlers arrived in the area in the late 1800s, and the county was officially established in 1919.
The county was primarily an agricultural area, with ranching and farming being the main industries. The county also had a few small towns, such as Ekalaka, which was founded in 1885 and is the county seat.
In the early 1900s, the county experienced a population boom due to the discovery of gold and other minerals in the area. This led to the establishment of several mining towns, such as Alzada and Baker.
The county also experienced a population boom in the 1950s and 1960s due to the construction of the Fort Peck Dam and the Garrison Dam. These dams provided irrigation water for the area, and allowed for the development of large-scale farming operations.
The county has experienced a decline in population since the 1970s, as many of the younger generations have moved away in search of better job opportunities.
Geography
Carter County is located in the southeastern corner of Montana, and is bordered by Fallon County to the north, Powder River County to the east, and Wyoming to the south and west. The county covers an area of 1,845 square miles, and has an average elevation of 3,000 feet.
The county is mostly flat, with rolling hills in the east and south. The terrain is mostly grassland, with some areas of sagebrush and juniper. The county is home to several rivers, including the Yellowstone, Powder, and Tongue Rivers.
The county is also home to several lakes, including the Fort Peck Reservoir, which is the largest lake in the state.
Economy
The economy of Carter County is largely based on agriculture and ranching. The county is home to several large-scale farming operations, which produce wheat, barley, hay, and other crops.
The county also has a thriving cattle industry with several large ranches located in the area
The county also has a few small businesses, such as restaurants, gas stations, and convenience stores.
Demographics
As of the 2010 census, the population of Carter County was 1,945. The population has declined since the 2000 census, when it was 2,072.
The racial makeup of the county is 97.2% White, 0.3% Native American, 0.2% Asian, 0.1% Black or African American, 0.1% Pacific Islander, and 1.9% from other races.
The median household income in the county is $37,917, and the median family income is $45,000. The per capita income is $19,945.
Conclusion
Carter County is a rural county located in the southeastern corner of Montana. The county was established in 1919, and is named after Thomas H. Carter, a former U.S. Senator from Montana. The county is primarily an agricultural area, with ranching and farming being the main industries. The county also has a few small businesses, such as restaurants, gas stations, and convenience stores. The population of the county is 1,945, and the median household income is $37,917.
Common Questions
What is the Total Population of Carter County?
Total Population of Carter County is 1,332.
What is the Total Male Population of Carter County?
Total Male Population of Carter County is 698.
What is the Total Female Population of Carter County?
Total Female Population of Carter County is 634.
What is the Ratio of Males per 100 Females in Carter County?
There are 110.09 Males per 100 Females in Carter County.
What is the Ratio of Females per 100 Males in Carter County?
There are 90.83 Females per 100 Males in Carter County.
What is the Median Population Age in Carter County?
Median Population Age in Carter County is 56.8 Years.
What is the Average Family Size in Carter County
Average Family Size in Carter County is 3.1 People.
What is the Average Household Size in Carter County
Average Household Size in Carter County is 2.2 People.
What is Per Capita Income in Carter County?
Per Capita income in Carter County is $28,824.
What is the Median Family Income in Carter County?
Median Family Income in Carter County is $61,181.
What is the Median Household income in Carter County?
Median Household Income in Carter County is $46,486.
What is Income or Wage Gap in Carter County?
Income or Wage Gap in Carter County is 27.0%.
Women in Carter County earn 73.0 cents for every dollar earned by a man.
What is Inequality or Gini Index in Carter County?
Inequality or Gini Index in Carter County is 0.44.
How Large is the Labor Force in Carter County?
There are 678 People in the Labor Forcein in Carter County.
What is the Percentage of People in the Labor Force in Carter County?
60.2% of People are in the Labor Force in Carter County.
What is the Unemployment Rate in Carter County?
Unemployment Rate in Carter County is 2.4%.