Broadwater County, MT
Broadwater County Map
Broadwater County Overview
6,977
TOTAL POPULATION
3,607
MALE POPULATION
3,370
FEMALE POPULATION
107.03
MALES / 100 FEMALES
93.43
FEMALES / 100 MALES
47.4
MEDIAN AGE
2.9
AVG FAMILY SIZE
2.4
AVG HOUSEHOLD SIZE
$34,956
PER CAPITA INCOME
$77,206
AVG FAMILY INCOME
$61,679
AVG HOUSEHOLD INCOME
29.5%
WAGE / INCOME GAP [ % ]
70.5¢/ $1
WAGE / INCOME GAP [ $ ]
$9,114
FAMILY INCOME DEFICIT
0.41
INEQUALITY / GINI INDEX
3,467
LABOR FORCE [ PEOPLE ]
58.8%
PERCENT IN LABOR FORCE
8.2%
UNEMPLOYMENT RATE
Broadwater County Area Codes
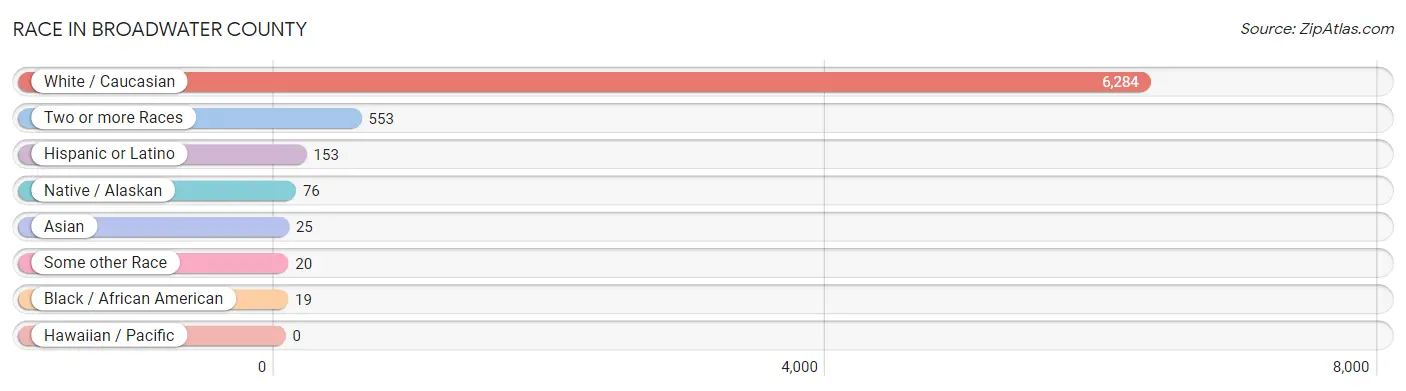
Race in Broadwater County
The most populous races in Broadwater County are White / Caucasian (6,284 | 90.1%), Two or more Races (553 | 7.9%), and Hispanic or Latino (153 | 2.2%).
| Race | # Population | % Population |
| Asian | 25 | 0.4% |
| Black / African American | 19 | 0.3% |
| Hawaiian / Pacific | 0 | 0.0% |
| Hispanic or Latino | 153 | 2.2% |
| Native / Alaskan | 76 | 1.1% |
| White / Caucasian | 6,284 | 90.1% |
| Two or more Races | 553 | 7.9% |
| Some other Race | 20 | 0.3% |
| Total | 6,977 | 100.0% |
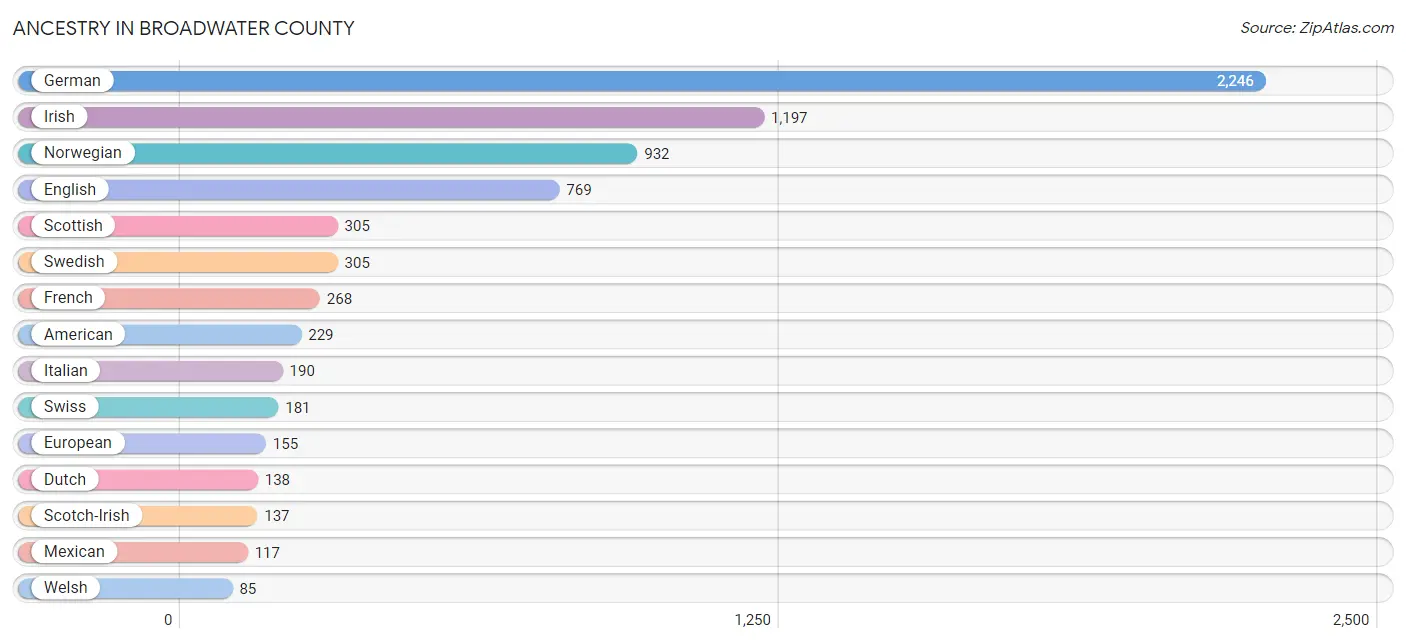
Ancestry in Broadwater County
The most populous ancestries reported in Broadwater County are German (2,246 | 32.2%), Irish (1,197 | 17.2%), Norwegian (932 | 13.4%), English (769 | 11.0%), and Scottish (305 | 4.4%), together accounting for 78.1% of all Broadwater County residents.
| Ancestry | # Population | % Population |
| American | 229 | 3.3% |
| Austrian | 26 | 0.4% |
| Belgian | 7 | 0.1% |
| Blackfeet | 28 | 0.4% |
| British | 41 | 0.6% |
| Central American | 11 | 0.2% |
| Chippewa | 9 | 0.1% |
| Choctaw | 21 | 0.3% |
| Crow | 22 | 0.3% |
| Czech | 11 | 0.2% |
| Czechoslovakian | 3 | 0.0% |
| Danish | 30 | 0.4% |
| Dutch | 138 | 2.0% |
| English | 769 | 11.0% |
| European | 155 | 2.2% |
| Finnish | 26 | 0.4% |
| French | 268 | 3.8% |
| French Canadian | 8 | 0.1% |
| German | 2,246 | 32.2% |
| Greek | 20 | 0.3% |
| Guatemalan | 11 | 0.2% |
| Hungarian | 43 | 0.6% |
| Indian (Asian) | 25 | 0.4% |
| Irish | 1,197 | 17.2% |
| Italian | 190 | 2.7% |
| Korean | 40 | 0.6% |
| Mexican | 117 | 1.7% |
| Norwegian | 932 | 13.4% |
| Pennsylvania German | 25 | 0.4% |
| Polish | 71 | 1.0% |
| Russian | 33 | 0.5% |
| Scandinavian | 31 | 0.4% |
| Scotch-Irish | 137 | 2.0% |
| Scottish | 305 | 4.4% |
| Sioux | 36 | 0.5% |
| Slavic | 4 | 0.1% |
| Slovak | 6 | 0.1% |
| Slovene | 15 | 0.2% |
| Swedish | 305 | 4.4% |
| Swiss | 181 | 2.6% |
| Welsh | 85 | 1.2% |
| Yugoslavian | 14 | 0.2% | View All 42 Rows |
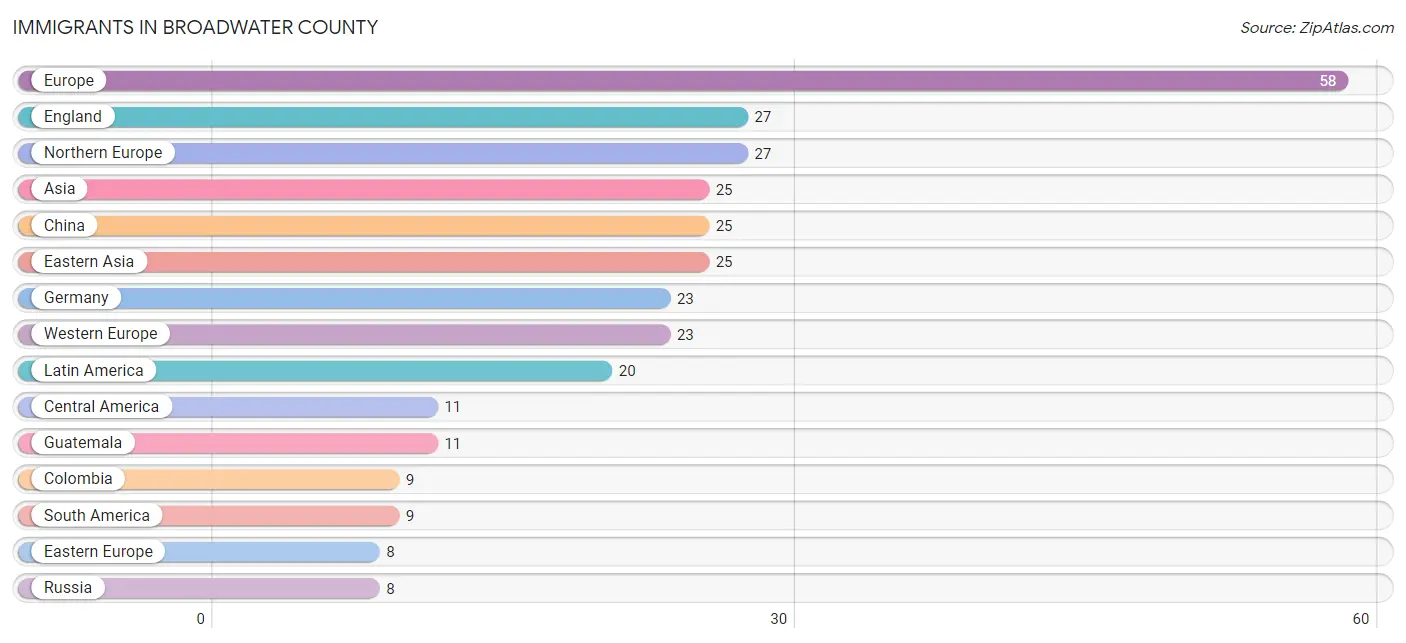
Immigrants in Broadwater County
The most numerous immigrant groups reported in Broadwater County came from Europe (58 | 0.8%), England (27 | 0.4%), Northern Europe (27 | 0.4%), Asia (25 | 0.4%), and China (25 | 0.4%), together accounting for 2.3% of all Broadwater County residents.
| Immigration Origin | # Population | % Population |
| Asia | 25 | 0.4% |
| Central America | 11 | 0.2% |
| China | 25 | 0.4% |
| Colombia | 9 | 0.1% |
| Eastern Asia | 25 | 0.4% |
| Eastern Europe | 8 | 0.1% |
| England | 27 | 0.4% |
| Europe | 58 | 0.8% |
| Germany | 23 | 0.3% |
| Guatemala | 11 | 0.2% |
| Latin America | 20 | 0.3% |
| Northern Europe | 27 | 0.4% |
| Russia | 8 | 0.1% |
| South America | 9 | 0.1% |
| Western Europe | 23 | 0.3% | View All 15 Rows |
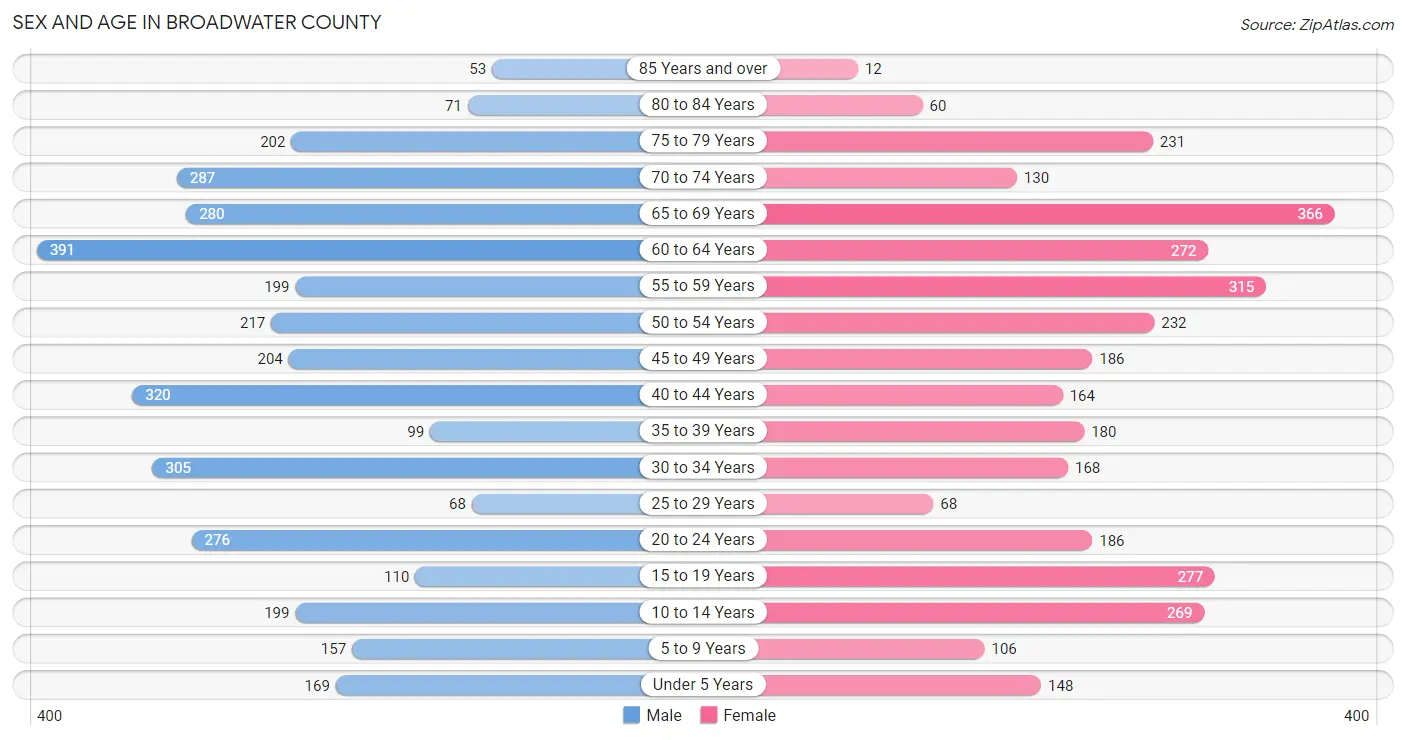
Sex and Age in Broadwater County
Sex and Age in Broadwater County
The most populous age groups in Broadwater County are 60 to 64 Years (391 | 10.8%) for men and 65 to 69 Years (366 | 10.9%) for women.
| Age Bracket | Male | Female |
| Under 5 Years | 169 (4.7%) | 148 (4.4%) |
| 5 to 9 Years | 157 (4.3%) | 106 (3.2%) |
| 10 to 14 Years | 199 (5.5%) | 269 (8.0%) |
| 15 to 19 Years | 110 (3.0%) | 277 (8.2%) |
| 20 to 24 Years | 276 (7.6%) | 186 (5.5%) |
| 25 to 29 Years | 68 (1.9%) | 68 (2.0%) |
| 30 to 34 Years | 305 (8.5%) | 168 (5.0%) |
| 35 to 39 Years | 99 (2.7%) | 180 (5.3%) |
| 40 to 44 Years | 320 (8.9%) | 164 (4.9%) |
| 45 to 49 Years | 204 (5.7%) | 186 (5.5%) |
| 50 to 54 Years | 217 (6.0%) | 232 (6.9%) |
| 55 to 59 Years | 199 (5.5%) | 315 (9.3%) |
| 60 to 64 Years | 391 (10.8%) | 272 (8.1%) |
| 65 to 69 Years | 280 (7.8%) | 366 (10.9%) |
| 70 to 74 Years | 287 (8.0%) | 130 (3.9%) |
| 75 to 79 Years | 202 (5.6%) | 231 (6.9%) |
| 80 to 84 Years | 71 (2.0%) | 60 (1.8%) |
| 85 Years and over | 53 (1.5%) | 12 (0.4%) |
| Total | 3,607 (100.0%) | 3,370 (100.0%) |
Families and Households in Broadwater County
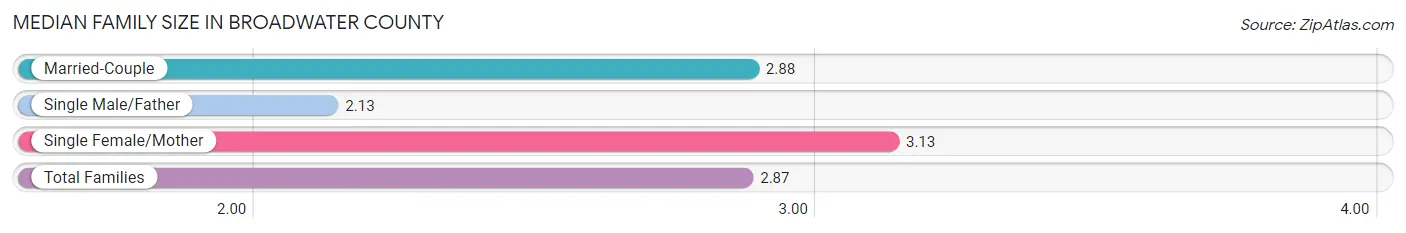
Median Family Size in Broadwater County
The median family size in Broadwater County is 2.87 persons per family, with single female/mother families (195 | 10.0%) accounting for the largest median family size of 3.13 persons per family. On the other hand, single male/father families (101 | 5.2%) represent the smallest median family size with 2.13 persons per family.
| Family Type | # Families | Family Size |
| Married-Couple | 1,654 (84.8%) | 2.88 |
| Single Male/Father | 101 (5.2%) | 2.13 |
| Single Female/Mother | 195 (10.0%) | 3.13 |
| Total Families | 1,950 (100.0%) | 2.87 |
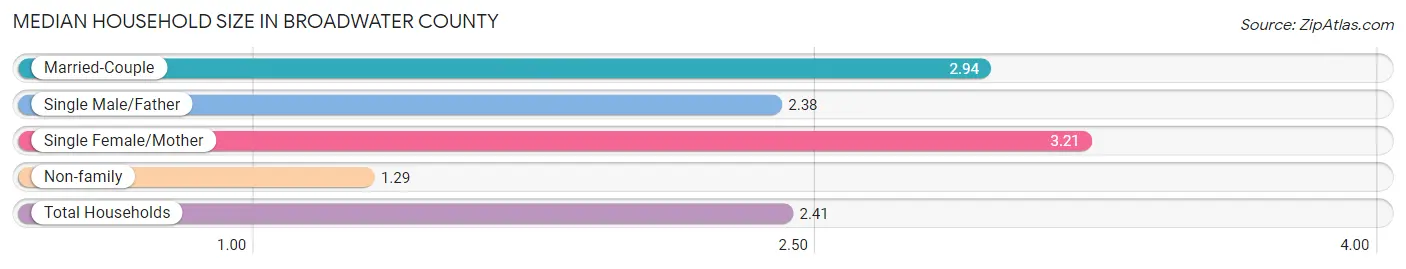
Median Household Size in Broadwater County
The median household size in Broadwater County is 2.41 persons per household, with single female/mother households (195 | 6.8%) accounting for the largest median household size of 3.21 persons per household. non-family households (922 | 32.1%) represent the smallest median household size with 1.29 persons per household.
| Household Type | # Households | Household Size |
| Married-Couple | 1,654 (57.6%) | 2.94 |
| Single Male/Father | 101 (3.5%) | 2.38 |
| Single Female/Mother | 195 (6.8%) | 3.21 |
| Non-family | 922 (32.1%) | 1.29 |
| Total Households | 2,872 (100.0%) | 2.41 |
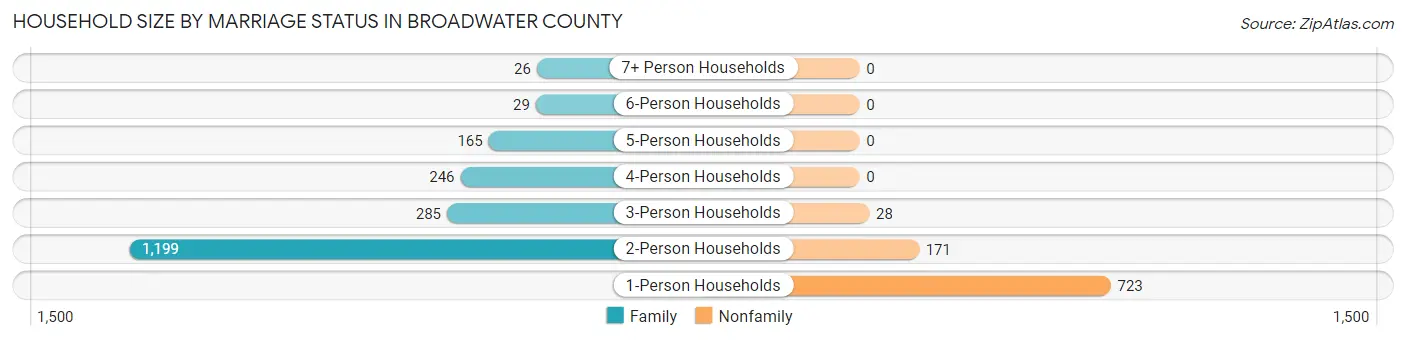
Household Size by Marriage Status in Broadwater County
Out of a total of 2,872 households in Broadwater County, 1,950 (67.9%) are family households, while 922 (32.1%) are nonfamily households. The most numerous type of family households are 2-person households, comprising 1,199, and the most common type of nonfamily households are 1-person households, comprising 723.
| Household Size | Family Households | Nonfamily Households |
| 1-Person Households | - | 723 (25.2%) |
| 2-Person Households | 1,199 (41.7%) | 171 (5.9%) |
| 3-Person Households | 285 (9.9%) | 28 (1.0%) |
| 4-Person Households | 246 (8.6%) | 0 (0.0%) |
| 5-Person Households | 165 (5.8%) | 0 (0.0%) |
| 6-Person Households | 29 (1.0%) | 0 (0.0%) |
| 7+ Person Households | 26 (0.9%) | 0 (0.0%) |
| Total | 1,950 (67.9%) | 922 (32.1%) |
Female Fertility in Broadwater County
Fertility by Age in Broadwater County
Average fertility rate in Broadwater County is 104.0 births per 1,000 women. Women in the age bracket of 20 to 34 years have the highest fertility rate with 218.0 births per 1,000 women. Women in the age bracket of 20 to 34 years acount for 69.7% of all women with births.

| Age Bracket | Women with Births | Births / 1,000 Women |
| 15 to 19 years | 20 (15.1%) | 72.0 |
| 20 to 34 years | 92 (69.7%) | 218.0 |
| 35 to 50 years | 20 (15.1%) | 35.0 |
| Total | 132 (100.0%) | 104.0 |
Fertility by Age by Marriage Status in Broadwater County
76.5% of women with births (132) in Broadwater County are married. The highest percentage of unmarried women with births falls into 15 to 19 years age bracket with 100.0% of them unmarried at the time of birth, while the lowest percentage of unmarried women with births belong to 20 to 34 years age bracket with 2.2% of them unmarried.
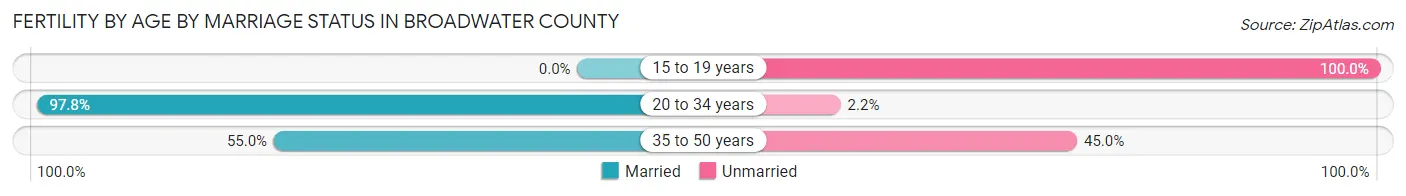
| Age Bracket | Married | Unmarried |
| 15 to 19 years | 0 (0.0%) | 20 (100.0%) |
| 20 to 34 years | 90 (97.8%) | 2 (2.2%) |
| 35 to 50 years | 11 (55.0%) | 9 (45.0%) |
| Total | 101 (76.5%) | 31 (23.5%) |
Fertility by Education in Broadwater County
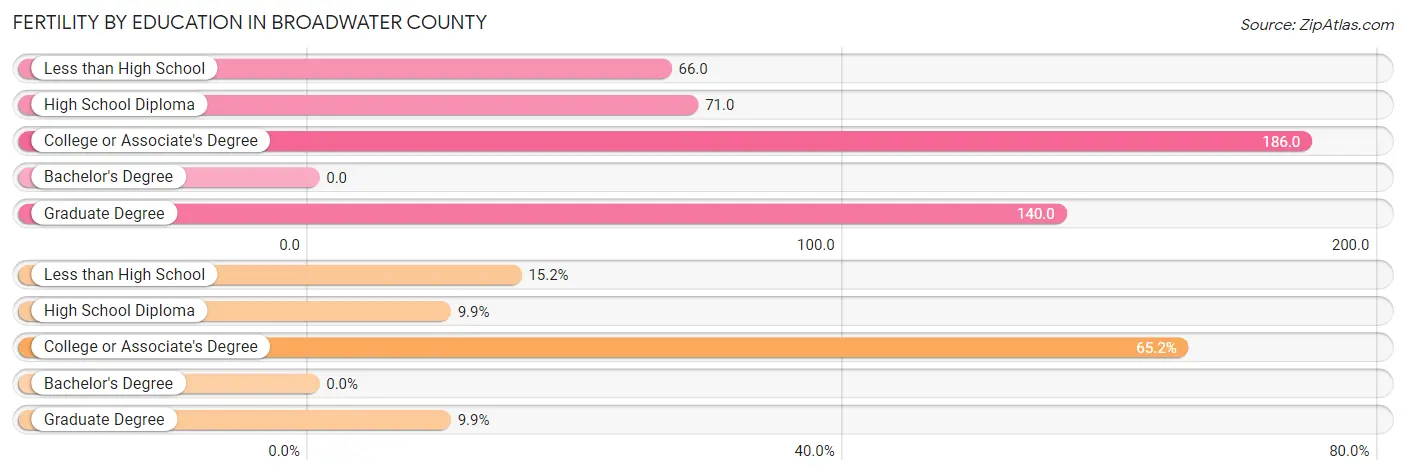
| Educational Attainment | Women with Births | Births / 1,000 Women |
| Less than High School | 20 (15.1%) | 66.0 |
| High School Diploma | 13 (9.9%) | 71.0 |
| College or Associate's Degree | 86 (65.1%) | 186.0 |
| Bachelor's Degree | 0 (0.0%) | 0.0 |
| Graduate Degree | 13 (9.9%) | 140.0 |
| Total | 132 (100.0%) | 104.0 |
Fertility by Education by Marriage Status in Broadwater County
23.5% of women with births in Broadwater County are unmarried. Women with the educational attainment of graduate degree are most likely to be married with 100.0% of them married at childbirth, while women with the educational attainment of less than high school are least likely to be married with 100.0% of them unmarried at childbirth.
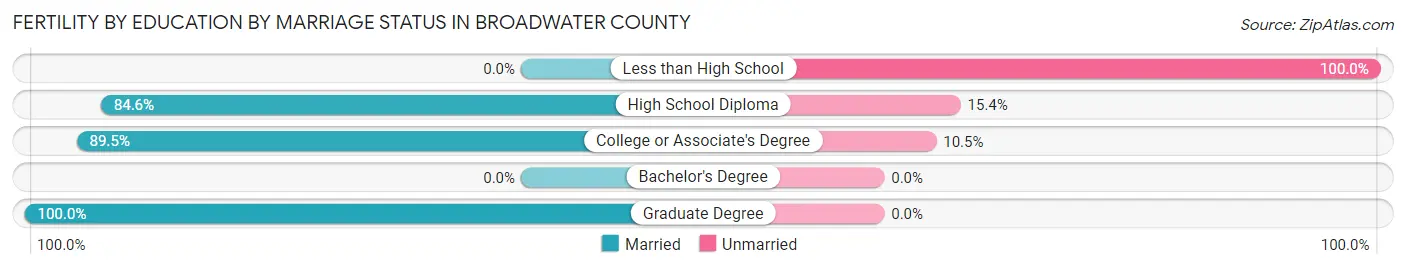
| Educational Attainment | Married | Unmarried |
| Less than High School | 0 (0.0%) | 20 (100.0%) |
| High School Diploma | 11 (84.6%) | 2 (15.4%) |
| College or Associate's Degree | 77 (89.5%) | 9 (10.5%) |
| Bachelor's Degree | 0 (0.0%) | 0 (0.0%) |
| Graduate Degree | 13 (100.0%) | 0 (0.0%) |
| Total | 101 (76.5%) | 31 (23.5%) |
Income in Broadwater County
Income Overview in Broadwater County
Per Capita Income in Broadwater County is $34,956, while median incomes of families and households are $77,206 and $61,679 respectively.
| Characteristic | Number | Measure |
| Per Capita Income | 6,977 | $34,956 |
| Median Family Income | 1,950 | $77,206 |
| Mean Family Income | 1,950 | $92,221 |
| Median Household Income | 2,872 | $61,679 |
| Mean Household Income | 2,872 | $78,352 |
| Income Deficit | 1,950 | $9,114 |
| Wage / Income Gap (%) | 6,977 | 29.46% |
| Wage / Income Gap ($) | 6,977 | 70.54¢ per $1 |
| Gini / Inequality Index | 6,977 | 0.41 |
Earnings by Sex in Broadwater County
Average Earnings in Broadwater County are $37,100, $43,576 for men and $30,737 for women, a difference of 29.5%.
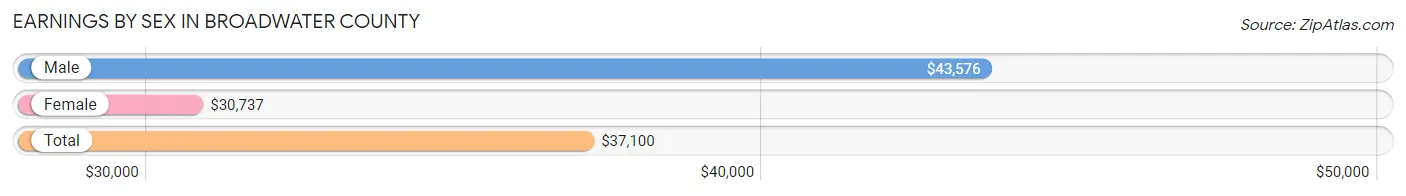
| Sex | Number | Average Earnings |
| Male | 2,234 (59.8%) | $43,576 |
| Female | 1,499 (40.2%) | $30,737 |
| Total | 3,733 (100.0%) | $37,100 |
Earnings by Sex by Income Bracket in Broadwater County
The most common earnings brackets in Broadwater County are $100,000+ for men (379 | 17.0%) and $30,000 to $34,999 for women (174 | 11.6%).
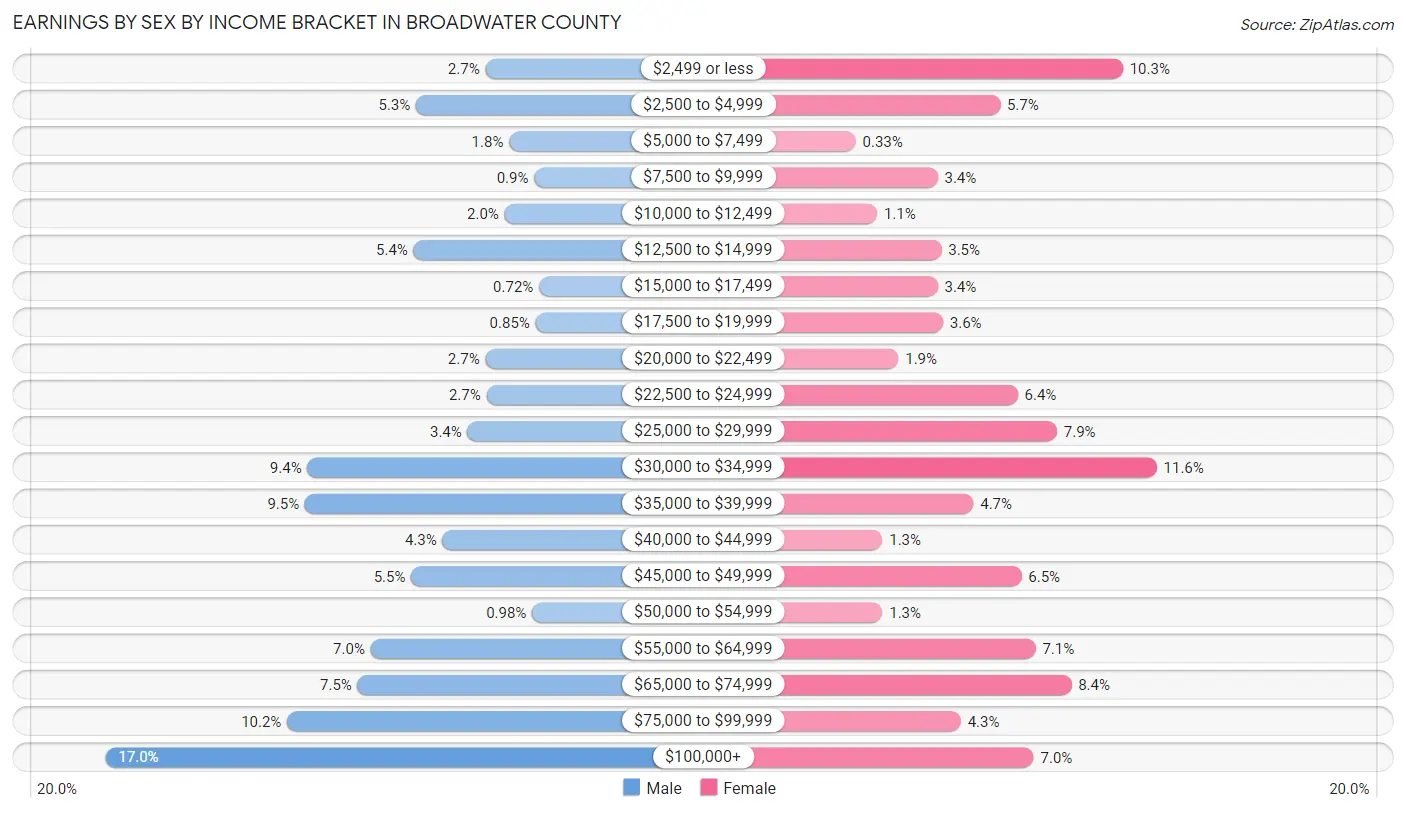
| Income | Male | Female |
| $2,499 or less | 61 (2.7%) | 155 (10.3%) |
| $2,500 to $4,999 | 119 (5.3%) | 86 (5.7%) |
| $5,000 to $7,499 | 41 (1.8%) | 5 (0.3%) |
| $7,500 to $9,999 | 20 (0.9%) | 51 (3.4%) |
| $10,000 to $12,499 | 45 (2.0%) | 17 (1.1%) |
| $12,500 to $14,999 | 121 (5.4%) | 53 (3.5%) |
| $15,000 to $17,499 | 16 (0.7%) | 51 (3.4%) |
| $17,500 to $19,999 | 19 (0.9%) | 54 (3.6%) |
| $20,000 to $22,499 | 61 (2.7%) | 29 (1.9%) |
| $22,500 to $24,999 | 60 (2.7%) | 96 (6.4%) |
| $25,000 to $29,999 | 76 (3.4%) | 118 (7.9%) |
| $30,000 to $34,999 | 210 (9.4%) | 174 (11.6%) |
| $35,000 to $39,999 | 212 (9.5%) | 71 (4.7%) |
| $40,000 to $44,999 | 97 (4.3%) | 20 (1.3%) |
| $45,000 to $49,999 | 123 (5.5%) | 98 (6.5%) |
| $50,000 to $54,999 | 22 (1.0%) | 20 (1.3%) |
| $55,000 to $64,999 | 157 (7.0%) | 106 (7.1%) |
| $65,000 to $74,999 | 168 (7.5%) | 126 (8.4%) |
| $75,000 to $99,999 | 227 (10.2%) | 64 (4.3%) |
| $100,000+ | 379 (17.0%) | 105 (7.0%) |
| Total | 2,234 (100.0%) | 1,499 (100.0%) |
Earnings by Sex by Educational Attainment in Broadwater County
Average earnings in Broadwater County are $48,125 for men and $34,364 for women, a difference of 28.6%. Men with an educational attainment of graduate degree enjoy the highest average annual earnings of $79,191, while those with college or associate's degree education earn the least with $43,920. Women with an educational attainment of graduate degree earn the most with the average annual earnings of $72,000, while those with high school diploma education have the smallest earnings of $30,952.
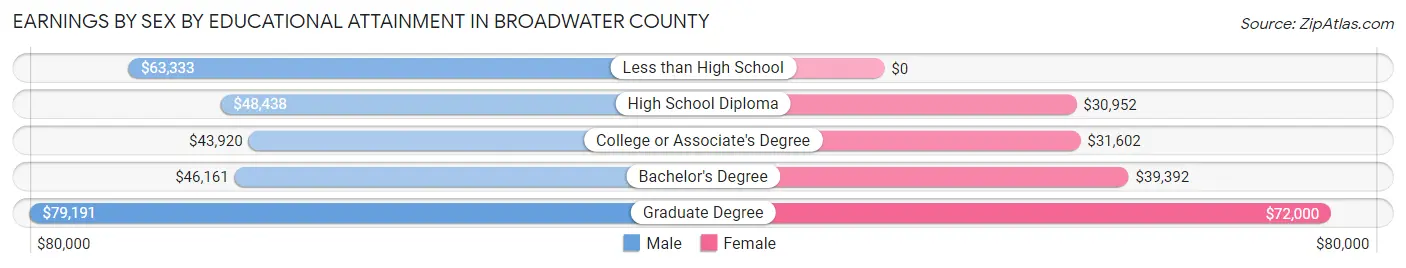
| Educational Attainment | Male Income | Female Income |
| Less than High School | $63,333 | $0 |
| High School Diploma | $48,438 | $30,952 |
| College or Associate's Degree | $43,920 | $31,602 |
| Bachelor's Degree | $46,161 | $39,392 |
| Graduate Degree | $79,191 | $72,000 |
| Total | $48,125 | $34,364 |
Family Income in Broadwater County
Family Income Brackets in Broadwater County
According to the Broadwater County family income data, there are 396 families falling into the $100,000 to $149,999 income range, which is the most common income bracket and makes up 20.3% of all families. Conversely, the less than $10,000 income bracket is the least frequent group with only 16 families (0.8%) belonging to this category.
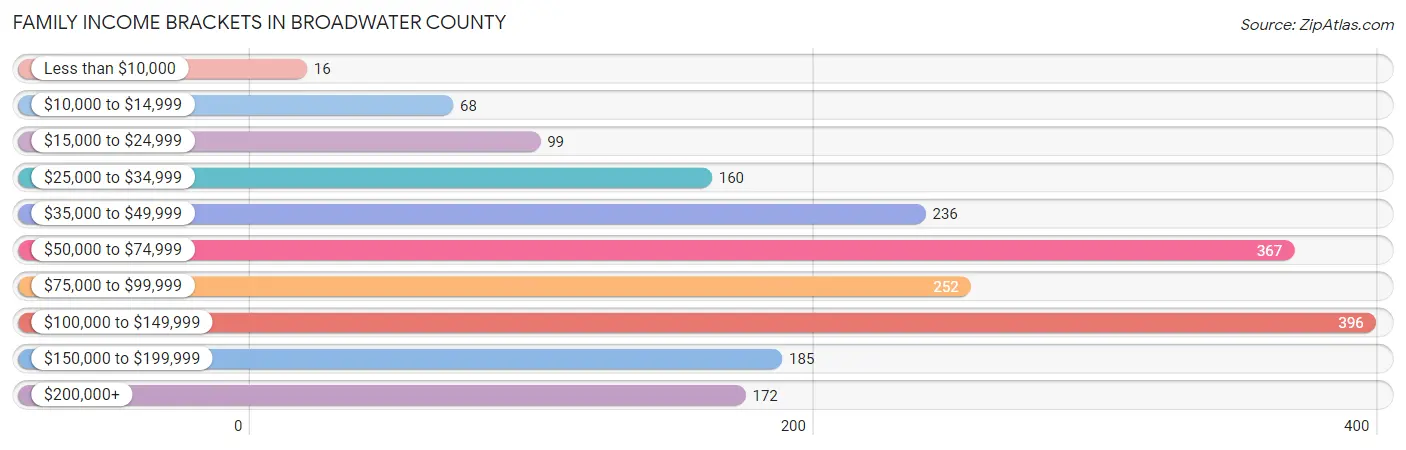
| Income Bracket | # Families | % Families |
| Less than $10,000 | 16 | 0.8% |
| $10,000 to $14,999 | 68 | 3.5% |
| $15,000 to $24,999 | 99 | 5.1% |
| $25,000 to $34,999 | 160 | 8.2% |
| $35,000 to $49,999 | 236 | 12.1% |
| $50,000 to $74,999 | 367 | 18.8% |
| $75,000 to $99,999 | 252 | 12.9% |
| $100,000 to $149,999 | 396 | 20.3% |
| $150,000 to $199,999 | 185 | 9.5% |
| $200,000+ | 172 | 8.8% |
Family Income by Famaliy Size in Broadwater County
6-person families (29 | 1.5%) account for the highest median family income in Broadwater County with $99,063 per family, while 2-person families (1,237 | 63.4%) have the highest median income of $34,312 per family member.
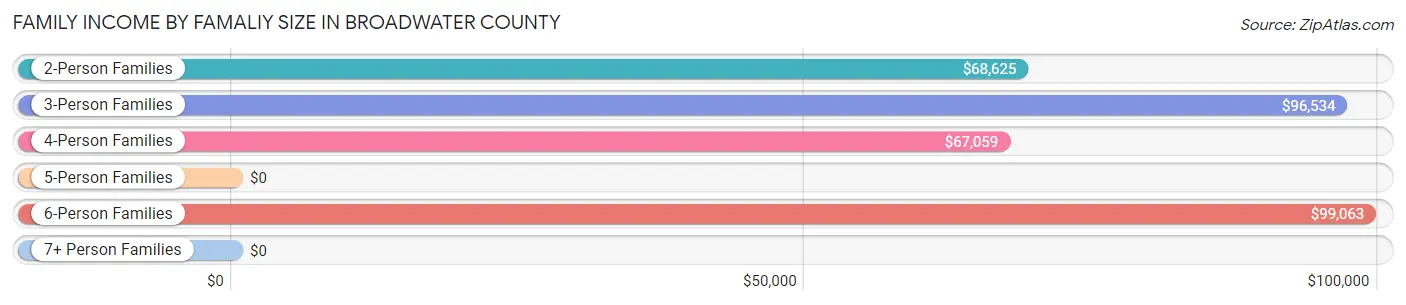
| Income Bracket | # Families | Median Income |
| 2-Person Families | 1,237 (63.4%) | $68,625 |
| 3-Person Families | 279 (14.3%) | $96,534 |
| 4-Person Families | 232 (11.9%) | $67,059 |
| 5-Person Families | 147 (7.5%) | $0 |
| 6-Person Families | 29 (1.5%) | $99,063 |
| 7+ Person Families | 26 (1.3%) | $0 |
| Total | 1,950 (100.0%) | $77,206 |
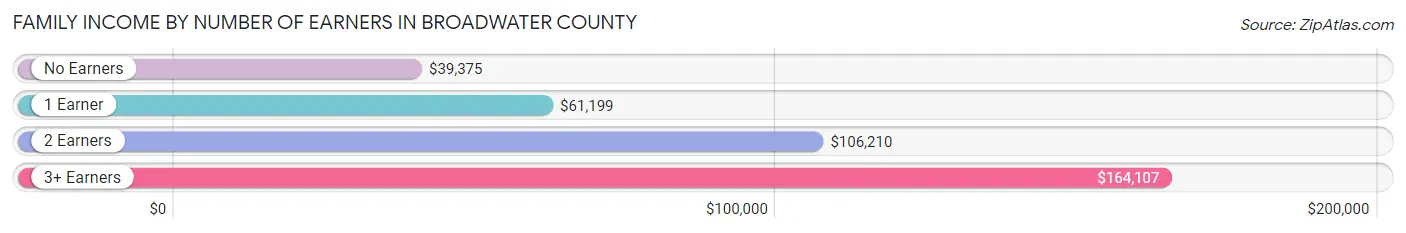
Family Income by Number of Earners in Broadwater County
The median family income in Broadwater County is $77,206, with families comprising 3+ earners (178) having the highest median family income of $164,107, while families with no earners (499) have the lowest median family income of $39,375, accounting for 9.1% and 25.6% of families, respectively.
| Number of Earners | # Families | Median Income |
| No Earners | 499 (25.6%) | $39,375 |
| 1 Earner | 599 (30.7%) | $61,199 |
| 2 Earners | 674 (34.6%) | $106,210 |
| 3+ Earners | 178 (9.1%) | $164,107 |
| Total | 1,950 (100.0%) | $77,206 |
Household Income in Broadwater County
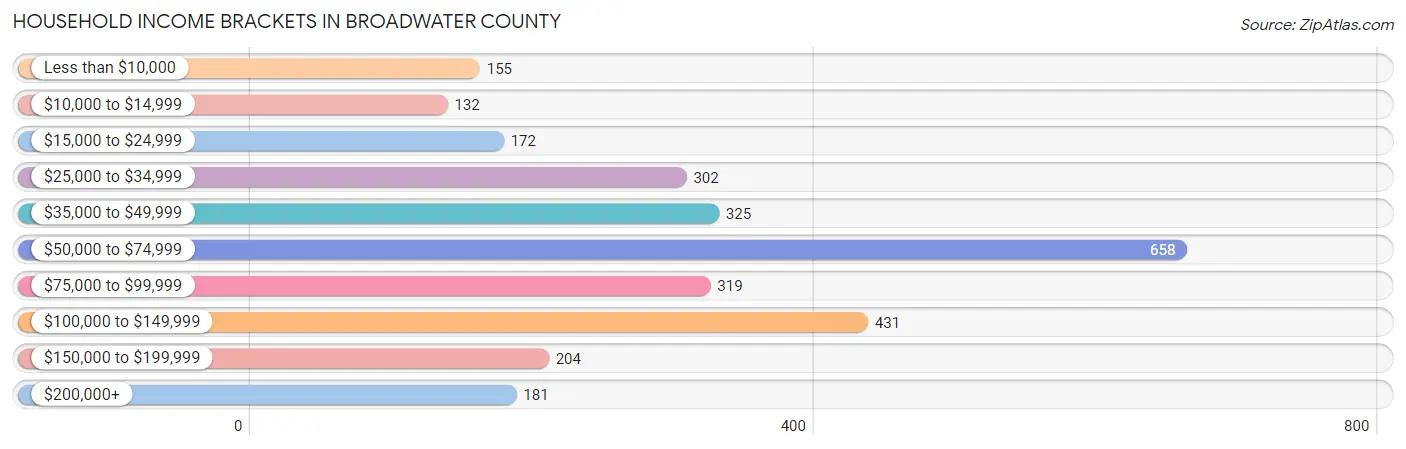
Household Income Brackets in Broadwater County
With 658 households falling in the category, the $50,000 to $74,999 income range is the most frequent in Broadwater County, accounting for 22.9% of all households. In contrast, only 132 households (4.6%) fall into the $10,000 to $14,999 income bracket, making it the least populous group.
| Income Bracket | # Households | % Households |
| Less than $10,000 | 155 | 5.4% |
| $10,000 to $14,999 | 132 | 4.6% |
| $15,000 to $24,999 | 172 | 6.0% |
| $25,000 to $34,999 | 302 | 10.5% |
| $35,000 to $49,999 | 325 | 11.3% |
| $50,000 to $74,999 | 658 | 22.9% |
| $75,000 to $99,999 | 319 | 11.1% |
| $100,000 to $149,999 | 431 | 15.0% |
| $150,000 to $199,999 | 204 | 7.1% |
| $200,000+ | 181 | 6.3% |
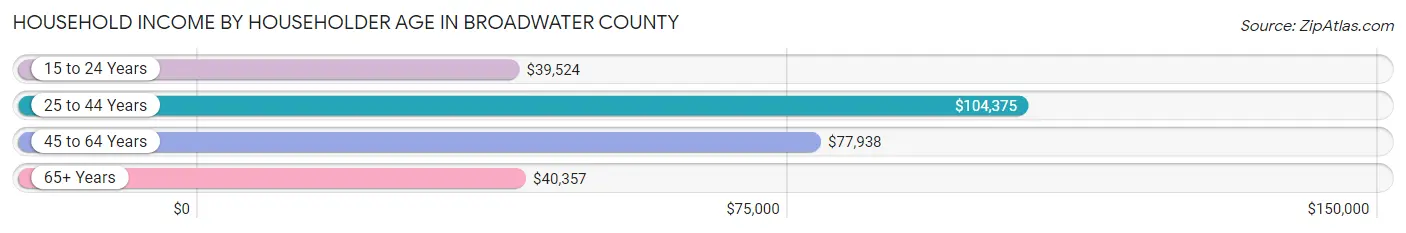
Household Income by Householder Age in Broadwater County
The median household income in Broadwater County is $61,679, with the highest median household income of $104,375 found in the 25 to 44 years age bracket for the primary householder. A total of 511 households (17.8%) fall into this category. Meanwhile, the 15 to 24 years age bracket for the primary householder has the lowest median household income of $39,524, with 202 households (7.0%) in this group.
| Income Bracket | # Households | Median Income |
| 15 to 24 Years | 202 (7.0%) | $39,524 |
| 25 to 44 Years | 511 (17.8%) | $104,375 |
| 45 to 64 Years | 1,069 (37.2%) | $77,938 |
| 65+ Years | 1,090 (38.0%) | $40,357 |
| Total | 2,872 (100.0%) | $61,679 |
Poverty in Broadwater County
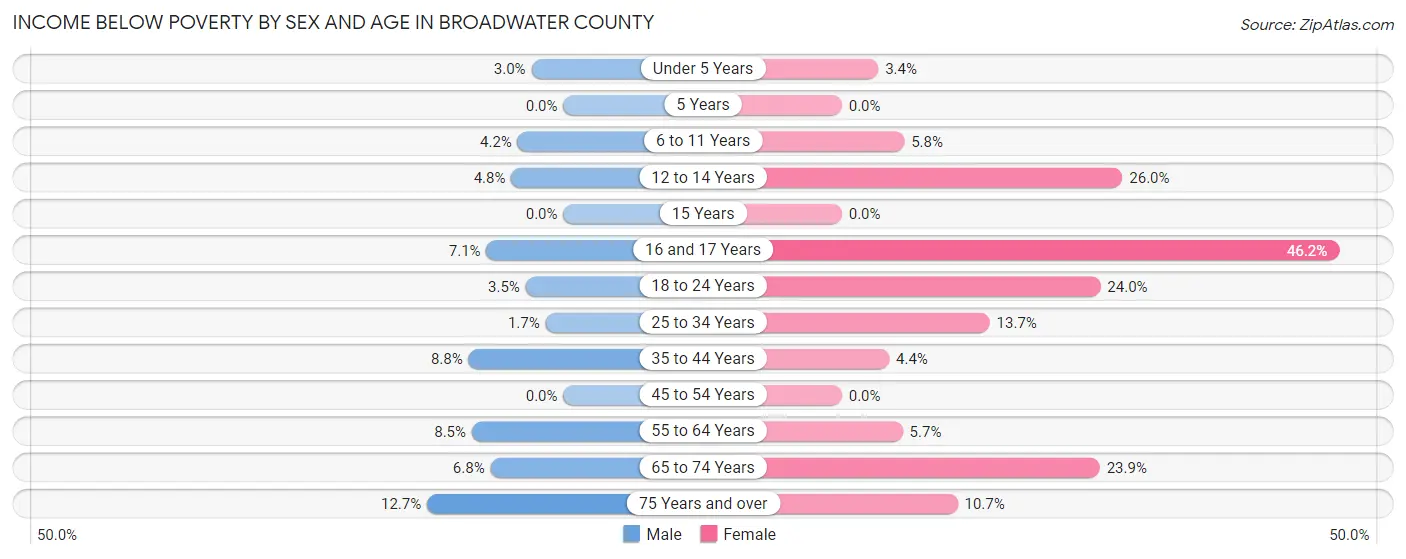
Income Below Poverty by Sex and Age in Broadwater County
With 5.8% poverty level for males and 12.8% for females among the residents of Broadwater County, 75 year old and over males and 16 and 17 year old females are the most vulnerable to poverty, with 41 males (12.7%) and 66 females (46.2%) in their respective age groups living below the poverty level.
| Age Bracket | Male | Female |
| Under 5 Years | 5 (3.0%) | 5 (3.4%) |
| 5 Years | 0 (0.0%) | 0 (0.0%) |
| 6 to 11 Years | 7 (4.2%) | 11 (5.8%) |
| 12 to 14 Years | 7 (4.8%) | 44 (26.0%) |
| 15 Years | 0 (0.0%) | 0 (0.0%) |
| 16 and 17 Years | 6 (7.1%) | 66 (46.2%) |
| 18 to 24 Years | 10 (3.5%) | 72 (24.0%) |
| 25 to 34 Years | 6 (1.7%) | 31 (13.7%) |
| 35 to 44 Years | 36 (8.8%) | 15 (4.4%) |
| 45 to 54 Years | 0 (0.0%) | 0 (0.0%) |
| 55 to 64 Years | 50 (8.5%) | 33 (5.7%) |
| 65 to 74 Years | 38 (6.8%) | 118 (23.9%) |
| 75 Years and over | 41 (12.7%) | 32 (10.7%) |
| Total | 206 (5.8%) | 427 (12.8%) |
Income Above Poverty by Sex and Age in Broadwater County
According to the poverty statistics in Broadwater County, males aged 5 years and females aged 5 years are the age groups that are most secure financially, with 100.0% of males and 100.0% of females in these age groups living above the poverty line.
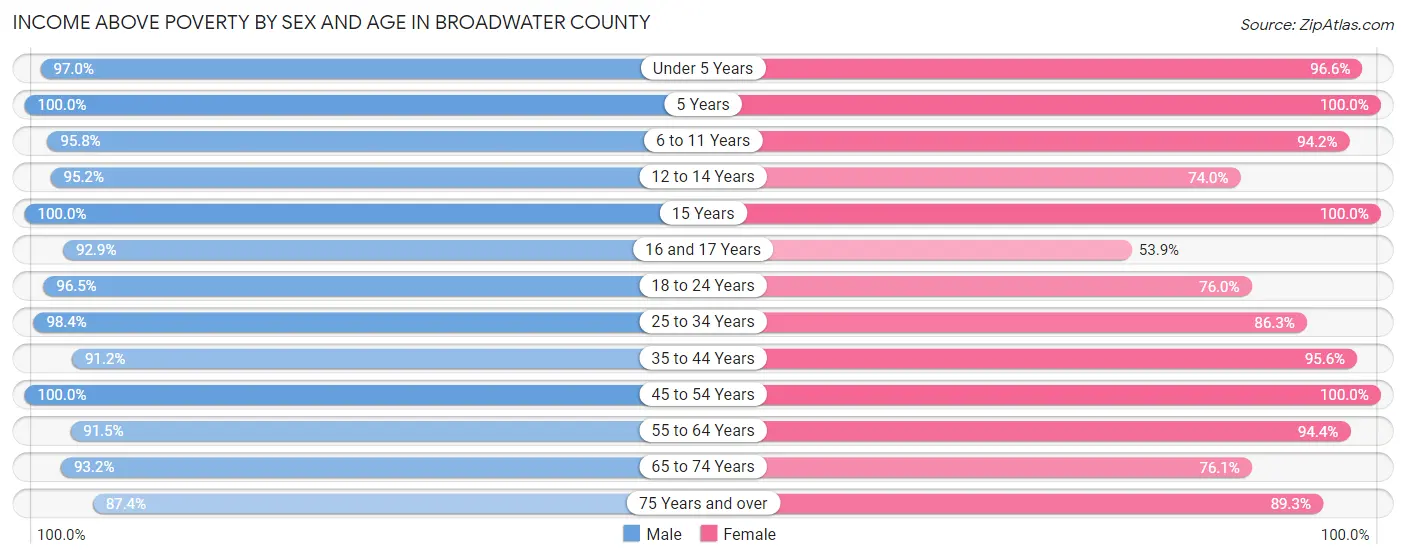
| Age Bracket | Male | Female |
| Under 5 Years | 164 (97.0%) | 143 (96.6%) |
| 5 Years | 46 (100.0%) | 12 (100.0%) |
| 6 to 11 Years | 158 (95.8%) | 179 (94.2%) |
| 12 to 14 Years | 138 (95.2%) | 125 (74.0%) |
| 15 Years | 13 (100.0%) | 20 (100.0%) |
| 16 and 17 Years | 78 (92.9%) | 77 (53.8%) |
| 18 to 24 Years | 276 (96.5%) | 228 (76.0%) |
| 25 to 34 Years | 357 (98.4%) | 195 (86.3%) |
| 35 to 44 Years | 373 (91.2%) | 327 (95.6%) |
| 45 to 54 Years | 421 (100.0%) | 418 (100.0%) |
| 55 to 64 Years | 539 (91.5%) | 551 (94.4%) |
| 65 to 74 Years | 524 (93.2%) | 375 (76.1%) |
| 75 Years and over | 283 (87.4%) | 266 (89.3%) |
| Total | 3,370 (94.2%) | 2,916 (87.2%) |
Income Below Poverty Among Married-Couple Families in Broadwater County
The poverty statistics for married-couple families in Broadwater County show that 2.2% or 37 of the total 1,654 families live below the poverty line. Families with 3 or 4 children have the highest poverty rate of 7.8%, comprising of 12 families. On the other hand, families with 1 or 2 children have the lowest poverty rate of 0.0%, which includes 0 families.
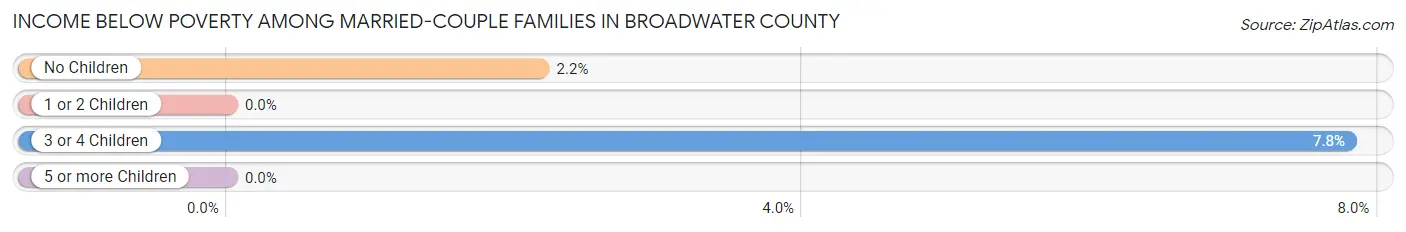
| Children | Above Poverty | Below Poverty |
| No Children | 1,125 (97.8%) | 25 (2.2%) |
| 1 or 2 Children | 324 (100.0%) | 0 (0.0%) |
| 3 or 4 Children | 142 (92.2%) | 12 (7.8%) |
| 5 or more Children | 26 (100.0%) | 0 (0.0%) |
| Total | 1,617 (97.8%) | 37 (2.2%) |
Income Below Poverty Among Single-Parent Households in Broadwater County
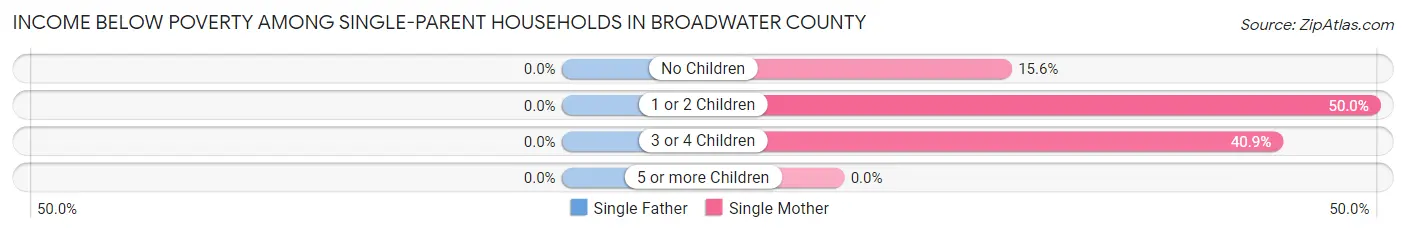
| Children | Single Father | Single Mother |
| No Children | 0 (0.0%) | 17 (15.6%) |
| 1 or 2 Children | 0 (0.0%) | 32 (50.0%) |
| 3 or 4 Children | 0 (0.0%) | 9 (40.9%) |
| 5 or more Children | 0 (0.0%) | 0 (0.0%) |
| Total | 0 (0.0%) | 58 (29.7%) |
Income Below Poverty Among Married-Couple vs Single-Parent Households in Broadwater County
The poverty data for Broadwater County shows that 37 of the married-couple family households (2.2%) and 58 of the single-parent households (19.6%) are living below the poverty level. Within the married-couple family households, those with 3 or 4 children have the highest poverty rate, with 12 households (7.8%) falling below the poverty line. Among the single-parent households, those with 3 or 4 children have the highest poverty rate, with 9 household (40.9%) living below poverty.
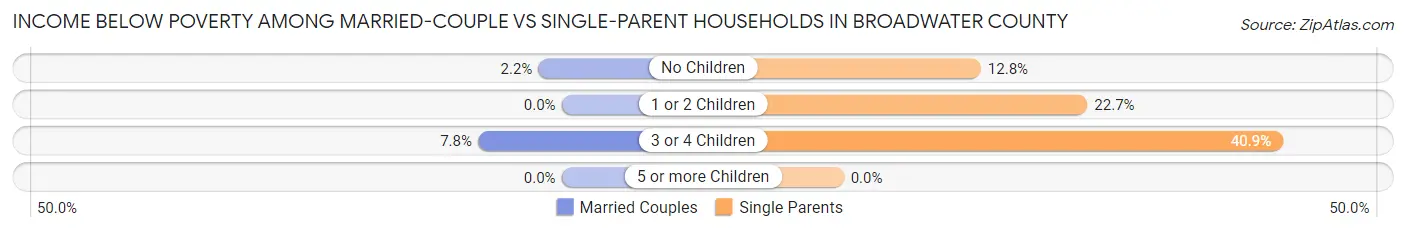
| Children | Married-Couple Families | Single-Parent Households |
| No Children | 25 (2.2%) | 17 (12.8%) |
| 1 or 2 Children | 0 (0.0%) | 32 (22.7%) |
| 3 or 4 Children | 12 (7.8%) | 9 (40.9%) |
| 5 or more Children | 0 (0.0%) | 0 (0.0%) |
| Total | 37 (2.2%) | 58 (19.6%) |
Employment Characteristics in Broadwater County
Employment by Class of Employer in Broadwater County
Among the 3,138 employed individuals in Broadwater County, private company employees (1,879 | 59.9%), local government employees (269 | 8.6%), and self-employed (not incorporated) (266 | 8.5%) make up the most common classes of employment.
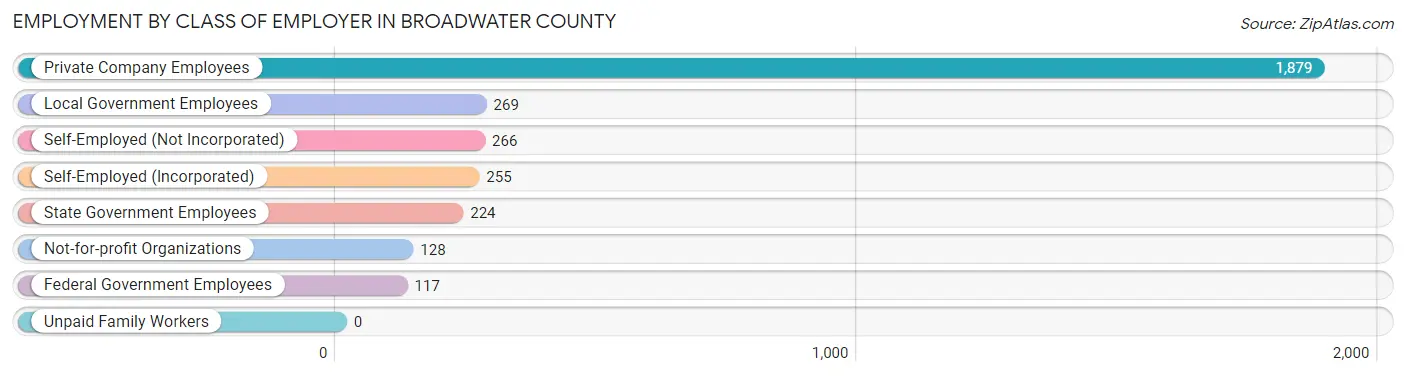
| Employer Class | # Employees | % Employees |
| Private Company Employees | 1,879 | 59.9% |
| Self-Employed (Incorporated) | 255 | 8.1% |
| Self-Employed (Not Incorporated) | 266 | 8.5% |
| Not-for-profit Organizations | 128 | 4.1% |
| Local Government Employees | 269 | 8.6% |
| State Government Employees | 224 | 7.1% |
| Federal Government Employees | 117 | 3.7% |
| Unpaid Family Workers | 0 | 0.0% |
| Total | 3,138 | 100.0% |
Employment Status by Age in Broadwater County
According to the labor force statistics for Broadwater County, out of the total population over 16 years of age (5,896), 58.8% or 3,467 individuals are in the labor force, with 8.2% or 284 of them unemployed. The age group with the highest labor force participation rate is 30 to 34 years, with 91.3% or 432 individuals in the labor force. Within the labor force, the 16 to 19 years age range has the highest percentage of unemployed individuals, with 41.6% or 89 of them being unemployed.
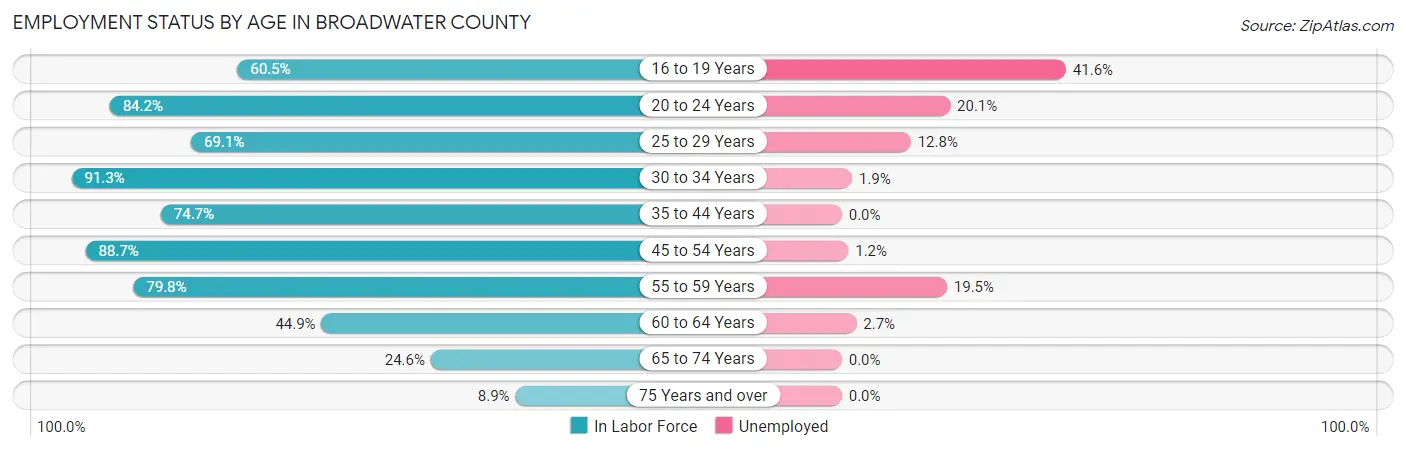
| Age Bracket | In Labor Force | Unemployed |
| 16 to 19 Years | 214 (60.5%) | 89 (41.6%) |
| 20 to 24 Years | 389 (84.2%) | 78 (20.1%) |
| 25 to 29 Years | 94 (69.1%) | 12 (12.8%) |
| 30 to 34 Years | 432 (91.3%) | 8 (1.9%) |
| 35 to 44 Years | 570 (74.7%) | 0 (0.0%) |
| 45 to 54 Years | 744 (88.7%) | 9 (1.2%) |
| 55 to 59 Years | 410 (79.8%) | 80 (19.5%) |
| 60 to 64 Years | 298 (44.9%) | 8 (2.7%) |
| 65 to 74 Years | 261 (24.6%) | 0 (0.0%) |
| 75 Years and over | 56 (8.9%) | 0 (0.0%) |
| Total | 3,467 (58.8%) | 284 (8.2%) |
Employment Status by Educational Attainment in Broadwater County
According to labor force statistics for Broadwater County, 75.2% of individuals (2,548) out of the total population between 25 and 64 years of age (3,388) are in the labor force, with 4.6% or 117 of them being unemployed. The group with the highest labor force participation rate are those with the educational attainment of bachelor's degree or higher, with 83.9% or 704 individuals in the labor force. Within the labor force, individuals with college / associate degree education have the highest percentage of unemployment, with 7.1% or 80 of them being unemployed.
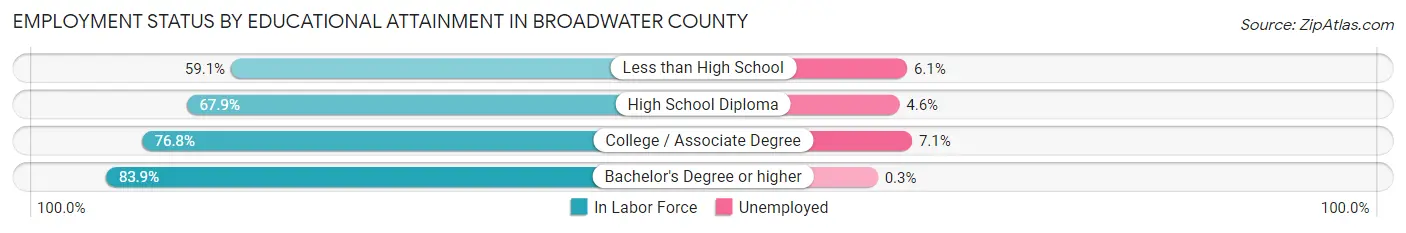
| Educational Attainment | In Labor Force | Unemployed |
| Less than High School | 114 (59.1%) | 12 (6.1%) |
| High School Diploma | 609 (67.9%) | 41 (4.6%) |
| College / Associate Degree | 1,121 (76.8%) | 104 (7.1%) |
| Bachelor's Degree or higher | 704 (83.9%) | 3 (0.3%) |
| Total | 2,548 (75.2%) | 156 (4.6%) |
Employment Occupations by Sex in Broadwater County
Management, Business, Science and Arts Occupations
The most common Management, Business, Science and Arts occupations in Broadwater County are Management (554 | 17.4%), Community & Social Service (293 | 9.2%), Education Instruction & Library (130 | 4.1%), Business & Financial (106 | 3.3%), and Health Diagnosing & Treating (96 | 3.0%).
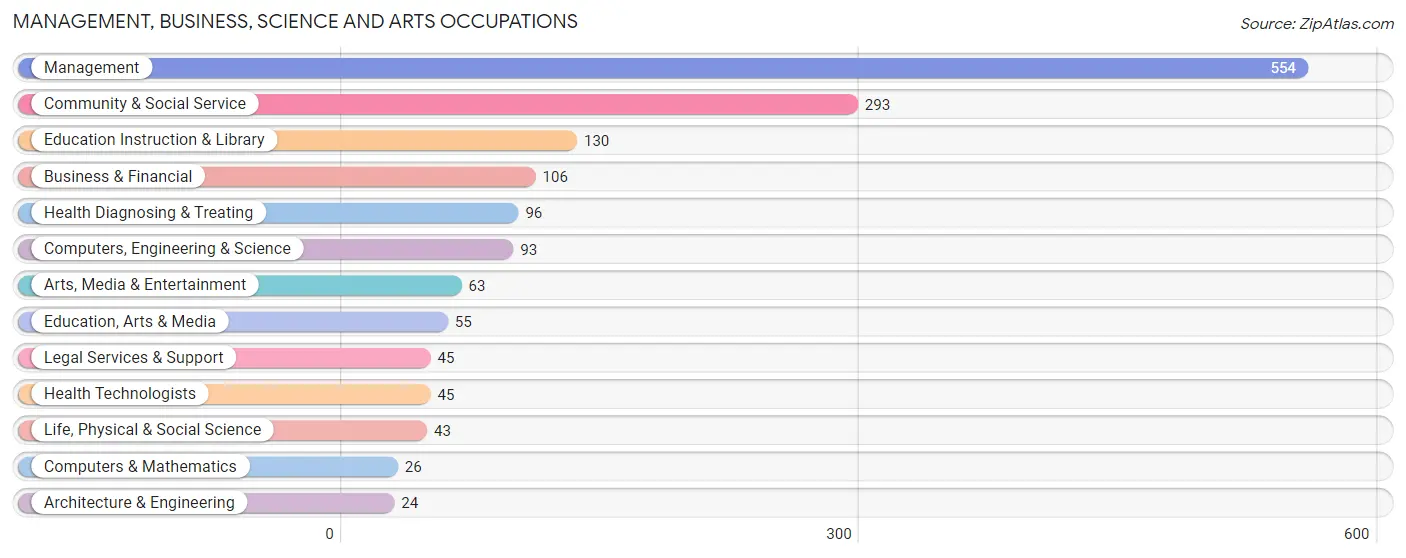
Management, Business, Science and Arts Occupations by Sex
Within the Management, Business, Science and Arts occupations in Broadwater County, the most male-oriented occupations are Computers & Mathematics (100.0%), Architecture & Engineering (100.0%), and Computers, Engineering & Science (78.5%), while the most female-oriented occupations are Legal Services & Support (100.0%), Health Technologists (100.0%), and Education Instruction & Library (92.3%).
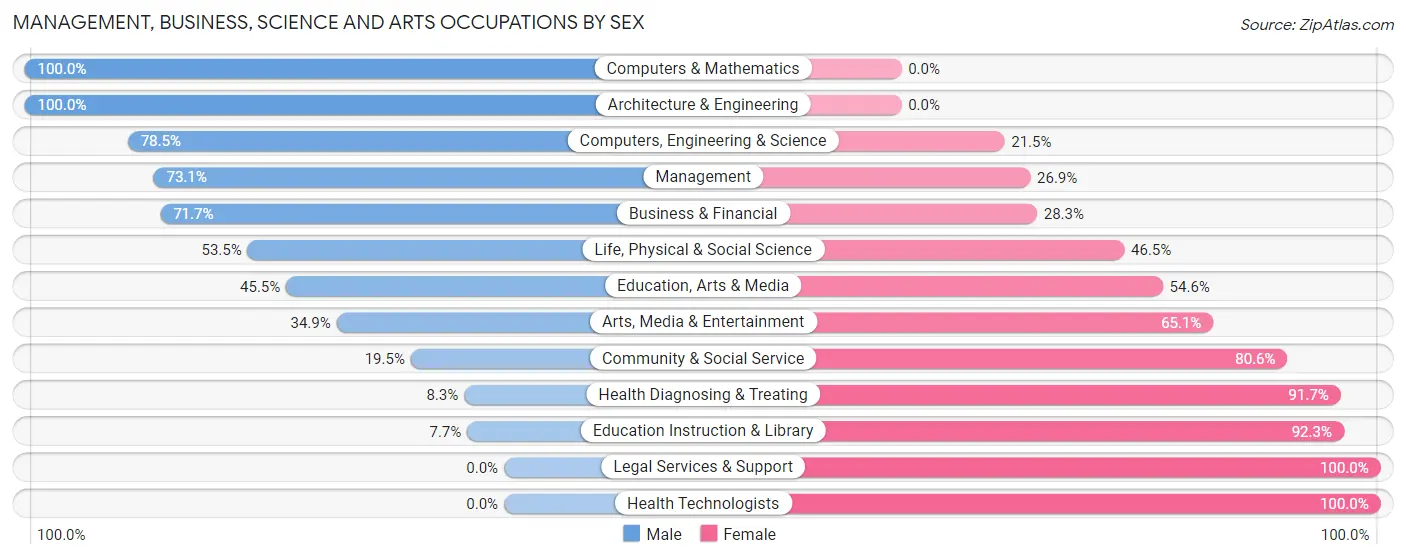
| Occupation | Male | Female |
| Management | 405 (73.1%) | 149 (26.9%) |
| Business & Financial | 76 (71.7%) | 30 (28.3%) |
| Computers, Engineering & Science | 73 (78.5%) | 20 (21.5%) |
| Computers & Mathematics | 26 (100.0%) | 0 (0.0%) |
| Architecture & Engineering | 24 (100.0%) | 0 (0.0%) |
| Life, Physical & Social Science | 23 (53.5%) | 20 (46.5%) |
| Community & Social Service | 57 (19.5%) | 236 (80.5%) |
| Education, Arts & Media | 25 (45.5%) | 30 (54.5%) |
| Legal Services & Support | 0 (0.0%) | 45 (100.0%) |
| Education Instruction & Library | 10 (7.7%) | 120 (92.3%) |
| Arts, Media & Entertainment | 22 (34.9%) | 41 (65.1%) |
| Health Diagnosing & Treating | 8 (8.3%) | 88 (91.7%) |
| Health Technologists | 0 (0.0%) | 45 (100.0%) |
| Total (Category) | 619 (54.2%) | 523 (45.8%) |
| Total (Overall) | 1,955 (61.4%) | 1,227 (38.6%) |
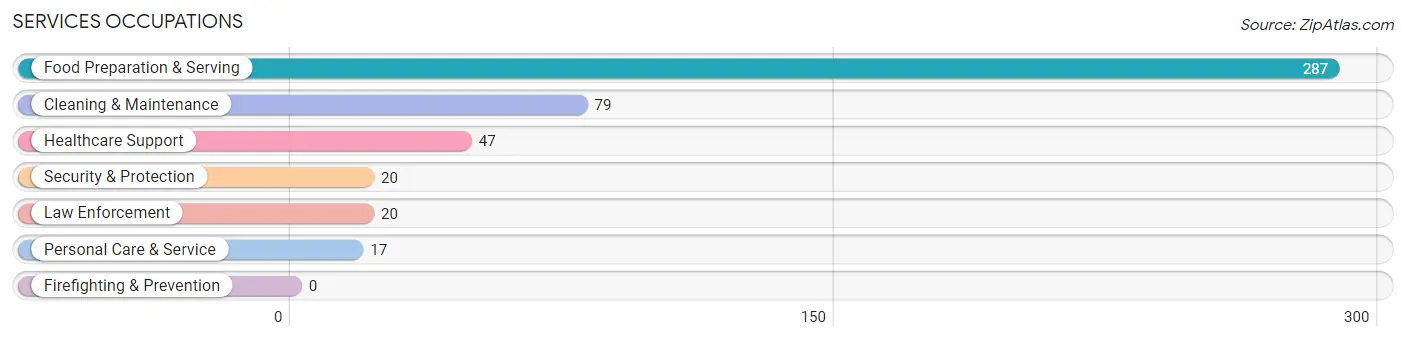
Services Occupations
The most common Services occupations in Broadwater County are Food Preparation & Serving (287 | 9.0%), Cleaning & Maintenance (79 | 2.5%), Healthcare Support (47 | 1.5%), Security & Protection (20 | 0.6%), and Law Enforcement (20 | 0.6%).
Services Occupations by Sex
Within the Services occupations in Broadwater County, the most male-oriented occupations are Security & Protection (100.0%), Law Enforcement (100.0%), and Personal Care & Service (52.9%), while the most female-oriented occupations are Healthcare Support (100.0%), Cleaning & Maintenance (87.3%), and Food Preparation & Serving (56.5%).
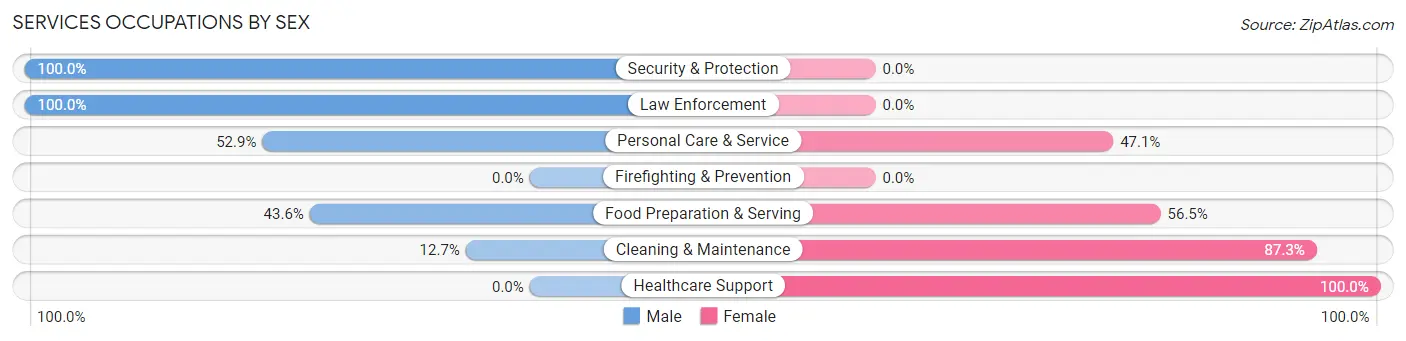
| Occupation | Male | Female |
| Healthcare Support | 0 (0.0%) | 47 (100.0%) |
| Security & Protection | 20 (100.0%) | 0 (0.0%) |
| Firefighting & Prevention | 0 (0.0%) | 0 (0.0%) |
| Law Enforcement | 20 (100.0%) | 0 (0.0%) |
| Food Preparation & Serving | 125 (43.5%) | 162 (56.5%) |
| Cleaning & Maintenance | 10 (12.7%) | 69 (87.3%) |
| Personal Care & Service | 9 (52.9%) | 8 (47.1%) |
| Total (Category) | 164 (36.4%) | 286 (63.6%) |
| Total (Overall) | 1,955 (61.4%) | 1,227 (38.6%) |
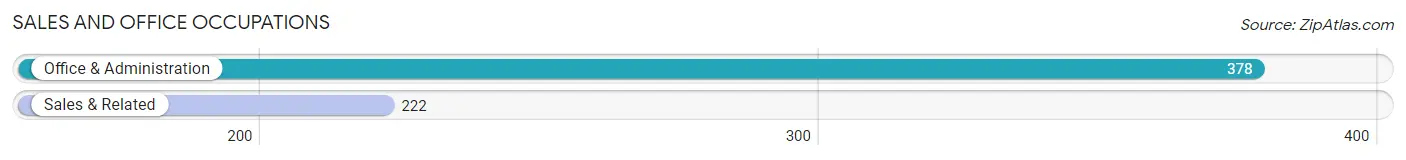
Sales and Office Occupations
The most common Sales and Office occupations in Broadwater County are Office & Administration (378 | 11.9%), and Sales & Related (222 | 7.0%).
Sales and Office Occupations by Sex
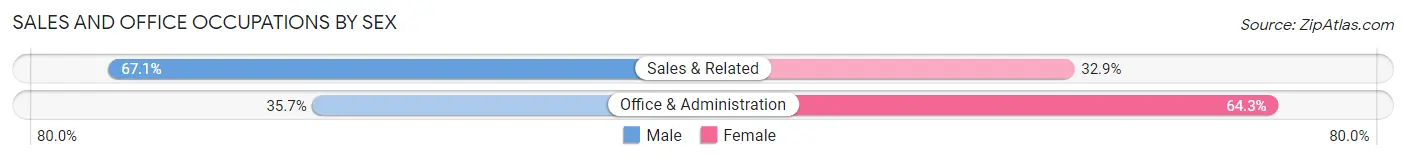
| Occupation | Male | Female |
| Sales & Related | 149 (67.1%) | 73 (32.9%) |
| Office & Administration | 135 (35.7%) | 243 (64.3%) |
| Total (Category) | 284 (47.3%) | 316 (52.7%) |
| Total (Overall) | 1,955 (61.4%) | 1,227 (38.6%) |
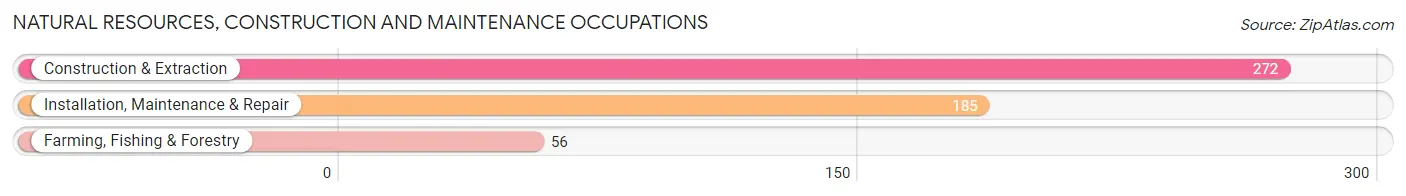
Natural Resources, Construction and Maintenance Occupations
The most common Natural Resources, Construction and Maintenance occupations in Broadwater County are Construction & Extraction (272 | 8.6%), Installation, Maintenance & Repair (185 | 5.8%), and Farming, Fishing & Forestry (56 | 1.8%).
Natural Resources, Construction and Maintenance Occupations by Sex
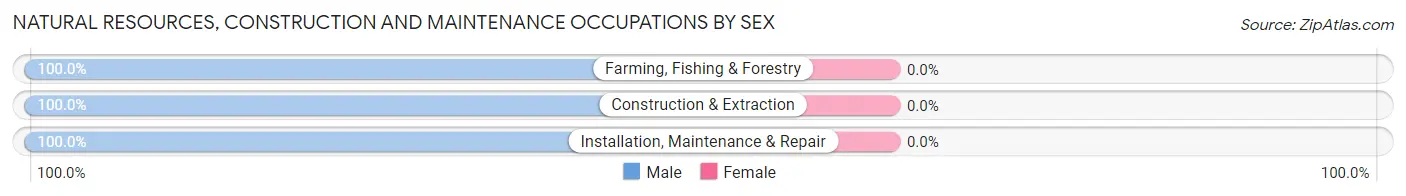
| Occupation | Male | Female |
| Farming, Fishing & Forestry | 56 (100.0%) | 0 (0.0%) |
| Construction & Extraction | 272 (100.0%) | 0 (0.0%) |
| Installation, Maintenance & Repair | 185 (100.0%) | 0 (0.0%) |
| Total (Category) | 513 (100.0%) | 0 (0.0%) |
| Total (Overall) | 1,955 (61.4%) | 1,227 (38.6%) |
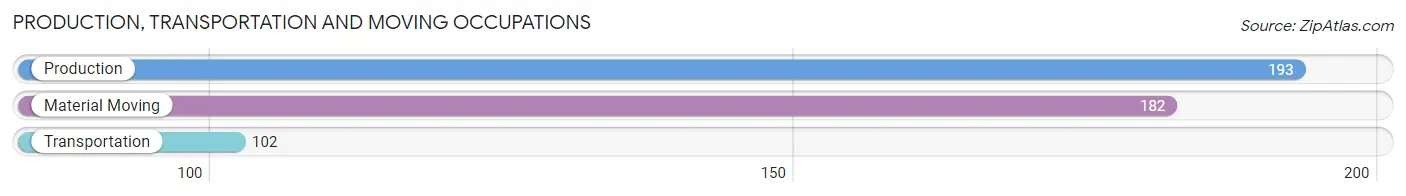
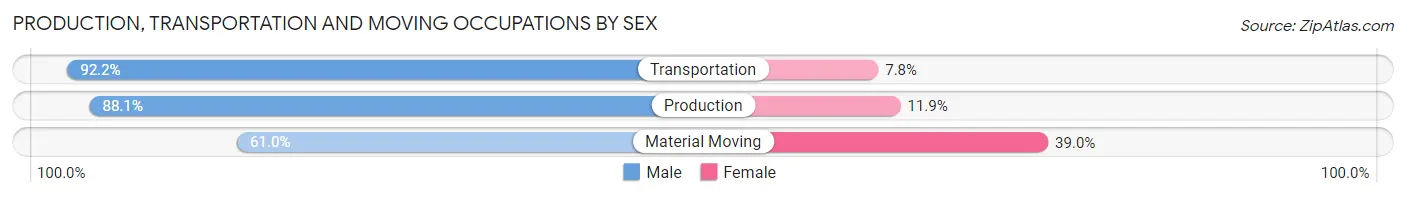
Production, Transportation and Moving Occupations
The most common Production, Transportation and Moving occupations in Broadwater County are Production (193 | 6.1%), Material Moving (182 | 5.7%), and Transportation (102 | 3.2%).
Production, Transportation and Moving Occupations by Sex
| Occupation | Male | Female |
| Production | 170 (88.1%) | 23 (11.9%) |
| Transportation | 94 (92.2%) | 8 (7.8%) |
| Material Moving | 111 (61.0%) | 71 (39.0%) |
| Total (Category) | 375 (78.6%) | 102 (21.4%) |
| Total (Overall) | 1,955 (61.4%) | 1,227 (38.6%) |
Employment Industries by Sex in Broadwater County
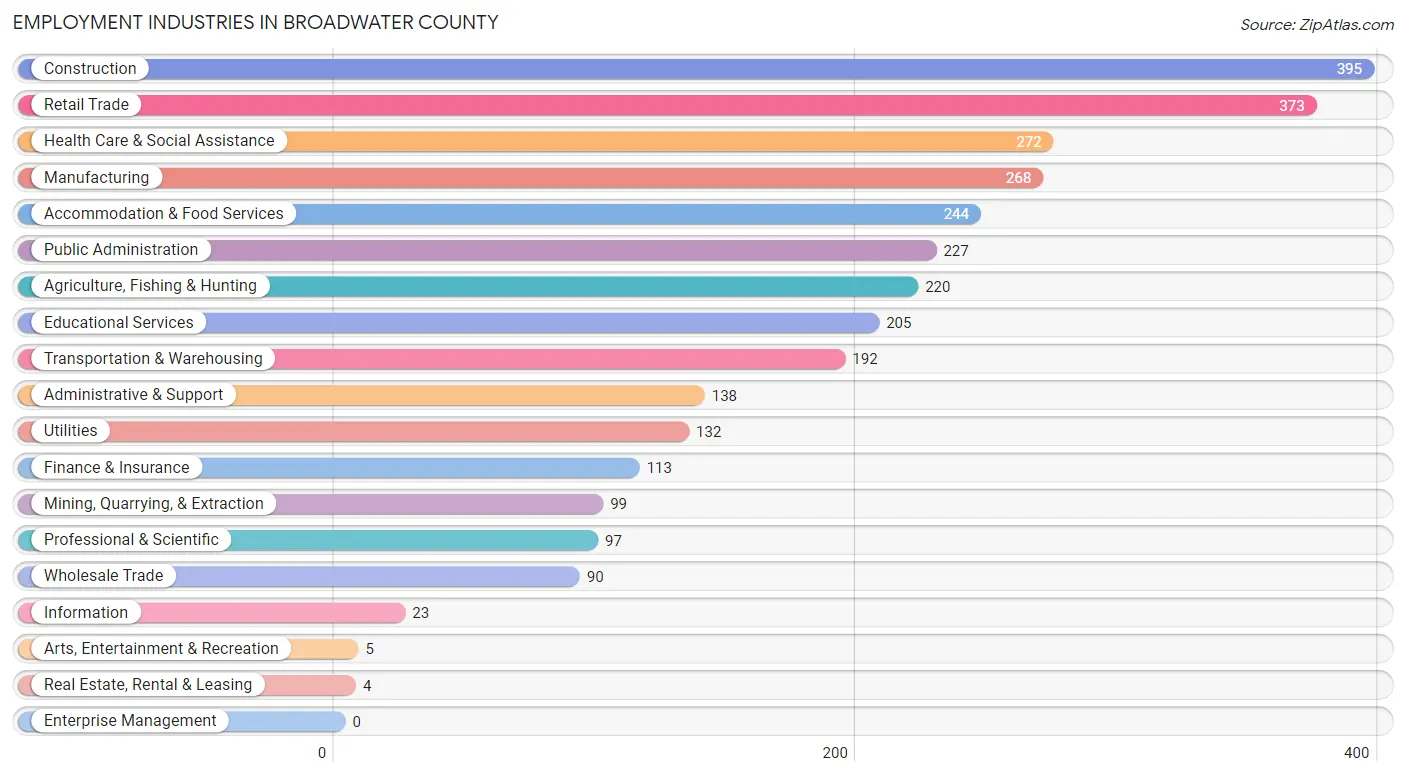
Employment Industries in Broadwater County
The major employment industries in Broadwater County include Construction (395 | 12.4%), Retail Trade (373 | 11.7%), Health Care & Social Assistance (272 | 8.6%), Manufacturing (268 | 8.4%), and Accommodation & Food Services (244 | 7.7%).
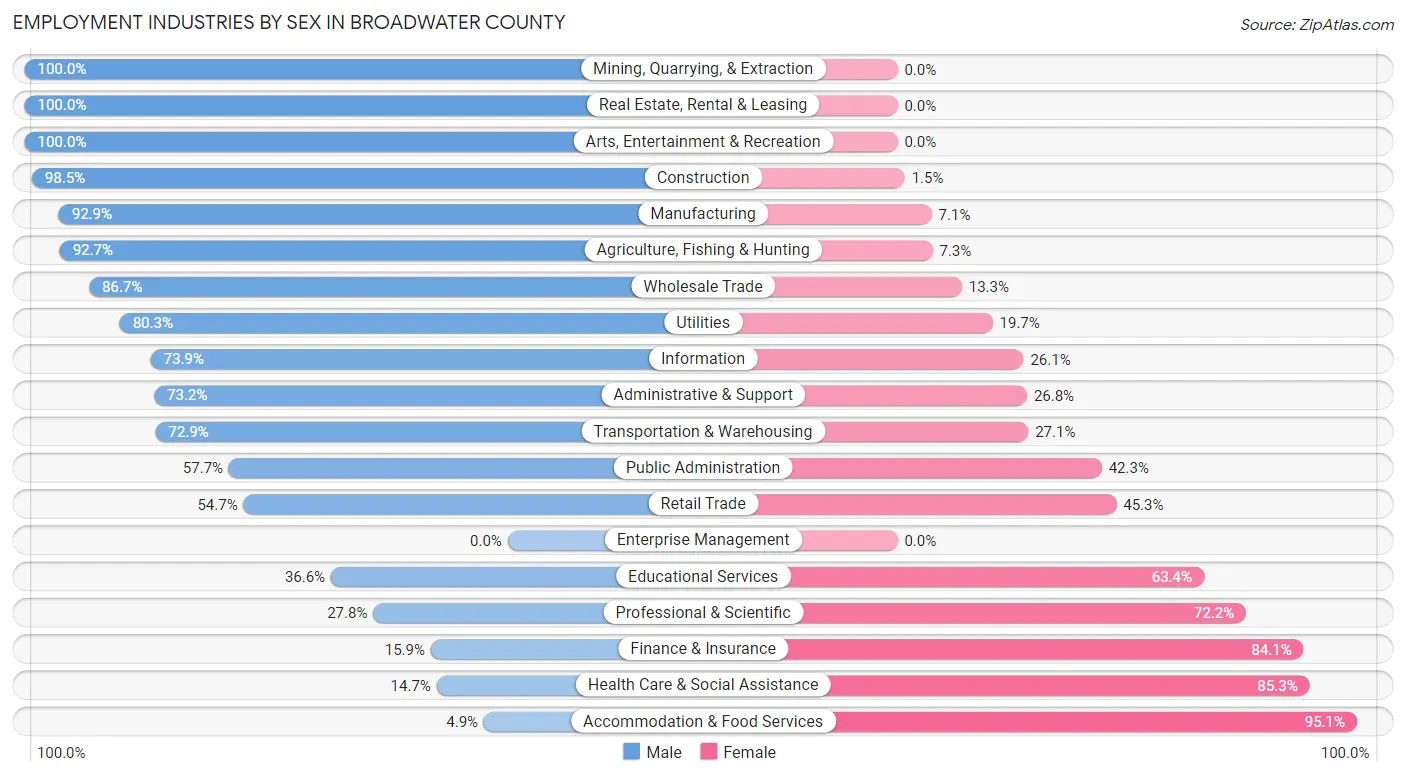
Employment Industries by Sex in Broadwater County
The Broadwater County industries that see more men than women are Mining, Quarrying, & Extraction (100.0%), Real Estate, Rental & Leasing (100.0%), and Arts, Entertainment & Recreation (100.0%), whereas the industries that tend to have a higher number of women are Accommodation & Food Services (95.1%), Health Care & Social Assistance (85.3%), and Finance & Insurance (84.1%).
| Industry | Male | Female |
| Agriculture, Fishing & Hunting | 204 (92.7%) | 16 (7.3%) |
| Mining, Quarrying, & Extraction | 99 (100.0%) | 0 (0.0%) |
| Construction | 389 (98.5%) | 6 (1.5%) |
| Manufacturing | 249 (92.9%) | 19 (7.1%) |
| Wholesale Trade | 78 (86.7%) | 12 (13.3%) |
| Retail Trade | 204 (54.7%) | 169 (45.3%) |
| Transportation & Warehousing | 140 (72.9%) | 52 (27.1%) |
| Utilities | 106 (80.3%) | 26 (19.7%) |
| Information | 17 (73.9%) | 6 (26.1%) |
| Finance & Insurance | 18 (15.9%) | 95 (84.1%) |
| Real Estate, Rental & Leasing | 4 (100.0%) | 0 (0.0%) |
| Professional & Scientific | 27 (27.8%) | 70 (72.2%) |
| Enterprise Management | 0 (0.0%) | 0 (0.0%) |
| Administrative & Support | 101 (73.2%) | 37 (26.8%) |
| Educational Services | 75 (36.6%) | 130 (63.4%) |
| Health Care & Social Assistance | 40 (14.7%) | 232 (85.3%) |
| Arts, Entertainment & Recreation | 5 (100.0%) | 0 (0.0%) |
| Accommodation & Food Services | 12 (4.9%) | 232 (95.1%) |
| Public Administration | 131 (57.7%) | 96 (42.3%) |
| Total | 1,955 (61.4%) | 1,227 (38.6%) |
Education in Broadwater County
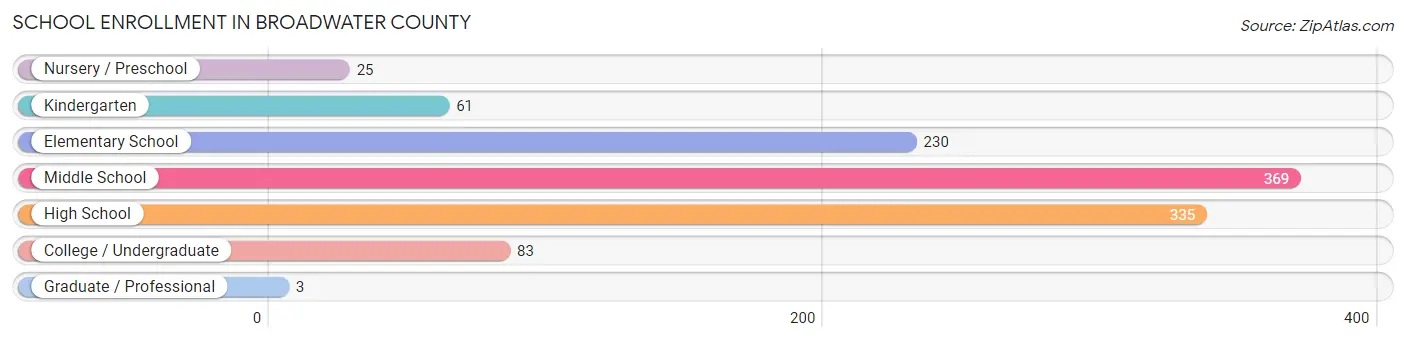
School Enrollment in Broadwater County
The most common levels of schooling among the 1,106 students in Broadwater County are middle school (369 | 33.4%), high school (335 | 30.3%), and elementary school (230 | 20.8%).
| School Level | # Students | % Students |
| Nursery / Preschool | 25 | 2.3% |
| Kindergarten | 61 | 5.5% |
| Elementary School | 230 | 20.8% |
| Middle School | 369 | 33.4% |
| High School | 335 | 30.3% |
| College / Undergraduate | 83 | 7.5% |
| Graduate / Professional | 3 | 0.3% |
| Total | 1,106 | 100.0% |
School Enrollment by Age by Funding Source in Broadwater County
Out of a total of 1,106 students who are enrolled in schools in Broadwater County, 145 (13.1%) attend a private institution, while the remaining 961 (86.9%) are enrolled in public schools. The age group of 3 to 4 year olds has the highest likelihood of being enrolled in private schools, with 20 (80.0% in the age bracket) enrolled. Conversely, the age group of 25 to 34 year olds has the lowest likelihood of being enrolled in a private school, with 4 (100.0% in the age bracket) attending a public institution.
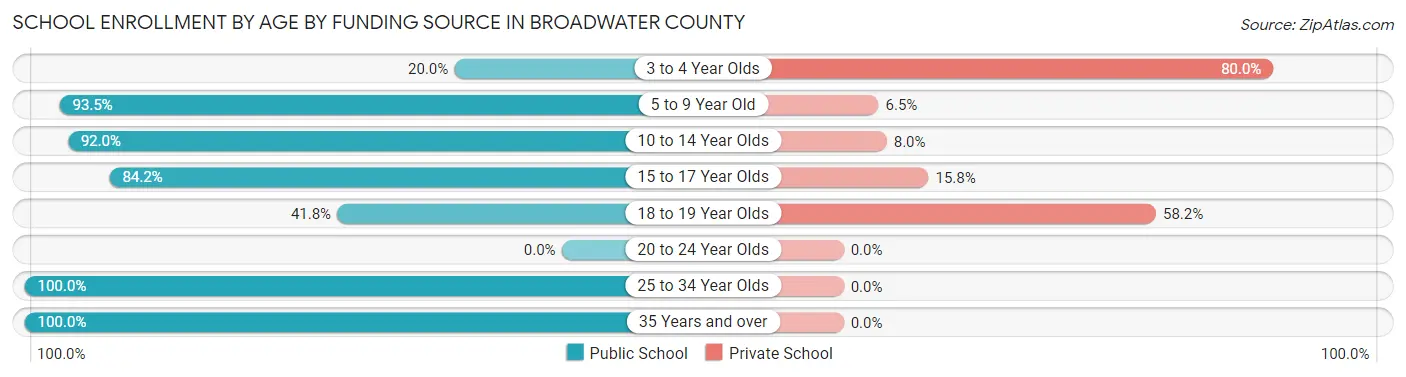
| Age Bracket | Public School | Private School |
| 3 to 4 Year Olds | 5 (20.0%) | 20 (80.0%) |
| 5 to 9 Year Old | 230 (93.5%) | 16 (6.5%) |
| 10 to 14 Year Olds | 424 (92.0%) | 37 (8.0%) |
| 15 to 17 Year Olds | 213 (84.2%) | 40 (15.8%) |
| 18 to 19 Year Olds | 23 (41.8%) | 32 (58.2%) |
| 20 to 24 Year Olds | 0 (0.0%) | 0 (0.0%) |
| 25 to 34 Year Olds | 4 (100.0%) | 0 (0.0%) |
| 35 Years and over | 62 (100.0%) | 0 (0.0%) |
| Total | 961 (86.9%) | 145 (13.1%) |
Educational Attainment by Field of Study in Broadwater County
Education (236 | 19.8%), business (189 | 15.9%), bio, nature & agricultural (168 | 14.1%), arts & humanities (102 | 8.6%), and science & technology (97 | 8.1%) are the most common fields of study among 1,191 individuals in Broadwater County who have obtained a bachelor's degree or higher.
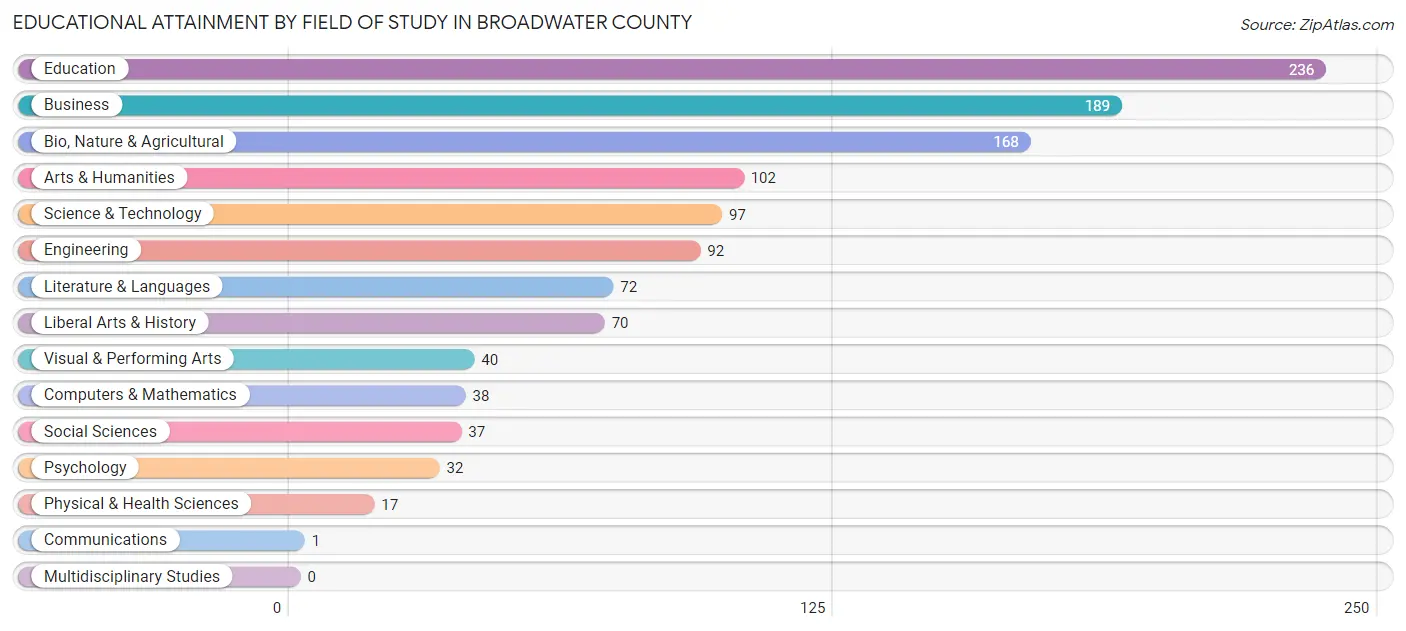
| Field of Study | # Graduates | % Graduates |
| Computers & Mathematics | 38 | 3.2% |
| Bio, Nature & Agricultural | 168 | 14.1% |
| Physical & Health Sciences | 17 | 1.4% |
| Psychology | 32 | 2.7% |
| Social Sciences | 37 | 3.1% |
| Engineering | 92 | 7.7% |
| Multidisciplinary Studies | 0 | 0.0% |
| Science & Technology | 97 | 8.1% |
| Business | 189 | 15.9% |
| Education | 236 | 19.8% |
| Literature & Languages | 72 | 6.0% |
| Liberal Arts & History | 70 | 5.9% |
| Visual & Performing Arts | 40 | 3.4% |
| Communications | 1 | 0.1% |
| Arts & Humanities | 102 | 8.6% |
| Total | 1,191 | 100.0% |
Transportation & Commute in Broadwater County
Vehicle Availability by Sex in Broadwater County
The most prevalent vehicle ownership categories in Broadwater County are males with 2 vehicles (827, accounting for 43.1%) and females with 2 vehicles (469, making up 67.7%).
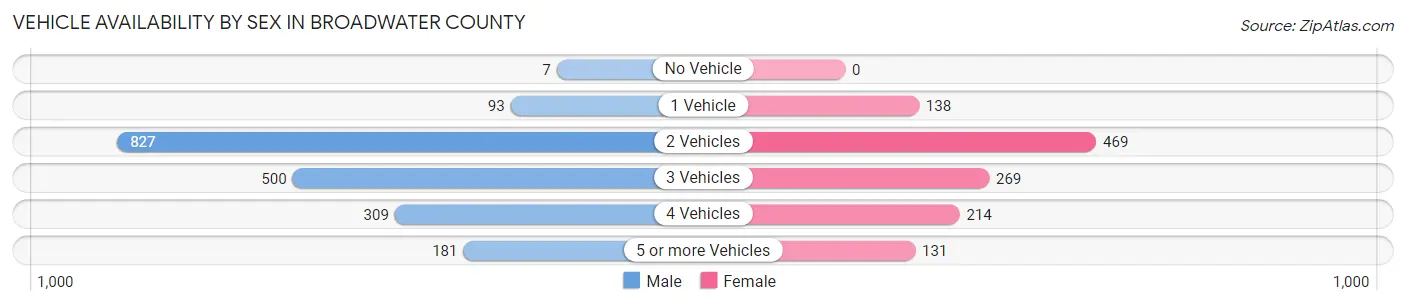
| Vehicles Available | Male | Female |
| No Vehicle | 7 (0.4%) | 0 (0.0%) |
| 1 Vehicle | 93 (4.9%) | 138 (11.3%) |
| 2 Vehicles | 827 (43.1%) | 469 (38.4%) |
| 3 Vehicles | 500 (26.1%) | 269 (22.0%) |
| 4 Vehicles | 309 (16.1%) | 214 (17.5%) |
| 5 or more Vehicles | 181 (9.4%) | 131 (10.7%) |
| Total | 1,917 (100.0%) | 1,221 (100.0%) |
Commute Time in Broadwater County
The most frequently occuring commute durations in Broadwater County are 5 to 9 minutes (410 commuters, 14.8%), less than 5 minutes (382 commuters, 13.8%), and 15 to 19 minutes (371 commuters, 13.4%).
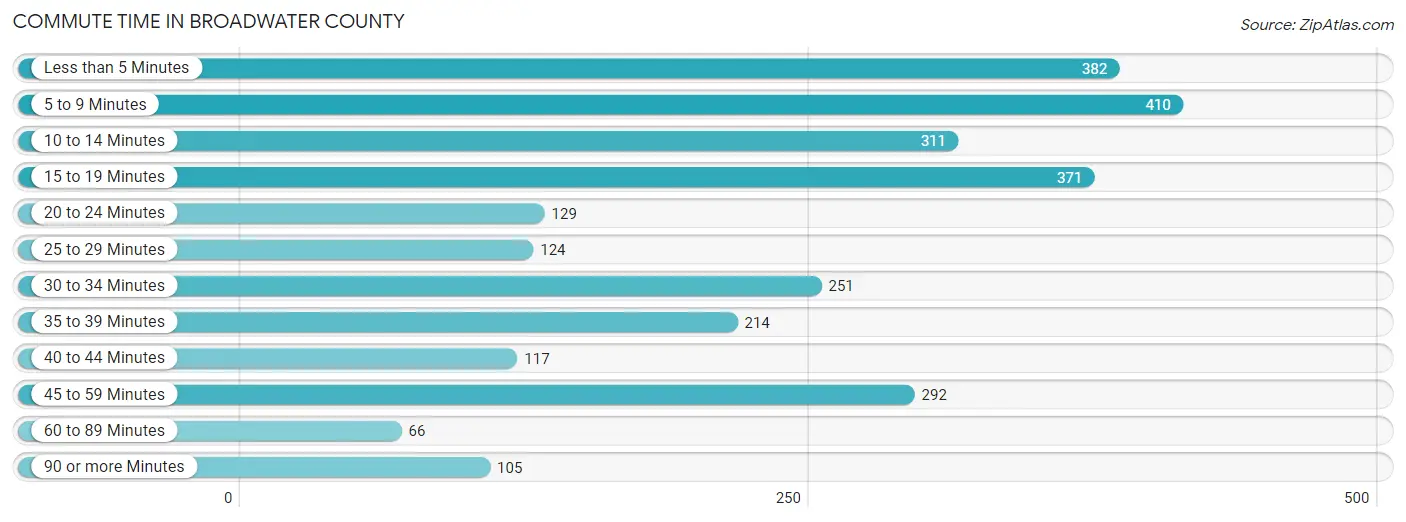
| Commute Time | # Commuters | % Commuters |
| Less than 5 Minutes | 382 | 13.8% |
| 5 to 9 Minutes | 410 | 14.8% |
| 10 to 14 Minutes | 311 | 11.2% |
| 15 to 19 Minutes | 371 | 13.4% |
| 20 to 24 Minutes | 129 | 4.6% |
| 25 to 29 Minutes | 124 | 4.5% |
| 30 to 34 Minutes | 251 | 9.0% |
| 35 to 39 Minutes | 214 | 7.7% |
| 40 to 44 Minutes | 117 | 4.2% |
| 45 to 59 Minutes | 292 | 10.5% |
| 60 to 89 Minutes | 66 | 2.4% |
| 90 or more Minutes | 105 | 3.8% |
Commute Time by Sex in Broadwater County
The most common commute times in Broadwater County are 15 to 19 minutes (351 commuters, 20.9%) for males and 5 to 9 minutes (230 commuters, 21.1%) for females.
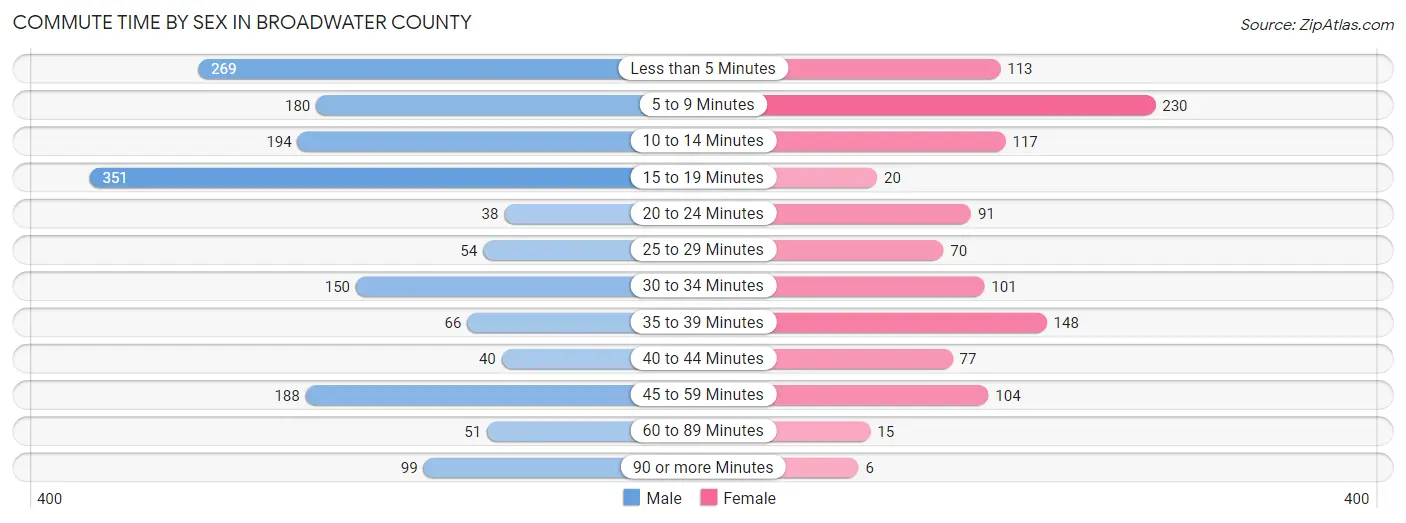
| Commute Time | Male | Female |
| Less than 5 Minutes | 269 (16.0%) | 113 (10.3%) |
| 5 to 9 Minutes | 180 (10.7%) | 230 (21.1%) |
| 10 to 14 Minutes | 194 (11.6%) | 117 (10.7%) |
| 15 to 19 Minutes | 351 (20.9%) | 20 (1.8%) |
| 20 to 24 Minutes | 38 (2.3%) | 91 (8.3%) |
| 25 to 29 Minutes | 54 (3.2%) | 70 (6.4%) |
| 30 to 34 Minutes | 150 (8.9%) | 101 (9.2%) |
| 35 to 39 Minutes | 66 (3.9%) | 148 (13.6%) |
| 40 to 44 Minutes | 40 (2.4%) | 77 (7.0%) |
| 45 to 59 Minutes | 188 (11.2%) | 104 (9.5%) |
| 60 to 89 Minutes | 51 (3.0%) | 15 (1.4%) |
| 90 or more Minutes | 99 (5.9%) | 6 (0.5%) |
Time of Departure to Work by Sex in Broadwater County
The most frequent times of departure to work in Broadwater County are 7:00 AM to 7:29 AM (331, 19.7%) for males and 7:30 AM to 7:59 AM (234, 21.4%) for females.
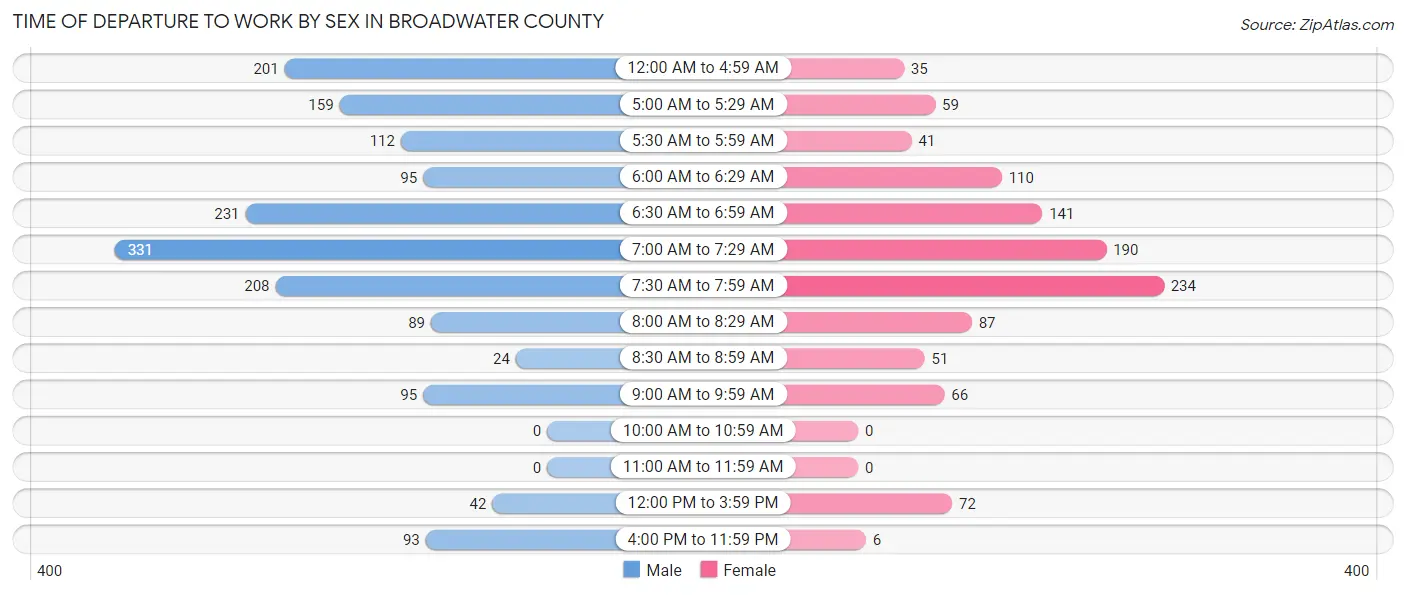
| Time of Departure | Male | Female |
| 12:00 AM to 4:59 AM | 201 (12.0%) | 35 (3.2%) |
| 5:00 AM to 5:29 AM | 159 (9.5%) | 59 (5.4%) |
| 5:30 AM to 5:59 AM | 112 (6.7%) | 41 (3.7%) |
| 6:00 AM to 6:29 AM | 95 (5.7%) | 110 (10.1%) |
| 6:30 AM to 6:59 AM | 231 (13.8%) | 141 (12.9%) |
| 7:00 AM to 7:29 AM | 331 (19.7%) | 190 (17.4%) |
| 7:30 AM to 7:59 AM | 208 (12.4%) | 234 (21.4%) |
| 8:00 AM to 8:29 AM | 89 (5.3%) | 87 (8.0%) |
| 8:30 AM to 8:59 AM | 24 (1.4%) | 51 (4.7%) |
| 9:00 AM to 9:59 AM | 95 (5.7%) | 66 (6.0%) |
| 10:00 AM to 10:59 AM | 0 (0.0%) | 0 (0.0%) |
| 11:00 AM to 11:59 AM | 0 (0.0%) | 0 (0.0%) |
| 12:00 PM to 3:59 PM | 42 (2.5%) | 72 (6.6%) |
| 4:00 PM to 11:59 PM | 93 (5.5%) | 6 (0.5%) |
| Total | 1,680 (100.0%) | 1,092 (100.0%) |
Housing Occupancy in Broadwater County
Occupancy by Ownership in Broadwater County
Of the total 2,872 dwellings in Broadwater County, owner-occupied units account for 2,385 (83.0%), while renter-occupied units make up 487 (17.0%).
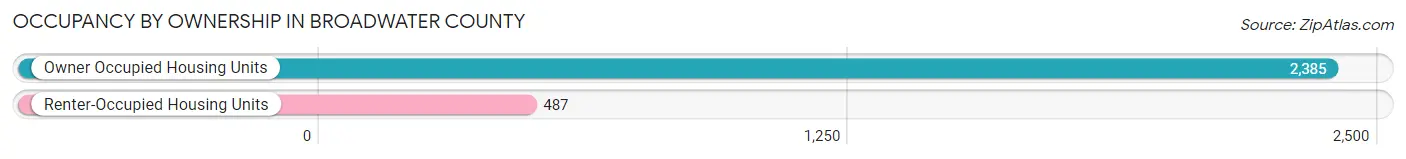
| Occupancy | # Housing Units | % Housing Units |
| Owner Occupied Housing Units | 2,385 | 83.0% |
| Renter-Occupied Housing Units | 487 | 17.0% |
| Total Occupied Housing Units | 2,872 | 100.0% |
Occupancy by Household Size in Broadwater County

| Household Size | # Housing Units | % Housing Units |
| 1-Person Household | 723 | 25.2% |
| 2-Person Household | 1,370 | 47.7% |
| 3-Person Household | 313 | 10.9% |
| 4+ Person Household | 466 | 16.2% |
| Total Housing Units | 2,872 | 100.0% |
Occupancy by Ownership by Household Size in Broadwater County
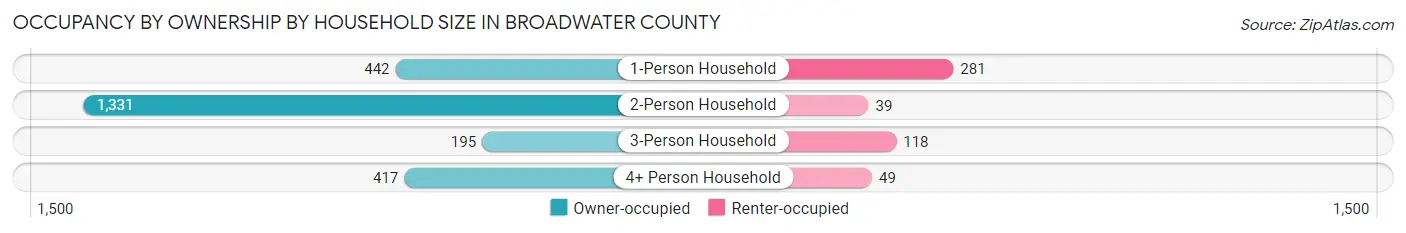
| Household Size | Owner-occupied | Renter-occupied |
| 1-Person Household | 442 (61.1%) | 281 (38.9%) |
| 2-Person Household | 1,331 (97.2%) | 39 (2.9%) |
| 3-Person Household | 195 (62.3%) | 118 (37.7%) |
| 4+ Person Household | 417 (89.5%) | 49 (10.5%) |
| Total Housing Units | 2,385 (83.0%) | 487 (17.0%) |
Occupancy by Educational Attainment in Broadwater County
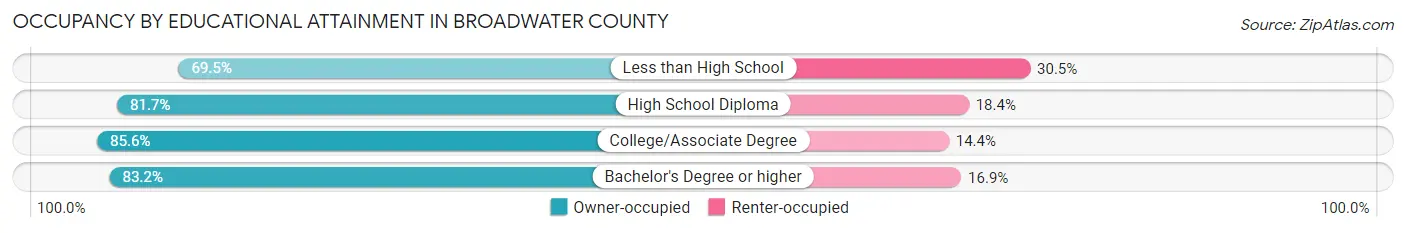
| Household Size | Owner-occupied | Renter-occupied |
| Less than High School | 107 (69.5%) | 47 (30.5%) |
| High School Diploma | 681 (81.7%) | 153 (18.3%) |
| College/Associate Degree | 1,059 (85.6%) | 178 (14.4%) |
| Bachelor's Degree or higher | 538 (83.2%) | 109 (16.9%) |
Occupancy by Age of Householder in Broadwater County
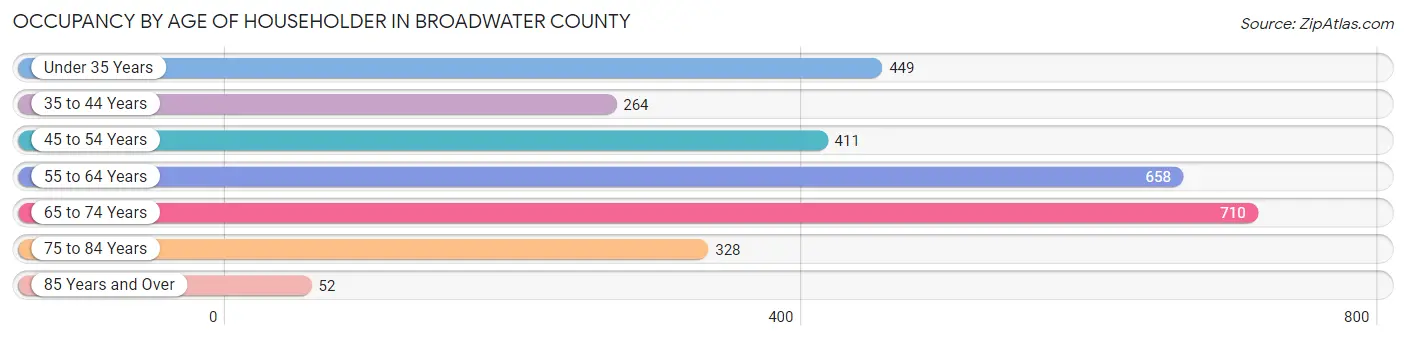
| Age Bracket | # Households | % Households |
| Under 35 Years | 449 | 15.6% |
| 35 to 44 Years | 264 | 9.2% |
| 45 to 54 Years | 411 | 14.3% |
| 55 to 64 Years | 658 | 22.9% |
| 65 to 74 Years | 710 | 24.7% |
| 75 to 84 Years | 328 | 11.4% |
| 85 Years and Over | 52 | 1.8% |
| Total | 2,872 | 100.0% |
Housing Finances in Broadwater County
Median Income by Occupancy in Broadwater County
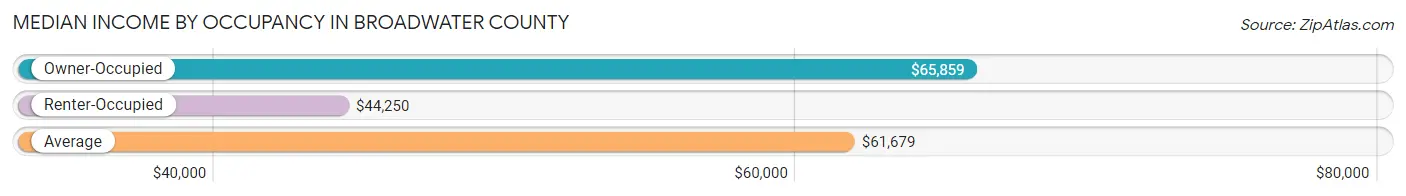
| Occupancy Type | # Households | Median Income |
| Owner-Occupied | 2,385 (83.0%) | $65,859 |
| Renter-Occupied | 487 (17.0%) | $44,250 |
| Average | 2,872 (100.0%) | $61,679 |
Occupancy by Householder Income Bracket in Broadwater County
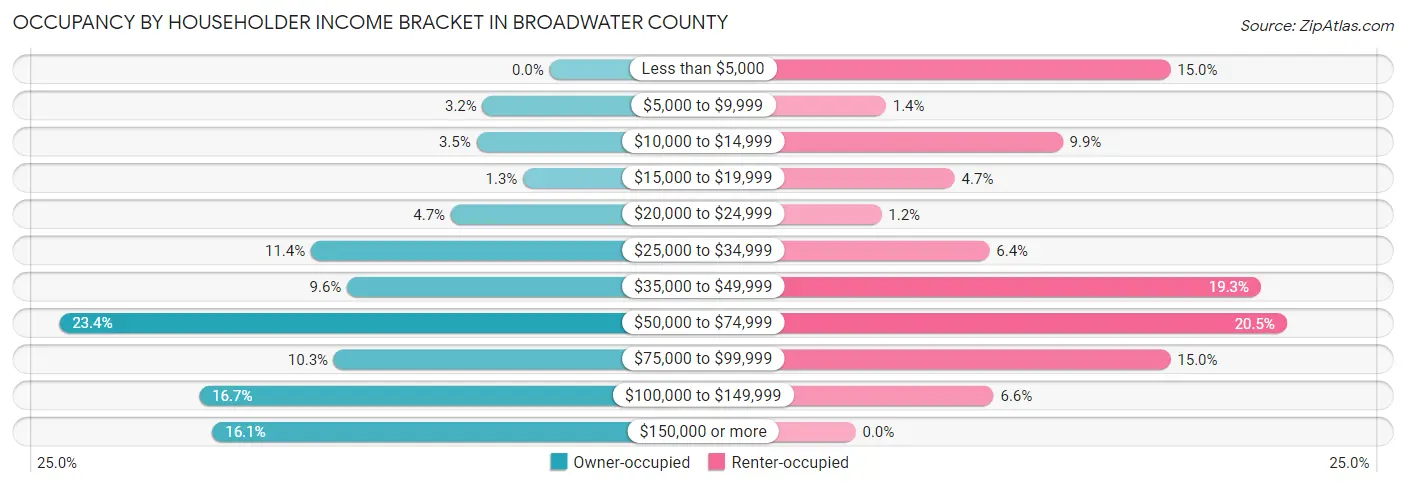
| Income Bracket | Owner-occupied | Renter-occupied |
| Less than $5,000 | 0 (0.0%) | 73 (15.0%) |
| $5,000 to $9,999 | 76 (3.2%) | 7 (1.4%) |
| $10,000 to $14,999 | 83 (3.5%) | 48 (9.9%) |
| $15,000 to $19,999 | 30 (1.3%) | 23 (4.7%) |
| $20,000 to $24,999 | 112 (4.7%) | 6 (1.2%) |
| $25,000 to $34,999 | 271 (11.4%) | 31 (6.4%) |
| $35,000 to $49,999 | 230 (9.6%) | 94 (19.3%) |
| $50,000 to $74,999 | 557 (23.4%) | 100 (20.5%) |
| $75,000 to $99,999 | 245 (10.3%) | 73 (15.0%) |
| $100,000 to $149,999 | 398 (16.7%) | 32 (6.6%) |
| $150,000 or more | 383 (16.1%) | 0 (0.0%) |
| Total | 2,385 (100.0%) | 487 (100.0%) |
Monthly Housing Cost Tiers in Broadwater County
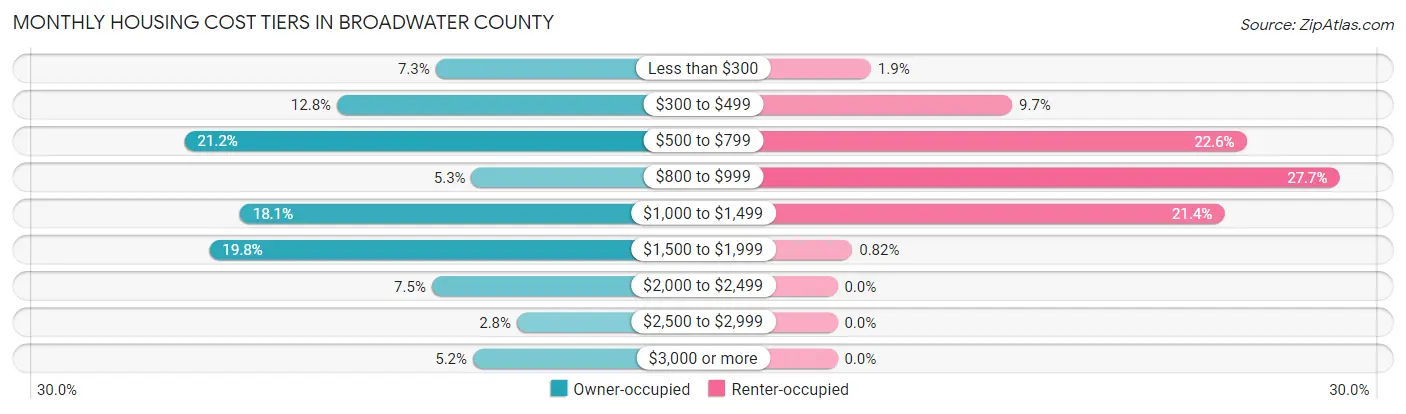
| Monthly Cost | Owner-occupied | Renter-occupied |
| Less than $300 | 174 (7.3%) | 9 (1.8%) |
| $300 to $499 | 304 (12.8%) | 47 (9.7%) |
| $500 to $799 | 505 (21.2%) | 110 (22.6%) |
| $800 to $999 | 127 (5.3%) | 135 (27.7%) |
| $1,000 to $1,499 | 432 (18.1%) | 104 (21.4%) |
| $1,500 to $1,999 | 472 (19.8%) | 4 (0.8%) |
| $2,000 to $2,499 | 179 (7.5%) | 0 (0.0%) |
| $2,500 to $2,999 | 67 (2.8%) | 0 (0.0%) |
| $3,000 or more | 125 (5.2%) | 0 (0.0%) |
| Total | 2,385 (100.0%) | 487 (100.0%) |
Physical Housing Characteristics in Broadwater County
Housing Structures in Broadwater County
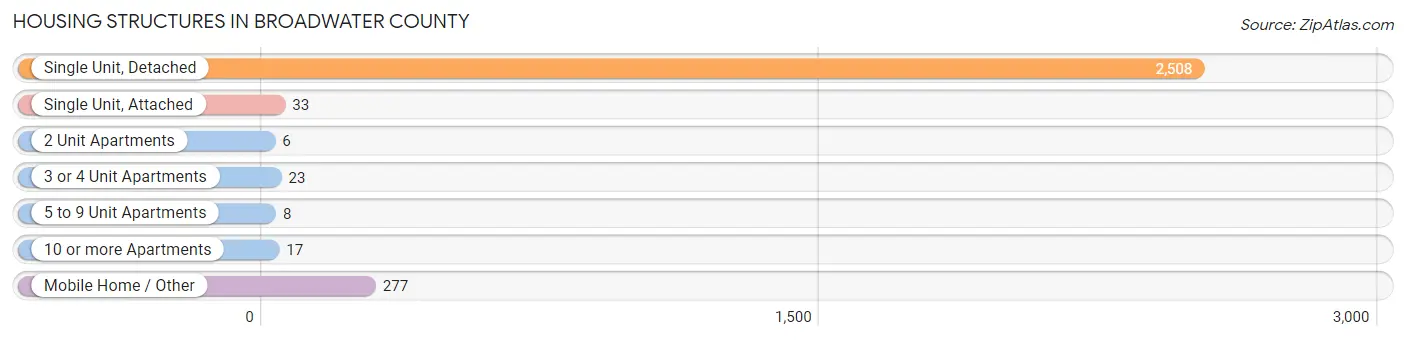
| Structure Type | # Housing Units | % Housing Units |
| Single Unit, Detached | 2,508 | 87.3% |
| Single Unit, Attached | 33 | 1.1% |
| 2 Unit Apartments | 6 | 0.2% |
| 3 or 4 Unit Apartments | 23 | 0.8% |
| 5 to 9 Unit Apartments | 8 | 0.3% |
| 10 or more Apartments | 17 | 0.6% |
| Mobile Home / Other | 277 | 9.6% |
| Total | 2,872 | 100.0% |
Housing Structures by Occupancy in Broadwater County
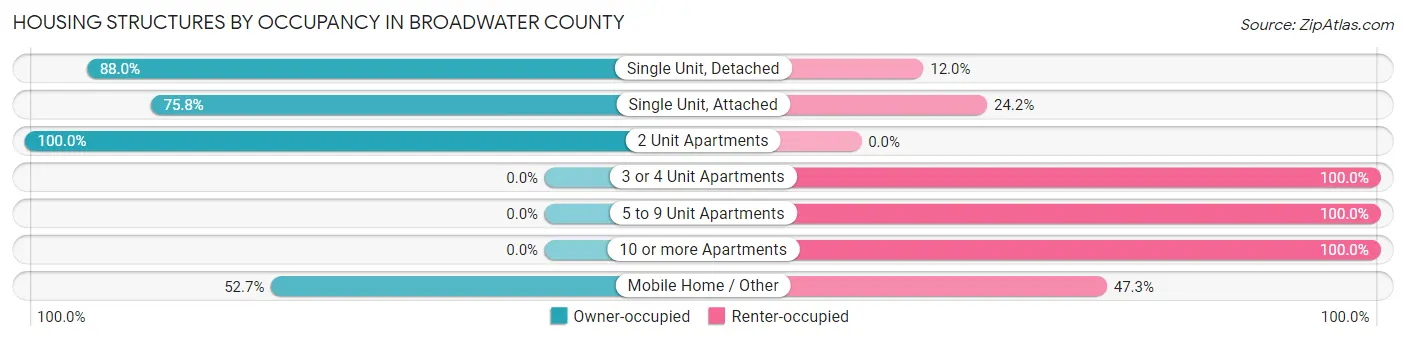
| Structure Type | Owner-occupied | Renter-occupied |
| Single Unit, Detached | 2,208 (88.0%) | 300 (12.0%) |
| Single Unit, Attached | 25 (75.8%) | 8 (24.2%) |
| 2 Unit Apartments | 6 (100.0%) | 0 (0.0%) |
| 3 or 4 Unit Apartments | 0 (0.0%) | 23 (100.0%) |
| 5 to 9 Unit Apartments | 0 (0.0%) | 8 (100.0%) |
| 10 or more Apartments | 0 (0.0%) | 17 (100.0%) |
| Mobile Home / Other | 146 (52.7%) | 131 (47.3%) |
| Total | 2,385 (83.0%) | 487 (17.0%) |
Housing Structures by Number of Rooms in Broadwater County
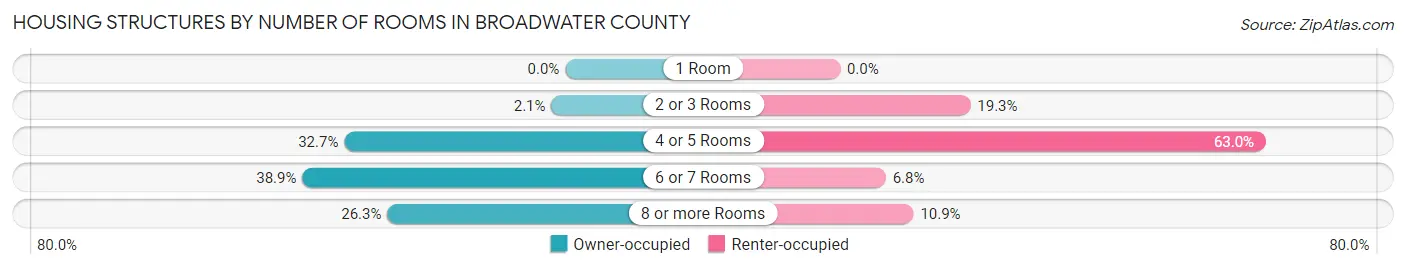
| Number of Rooms | Owner-occupied | Renter-occupied |
| 1 Room | 0 (0.0%) | 0 (0.0%) |
| 2 or 3 Rooms | 49 (2.1%) | 94 (19.3%) |
| 4 or 5 Rooms | 780 (32.7%) | 307 (63.0%) |
| 6 or 7 Rooms | 928 (38.9%) | 33 (6.8%) |
| 8 or more Rooms | 628 (26.3%) | 53 (10.9%) |
| Total | 2,385 (100.0%) | 487 (100.0%) |
Housing Structure by Heating Type in Broadwater County
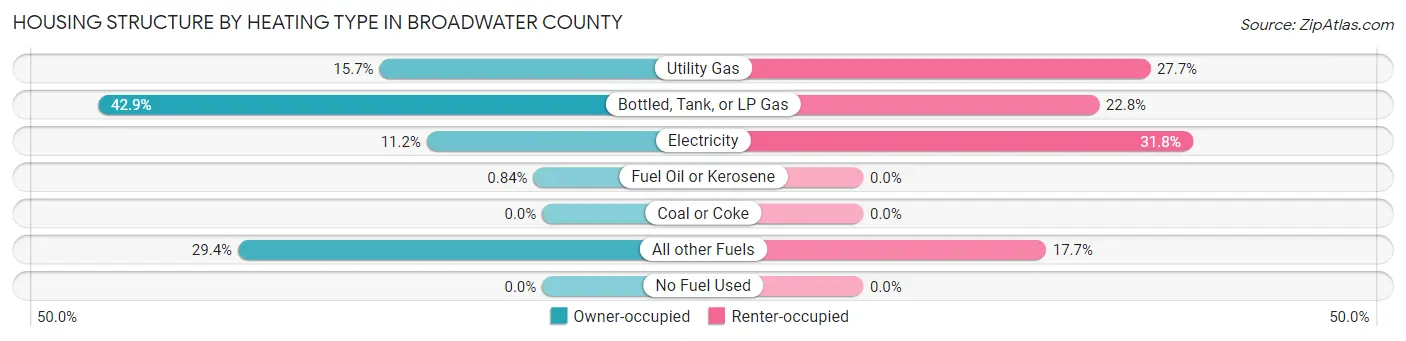
| Heating Type | Owner-occupied | Renter-occupied |
| Utility Gas | 375 (15.7%) | 135 (27.7%) |
| Bottled, Tank, or LP Gas | 1,023 (42.9%) | 111 (22.8%) |
| Electricity | 266 (11.2%) | 155 (31.8%) |
| Fuel Oil or Kerosene | 20 (0.8%) | 0 (0.0%) |
| Coal or Coke | 0 (0.0%) | 0 (0.0%) |
| All other Fuels | 701 (29.4%) | 86 (17.7%) |
| No Fuel Used | 0 (0.0%) | 0 (0.0%) |
| Total | 2,385 (100.0%) | 487 (100.0%) |
Household Vehicle Usage in Broadwater County
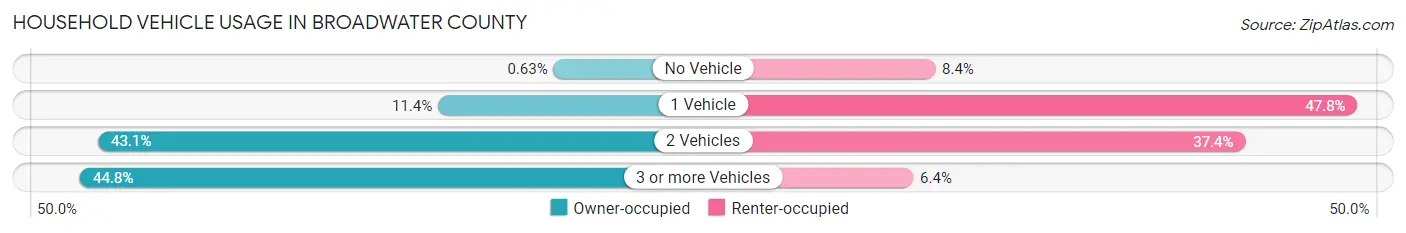
| Vehicles per Household | Owner-occupied | Renter-occupied |
| No Vehicle | 15 (0.6%) | 41 (8.4%) |
| 1 Vehicle | 272 (11.4%) | 233 (47.8%) |
| 2 Vehicles | 1,029 (43.1%) | 182 (37.4%) |
| 3 or more Vehicles | 1,069 (44.8%) | 31 (6.4%) |
| Total | 2,385 (100.0%) | 487 (100.0%) |
Real Estate & Mortgages in Broadwater County
Real Estate and Mortgage Overview in Broadwater County
| Characteristic | Without Mortgage | With Mortgage |
| Housing Units | 1,034 | 1,351 |
| Median Property Value | $326,100 | $348,800 |
| Median Household Income | $38,611 | $245 |
| Monthly Housing Costs | $523 | $125 |
| Real Estate Taxes | $2,050 | $33 |
Property Value by Mortgage Status in Broadwater County
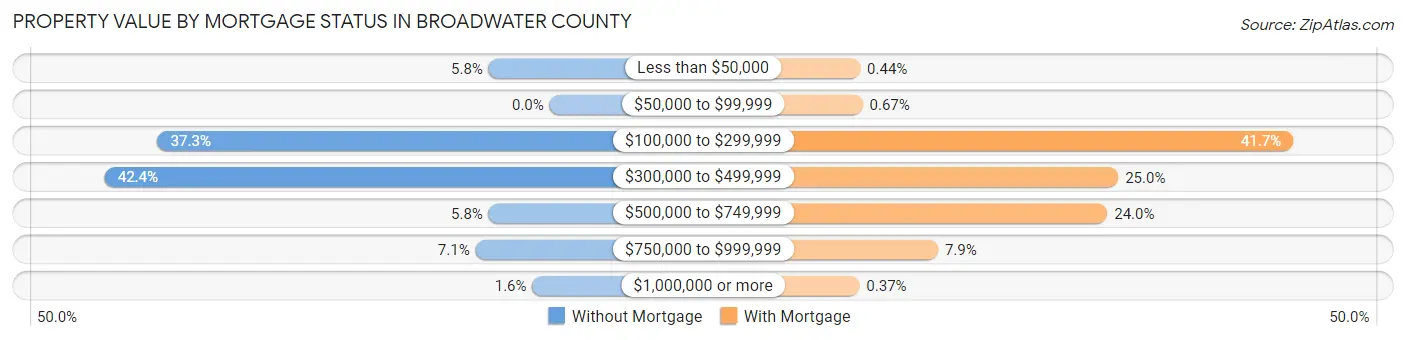
| Property Value | Without Mortgage | With Mortgage |
| Less than $50,000 | 60 (5.8%) | 6 (0.4%) |
| $50,000 to $99,999 | 0 (0.0%) | 9 (0.7%) |
| $100,000 to $299,999 | 386 (37.3%) | 563 (41.7%) |
| $300,000 to $499,999 | 438 (42.4%) | 338 (25.0%) |
| $500,000 to $749,999 | 60 (5.8%) | 324 (24.0%) |
| $750,000 to $999,999 | 73 (7.1%) | 106 (7.9%) |
| $1,000,000 or more | 17 (1.6%) | 5 (0.4%) |
| Total | 1,034 (100.0%) | 1,351 (100.0%) |
Household Income by Mortgage Status in Broadwater County
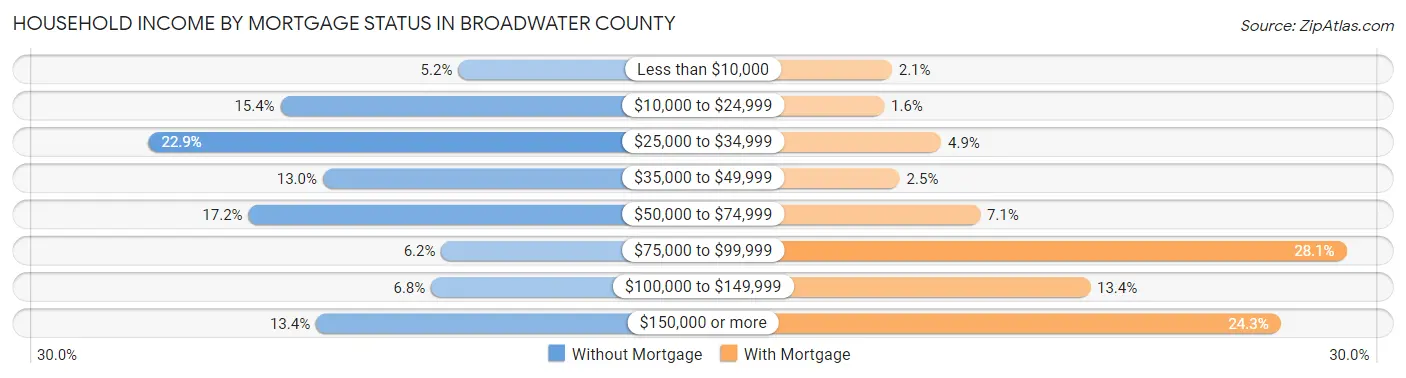
| Household Income | Without Mortgage | With Mortgage |
| Less than $10,000 | 54 (5.2%) | 28 (2.1%) |
| $10,000 to $24,999 | 159 (15.4%) | 22 (1.6%) |
| $25,000 to $34,999 | 237 (22.9%) | 66 (4.9%) |
| $35,000 to $49,999 | 134 (13.0%) | 34 (2.5%) |
| $50,000 to $74,999 | 178 (17.2%) | 96 (7.1%) |
| $75,000 to $99,999 | 64 (6.2%) | 379 (28.1%) |
| $100,000 to $149,999 | 70 (6.8%) | 181 (13.4%) |
| $150,000 or more | 138 (13.4%) | 328 (24.3%) |
| Total | 1,034 (100.0%) | 1,351 (100.0%) |
Property Value to Household Income Ratio in Broadwater County
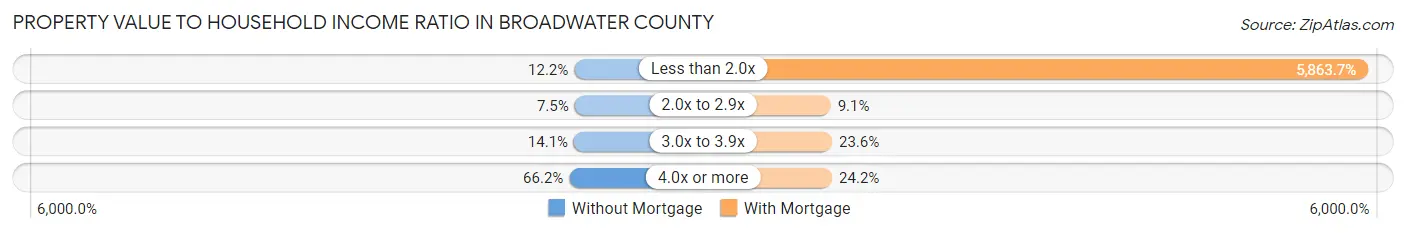
| Value-to-Income Ratio | Without Mortgage | With Mortgage |
| Less than 2.0x | 126 (12.2%) | 79,219 (5,863.7%) |
| 2.0x to 2.9x | 78 (7.5%) | 123 (9.1%) |
| 3.0x to 3.9x | 146 (14.1%) | 319 (23.6%) |
| 4.0x or more | 684 (66.1%) | 327 (24.2%) |
| Total | 1,034 (100.0%) | 1,351 (100.0%) |
Real Estate Taxes by Mortgage Status in Broadwater County
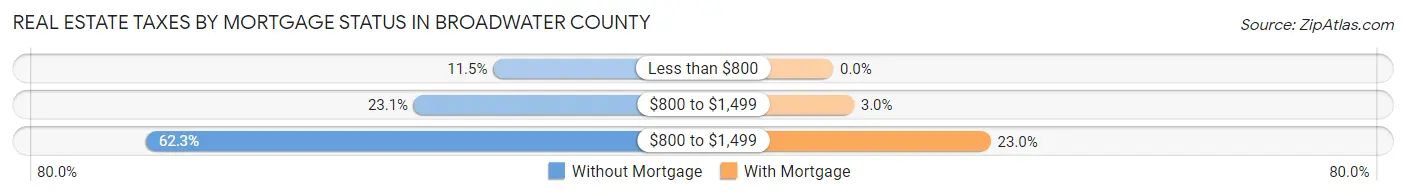
| Property Taxes | Without Mortgage | With Mortgage |
| Less than $800 | 119 (11.5%) | 0 (0.0%) |
| $800 to $1,499 | 239 (23.1%) | 41 (3.0%) |
| $800 to $1,499 | 644 (62.3%) | 311 (23.0%) |
| Total | 1,034 (100.0%) | 1,351 (100.0%) |
Health & Disability in Broadwater County
Health Insurance Coverage by Age in Broadwater County
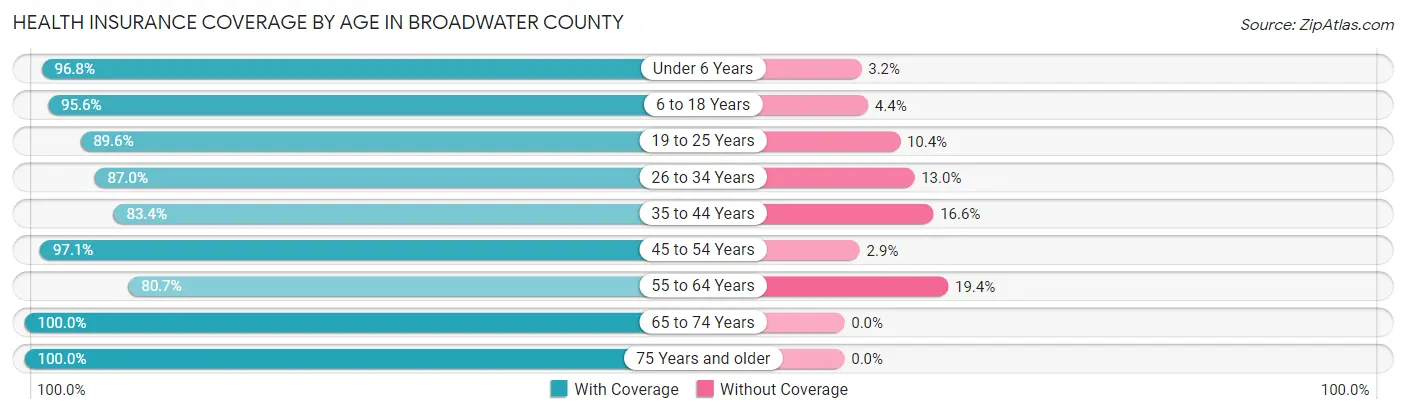
| Age Bracket | With Coverage | Without Coverage |
| Under 6 Years | 367 (96.8%) | 12 (3.2%) |
| 6 to 18 Years | 957 (95.6%) | 44 (4.4%) |
| 19 to 25 Years | 466 (89.6%) | 54 (10.4%) |
| 26 to 34 Years | 507 (87.0%) | 76 (13.0%) |
| 35 to 44 Years | 624 (83.4%) | 124 (16.6%) |
| 45 to 54 Years | 815 (97.1%) | 24 (2.9%) |
| 55 to 64 Years | 946 (80.6%) | 227 (19.4%) |
| 65 to 74 Years | 1,055 (100.0%) | 0 (0.0%) |
| 75 Years and older | 622 (100.0%) | 0 (0.0%) |
| Total | 6,359 (91.9%) | 561 (8.1%) |
Health Insurance Coverage by Citizenship Status in Broadwater County
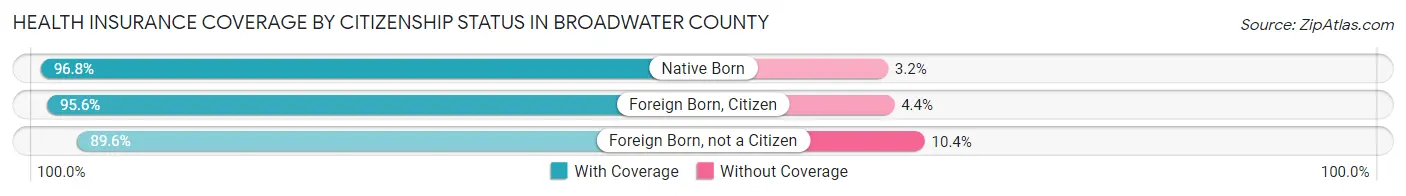
| Citizenship Status | With Coverage | Without Coverage |
| Native Born | 367 (96.8%) | 12 (3.2%) |
| Foreign Born, Citizen | 957 (95.6%) | 44 (4.4%) |
| Foreign Born, not a Citizen | 466 (89.6%) | 54 (10.4%) |
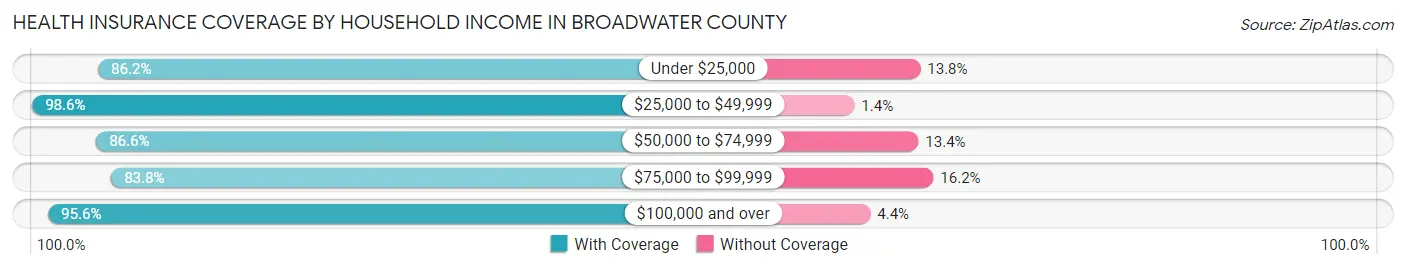
Health Insurance Coverage by Household Income in Broadwater County
| Household Income | With Coverage | Without Coverage |
| Under $25,000 | 707 (86.2%) | 113 (13.8%) |
| $25,000 to $49,999 | 1,240 (98.6%) | 18 (1.4%) |
| $50,000 to $74,999 | 1,213 (86.6%) | 188 (13.4%) |
| $75,000 to $99,999 | 640 (83.8%) | 124 (16.2%) |
| $100,000 and over | 2,554 (95.6%) | 118 (4.4%) |
Public vs Private Health Insurance Coverage by Age in Broadwater County
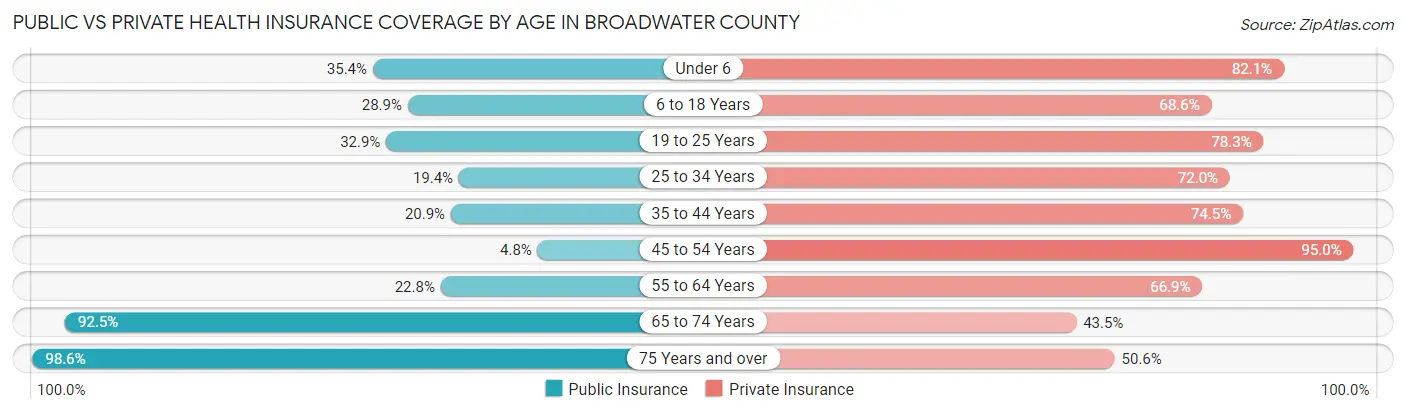
| Age Bracket | Public Insurance | Private Insurance |
| Under 6 | 134 (35.4%) | 311 (82.1%) |
| 6 to 18 Years | 289 (28.9%) | 687 (68.6%) |
| 19 to 25 Years | 171 (32.9%) | 407 (78.3%) |
| 25 to 34 Years | 113 (19.4%) | 420 (72.0%) |
| 35 to 44 Years | 156 (20.9%) | 557 (74.5%) |
| 45 to 54 Years | 40 (4.8%) | 797 (95.0%) |
| 55 to 64 Years | 267 (22.8%) | 785 (66.9%) |
| 65 to 74 Years | 976 (92.5%) | 459 (43.5%) |
| 75 Years and over | 613 (98.6%) | 315 (50.6%) |
| Total | 2,759 (39.9%) | 4,738 (68.5%) |
Disability Status by Sex by Age in Broadwater County
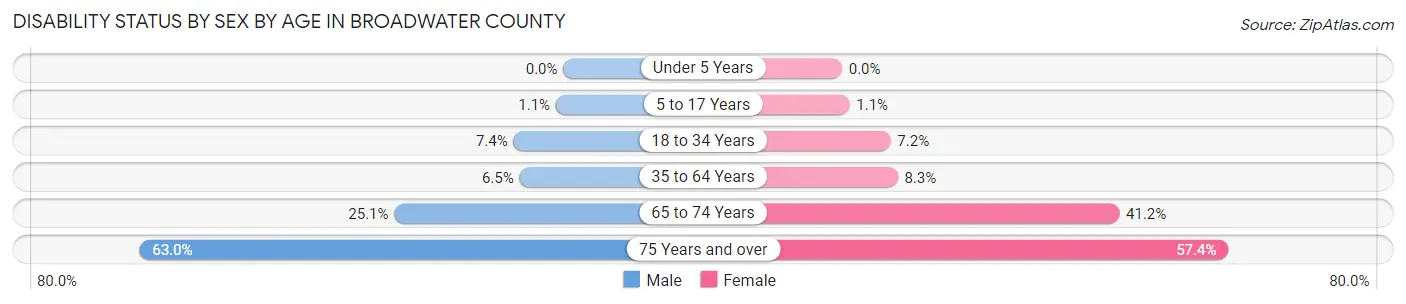
| Age Bracket | Male | Female |
| Under 5 Years | 0 (0.0%) | 0 (0.0%) |
| 5 to 17 Years | 5 (1.1%) | 6 (1.1%) |
| 18 to 34 Years | 48 (7.4%) | 38 (7.2%) |
| 35 to 64 Years | 92 (6.5%) | 111 (8.3%) |
| 65 to 74 Years | 141 (25.1%) | 203 (41.2%) |
| 75 Years and over | 204 (63.0%) | 171 (57.4%) |
Disability Class by Sex by Age in Broadwater County
Disability Class: Hearing Difficulty
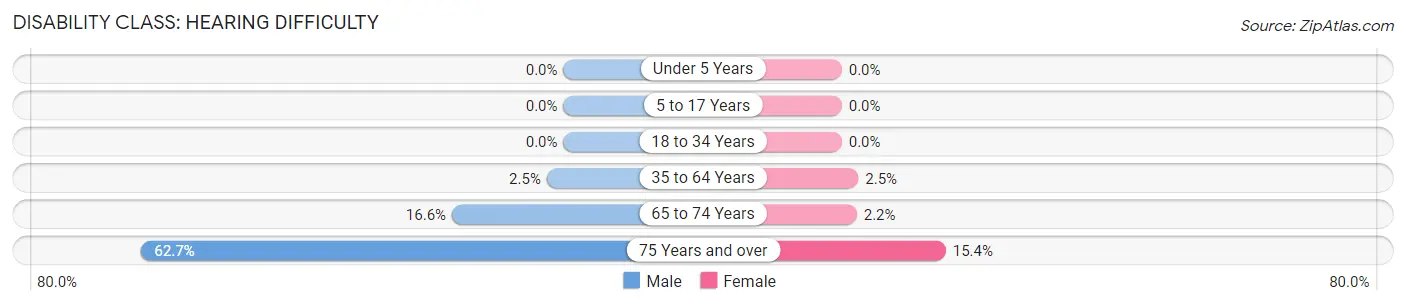
| Age Bracket | Male | Female |
| Under 5 Years | 0 (0.0%) | 0 (0.0%) |
| 5 to 17 Years | 0 (0.0%) | 0 (0.0%) |
| 18 to 34 Years | 0 (0.0%) | 0 (0.0%) |
| 35 to 64 Years | 35 (2.5%) | 33 (2.5%) |
| 65 to 74 Years | 93 (16.6%) | 11 (2.2%) |
| 75 Years and over | 203 (62.6%) | 46 (15.4%) |
Disability Class: Vision Difficulty
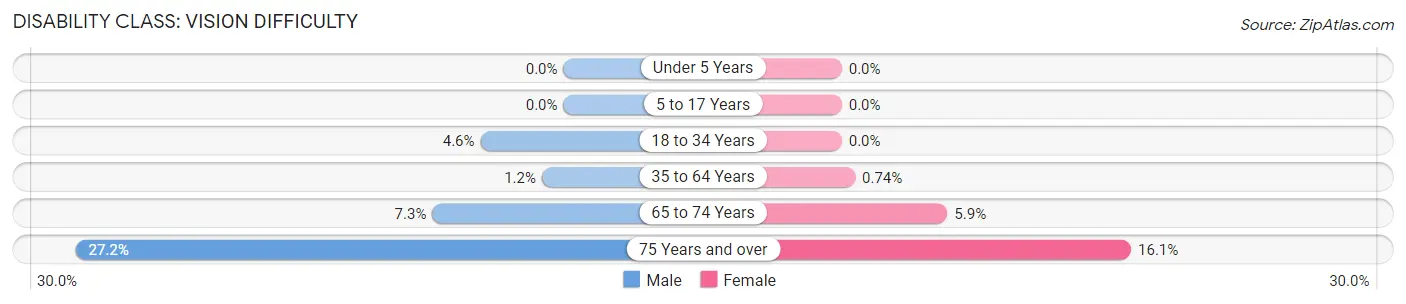
| Age Bracket | Male | Female |
| Under 5 Years | 0 (0.0%) | 0 (0.0%) |
| 5 to 17 Years | 0 (0.0%) | 0 (0.0%) |
| 18 to 34 Years | 30 (4.6%) | 0 (0.0%) |
| 35 to 64 Years | 17 (1.2%) | 10 (0.7%) |
| 65 to 74 Years | 41 (7.3%) | 29 (5.9%) |
| 75 Years and over | 88 (27.2%) | 48 (16.1%) |
Disability Class: Cognitive Difficulty
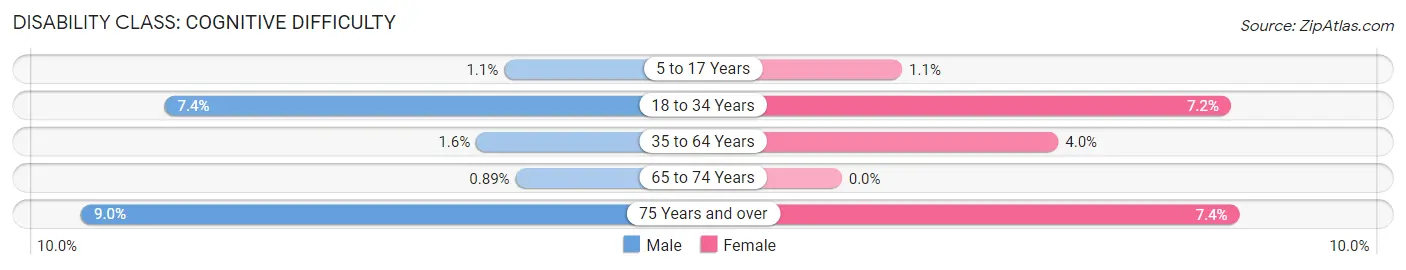
| Age Bracket | Male | Female |
| 5 to 17 Years | 5 (1.1%) | 6 (1.1%) |
| 18 to 34 Years | 48 (7.4%) | 38 (7.2%) |
| 35 to 64 Years | 23 (1.6%) | 54 (4.0%) |
| 65 to 74 Years | 5 (0.9%) | 0 (0.0%) |
| 75 Years and over | 29 (8.9%) | 22 (7.4%) |
Disability Class: Ambulatory Difficulty
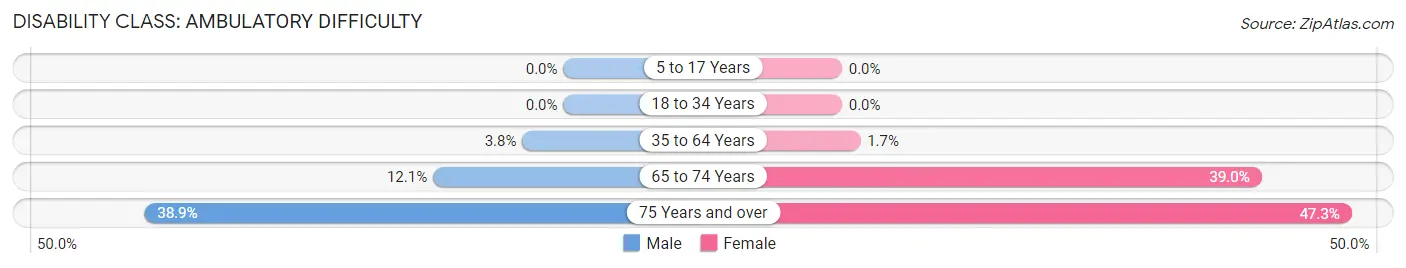
| Age Bracket | Male | Female |
| 5 to 17 Years | 0 (0.0%) | 0 (0.0%) |
| 18 to 34 Years | 0 (0.0%) | 0 (0.0%) |
| 35 to 64 Years | 54 (3.8%) | 23 (1.7%) |
| 65 to 74 Years | 68 (12.1%) | 192 (39.0%) |
| 75 Years and over | 126 (38.9%) | 141 (47.3%) |
Disability Class: Self-Care Difficulty
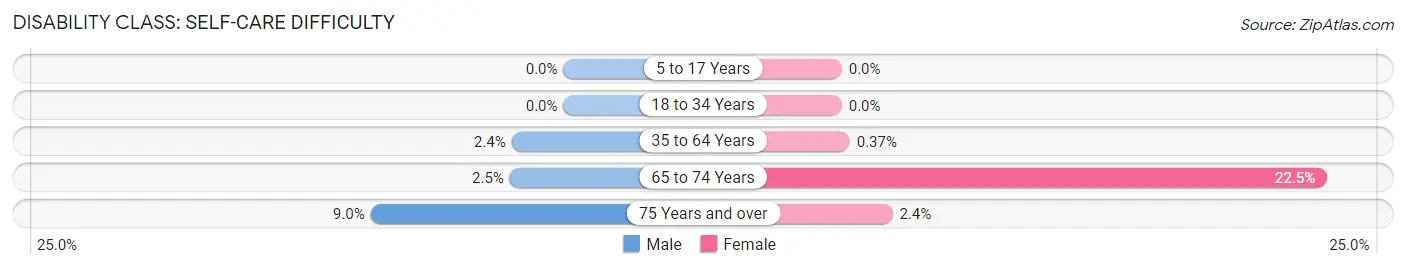
| Age Bracket | Male | Female |
| 5 to 17 Years | 0 (0.0%) | 0 (0.0%) |
| 18 to 34 Years | 0 (0.0%) | 0 (0.0%) |
| 35 to 64 Years | 34 (2.4%) | 5 (0.4%) |
| 65 to 74 Years | 14 (2.5%) | 111 (22.5%) |
| 75 Years and over | 29 (8.9%) | 7 (2.4%) |
Technology Access in Broadwater County
Computing Device Access in Broadwater County
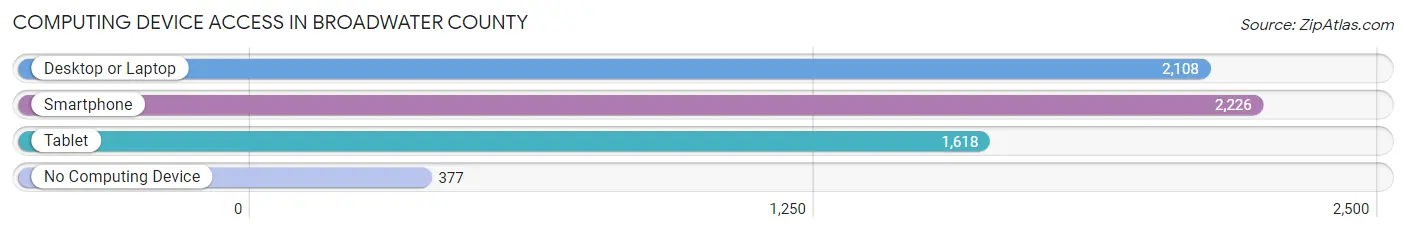
| Device Type | # Households | % Households |
| Desktop or Laptop | 2,108 | 73.4% |
| Smartphone | 2,226 | 77.5% |
| Tablet | 1,618 | 56.3% |
| No Computing Device | 377 | 13.1% |
| Total | 2,872 | 100.0% |
Internet Access in Broadwater County
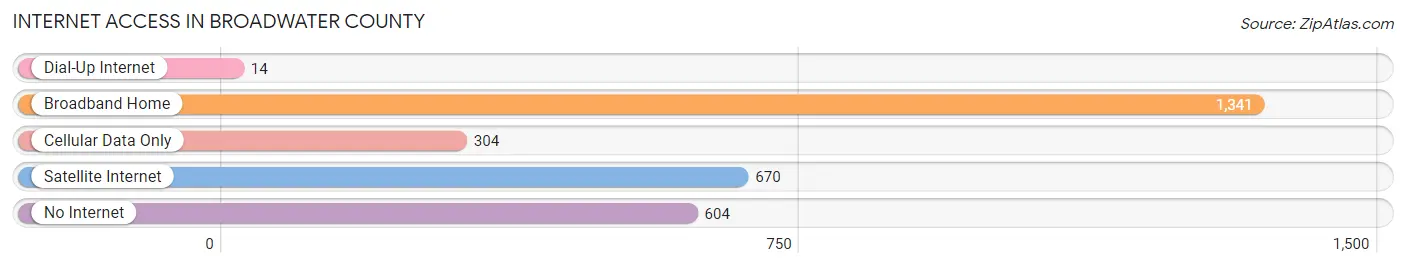
| Internet Type | # Households | % Households |
| Dial-Up Internet | 14 | 0.5% |
| Broadband Home | 1,341 | 46.7% |
| Cellular Data Only | 304 | 10.6% |
| Satellite Internet | 670 | 23.3% |
| No Internet | 604 | 21.0% |
| Total | 2,872 | 100.0% |
Broadwater County Summary
Broadwater County is located in the state of Montana, in the western United States. It is bordered by Jefferson County to the north, Lewis and Clark County to the east, Meagher County to the south, and Gallatin County to the west. The county seat is Townsend, and the largest city is Helena, the state capital. The county has a total area of 1,845 square miles, of which 1,843 square miles is land and 2 square miles is water.
History
The area that is now Broadwater County was first inhabited by Native American tribes, including the Blackfeet, Crow, and Salish. The first European settlers arrived in the area in the early 1800s, and the county was officially established in 1865. The county was named after William Broadwater, a prominent early settler.
The county was initially an agricultural area, with wheat, barley, and oats being the main crops. In the late 1800s, gold was discovered in the area, and mining became an important industry. The county also became a popular tourist destination, with many people visiting the area to hunt, fish, and enjoy the scenery.
Geography
Broadwater County is located in the western part of Montana, in the Rocky Mountain region. The county is mostly mountainous, with the highest point being Mount Jefferson, which has an elevation of 8,945 feet. The county is home to several rivers, including the Missouri, Madison, and Jefferson Rivers. The county also contains several lakes, including Canyon Ferry Lake, Hauser Lake, and Holter Lake.
The county has a semi-arid climate, with hot summers and cold winters. The average annual temperature is 44 degrees Fahrenheit, and the average annual precipitation is 13 inches.
Economy
The economy of Broadwater County is largely based on agriculture, tourism, and mining. The county is home to several large farms, which produce wheat, barley, oats, and other crops. Tourism is also an important part of the economy, with many people visiting the area to hunt, fish, and enjoy the scenery. Mining is also an important industry in the county, with gold, silver, and other minerals being mined in the area.
Demographics
As of the 2010 census, the population of Broadwater County was 7,845. The population is mostly white (94.3%), with small percentages of Native American (2.2%), African American (0.7%), and Asian (0.4%) populations. The median household income is $41,945, and the median home value is $179,400. The unemployment rate is 4.2%.
Conclusion
Broadwater County is a rural county located in the western part of Montana. The county has a long history, and its economy is largely based on agriculture, tourism, and mining. The population of the county is mostly white, and the median household income is $41,945. The county is home to several rivers, lakes, and mountains, making it a popular tourist destination.
Common Questions
What is the Total Population of Broadwater County?
Total Population of Broadwater County is 6,977.
What is the Total Male Population of Broadwater County?
Total Male Population of Broadwater County is 3,607.
What is the Total Female Population of Broadwater County?
Total Female Population of Broadwater County is 3,370.
What is the Ratio of Males per 100 Females in Broadwater County?
There are 107.03 Males per 100 Females in Broadwater County.
What is the Ratio of Females per 100 Males in Broadwater County?
There are 93.43 Females per 100 Males in Broadwater County.
What is the Median Population Age in Broadwater County?
Median Population Age in Broadwater County is 47.4 Years.
What is the Average Family Size in Broadwater County
Average Family Size in Broadwater County is 2.9 People.
What is the Average Household Size in Broadwater County
Average Household Size in Broadwater County is 2.4 People.
What is Per Capita Income in Broadwater County?
Per Capita income in Broadwater County is $34,956.
What is the Median Family Income in Broadwater County?
Median Family Income in Broadwater County is $77,206.
What is the Median Household income in Broadwater County?
Median Household Income in Broadwater County is $61,679.
What is Income or Wage Gap in Broadwater County?
Income or Wage Gap in Broadwater County is 29.5%.
Women in Broadwater County earn 70.5 cents for every dollar earned by a man.
What is Family Income Deficit in Broadwater County?
Family Income Deficit in Broadwater County is $9,114.
Families that are below poverty line in Broadwater County earn $9,114 less on average than the poverty threshold level.
What is Inequality or Gini Index in Broadwater County?
Inequality or Gini Index in Broadwater County is 0.41.
How Large is the Labor Force in Broadwater County?
There are 3,467 People in the Labor Forcein in Broadwater County.
What is the Percentage of People in the Labor Force in Broadwater County?
58.8% of People are in the Labor Force in Broadwater County.
What is the Unemployment Rate in Broadwater County?
Unemployment Rate in Broadwater County is 8.2%.