Zip Codes with the Highest Percentage of Population Employed in Community & Social Service in Independence, MO
RELATED REPORTS & OPTIONS
Community & Social Service
Independence
Compare Zip Codes
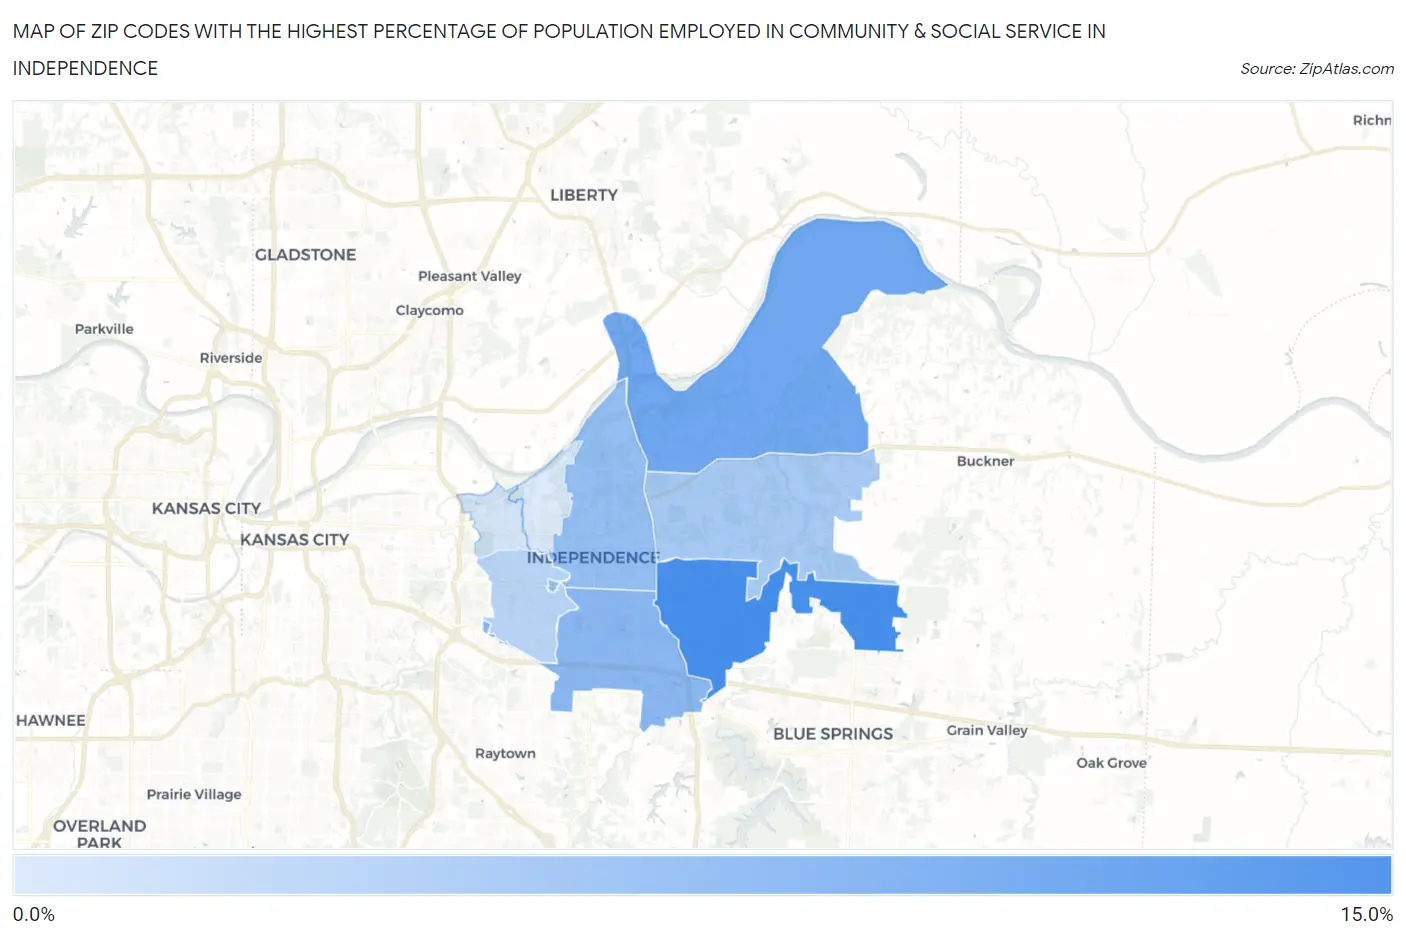
Map of Zip Codes with the Highest Percentage of Population Employed in Community & Social Service in Independence
0.0%
15.0%
Zip Codes with the Highest Percentage of Population Employed in Community & Social Service in Independence, MO
| Zip Code | % Employed | vs State | vs National | |
| 1. | 64057 | 10.9% | 10.6%(+0.346)#281 | 11.2%(-0.302)#11,867 |
| 2. | 64058 | 9.2% | 10.6%(-1.41)#415 | 11.2%(-2.06)#16,390 |
| 3. | 64055 | 8.1% | 10.6%(-2.46)#496 | 11.2%(-3.11)#19,260 |
| 4. | 64050 | 7.7% | 10.6%(-2.87)#525 | 11.2%(-3.51)#20,364 |
| 5. | 64056 | 6.9% | 10.6%(-3.63)#596 | 11.2%(-4.28)#22,293 |
| 6. | 64052 | 6.2% | 10.6%(-4.38)#659 | 11.2%(-5.03)#23,979 |
| 7. | 64053 | 5.0% | 10.6%(-5.53)#752 | 11.2%(-6.17)#26,129 |
| 8. | 64054 | 4.8% | 10.6%(-5.76)#766 | 11.2%(-6.40)#26,497 |
1
Common Questions
What are the Top 5 Zip Codes with the Highest Percentage of Population Employed in Community & Social Service in Independence, MO?
Top 5 Zip Codes with the Highest Percentage of Population Employed in Community & Social Service in Independence, MO are:
What zip code has the Highest Percentage of Population Employed in Community & Social Service in Independence, MO?
64057 has the Highest Percentage of Population Employed in Community & Social Service in Independence, MO with 10.9%.
What is the Percentage of Population Employed in Community & Social Service in Independence, MO?
Percentage of Population Employed in Community & Social Service in Independence is 7.7%.
What is the Percentage of Population Employed in Community & Social Service in Missouri?
Percentage of Population Employed in Community & Social Service in Missouri is 10.6%.
What is the Percentage of Population Employed in Community & Social Service in the United States?
Percentage of Population Employed in Community & Social Service in the United States is 11.2%.