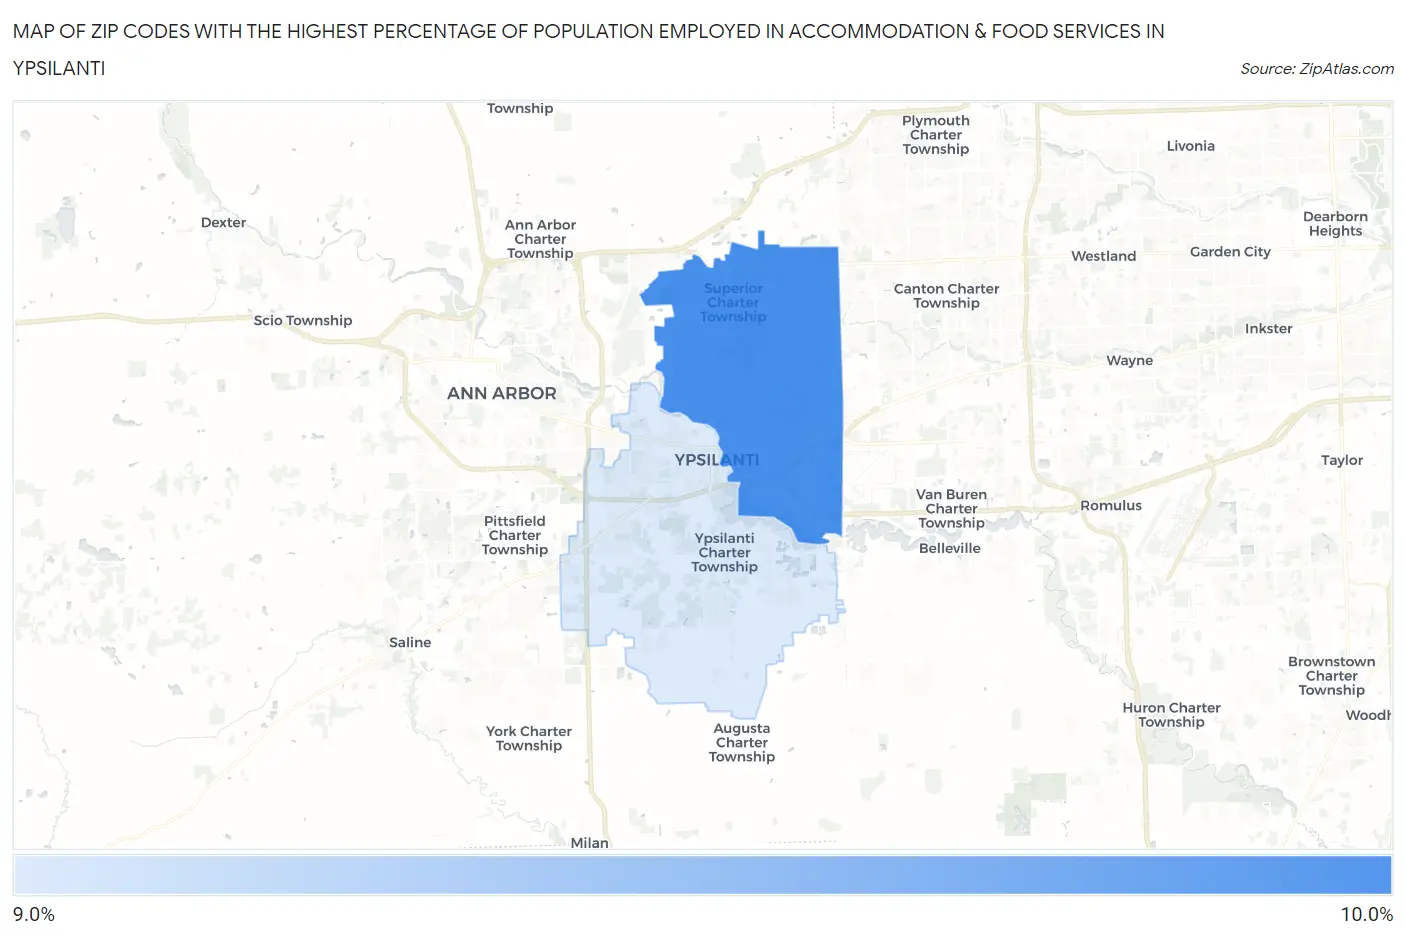
Zip Codes with the Highest Percentage of Population Employed in Accommodation & Food Services in Ypsilanti, MI
RELATED REPORTS & OPTIONS
Accommodation & Food Services
Ypsilanti
Compare Zip Codes
Map of Zip Codes with the Highest Percentage of Population Employed in Accommodation & Food Services in Ypsilanti
0.0%
10.0%
Zip Codes with the Highest Percentage of Population Employed in Accommodation & Food Services in Ypsilanti, MI
| Zip Code | % Employed | vs State | vs National | |
| 1. | 48198 | 9.4% | 7.1%(+2.32)#183 | 6.9%(+2.53)#5,337 |
| 2. | 48197 | 9.0% | 7.1%(+1.96)#209 | 6.9%(+2.16)#5,892 |
1
Common Questions
What are the Top Zip Codes with the Highest Percentage of Population Employed in Accommodation & Food Services in Ypsilanti, MI?
Top Zip Codes with the Highest Percentage of Population Employed in Accommodation & Food Services in Ypsilanti, MI are:
What zip code has the Highest Percentage of Population Employed in Accommodation & Food Services in Ypsilanti, MI?
48198 has the Highest Percentage of Population Employed in Accommodation & Food Services in Ypsilanti, MI with 9.4%.
What is the Percentage of Population Employed in Accommodation & Food Services in Ypsilanti, MI?
Percentage of Population Employed in Accommodation & Food Services in Ypsilanti is 12.8%.
What is the Percentage of Population Employed in Accommodation & Food Services in Michigan?
Percentage of Population Employed in Accommodation & Food Services in Michigan is 7.1%.
What is the Percentage of Population Employed in Accommodation & Food Services in the United States?
Percentage of Population Employed in Accommodation & Food Services in the United States is 6.9%.