Zip Codes with the Highest Percentage of Population Employed in Accommodation & Food Services in Detroit, MI
RELATED REPORTS & OPTIONS
Accommodation & Food Services
Detroit
Compare Zip Codes
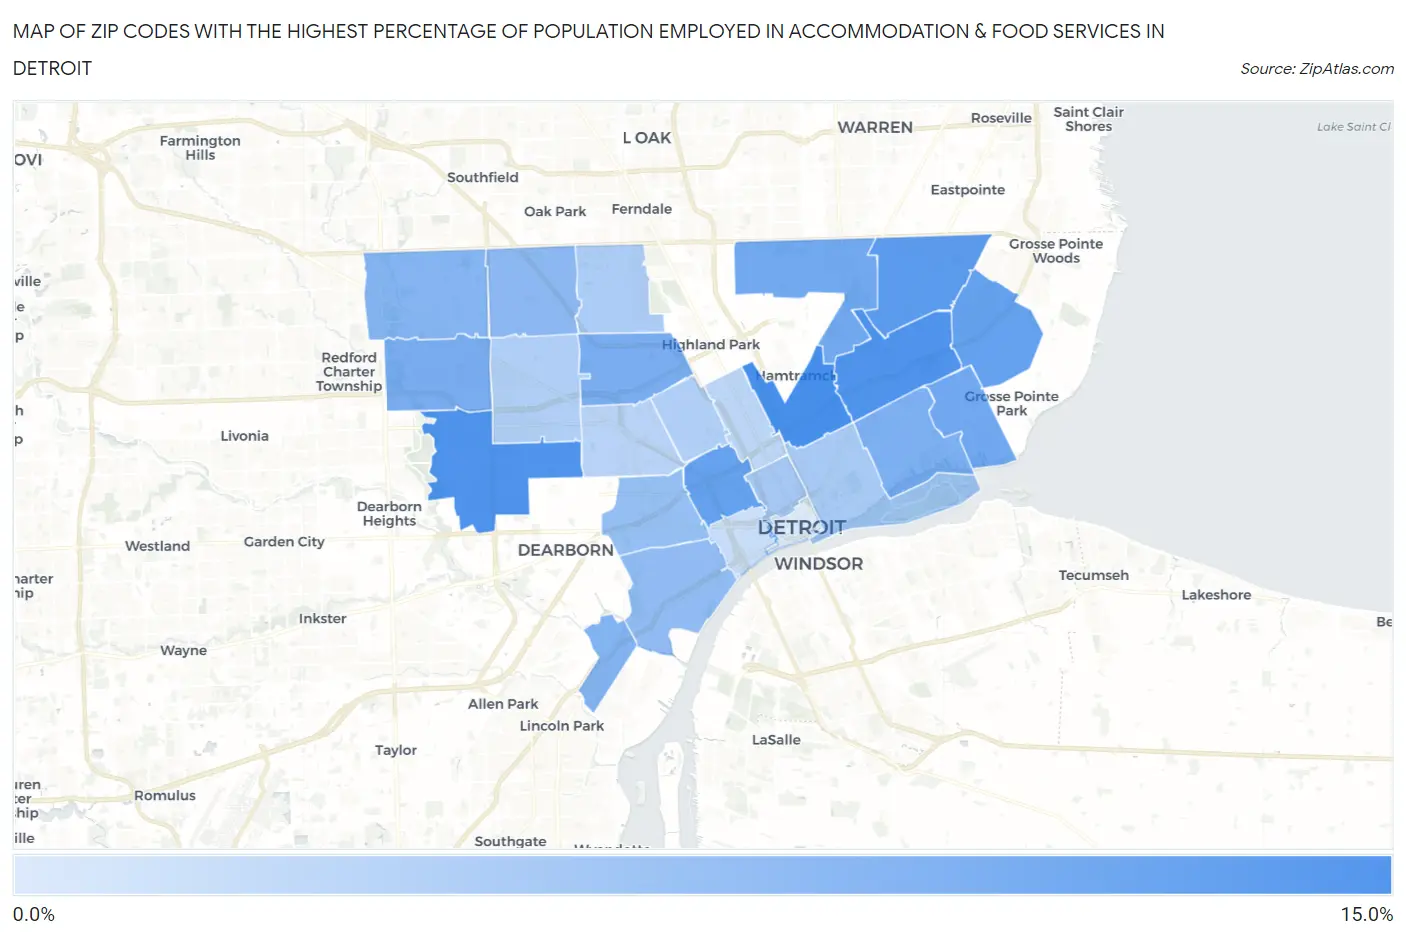
Map of Zip Codes with the Highest Percentage of Population Employed in Accommodation & Food Services in Detroit
0.0%
15.0%
Zip Codes with the Highest Percentage of Population Employed in Accommodation & Food Services in Detroit, MI
| Zip Code | % Employed | vs State | vs National | |
| 1. | 48211 | 12.5% | 7.1%(+5.45)#67 | 6.9%(+5.65)#2,572 |
| 2. | 48213 | 12.2% | 7.1%(+5.10)#73 | 6.9%(+5.30)#2,727 |
| 3. | 48228 | 12.1% | 7.1%(+4.98)#75 | 6.9%(+5.18)#2,794 |
| 4. | 48205 | 11.5% | 7.1%(+4.45)#89 | 6.9%(+4.65)#3,141 |
| 5. | 48224 | 10.8% | 7.1%(+3.70)#105 | 6.9%(+3.91)#3,731 |
| 6. | 48208 | 10.8% | 7.1%(+3.67)#107 | 6.9%(+3.88)#3,749 |
| 7. | 48215 | 10.1% | 7.1%(+3.00)#135 | 6.9%(+3.20)#4,428 |
| 8. | 48234 | 9.9% | 7.1%(+2.86)#147 | 6.9%(+3.07)#4,603 |
| 9. | 48238 | 9.7% | 7.1%(+2.60)#165 | 6.9%(+2.80)#4,950 |
| 10. | 48223 | 9.7% | 7.1%(+2.57)#166 | 6.9%(+2.77)#4,990 |
| 11. | 48214 | 9.5% | 7.1%(+2.43)#175 | 6.9%(+2.63)#5,198 |
| 12. | 48217 | 9.1% | 7.1%(+1.99)#207 | 6.9%(+2.19)#5,844 |
| 13. | 48219 | 9.0% | 7.1%(+1.90)#215 | 6.9%(+2.10)#5,980 |
| 14. | 48235 | 8.6% | 7.1%(+1.49)#242 | 6.9%(+1.69)#6,683 |
| 15. | 48209 | 8.3% | 7.1%(+1.20)#262 | 6.9%(+1.41)#7,239 |
| 16. | 48210 | 8.0% | 7.1%(+0.945)#274 | 6.9%(+1.15)#7,763 |
| 17. | 48201 | 7.1% | 7.1%(+0.061)#376 | 6.9%(+0.263)#9,934 |
| 18. | 48207 | 7.1% | 7.1%(-0.032)#390 | 6.9%(+0.171)#10,172 |
| 19. | 48221 | 6.8% | 7.1%(-0.294)#423 | 6.9%(-0.091)#10,916 |
| 20. | 48206 | 6.6% | 7.1%(-0.513)#447 | 6.9%(-0.311)#11,613 |
| 21. | 48227 | 6.6% | 7.1%(-0.523)#449 | 6.9%(-0.320)#11,649 |
| 22. | 48204 | 6.2% | 7.1%(-0.901)#501 | 6.9%(-0.698)#12,856 |
| 23. | 48202 | 5.9% | 7.1%(-1.22)#549 | 6.9%(-1.02)#13,903 |
| 24. | 48216 | 5.3% | 7.1%(-1.83)#630 | 6.9%(-1.63)#15,940 |
| 25. | 48226 | 4.1% | 7.1%(-2.95)#754 | 6.9%(-2.75)#19,719 |
1
Common Questions
What are the Top 10 Zip Codes with the Highest Percentage of Population Employed in Accommodation & Food Services in Detroit, MI?
Top 10 Zip Codes with the Highest Percentage of Population Employed in Accommodation & Food Services in Detroit, MI are:
What zip code has the Highest Percentage of Population Employed in Accommodation & Food Services in Detroit, MI?
48211 has the Highest Percentage of Population Employed in Accommodation & Food Services in Detroit, MI with 12.5%.
What is the Percentage of Population Employed in Accommodation & Food Services in Detroit, MI?
Percentage of Population Employed in Accommodation & Food Services in Detroit is 9.0%.
What is the Percentage of Population Employed in Accommodation & Food Services in Michigan?
Percentage of Population Employed in Accommodation & Food Services in Michigan is 7.1%.
What is the Percentage of Population Employed in Accommodation & Food Services in the United States?
Percentage of Population Employed in Accommodation & Food Services in the United States is 6.9%.