Zip Codes with the Highest Percentage of Population Employed in Real Estate, Rental & Leasing in Rockville, MD
RELATED REPORTS & OPTIONS
Real Estate, Rental & Leasing
Rockville
Compare Zip Codes
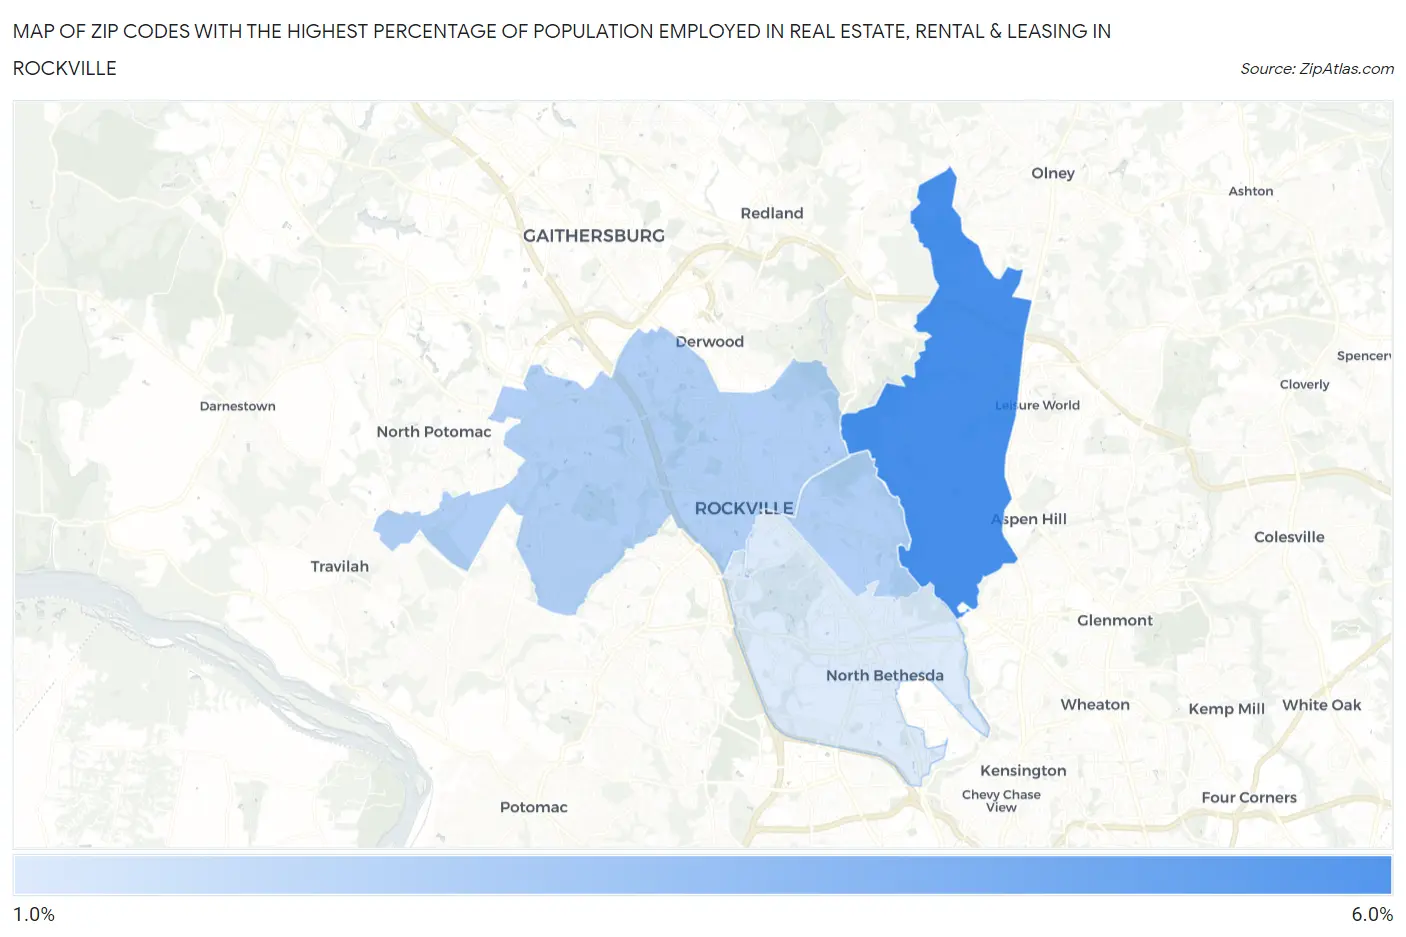
Map of Zip Codes with the Highest Percentage of Population Employed in Real Estate, Rental & Leasing in Rockville
0.0%
6.0%
Zip Codes with the Highest Percentage of Population Employed in Real Estate, Rental & Leasing in Rockville, MD
| Zip Code | % Employed | vs State | vs National | |
| 1. | 20853 | 5.2% | 2.1%(+3.10)#28 | 1.9%(+3.30)#1,291 |
| 2. | 20850 | 2.7% | 2.1%(+0.579)#114 | 1.9%(+0.778)#4,859 |
| 3. | 20851 | 2.6% | 2.1%(+0.552)#118 | 1.9%(+0.750)#4,962 |
| 4. | 20852 | 1.6% | 2.1%(-0.466)#229 | 1.9%(-0.267)#10,278 |
1
Common Questions
What are the Top 3 Zip Codes with the Highest Percentage of Population Employed in Real Estate, Rental & Leasing in Rockville, MD?
Top 3 Zip Codes with the Highest Percentage of Population Employed in Real Estate, Rental & Leasing in Rockville, MD are:
What zip code has the Highest Percentage of Population Employed in Real Estate, Rental & Leasing in Rockville, MD?
20853 has the Highest Percentage of Population Employed in Real Estate, Rental & Leasing in Rockville, MD with 5.2%.
What is the Percentage of Population Employed in Real Estate, Rental & Leasing in Rockville, MD?
Percentage of Population Employed in Real Estate, Rental & Leasing in Rockville is 2.4%.
What is the Percentage of Population Employed in Real Estate, Rental & Leasing in Maryland?
Percentage of Population Employed in Real Estate, Rental & Leasing in Maryland is 2.1%.
What is the Percentage of Population Employed in Real Estate, Rental & Leasing in the United States?
Percentage of Population Employed in Real Estate, Rental & Leasing in the United States is 1.9%.