Zip Codes with the Highest Percentage of Population Employed in Real Estate, Rental & Leasing in Hyattsville, MD
RELATED REPORTS & OPTIONS
Real Estate, Rental & Leasing
Hyattsville
Compare Zip Codes
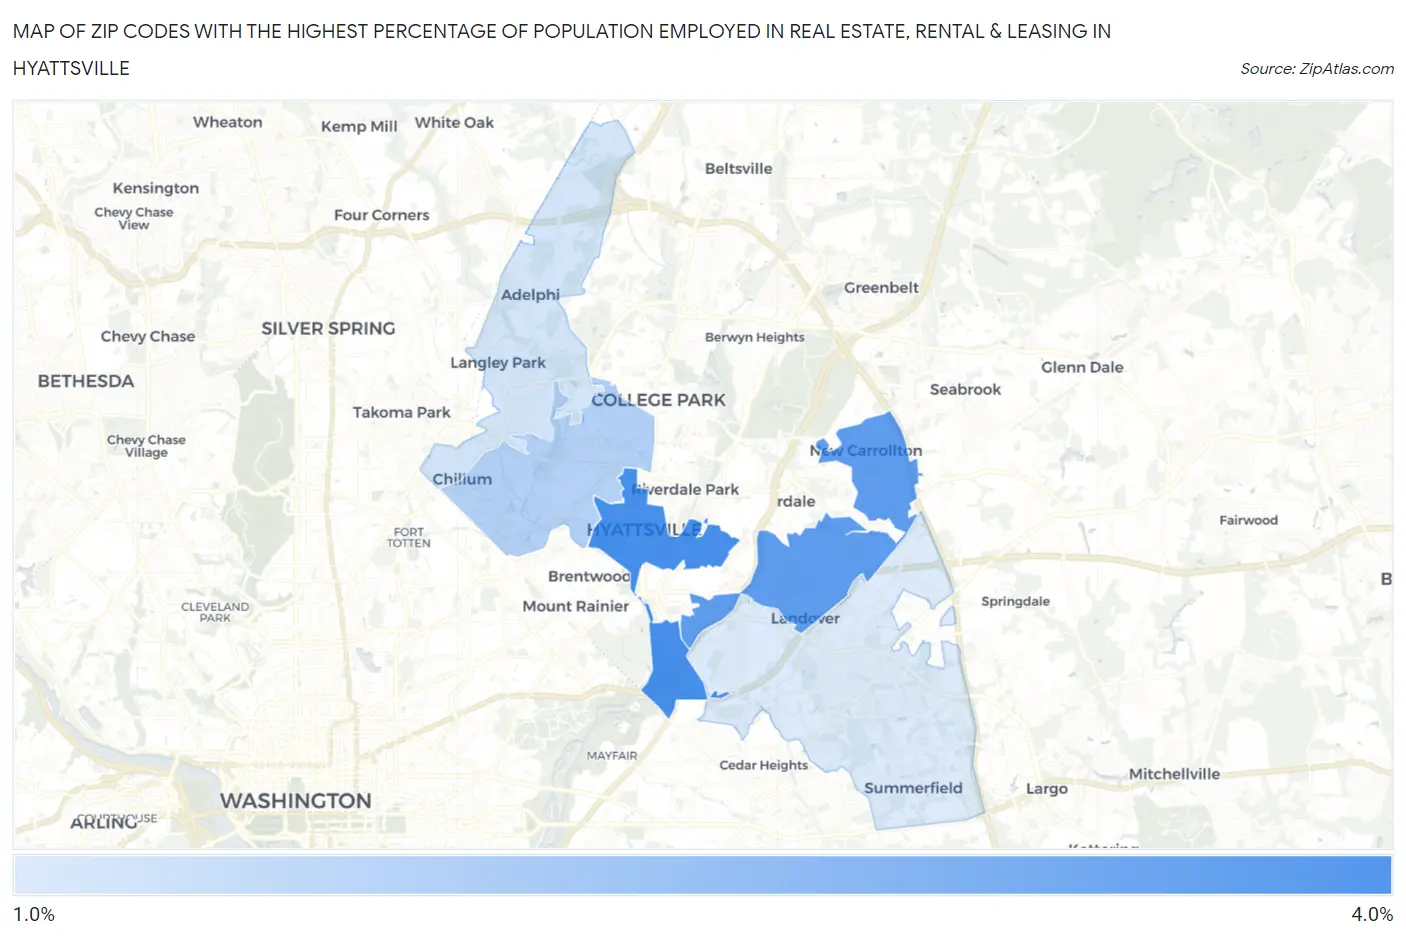
Map of Zip Codes with the Highest Percentage of Population Employed in Real Estate, Rental & Leasing in Hyattsville
0.0%
4.0%
Zip Codes with the Highest Percentage of Population Employed in Real Estate, Rental & Leasing in Hyattsville, MD
| Zip Code | % Employed | vs State | vs National | |
| 1. | 20781 | 3.3% | 2.1%(+1.19)#68 | 1.9%(+1.39)#3,262 |
| 2. | 20784 | 3.0% | 2.1%(+0.941)#89 | 1.9%(+1.14)#3,803 |
| 3. | 20782 | 2.1% | 2.1%(+0.019)#165 | 1.9%(+0.217)#7,277 |
| 4. | 20783 | 1.8% | 2.1%(-0.333)#210 | 1.9%(-0.135)#9,406 |
| 5. | 20785 | 1.7% | 2.1%(-0.439)#225 | 1.9%(-0.241)#10,116 |
1
Common Questions
What are the Top 3 Zip Codes with the Highest Percentage of Population Employed in Real Estate, Rental & Leasing in Hyattsville, MD?
Top 3 Zip Codes with the Highest Percentage of Population Employed in Real Estate, Rental & Leasing in Hyattsville, MD are:
What zip code has the Highest Percentage of Population Employed in Real Estate, Rental & Leasing in Hyattsville, MD?
20781 has the Highest Percentage of Population Employed in Real Estate, Rental & Leasing in Hyattsville, MD with 3.3%.
What is the Percentage of Population Employed in Real Estate, Rental & Leasing in Hyattsville, MD?
Percentage of Population Employed in Real Estate, Rental & Leasing in Hyattsville is 2.4%.
What is the Percentage of Population Employed in Real Estate, Rental & Leasing in Maryland?
Percentage of Population Employed in Real Estate, Rental & Leasing in Maryland is 2.1%.
What is the Percentage of Population Employed in Real Estate, Rental & Leasing in the United States?
Percentage of Population Employed in Real Estate, Rental & Leasing in the United States is 1.9%.