Zip Codes with the Highest Percentage of Population Employed in Accommodation & Food Services in Rockville, MD
RELATED REPORTS & OPTIONS
Accommodation & Food Services
Rockville
Compare Zip Codes
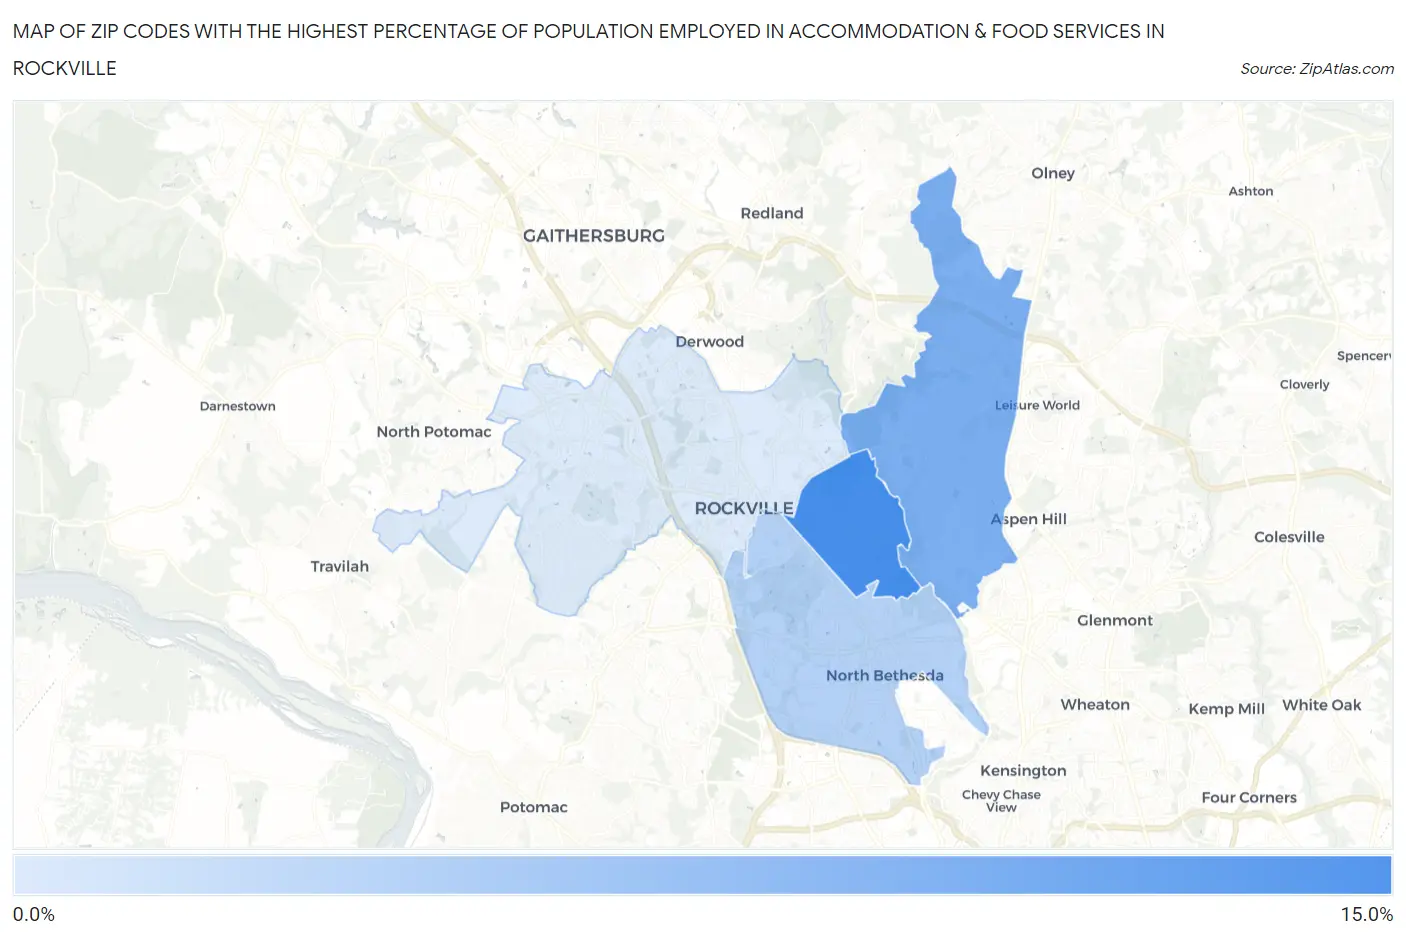
Map of Zip Codes with the Highest Percentage of Population Employed in Accommodation & Food Services in Rockville
0.0%
15.0%
Zip Codes with the Highest Percentage of Population Employed in Accommodation & Food Services in Rockville, MD
| Zip Code | % Employed | vs State | vs National | |
| 1. | 20851 | 11.3% | 5.8%(+5.44)#31 | 6.9%(+4.41)#3,332 |
| 2. | 20853 | 8.5% | 5.8%(+2.67)#61 | 6.9%(+1.64)#6,790 |
| 3. | 20852 | 5.7% | 5.8%(-0.134)#170 | 6.9%(-1.17)#14,352 |
| 4. | 20850 | 3.7% | 5.8%(-2.15)#305 | 6.9%(-3.18)#21,142 |
1
Common Questions
What are the Top 3 Zip Codes with the Highest Percentage of Population Employed in Accommodation & Food Services in Rockville, MD?
Top 3 Zip Codes with the Highest Percentage of Population Employed in Accommodation & Food Services in Rockville, MD are:
What zip code has the Highest Percentage of Population Employed in Accommodation & Food Services in Rockville, MD?
20851 has the Highest Percentage of Population Employed in Accommodation & Food Services in Rockville, MD with 11.3%.
What is the Percentage of Population Employed in Accommodation & Food Services in Rockville, MD?
Percentage of Population Employed in Accommodation & Food Services in Rockville is 5.1%.
What is the Percentage of Population Employed in Accommodation & Food Services in Maryland?
Percentage of Population Employed in Accommodation & Food Services in Maryland is 5.8%.
What is the Percentage of Population Employed in Accommodation & Food Services in the United States?
Percentage of Population Employed in Accommodation & Food Services in the United States is 6.9%.