Zip Codes with the Highest Percentage of Population Employed in Administrative & Support Services in Baltimore, MD
RELATED REPORTS & OPTIONS
Administrative & Support Services
Baltimore
Compare Zip Codes
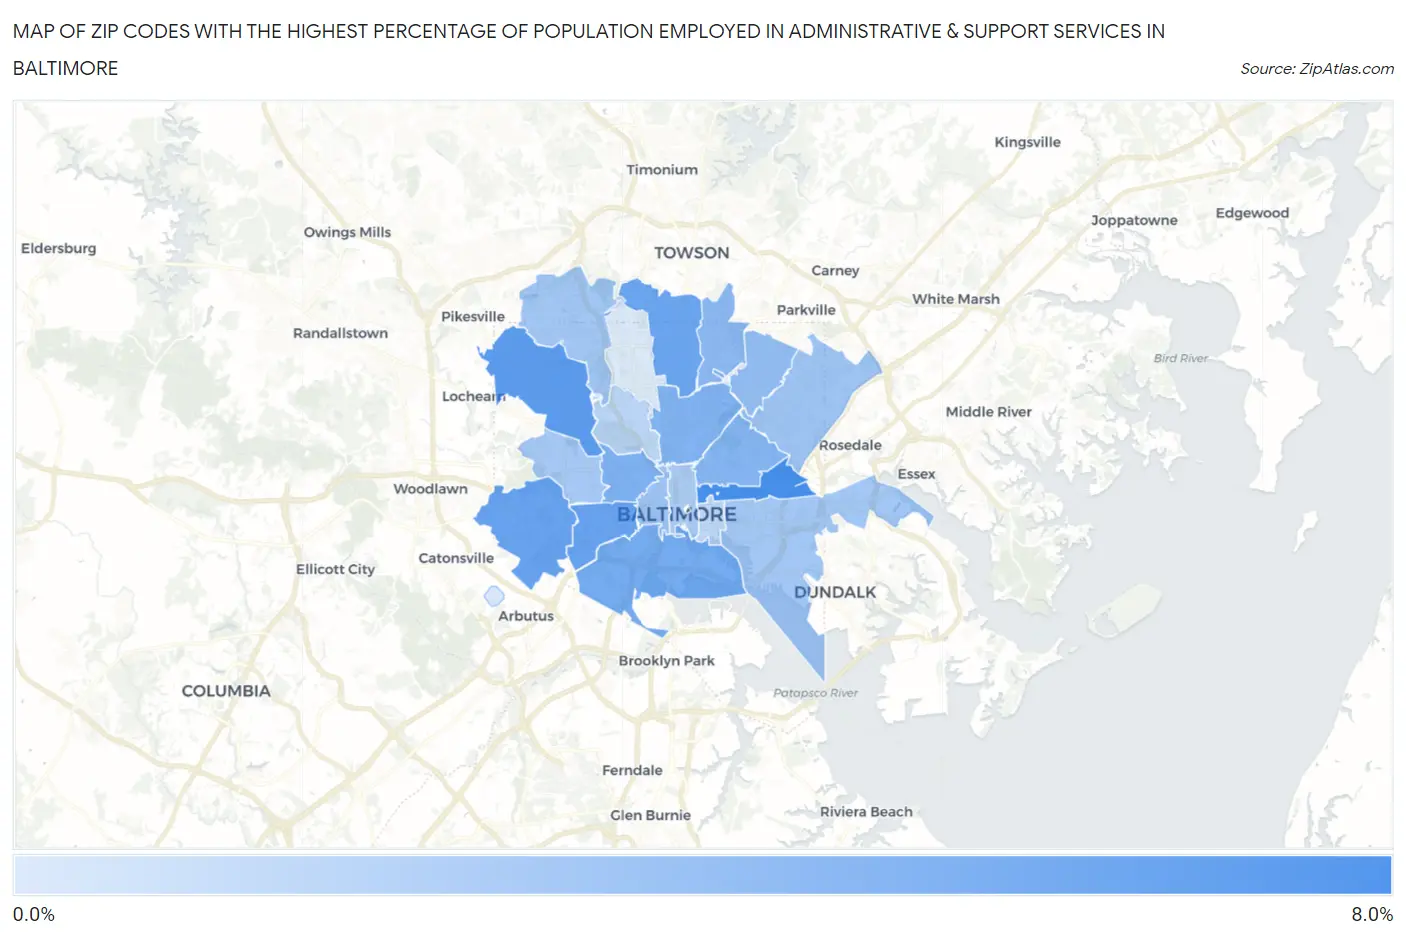
Map of Zip Codes with the Highest Percentage of Population Employed in Administrative & Support Services in Baltimore
0.0%
8.0%
Zip Codes with the Highest Percentage of Population Employed in Administrative & Support Services in Baltimore, MD
| Zip Code | % Employed | vs State | vs National | |
| 1. | 21205 | 7.1% | 4.2%(+2.85)#60 | 4.1%(+2.93)#3,129 |
| 2. | 21215 | 6.3% | 4.2%(+2.04)#78 | 4.1%(+2.13)#4,282 |
| 3. | 21229 | 5.7% | 4.2%(+1.51)#91 | 4.1%(+1.59)#5,270 |
| 4. | 21223 | 5.7% | 4.2%(+1.46)#95 | 4.1%(+1.54)#5,370 |
| 5. | 21212 | 5.5% | 4.2%(+1.30)#105 | 4.1%(+1.39)#5,739 |
| 6. | 21230 | 5.1% | 4.2%(+0.894)#115 | 4.1%(+0.977)#6,776 |
| 7. | 21217 | 4.8% | 4.2%(+0.594)#125 | 4.1%(+0.677)#7,642 |
| 8. | 21218 | 4.7% | 4.2%(+0.503)#130 | 4.1%(+0.586)#7,920 |
| 9. | 21213 | 4.5% | 4.2%(+0.303)#146 | 4.1%(+0.386)#8,604 |
| 10. | 21239 | 4.2% | 4.2%(-0.012)#157 | 4.1%(+0.070)#9,741 |
| 11. | 21214 | 3.9% | 4.2%(-0.301)#173 | 4.1%(-0.218)#10,961 |
| 12. | 21201 | 3.7% | 4.2%(-0.555)#194 | 4.1%(-0.472)#12,099 |
| 13. | 21206 | 3.5% | 4.2%(-0.762)#210 | 4.1%(-0.680)#13,119 |
| 14. | 21224 | 3.3% | 4.2%(-0.940)#222 | 4.1%(-0.857)#13,981 |
| 15. | 21209 | 3.3% | 4.2%(-0.968)#228 | 4.1%(-0.885)#14,130 |
| 16. | 21216 | 3.2% | 4.2%(-1.08)#236 | 4.1%(-0.993)#14,702 |
| 17. | 21202 | 3.0% | 4.2%(-1.20)#248 | 4.1%(-1.12)#15,310 |
| 18. | 21211 | 2.3% | 4.2%(-1.95)#304 | 4.1%(-1.87)#19,279 |
| 19. | 21231 | 2.2% | 4.2%(-2.00)#308 | 4.1%(-1.91)#19,482 |
| 20. | 21250 | 1.1% | 4.2%(-3.11)#356 | 4.1%(-3.03)#24,122 |
| 21. | 21210 | 0.97% | 4.2%(-3.26)#361 | 4.1%(-3.18)#24,582 |
1
Common Questions
What are the Top 10 Zip Codes with the Highest Percentage of Population Employed in Administrative & Support Services in Baltimore, MD?
Top 10 Zip Codes with the Highest Percentage of Population Employed in Administrative & Support Services in Baltimore, MD are:
What zip code has the Highest Percentage of Population Employed in Administrative & Support Services in Baltimore, MD?
21205 has the Highest Percentage of Population Employed in Administrative & Support Services in Baltimore, MD with 7.1%.
What is the Percentage of Population Employed in Administrative & Support Services in Baltimore, MD?
Percentage of Population Employed in Administrative & Support Services in Baltimore is 4.4%.
What is the Percentage of Population Employed in Administrative & Support Services in Maryland?
Percentage of Population Employed in Administrative & Support Services in Maryland is 4.2%.
What is the Percentage of Population Employed in Administrative & Support Services in the United States?
Percentage of Population Employed in Administrative & Support Services in the United States is 4.1%.