Zip Codes with the Highest Percentage of Population Employed in Administrative & Support Services in Hyattsville, MD
RELATED REPORTS & OPTIONS
Administrative & Support Services
Hyattsville
Compare Zip Codes
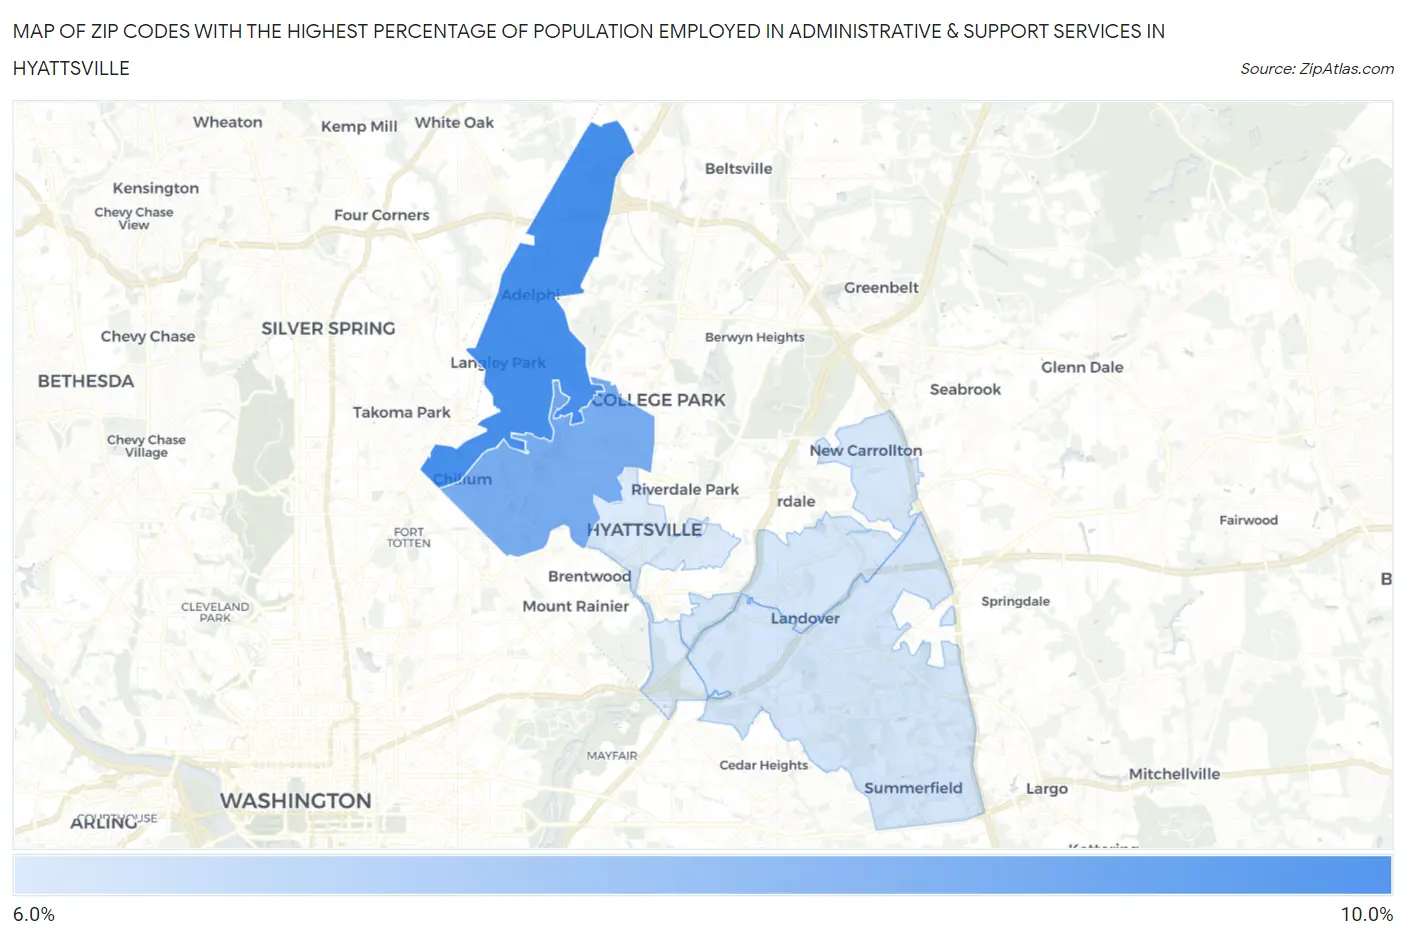
Map of Zip Codes with the Highest Percentage of Population Employed in Administrative & Support Services in Hyattsville
0.0%
10.0%
Zip Codes with the Highest Percentage of Population Employed in Administrative & Support Services in Hyattsville, MD
| Zip Code | % Employed | vs State | vs National | |
| 1. | 20783 | 9.6% | 4.2%(+5.41)#28 | 4.1%(+5.49)#1,420 |
| 2. | 20782 | 8.7% | 4.2%(+4.52)#37 | 4.1%(+4.60)#1,820 |
| 3. | 20785 | 7.1% | 4.2%(+2.87)#57 | 4.1%(+2.96)#3,093 |
| 4. | 20784 | 7.1% | 4.2%(+2.86)#59 | 4.1%(+2.94)#3,116 |
| 5. | 20781 | 7.0% | 4.2%(+2.72)#61 | 4.1%(+2.81)#3,283 |
1
Common Questions
What are the Top 3 Zip Codes with the Highest Percentage of Population Employed in Administrative & Support Services in Hyattsville, MD?
Top 3 Zip Codes with the Highest Percentage of Population Employed in Administrative & Support Services in Hyattsville, MD are:
What zip code has the Highest Percentage of Population Employed in Administrative & Support Services in Hyattsville, MD?
20783 has the Highest Percentage of Population Employed in Administrative & Support Services in Hyattsville, MD with 9.6%.
What is the Percentage of Population Employed in Administrative & Support Services in Hyattsville, MD?
Percentage of Population Employed in Administrative & Support Services in Hyattsville is 8.2%.
What is the Percentage of Population Employed in Administrative & Support Services in Maryland?
Percentage of Population Employed in Administrative & Support Services in Maryland is 4.2%.
What is the Percentage of Population Employed in Administrative & Support Services in the United States?
Percentage of Population Employed in Administrative & Support Services in the United States is 4.1%.