Zip Codes with the Highest Percentage of Population with a Degree in Visual and Performing Arts in New Bedford, MA
RELATED REPORTS & OPTIONS
Visual and Performing Arts
New Bedford
Compare Zip Codes
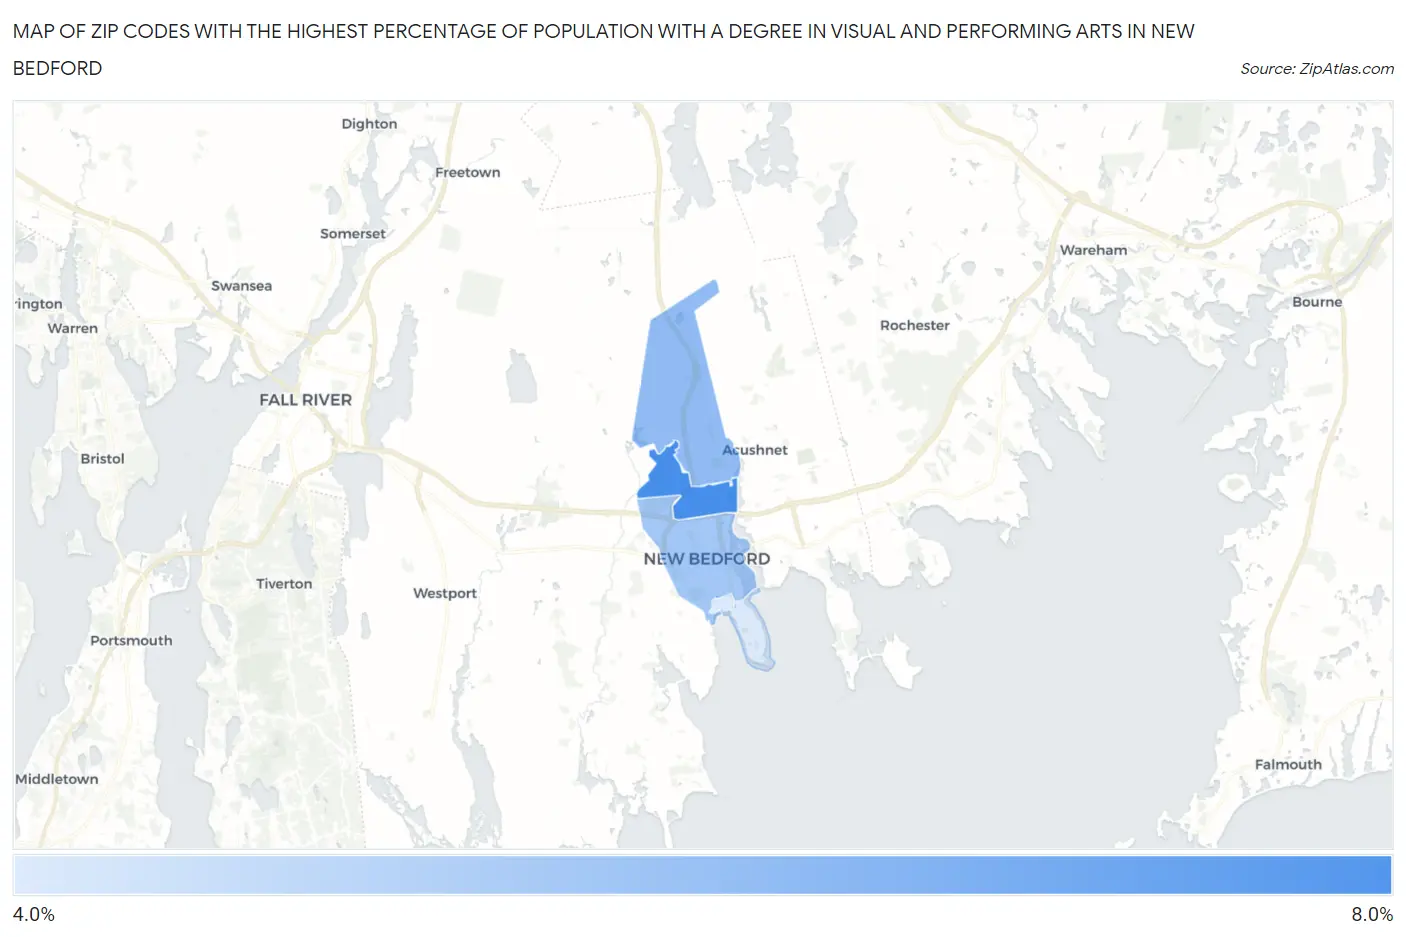
Map of Zip Codes with the Highest Percentage of Population with a Degree in Visual and Performing Arts in New Bedford
0.0%
8.0%
Zip Codes with the Highest Percentage of Population with a Degree in Visual and Performing Arts in New Bedford, MA
| Zip Code | % Graduates | vs State | vs National | |
| 1. | 02746 | 6.2% | 4.7%(+1.51)#120 | 4.3%(+1.97)#4,569 |
| 2. | 02745 | 5.4% | 4.7%(+0.665)#182 | 4.3%(+1.13)#5,892 |
| 3. | 02740 | 5.2% | 4.7%(+0.447)#193 | 4.3%(+0.910)#6,314 |
| 4. | 02744 | 4.5% | 4.7%(-0.202)#239 | 4.3%(+0.261)#7,776 |
1
Common Questions
What are the Top 3 Zip Codes with the Highest Percentage of Population with a Degree in Visual and Performing Arts in New Bedford, MA?
Top 3 Zip Codes with the Highest Percentage of Population with a Degree in Visual and Performing Arts in New Bedford, MA are:
What zip code has the Highest Percentage of Population with a Degree in Visual and Performing Arts in New Bedford, MA?
02746 has the Highest Percentage of Population with a Degree in Visual and Performing Arts in New Bedford, MA with 6.2%.
What is the Percentage of Population with a Degree in Visual and Performing Arts in New Bedford, MA?
Percentage of Population with a Degree in Visual and Performing Arts in New Bedford is 5.3%.
What is the Percentage of Population with a Degree in Visual and Performing Arts in Massachusetts?
Percentage of Population with a Degree in Visual and Performing Arts in Massachusetts is 4.7%.
What is the Percentage of Population with a Degree in Visual and Performing Arts in the United States?
Percentage of Population with a Degree in Visual and Performing Arts in the United States is 4.3%.