Zip Codes with the Highest Percentage of Population Employed in Architecture & Engineering in Arlington, MA
RELATED REPORTS & OPTIONS
Architecture & Engineering
Arlington
Compare Zip Codes
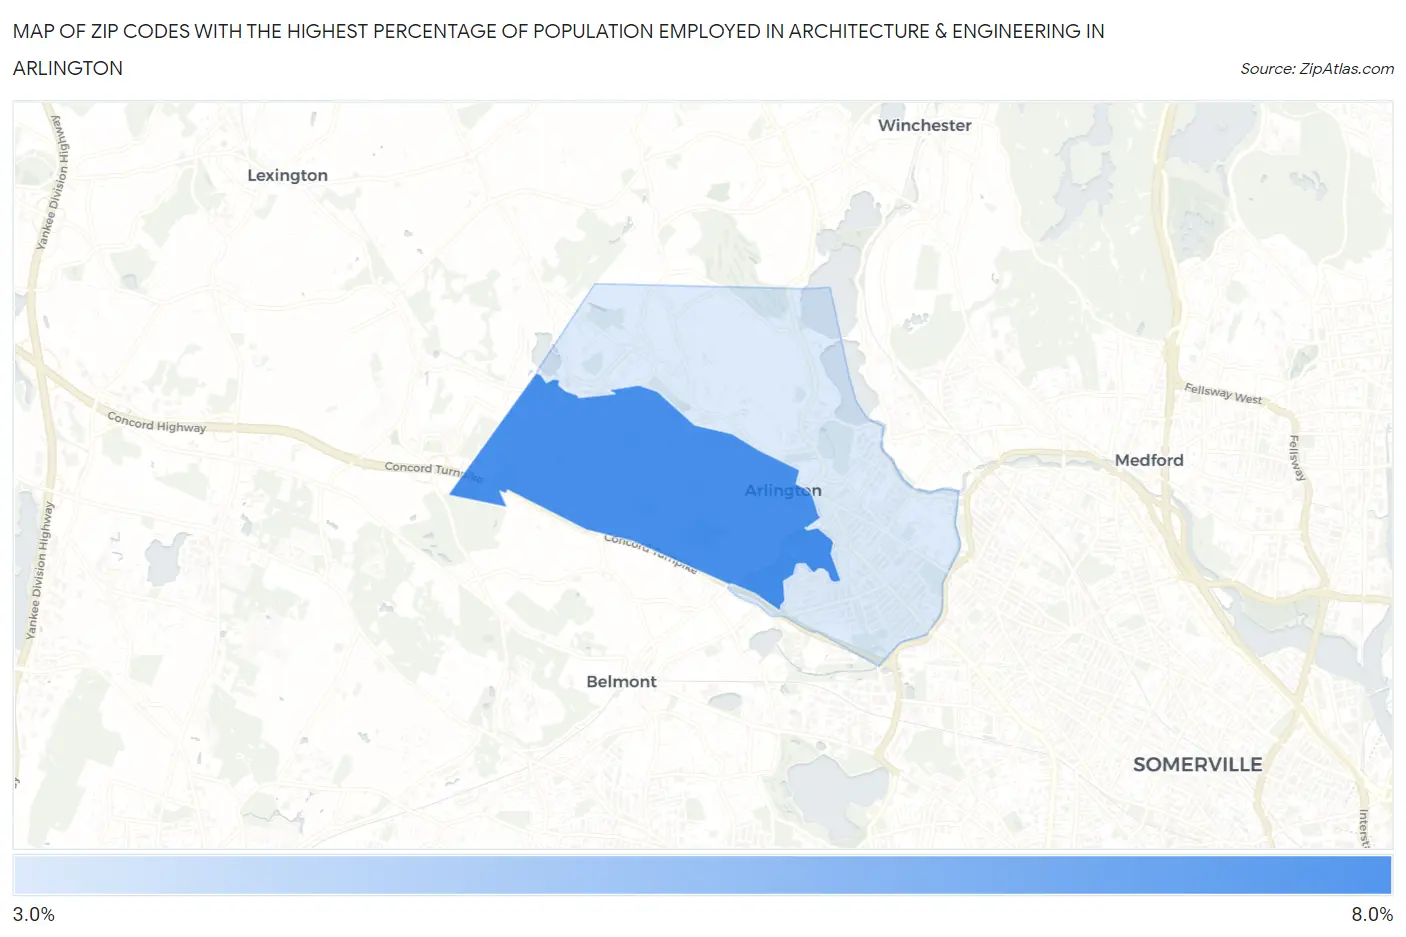
Map of Zip Codes with the Highest Percentage of Population Employed in Architecture & Engineering in Arlington
0.0%
8.0%
Zip Codes with the Highest Percentage of Population Employed in Architecture & Engineering in Arlington, MA
| Zip Code | % Employed | vs State | vs National | |
| 1. | 02476 | 7.4% | 2.7%(+4.71)#15 | 2.1%(+5.24)#676 |
| 2. | 02474 | 4.0% | 2.7%(+1.31)#96 | 2.1%(+1.83)#2,798 |
1
Common Questions
What are the Top Zip Codes with the Highest Percentage of Population Employed in Architecture & Engineering in Arlington, MA?
Top Zip Codes with the Highest Percentage of Population Employed in Architecture & Engineering in Arlington, MA are:
What zip code has the Highest Percentage of Population Employed in Architecture & Engineering in Arlington, MA?
02476 has the Highest Percentage of Population Employed in Architecture & Engineering in Arlington, MA with 7.4%.
What is the Percentage of Population Employed in Architecture & Engineering in Arlington, MA?
Percentage of Population Employed in Architecture & Engineering in Arlington is 5.2%.
What is the Percentage of Population Employed in Architecture & Engineering in Massachusetts?
Percentage of Population Employed in Architecture & Engineering in Massachusetts is 2.7%.
What is the Percentage of Population Employed in Architecture & Engineering in the United States?
Percentage of Population Employed in Architecture & Engineering in the United States is 2.1%.