Zip Codes with the Highest Percentage of Population Employed in Architecture & Engineering in Acton, MA
RELATED REPORTS & OPTIONS
Architecture & Engineering
Acton
Compare Zip Codes
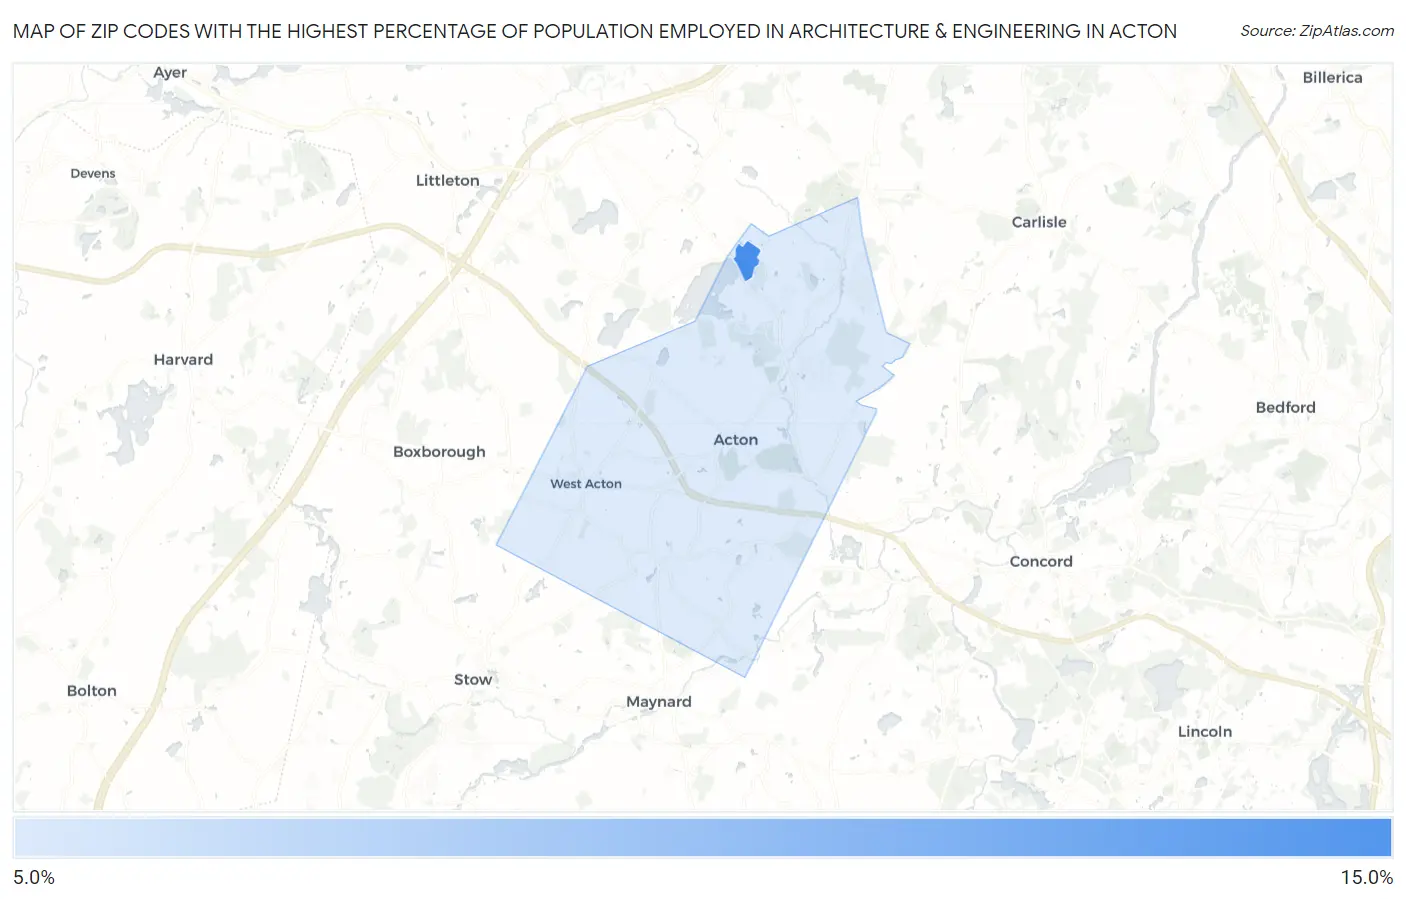
Map of Zip Codes with the Highest Percentage of Population Employed in Architecture & Engineering in Acton
0.0%
15.0%
Zip Codes with the Highest Percentage of Population Employed in Architecture & Engineering in Acton, MA
| Zip Code | % Employed | vs State | vs National | |
| 1. | 01718 | 12.1% | 2.7%(+9.47)#6 | 2.1%(+10.00)#233 |
| 2. | 01720 | 6.5% | 2.7%(+3.82)#24 | 2.1%(+4.34)#891 |
1
Common Questions
What are the Top Zip Codes with the Highest Percentage of Population Employed in Architecture & Engineering in Acton, MA?
Top Zip Codes with the Highest Percentage of Population Employed in Architecture & Engineering in Acton, MA are:
What zip code has the Highest Percentage of Population Employed in Architecture & Engineering in Acton, MA?
01718 has the Highest Percentage of Population Employed in Architecture & Engineering in Acton, MA with 12.1%.
What is the Percentage of Population Employed in Architecture & Engineering in Massachusetts?
Percentage of Population Employed in Architecture & Engineering in Massachusetts is 2.7%.
What is the Percentage of Population Employed in Architecture & Engineering in the United States?
Percentage of Population Employed in Architecture & Engineering in the United States is 2.1%.