Slovak vs Moroccan Wage/Income Gap
COMPARE
Slovak
Moroccan
Wage/Income Gap
Wage/Income Gap Comparison
Slovaks
Moroccans
28.9%
WAGE/INCOME GAP
0.1/ 100
METRIC RATING
319th/ 347
METRIC RANK
24.0%
WAGE/INCOME GAP
98.6/ 100
METRIC RATING
105th/ 347
METRIC RANK
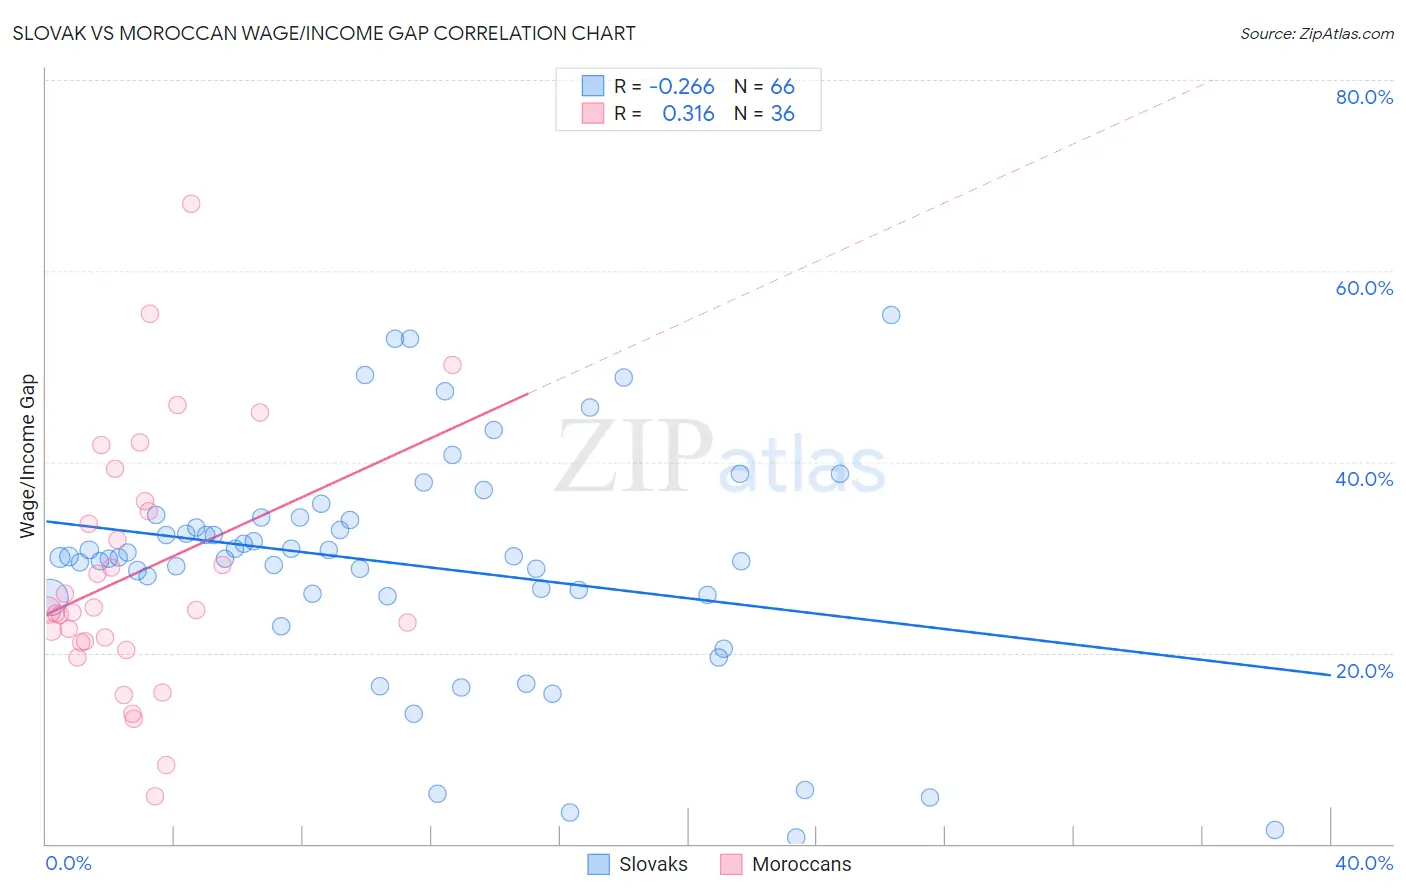
Slovak vs Moroccan Wage/Income Gap Correlation Chart
The statistical analysis conducted on geographies consisting of 397,444,585 people shows a weak negative correlation between the proportion of Slovaks and wage/income gap percentage in the United States with a correlation coefficient (R) of -0.266 and weighted average of 28.9%. Similarly, the statistical analysis conducted on geographies consisting of 201,754,840 people shows a mild positive correlation between the proportion of Moroccans and wage/income gap percentage in the United States with a correlation coefficient (R) of 0.316 and weighted average of 24.0%, a difference of 20.5%.
Wage/Income Gap Correlation Summary
| Measurement | Slovak | Moroccan |
| Minimum | 0.72% | 4.9% |
| Maximum | 55.3% | 67.0% |
| Range | 54.6% | 62.1% |
| Mean | 29.3% | 28.5% |
| Median | 30.0% | 24.5% |
| Interquartile 25% (IQ1) | 26.0% | 21.2% |
| Interquartile 75% (IQ3) | 34.2% | 35.4% |
| Interquartile Range (IQR) | 8.2% | 14.2% |
| Standard Deviation (Sample) | 11.9% | 13.2% |
| Standard Deviation (Population) | 11.8% | 13.1% |
Similar Demographics by Wage/Income Gap
Demographics Similar to Slovaks by Wage/Income Gap
In terms of wage/income gap, the demographic groups most similar to Slovaks are British (28.9%, a difference of 0.060%), Welsh (28.9%, a difference of 0.13%), Immigrants from Singapore (28.9%, a difference of 0.15%), Norwegian (29.0%, a difference of 0.25%), and Basque (28.8%, a difference of 0.31%).
| Demographics | Rating | Rank | Wage/Income Gap |
| Eastern Europeans | 0.1 /100 | #312 | Tragic 28.6% |
| French | 0.1 /100 | #313 | Tragic 28.7% |
| Immigrants | Scotland | 0.1 /100 | #314 | Tragic 28.7% |
| Maltese | 0.1 /100 | #315 | Tragic 28.7% |
| Lithuanians | 0.1 /100 | #316 | Tragic 28.7% |
| Belgians | 0.1 /100 | #317 | Tragic 28.8% |
| Basques | 0.1 /100 | #318 | Tragic 28.8% |
| Slovaks | 0.1 /100 | #319 | Tragic 28.9% |
| British | 0.1 /100 | #320 | Tragic 28.9% |
| Welsh | 0.1 /100 | #321 | Tragic 28.9% |
| Immigrants | Singapore | 0.1 /100 | #322 | Tragic 28.9% |
| Norwegians | 0.1 /100 | #323 | Tragic 29.0% |
| Croatians | 0.0 /100 | #324 | Tragic 29.0% |
| Hungarians | 0.0 /100 | #325 | Tragic 29.0% |
| Immigrants | Belgium | 0.0 /100 | #326 | Tragic 29.0% |
Demographics Similar to Moroccans by Wage/Income Gap
In terms of wage/income gap, the demographic groups most similar to Moroccans are Sudanese (24.0%, a difference of 0.0%), Tlingit-Haida (24.0%, a difference of 0.060%), Yaqui (24.0%, a difference of 0.31%), Immigrants from Albania (24.0%, a difference of 0.31%), and Ugandan (24.1%, a difference of 0.37%).
| Demographics | Rating | Rank | Wage/Income Gap |
| Immigrants | Latin America | 99.2 /100 | #98 | Exceptional 23.7% |
| Aleuts | 99.2 /100 | #99 | Exceptional 23.7% |
| Yakama | 99.2 /100 | #100 | Exceptional 23.7% |
| Japanese | 99.1 /100 | #101 | Exceptional 23.8% |
| Immigrants | Laos | 99.0 /100 | #102 | Exceptional 23.8% |
| Tsimshian | 98.9 /100 | #103 | Exceptional 23.9% |
| Tlingit-Haida | 98.7 /100 | #104 | Exceptional 24.0% |
| Moroccans | 98.6 /100 | #105 | Exceptional 24.0% |
| Sudanese | 98.6 /100 | #106 | Exceptional 24.0% |
| Yaqui | 98.4 /100 | #107 | Exceptional 24.0% |
| Immigrants | Albania | 98.4 /100 | #108 | Exceptional 24.0% |
| Ugandans | 98.3 /100 | #109 | Exceptional 24.1% |
| Immigrants | Morocco | 98.1 /100 | #110 | Exceptional 24.1% |
| Soviet Union | 97.6 /100 | #111 | Exceptional 24.2% |
| Immigrants | Colombia | 97.0 /100 | #112 | Exceptional 24.3% |