Immigrants vs Slovak Wage/Income Gap
COMPARE
Immigrants
Slovak
Wage/Income Gap
Wage/Income Gap Comparison
Immigrants
Slovaks
25.1%
WAGE/INCOME GAP
82.3/ 100
METRIC RATING
150th/ 347
METRIC RANK
28.9%
WAGE/INCOME GAP
0.1/ 100
METRIC RATING
319th/ 347
METRIC RANK
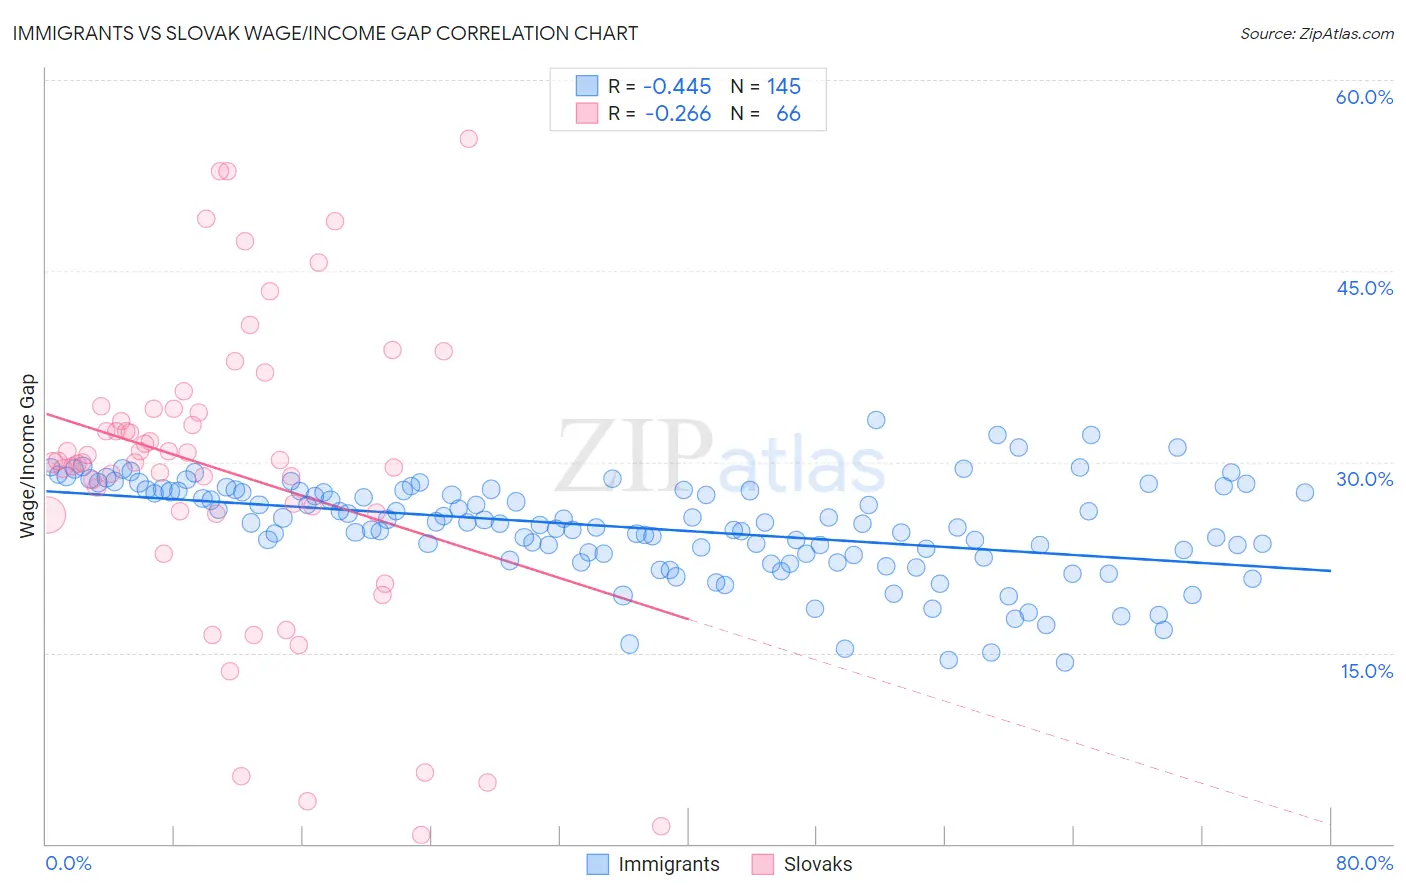
Immigrants vs Slovak Wage/Income Gap Correlation Chart
The statistical analysis conducted on geographies consisting of 574,033,804 people shows a moderate negative correlation between the proportion of Immigrants and wage/income gap percentage in the United States with a correlation coefficient (R) of -0.445 and weighted average of 25.1%. Similarly, the statistical analysis conducted on geographies consisting of 397,444,585 people shows a weak negative correlation between the proportion of Slovaks and wage/income gap percentage in the United States with a correlation coefficient (R) of -0.266 and weighted average of 28.9%, a difference of 14.9%.
Wage/Income Gap Correlation Summary
| Measurement | Immigrants | Slovak |
| Minimum | 14.2% | 0.72% |
| Maximum | 33.3% | 55.3% |
| Range | 19.1% | 54.6% |
| Mean | 24.8% | 29.3% |
| Median | 25.2% | 30.0% |
| Interquartile 25% (IQ1) | 22.8% | 26.0% |
| Interquartile 75% (IQ3) | 27.7% | 34.2% |
| Interquartile Range (IQR) | 5.0% | 8.2% |
| Standard Deviation (Sample) | 3.8% | 11.9% |
| Standard Deviation (Population) | 3.8% | 11.8% |
Similar Demographics by Wage/Income Gap
Demographics Similar to Immigrants by Wage/Income Gap
In terms of wage/income gap, the demographic groups most similar to Immigrants are Immigrants from Peru (25.1%, a difference of 0.040%), Taiwanese (25.1%, a difference of 0.080%), Uruguayan (25.2%, a difference of 0.11%), Iroquois (25.1%, a difference of 0.19%), and Malaysian (25.0%, a difference of 0.33%).
| Demographics | Rating | Rank | Wage/Income Gap |
| Immigrants | Uganda | 88.0 /100 | #143 | Excellent 24.9% |
| Chippewa | 86.9 /100 | #144 | Excellent 25.0% |
| Comanche | 85.2 /100 | #145 | Excellent 25.0% |
| South Americans | 85.2 /100 | #146 | Excellent 25.0% |
| Malaysians | 84.9 /100 | #147 | Excellent 25.0% |
| Iroquois | 83.9 /100 | #148 | Excellent 25.1% |
| Immigrants | Peru | 82.6 /100 | #149 | Excellent 25.1% |
| Immigrants | Immigrants | 82.3 /100 | #150 | Excellent 25.1% |
| Taiwanese | 81.6 /100 | #151 | Excellent 25.1% |
| Uruguayans | 81.3 /100 | #152 | Excellent 25.2% |
| Blackfeet | 78.1 /100 | #153 | Good 25.2% |
| Immigrants | Northern Africa | 78.1 /100 | #154 | Good 25.2% |
| Immigrants | Vietnam | 77.7 /100 | #155 | Good 25.2% |
| Immigrants | Mexico | 76.4 /100 | #156 | Good 25.3% |
| Costa Ricans | 75.8 /100 | #157 | Good 25.3% |
Demographics Similar to Slovaks by Wage/Income Gap
In terms of wage/income gap, the demographic groups most similar to Slovaks are British (28.9%, a difference of 0.060%), Welsh (28.9%, a difference of 0.13%), Immigrants from Singapore (28.9%, a difference of 0.15%), Norwegian (29.0%, a difference of 0.25%), and Basque (28.8%, a difference of 0.31%).
| Demographics | Rating | Rank | Wage/Income Gap |
| Eastern Europeans | 0.1 /100 | #312 | Tragic 28.6% |
| French | 0.1 /100 | #313 | Tragic 28.7% |
| Immigrants | Scotland | 0.1 /100 | #314 | Tragic 28.7% |
| Maltese | 0.1 /100 | #315 | Tragic 28.7% |
| Lithuanians | 0.1 /100 | #316 | Tragic 28.7% |
| Belgians | 0.1 /100 | #317 | Tragic 28.8% |
| Basques | 0.1 /100 | #318 | Tragic 28.8% |
| Slovaks | 0.1 /100 | #319 | Tragic 28.9% |
| British | 0.1 /100 | #320 | Tragic 28.9% |
| Welsh | 0.1 /100 | #321 | Tragic 28.9% |
| Immigrants | Singapore | 0.1 /100 | #322 | Tragic 28.9% |
| Norwegians | 0.1 /100 | #323 | Tragic 29.0% |
| Croatians | 0.0 /100 | #324 | Tragic 29.0% |
| Hungarians | 0.0 /100 | #325 | Tragic 29.0% |
| Immigrants | Belgium | 0.0 /100 | #326 | Tragic 29.0% |