Immigrants from Western Europe vs Lumbee Wage/Income Gap
COMPARE
Immigrants from Western Europe
Lumbee
Wage/Income Gap
Wage/Income Gap Comparison
Immigrants from Western Europe
Lumbee
27.8%
WAGE/INCOME GAP
0.9/ 100
METRIC RATING
270th/ 347
METRIC RANK
21.3%
WAGE/INCOME GAP
100.0/ 100
METRIC RATING
40th/ 347
METRIC RANK
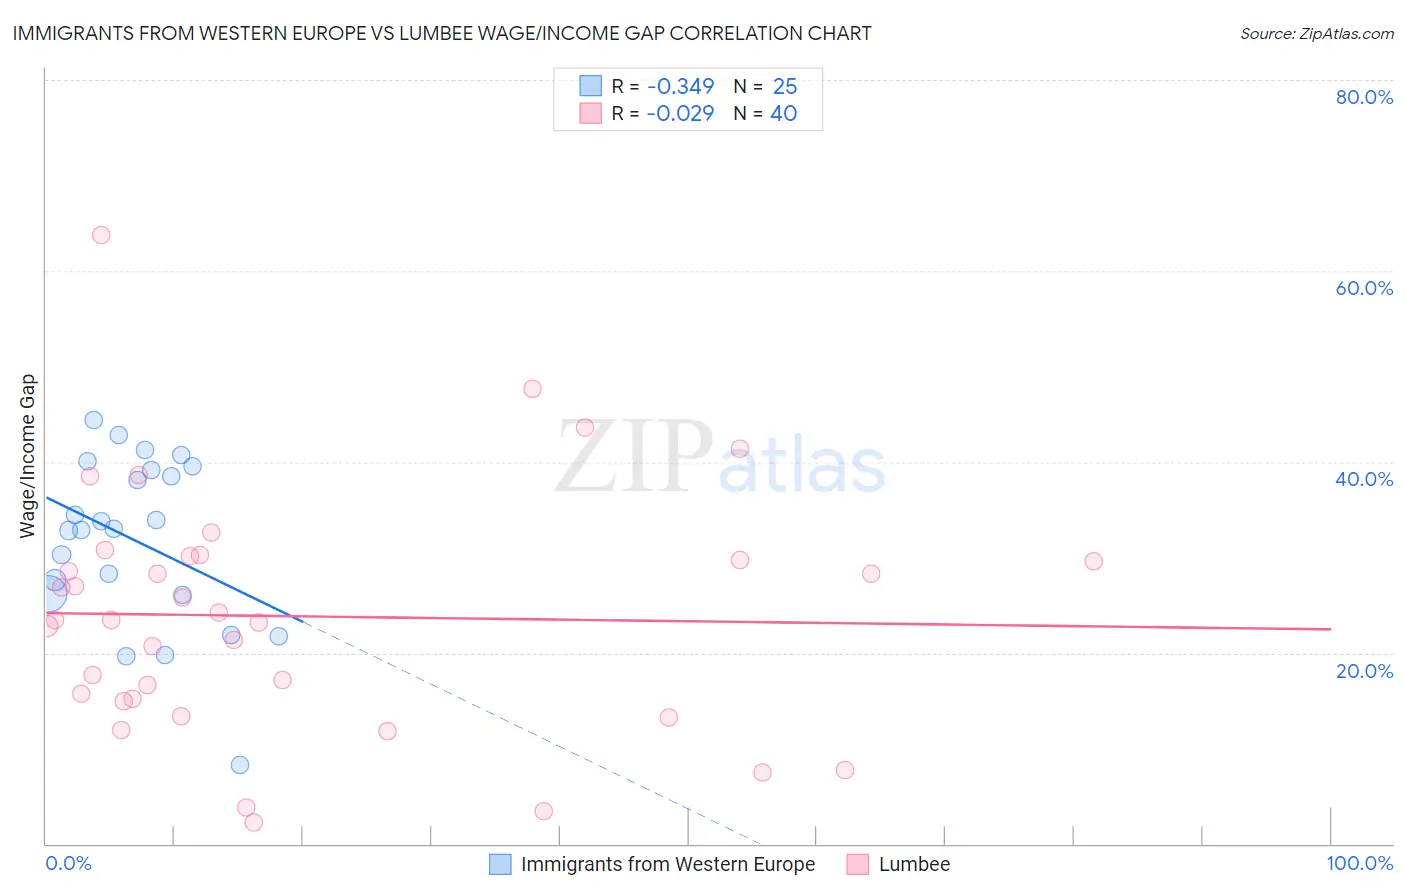
Immigrants from Western Europe vs Lumbee Wage/Income Gap Correlation Chart
The statistical analysis conducted on geographies consisting of 493,207,642 people shows a mild negative correlation between the proportion of Immigrants from Western Europe and wage/income gap percentage in the United States with a correlation coefficient (R) of -0.349 and weighted average of 27.8%. Similarly, the statistical analysis conducted on geographies consisting of 92,243,625 people shows no correlation between the proportion of Lumbee and wage/income gap percentage in the United States with a correlation coefficient (R) of -0.029 and weighted average of 21.3%, a difference of 30.1%.
Wage/Income Gap Correlation Summary
| Measurement | Immigrants from Western Europe | Lumbee |
| Minimum | 8.2% | 2.2% |
| Maximum | 44.3% | 63.8% |
| Range | 36.1% | 61.6% |
| Mean | 31.8% | 23.8% |
| Median | 33.0% | 23.4% |
| Interquartile 25% (IQ1) | 26.1% | 15.1% |
| Interquartile 75% (IQ3) | 39.4% | 29.9% |
| Interquartile Range (IQR) | 13.2% | 14.8% |
| Standard Deviation (Sample) | 8.8% | 12.8% |
| Standard Deviation (Population) | 8.7% | 12.6% |
Similar Demographics by Wage/Income Gap
Demographics Similar to Immigrants from Western Europe by Wage/Income Gap
In terms of wage/income gap, the demographic groups most similar to Immigrants from Western Europe are Ute (27.8%, a difference of 0.080%), Potawatomi (27.7%, a difference of 0.12%), New Zealander (27.7%, a difference of 0.13%), Immigrants from Korea (27.8%, a difference of 0.15%), and Turkish (27.7%, a difference of 0.21%).
| Demographics | Rating | Rank | Wage/Income Gap |
| Syrians | 1.4 /100 | #263 | Tragic 27.6% |
| Immigrants | Switzerland | 1.0 /100 | #264 | Tragic 27.7% |
| Serbians | 1.0 /100 | #265 | Tragic 27.7% |
| Hmong | 1.0 /100 | #266 | Tragic 27.7% |
| Turks | 1.0 /100 | #267 | Tragic 27.7% |
| New Zealanders | 1.0 /100 | #268 | Tragic 27.7% |
| Potawatomi | 0.9 /100 | #269 | Tragic 27.7% |
| Immigrants | Western Europe | 0.9 /100 | #270 | Tragic 27.8% |
| Ute | 0.8 /100 | #271 | Tragic 27.8% |
| Immigrants | Korea | 0.8 /100 | #272 | Tragic 27.8% |
| Bulgarians | 0.7 /100 | #273 | Tragic 27.8% |
| Americans | 0.7 /100 | #274 | Tragic 27.8% |
| Immigrants | Japan | 0.7 /100 | #275 | Tragic 27.9% |
| Lebanese | 0.7 /100 | #276 | Tragic 27.9% |
| Latvians | 0.7 /100 | #277 | Tragic 27.9% |
Demographics Similar to Lumbee by Wage/Income Gap
In terms of wage/income gap, the demographic groups most similar to Lumbee are Colville (21.3%, a difference of 0.20%), Immigrants from Belize (21.3%, a difference of 0.31%), Immigrants from Somalia (21.2%, a difference of 0.36%), Belizean (21.2%, a difference of 0.43%), and Somali (21.2%, a difference of 0.45%).
| Demographics | Rating | Rank | Wage/Income Gap |
| Immigrants | Bahamas | 100.0 /100 | #33 | Exceptional 21.1% |
| Pima | 100.0 /100 | #34 | Exceptional 21.1% |
| Somalis | 100.0 /100 | #35 | Exceptional 21.2% |
| Belizeans | 100.0 /100 | #36 | Exceptional 21.2% |
| Immigrants | Somalia | 100.0 /100 | #37 | Exceptional 21.2% |
| Immigrants | Belize | 100.0 /100 | #38 | Exceptional 21.3% |
| Colville | 100.0 /100 | #39 | Exceptional 21.3% |
| Lumbee | 100.0 /100 | #40 | Exceptional 21.3% |
| Liberians | 100.0 /100 | #41 | Exceptional 21.4% |
| Immigrants | Sierra Leone | 100.0 /100 | #42 | Exceptional 21.4% |
| Sierra Leoneans | 100.0 /100 | #43 | Exceptional 21.4% |
| Immigrants | Eritrea | 100.0 /100 | #44 | Exceptional 21.4% |
| U.S. Virgin Islanders | 100.0 /100 | #45 | Exceptional 21.5% |
| Immigrants | Ethiopia | 100.0 /100 | #46 | Exceptional 21.6% |
| Immigrants | Congo | 100.0 /100 | #47 | Exceptional 21.7% |