Immigrants from Western Europe vs Lumbee Unemployment Among Ages 45 to 54 years

COMPARE

Immigrants from Western Europe
Race
Ancestry
AfghanAfricanAlaska NativeAlaskan AthabascanAlbanianAleutAlsatianAmericanApacheArabArapahoArgentineanArmenianAssyrian/Chaldean/SyriacAustralianAustrianBahamianBangladeshiBarbadianBasqueBelgianBelizeanBermudanBhutaneseBlackfeetBolivianBrazilianBritishBritish West IndianBulgarianBurmeseCajunCambodianCanadianCape VerdeanCarpatho RusynCelticCentral AmericanCentral American IndianCherokeeCheyenneChickasawChileanChineseChippewaChoctawColombianColvilleComancheCosta RicanCreeCreekCroatianCrowCubanCypriotCzechCzechoslovakianDanishDelawareDominicanDutchDutch West IndianEastern EuropeanEcuadorianEgyptianEnglishEstonianEthiopianEuropeanFijianFilipinoFinnishFrenchFrench American IndianFrench CanadianGermanGerman RussianGhanaianGreekGuamanian/ChamorroGuatemalanGuyaneseHaitianHmongHonduranHopiHoumaHungarianIcelanderIndian (Asian)IndonesianInupiatIranianIraqiIrishIroquoisIsraeliItalianJamaicanJapaneseJordanianKenyanKiowaKoreanLaotianLatvianLebaneseLiberianLithuanianLuxembourgerMacedonianMalaysianMalteseMarshalleseMenomineeMexicanMexican American IndianMongolianMoroccanNative HawaiianNavajoNepaleseNew ZealanderNicaraguanNigerianNorthern EuropeanNorwegianOkinawanOsageOttawaPaiutePakistaniPalestinianPanamanianParaguayanPennsylvania GermanPeruvianPimaPolishPortuguesePotawatomiPuebloPuerto RicanPuget Sound SalishRomanianRussianSalvadoranSamoanScandinavianScotch-IrishScottishSeminoleSenegaleseSerbianShoshoneSierra LeoneanSiouxSlavicSlovakSloveneSomaliSouth AfricanSouth AmericanSouth American IndianSoviet UnionSpaniardSpanishSpanish AmericanSpanish American IndianSri LankanSubsaharan AfricanSudaneseSwedishSwissSyrianTaiwaneseThaiTlingit-HaidaTohono O'OdhamTonganTrinidadian and TobagonianTsimshianTurkishU.S. Virgin IslanderUgandanUkrainianUruguayanUteVenezuelanVietnameseWelshWest IndianYakamaYaquiYugoslavianYumanYup'ikZimbabwean
Immigration
NonimmigrantsImmigrantsAfghanistanAfricaAlbaniaArgentinaArmeniaAsiaAustraliaAustriaBahamasBangladeshBarbadosBelarusBelgiumBelizeBoliviaBosnia and HerzegovinaBrazilBulgariaBurma/MyanmarCabo VerdeCambodiaCameroonCanadaCaribbeanCentral AmericaChileChinaColombiaCongoCosta RicaCroatiaCubaCzechoslovakiaDenmarkDominicaDominican RepublicEastern AfricaEastern AsiaEastern EuropeEcuadorEgyptEl SalvadorEnglandEritreaEthiopiaEuropeFijiFranceGermanyGhanaGreeceGrenadaGuatemalaGuyanaHaitiHondurasHong KongHungaryIndiaIndonesiaIranIraqIrelandIsraelItalyJamaicaJapanJordanKazakhstanKenyaKoreaKuwaitLaosLatin AmericaLatviaLebanonLiberiaLithuaniaMalaysiaMexicoMicronesiaMiddle AfricaMoldovaMoroccoNepalNetherlandsNicaraguaNigeriaNorth AmericaNorth MacedoniaNorthern AfricaNorthern EuropeNorwayOceaniaPakistanPanamaPeruPhilippinesPolandPortugalRomaniaRussiaSaudi ArabiaScotlandSenegalSerbiaSierra LeoneSingaporeSomaliaSouth AfricaSouth AmericaSouth Central AsiaSouth Eastern AsiaSouthern EuropeSpainSri LankaSt. Vincent and the GrenadinesSudanSwedenSwitzerlandSyriaTaiwanThailandTrinidad and TobagoTurkeyUgandaUkraineUruguayUzbekistanVenezuelaVietnamWest IndiesWestern AfricaWestern AsiaWestern EuropeYemenZaireZimbabweAzores
Lumbee
Race
Ancestry
AfghanAfricanAlaska NativeAlaskan AthabascanAlbanianAleutAlsatianAmericanApacheArabArapahoArgentineanArmenianAssyrian/Chaldean/SyriacAustralianAustrianBahamianBangladeshiBarbadianBasqueBelgianBelizeanBermudanBhutaneseBlackfeetBolivianBrazilianBritishBritish West IndianBulgarianBurmeseCajunCambodianCanadianCape VerdeanCarpatho RusynCelticCentral AmericanCentral American IndianCherokeeCheyenneChickasawChileanChineseChippewaChoctawColombianColvilleComancheCosta RicanCreeCreekCroatianCrowCubanCypriotCzechCzechoslovakianDanishDelawareDominicanDutchDutch West IndianEastern EuropeanEcuadorianEgyptianEnglishEstonianEthiopianEuropeanFijianFilipinoFinnishFrenchFrench American IndianFrench CanadianGermanGerman RussianGhanaianGreekGuamanian/ChamorroGuatemalanGuyaneseHaitianHmongHonduranHopiHoumaHungarianIcelanderIndian (Asian)IndonesianInupiatIranianIraqiIrishIroquoisIsraeliItalianJamaicanJapaneseJordanianKenyanKiowaKoreanLaotianLatvianLebaneseLiberianLithuanianLumbeeLuxembourgerMacedonianMalaysianMalteseMarshalleseMenomineeMexicanMexican American IndianMongolianMoroccanNative HawaiianNavajoNepaleseNew ZealanderNicaraguanNigerianNorthern EuropeanNorwegianOkinawanOsageOttawaPaiutePakistaniPalestinianPanamanianParaguayanPennsylvania GermanPeruvianPimaPolishPortuguesePotawatomiPuebloPuerto RicanPuget Sound SalishRomanianRussianSalvadoranSamoanScandinavianScotch-IrishScottishSeminoleSenegaleseSerbianShoshoneSierra LeoneanSiouxSlavicSlovakSloveneSomaliSouth AfricanSouth AmericanSouth American IndianSoviet UnionSpaniardSpanishSpanish AmericanSpanish American IndianSri LankanSubsaharan AfricanSudaneseSwedishSwissSyrianTaiwaneseThaiTlingit-HaidaTohono O'OdhamTonganTrinidadian and TobagonianTsimshianTurkishU.S. Virgin IslanderUgandanUkrainianUruguayanUteVenezuelanVietnameseWelshWest IndianYakamaYaquiYugoslavianYumanYup'ikZimbabwean
Immigration
NonimmigrantsImmigrantsAfghanistanAfricaAlbaniaArgentinaArmeniaAsiaAustraliaAustriaBahamasBangladeshBarbadosBelarusBelgiumBelizeBoliviaBosnia and HerzegovinaBrazilBulgariaBurma/MyanmarCabo VerdeCambodiaCameroonCanadaCaribbeanCentral AmericaChileChinaColombiaCongoCosta RicaCroatiaCubaCzechoslovakiaDenmarkDominicaDominican RepublicEastern AfricaEastern AsiaEastern EuropeEcuadorEgyptEl SalvadorEnglandEritreaEthiopiaEuropeFijiFranceGermanyGhanaGreeceGrenadaGuatemalaGuyanaHaitiHondurasHong KongHungaryIndiaIndonesiaIranIraqIrelandIsraelItalyJamaicaJapanJordanKazakhstanKenyaKoreaKuwaitLaosLatin AmericaLatviaLebanonLiberiaLithuaniaMalaysiaMexicoMicronesiaMiddle AfricaMoldovaMoroccoNepalNetherlandsNicaraguaNigeriaNorth AmericaNorth MacedoniaNorthern AfricaNorthern EuropeNorwayOceaniaPakistanPanamaPeruPhilippinesPolandPortugalRomaniaRussiaSaudi ArabiaScotlandSenegalSerbiaSierra LeoneSingaporeSomaliaSouth AfricaSouth AmericaSouth Central AsiaSouth Eastern AsiaSouthern EuropeSpainSri LankaSt. Vincent and the GrenadinesSudanSwedenSwitzerlandSyriaTaiwanThailandTrinidad and TobagoTurkeyUgandaUkraineUruguayUzbekistanVenezuelaVietnamWest IndiesWestern AfricaWestern AsiaYemenZaireZimbabweAzores
Unemployment Among Ages 45 to 54 years
Income
Poverty
Unemployment
Labor Participation
Family Structure
Vehicle Availability
Education Level
Disability

Unemployment Among Ages 45 to 54 years Comparison

Immigrants from Western Europe

Lumbee

Average
Tragic
4.5%
UNEMPLOYMENT AMONG AGES 45 TO 54 YEARS
57.4/ 100
METRIC RATING
166th/ 347
METRIC RANK
4.6%
UNEMPLOYMENT AMONG AGES 45 TO 54 YEARS
9.2/ 100
METRIC RATING
216th/ 347
METRIC RANK

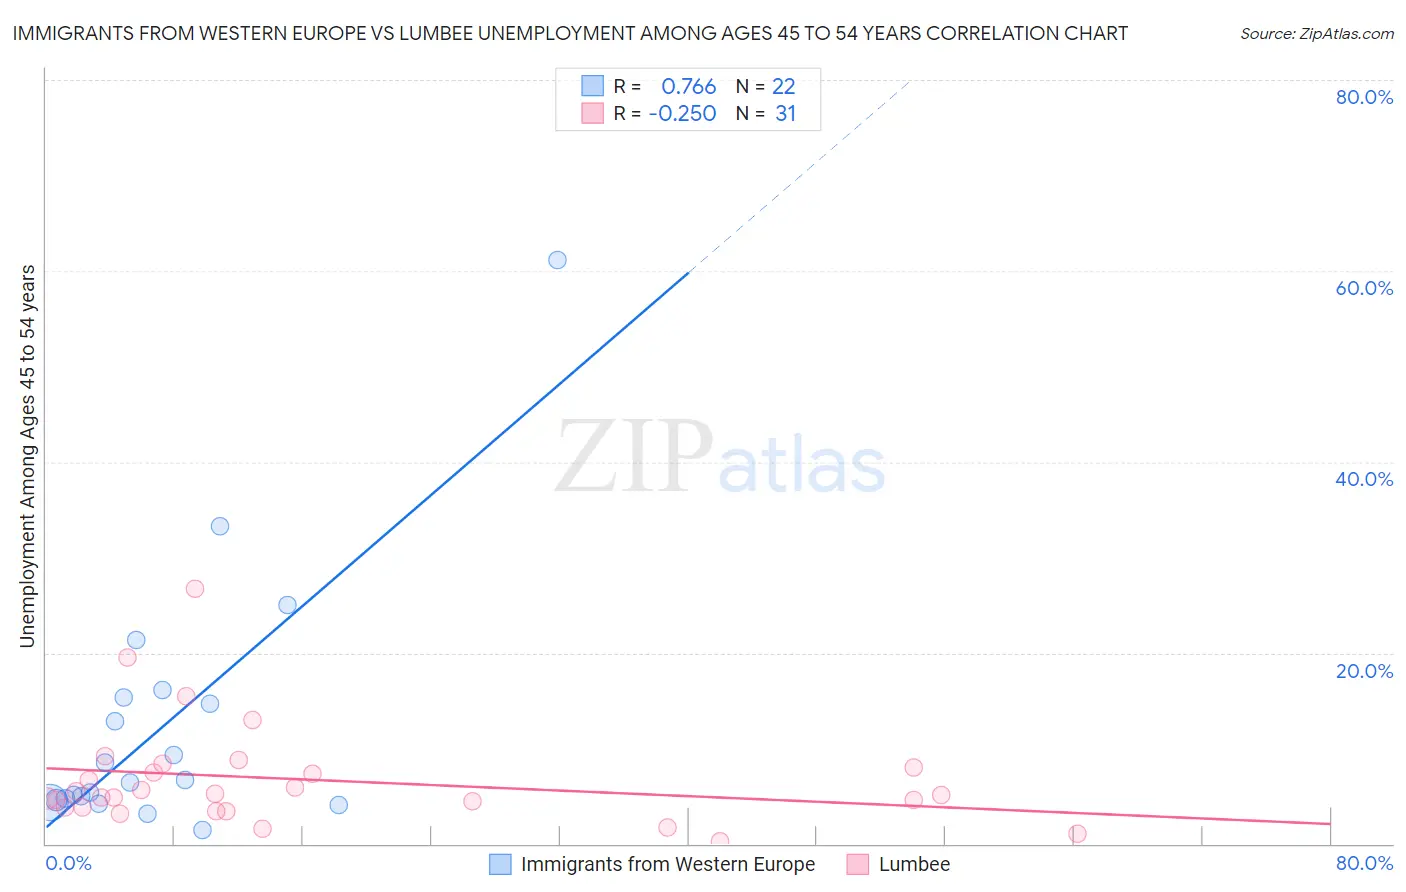
Immigrants from Western Europe vs Lumbee Unemployment Among Ages 45 to 54 years Correlation Chart

The statistical analysis conducted on geographies consisting of 473,073,431 people shows a strong positive correlation between the proportion of Immigrants from Western Europe and unemployment rate among population between the ages 45 and 54 in the United States with a correlation coefficient (R) of 0.766 and weighted average of 4.5%. Similarly, the statistical analysis conducted on geographies consisting of 91,020,578 people shows a weak negative correlation between the proportion of Lumbee and unemployment rate among population between the ages 45 and 54 in the United States with a correlation coefficient (R) of -0.250 and weighted average of 4.6%, a difference of 3.0%.
Immigrants from Western Europe vs Lumbee Unemployment Among Ages 45 to 54 years

Unemployment Among Ages 45 to 54 years Correlation Summary

MeasurementImmigrants from Western EuropeLumbee
Minimum1.5%0.30%
Maximum61.1%26.7%
Range59.6%26.4%
Mean12.4%6.7%
Median6.5%5.1%
Interquartile 25% (IQ1)4.5%3.8%
Interquartile 75% (IQ3)15.3%8.0%
Interquartile Range (IQR)10.8%4.2%
Standard Deviation (Sample)13.6%5.5%
Standard Deviation (Population)13.2%5.4%

Similar Demographics by Unemployment Among Ages 45 to 54 years

Demographics Similar to Immigrants from Western Europe by Unemployment Among Ages 45 to 54 years

In terms of unemployment among ages 45 to 54 years, the demographic groups most similar to Immigrants from Western Europe are Maltese (4.5%, a difference of 0.020%), Samoan (4.5%, a difference of 0.050%), Immigrants from Brazil (4.5%, a difference of 0.050%), Bangladeshi (4.5%, a difference of 0.11%), and Immigrants from Europe (4.5%, a difference of 0.13%).
DemographicsRating | RankUnemployment Among Ages 45 to 54 years
Immigrants | Nonimmigrants
62.8
/100
|
#159
Good
4.5%
Immigrants | South Eastern Asia
62.0
/100
|
#160
Good
4.5%
Immigrants | Eastern Europe
61.6
/100
|
#161
Good
4.5%
Immigrants | Indonesia
60.3
/100
|
#162
Good
4.5%
Bangladeshis
59.7
/100
|
#163
Average
4.5%
Samoans
58.5
/100
|
#164
Average
4.5%
Maltese
57.9
/100
|
#165
Average
4.5%
Immigrants | Western Europe
57.4
/100
|
#166
Average
4.5%
Immigrants | Brazil
56.4
/100
|
#167
Average
4.5%
Immigrants | Europe
54.7
/100
|
#168
Average
4.5%
Immigrants | Egypt
54.7
/100
|
#169
Average
4.5%
Spaniards
54.3
/100
|
#170
Average
4.5%
Egyptians
53.6
/100
|
#171
Average
4.5%
Colombians
53.3
/100
|
#172
Average
4.5%
Immigrants | Colombia
52.0
/100
|
#173
Average
4.5%

Demographics Similar to Lumbee by Unemployment Among Ages 45 to 54 years

In terms of unemployment among ages 45 to 54 years, the demographic groups most similar to Lumbee are Immigrants from Panama (4.6%, a difference of 0.15%), Cherokee (4.6%, a difference of 0.18%), Panamanian (4.6%, a difference of 0.20%), Immigrants from Cambodia (4.7%, a difference of 0.27%), and Immigrants from Iran (4.6%, a difference of 0.29%).
DemographicsRating | RankUnemployment Among Ages 45 to 54 years
Immigrants | Nigeria
13.3
/100
|
#209
Poor
4.6%
Immigrants | South America
12.2
/100
|
#210
Poor
4.6%
Creek
11.9
/100
|
#211
Poor
4.6%
Immigrants | Iran
11.5
/100
|
#212
Poor
4.6%
Panamanians
10.7
/100
|
#213
Poor
4.6%
Cherokee
10.6
/100
|
#214
Poor
4.6%
Immigrants | Panama
10.4
/100
|
#215
Poor
4.6%
Lumbee
9.2
/100
|
#216
Tragic
4.6%
Immigrants | Cambodia
7.4
/100
|
#217
Tragic
4.7%
Immigrants | Uganda
7.1
/100
|
#218
Tragic
4.7%
Nigerians
7.0
/100
|
#219
Tragic
4.7%
Guamanians/Chamorros
6.8
/100
|
#220
Tragic
4.7%
Choctaw
6.1
/100
|
#221
Tragic
4.7%
Immigrants | Southern Europe
6.0
/100
|
#222
Tragic
4.7%
Potawatomi
5.7
/100
|
#223
Tragic
4.7%