Zip Codes with the Highest Percentage of Population Employed in Office & Administration in Urbana, IL
RELATED REPORTS & OPTIONS
Office & Administration
Urbana
Compare Zip Codes
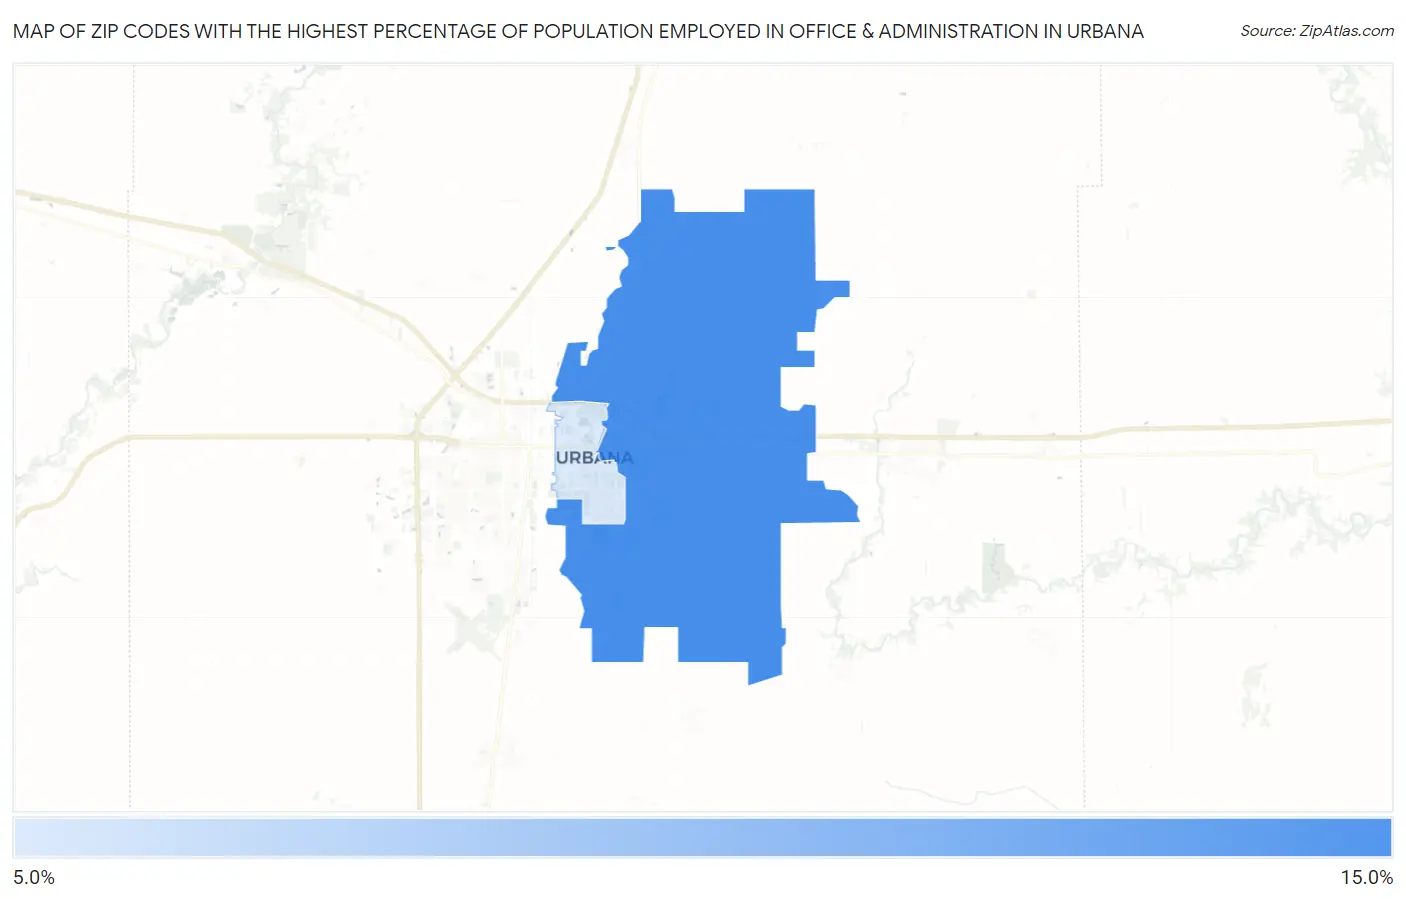
Map of Zip Codes with the Highest Percentage of Population Employed in Office & Administration in Urbana
0.0%
15.0%
Zip Codes with the Highest Percentage of Population Employed in Office & Administration in Urbana, IL
| Zip Code | % Employed | vs State | vs National | |
| 1. | 61802 | 11.6% | 10.8%(+0.846)#570 | 10.9%(+0.754)#11,910 |
| 2. | 61801 | 8.4% | 10.8%(-2.40)#995 | 10.9%(-2.50)#22,060 |
1
Common Questions
What are the Top Zip Codes with the Highest Percentage of Population Employed in Office & Administration in Urbana, IL?
Top Zip Codes with the Highest Percentage of Population Employed in Office & Administration in Urbana, IL are:
What zip code has the Highest Percentage of Population Employed in Office & Administration in Urbana, IL?
61802 has the Highest Percentage of Population Employed in Office & Administration in Urbana, IL with 11.6%.
What is the Percentage of Population Employed in Office & Administration in Urbana, IL?
Percentage of Population Employed in Office & Administration in Urbana is 9.2%.
What is the Percentage of Population Employed in Office & Administration in Illinois?
Percentage of Population Employed in Office & Administration in Illinois is 10.8%.
What is the Percentage of Population Employed in Office & Administration in the United States?
Percentage of Population Employed in Office & Administration in the United States is 10.9%.