Zip Codes with the Highest Percentage of Population Employed in Legal Services & Support in Joliet, IL
RELATED REPORTS & OPTIONS
Legal Services & Support
Joliet
Compare Zip Codes
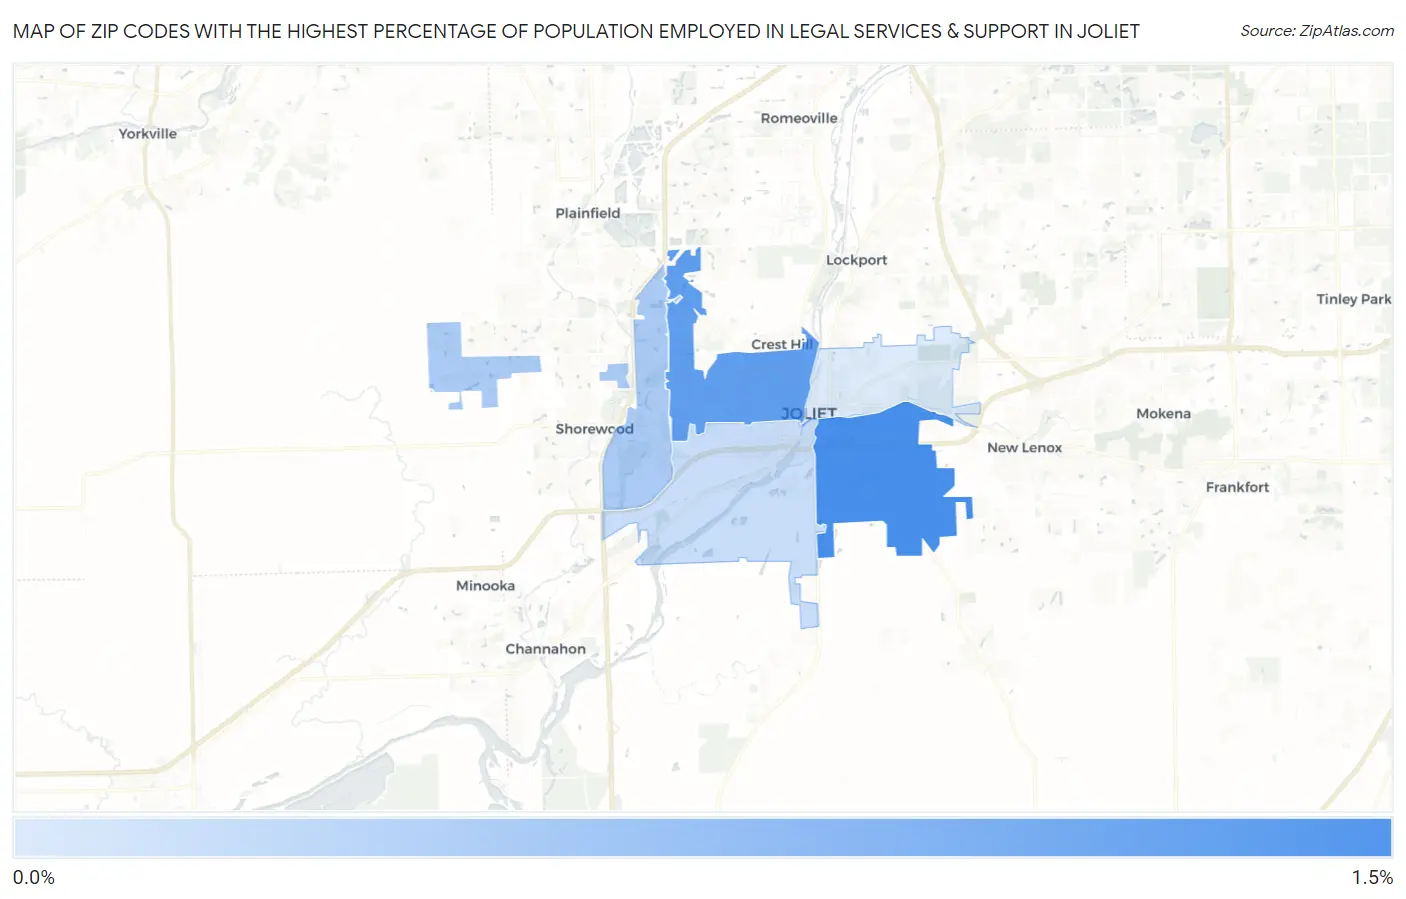
Map of Zip Codes with the Highest Percentage of Population Employed in Legal Services & Support in Joliet
0.0%
1.5%
Zip Codes with the Highest Percentage of Population Employed in Legal Services & Support in Joliet, IL
| Zip Code | % Employed | vs State | vs National | |
| 1. | 60433 | 1.1% | 1.3%(-0.267)#270 | 1.2%(-0.102)#7,289 |
| 2. | 60435 | 0.94% | 1.3%(-0.413)#311 | 1.2%(-0.247)#8,307 |
| 3. | 60431 | 0.53% | 1.3%(-0.823)#480 | 1.2%(-0.658)#12,298 |
| 4. | 60436 | 0.36% | 1.3%(-0.993)#577 | 1.2%(-0.828)#14,385 |
| 5. | 60432 | 0.24% | 1.3%(-1.11)#642 | 1.2%(-0.945)#15,766 |
1
Common Questions
What are the Top 3 Zip Codes with the Highest Percentage of Population Employed in Legal Services & Support in Joliet, IL?
Top 3 Zip Codes with the Highest Percentage of Population Employed in Legal Services & Support in Joliet, IL are:
What zip code has the Highest Percentage of Population Employed in Legal Services & Support in Joliet, IL?
60433 has the Highest Percentage of Population Employed in Legal Services & Support in Joliet, IL with 1.1%.
What is the Percentage of Population Employed in Legal Services & Support in Joliet, IL?
Percentage of Population Employed in Legal Services & Support in Joliet is 0.57%.
What is the Percentage of Population Employed in Legal Services & Support in Illinois?
Percentage of Population Employed in Legal Services & Support in Illinois is 1.3%.
What is the Percentage of Population Employed in Legal Services & Support in the United States?
Percentage of Population Employed in Legal Services & Support in the United States is 1.2%.