Zip Codes with the Highest Percentage of Population Employed in Food Preparation & Serving in Valdosta, GA
RELATED REPORTS & OPTIONS
Food Preparation & Serving
Valdosta
Compare Zip Codes
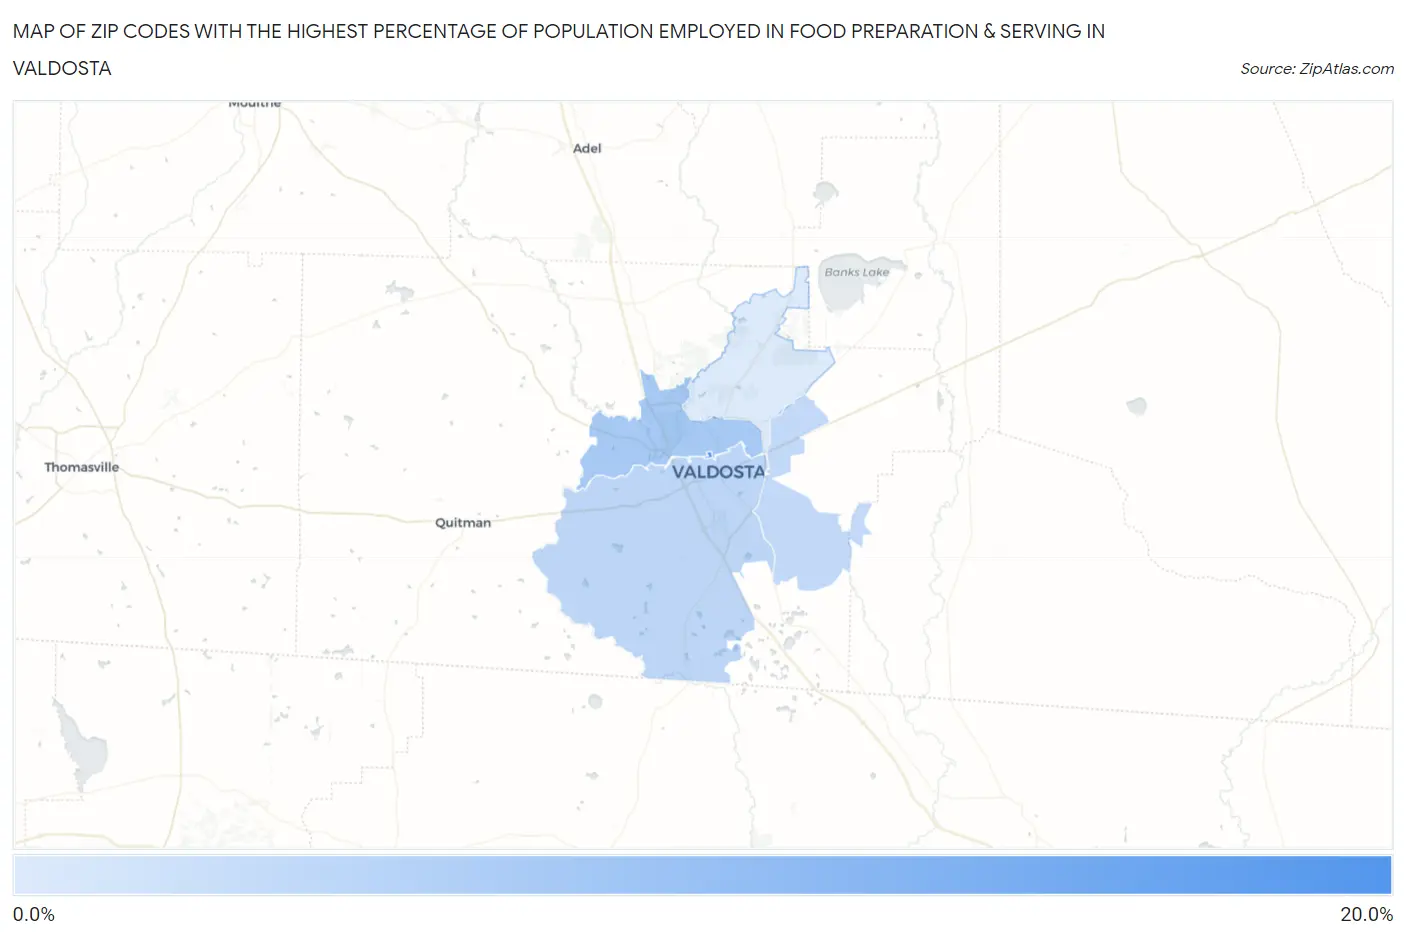
Map of Zip Codes with the Highest Percentage of Population Employed in Food Preparation & Serving in Valdosta
0.0%
20.0%
Zip Codes with the Highest Percentage of Population Employed in Food Preparation & Serving in Valdosta, GA
| Zip Code | % Employed | vs State | vs National | |
| 1. | 31698 | 19.2% | 5.1%(+14.0)#12 | 5.3%(+13.9)#551 |
| 2. | 31602 | 8.2% | 5.1%(+3.10)#86 | 5.3%(+2.96)#4,381 |
| 3. | 31601 | 6.0% | 5.1%(+0.823)#203 | 5.3%(+0.682)#9,446 |
| 4. | 31606 | 5.4% | 5.1%(+0.302)#255 | 5.3%(+0.161)#11,239 |
| 5. | 31605 | 2.5% | 5.1%(-2.64)#548 | 5.3%(-2.78)#23,137 |
1
Common Questions
What are the Top 3 Zip Codes with the Highest Percentage of Population Employed in Food Preparation & Serving in Valdosta, GA?
Top 3 Zip Codes with the Highest Percentage of Population Employed in Food Preparation & Serving in Valdosta, GA are:
What zip code has the Highest Percentage of Population Employed in Food Preparation & Serving in Valdosta, GA?
31698 has the Highest Percentage of Population Employed in Food Preparation & Serving in Valdosta, GA with 19.2%.
What is the Percentage of Population Employed in Food Preparation & Serving in Valdosta, GA?
Percentage of Population Employed in Food Preparation & Serving in Valdosta is 6.6%.
What is the Percentage of Population Employed in Food Preparation & Serving in Georgia?
Percentage of Population Employed in Food Preparation & Serving in Georgia is 5.1%.
What is the Percentage of Population Employed in Food Preparation & Serving in the United States?
Percentage of Population Employed in Food Preparation & Serving in the United States is 5.3%.