Zip Codes with the Highest Percentage of Population Employed in Food Preparation & Serving in Douglas, GA
RELATED REPORTS & OPTIONS
Food Preparation & Serving
Douglas
Compare Zip Codes
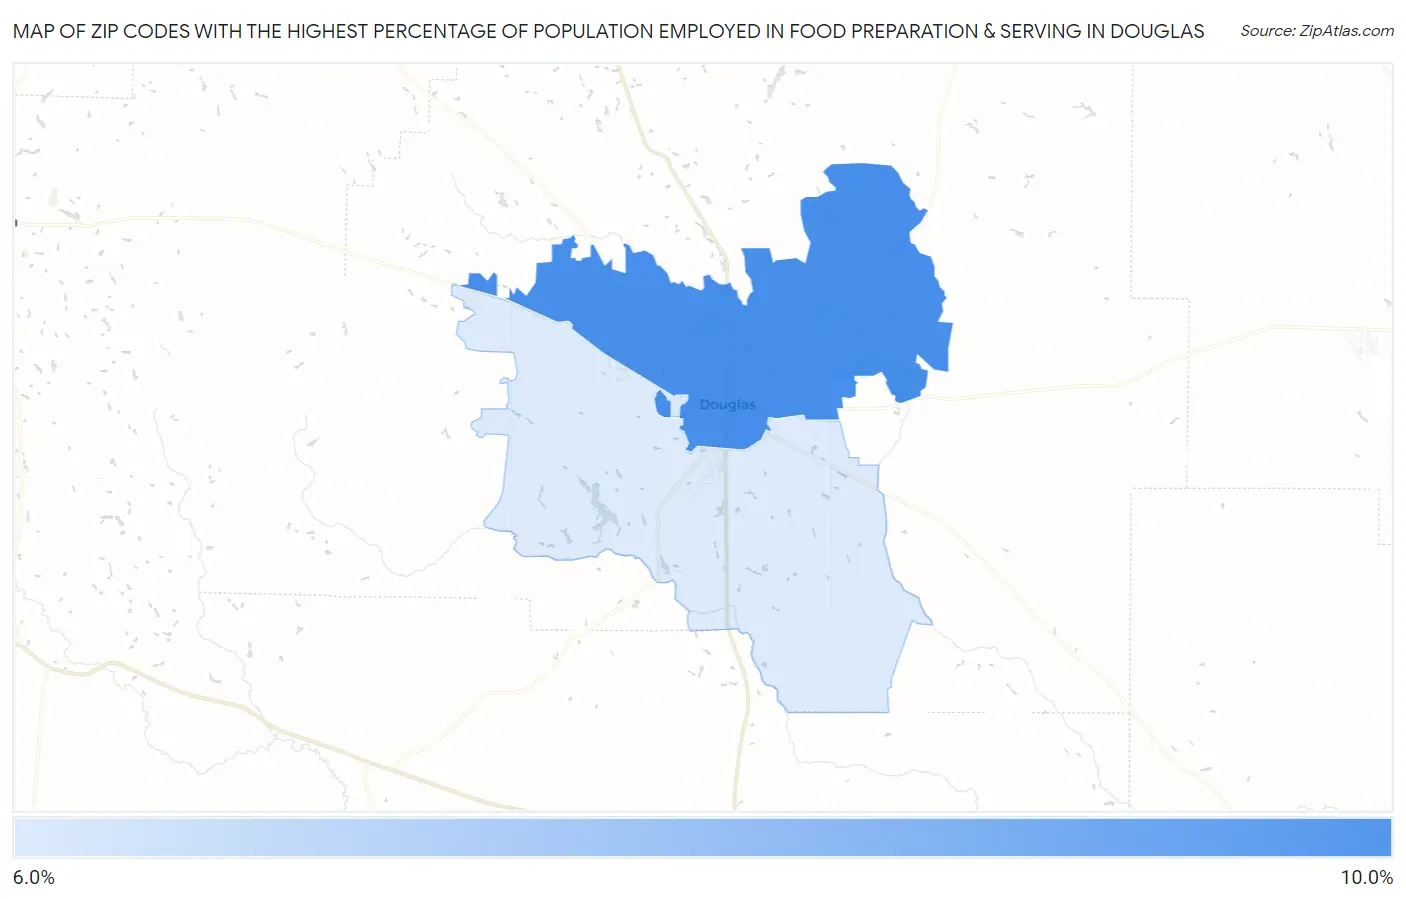
Map of Zip Codes with the Highest Percentage of Population Employed in Food Preparation & Serving in Douglas
0.0%
10.0%
Zip Codes with the Highest Percentage of Population Employed in Food Preparation & Serving in Douglas, GA
| Zip Code | % Employed | vs State | vs National | |
| 1. | 31533 | 9.9% | 5.1%(+4.78)#53 | 5.3%(+4.64)#2,690 |
| 2. | 31535 | 6.4% | 5.1%(+1.21)#168 | 5.3%(+1.06)#8,275 |
1
Common Questions
What are the Top Zip Codes with the Highest Percentage of Population Employed in Food Preparation & Serving in Douglas, GA?
Top Zip Codes with the Highest Percentage of Population Employed in Food Preparation & Serving in Douglas, GA are:
What zip code has the Highest Percentage of Population Employed in Food Preparation & Serving in Douglas, GA?
31533 has the Highest Percentage of Population Employed in Food Preparation & Serving in Douglas, GA with 9.9%.
What is the Percentage of Population Employed in Food Preparation & Serving in Douglas, GA?
Percentage of Population Employed in Food Preparation & Serving in Douglas is 9.3%.
What is the Percentage of Population Employed in Food Preparation & Serving in Georgia?
Percentage of Population Employed in Food Preparation & Serving in Georgia is 5.1%.
What is the Percentage of Population Employed in Food Preparation & Serving in the United States?
Percentage of Population Employed in Food Preparation & Serving in the United States is 5.3%.