Zip Codes with the Highest Percentage of Population Employed in Legal Services & Support in Valdosta, GA
RELATED REPORTS & OPTIONS
Legal Services & Support
Valdosta
Compare Zip Codes
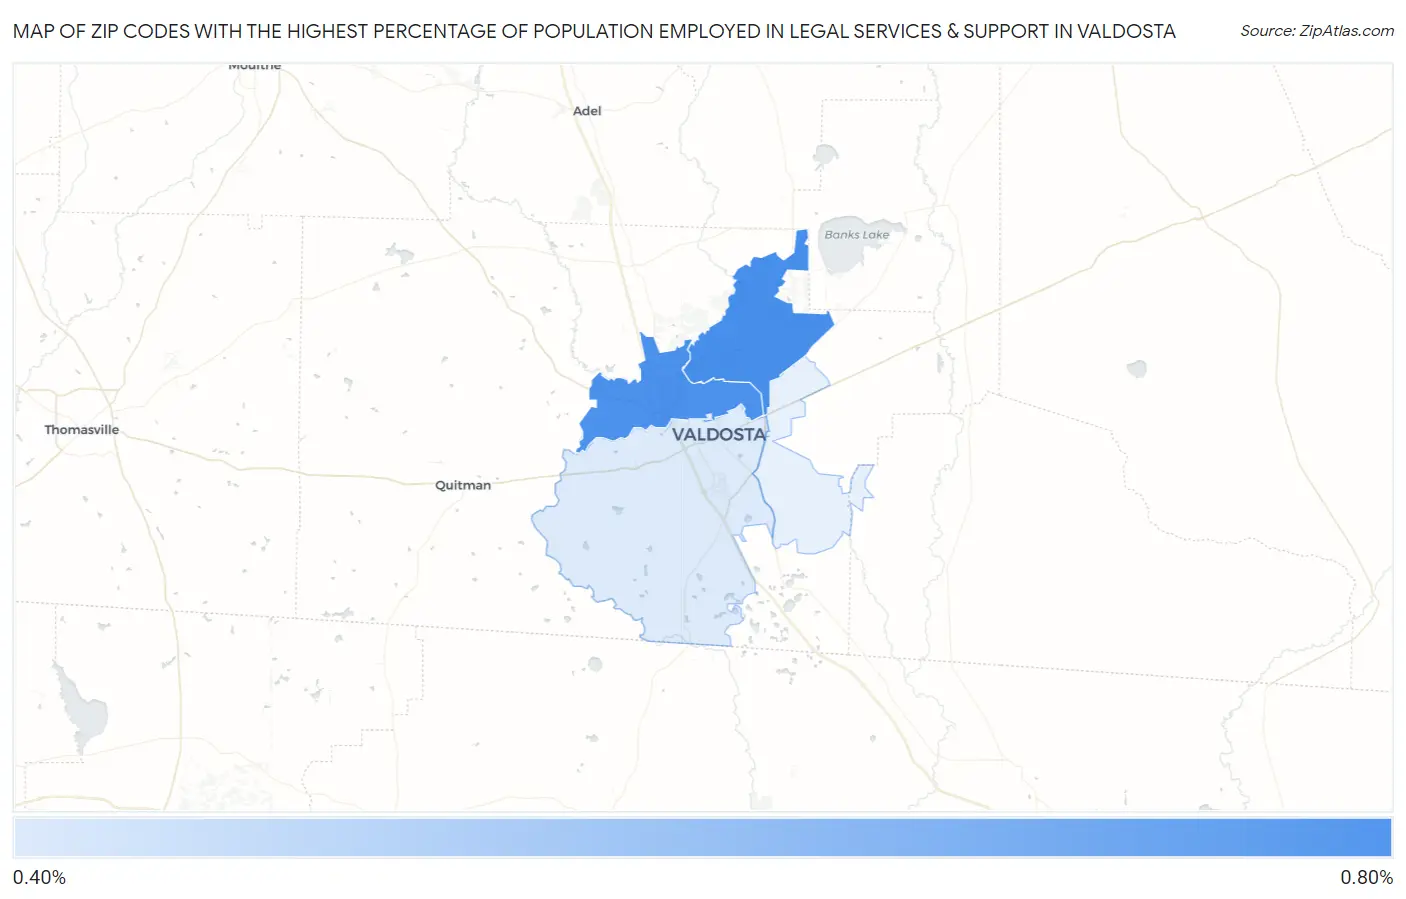
Map of Zip Codes with the Highest Percentage of Population Employed in Legal Services & Support in Valdosta
0.0%
0.80%
Zip Codes with the Highest Percentage of Population Employed in Legal Services & Support in Valdosta, GA
| Zip Code | % Employed | vs State | vs National | |
| 1. | 31605 | 0.75% | 1.1%(-0.352)#236 | 1.2%(-0.432)#9,907 |
| 2. | 31602 | 0.74% | 1.1%(-0.363)#240 | 1.2%(-0.443)#10,009 |
| 3. | 31601 | 0.46% | 1.1%(-0.640)#323 | 1.2%(-0.721)#13,089 |
1
Common Questions
What are the Top 3 Zip Codes with the Highest Percentage of Population Employed in Legal Services & Support in Valdosta, GA?
Top 3 Zip Codes with the Highest Percentage of Population Employed in Legal Services & Support in Valdosta, GA are:
What zip code has the Highest Percentage of Population Employed in Legal Services & Support in Valdosta, GA?
31605 has the Highest Percentage of Population Employed in Legal Services & Support in Valdosta, GA with 0.75%.
What is the Percentage of Population Employed in Legal Services & Support in Valdosta, GA?
Percentage of Population Employed in Legal Services & Support in Valdosta is 0.52%.
What is the Percentage of Population Employed in Legal Services & Support in Georgia?
Percentage of Population Employed in Legal Services & Support in Georgia is 1.1%.
What is the Percentage of Population Employed in Legal Services & Support in the United States?
Percentage of Population Employed in Legal Services & Support in the United States is 1.2%.