Zip Codes with the Highest Percentage of Population Employed in Food Preparation & Serving in Columbus, GA
RELATED REPORTS & OPTIONS
Food Preparation & Serving
Columbus
Compare Zip Codes
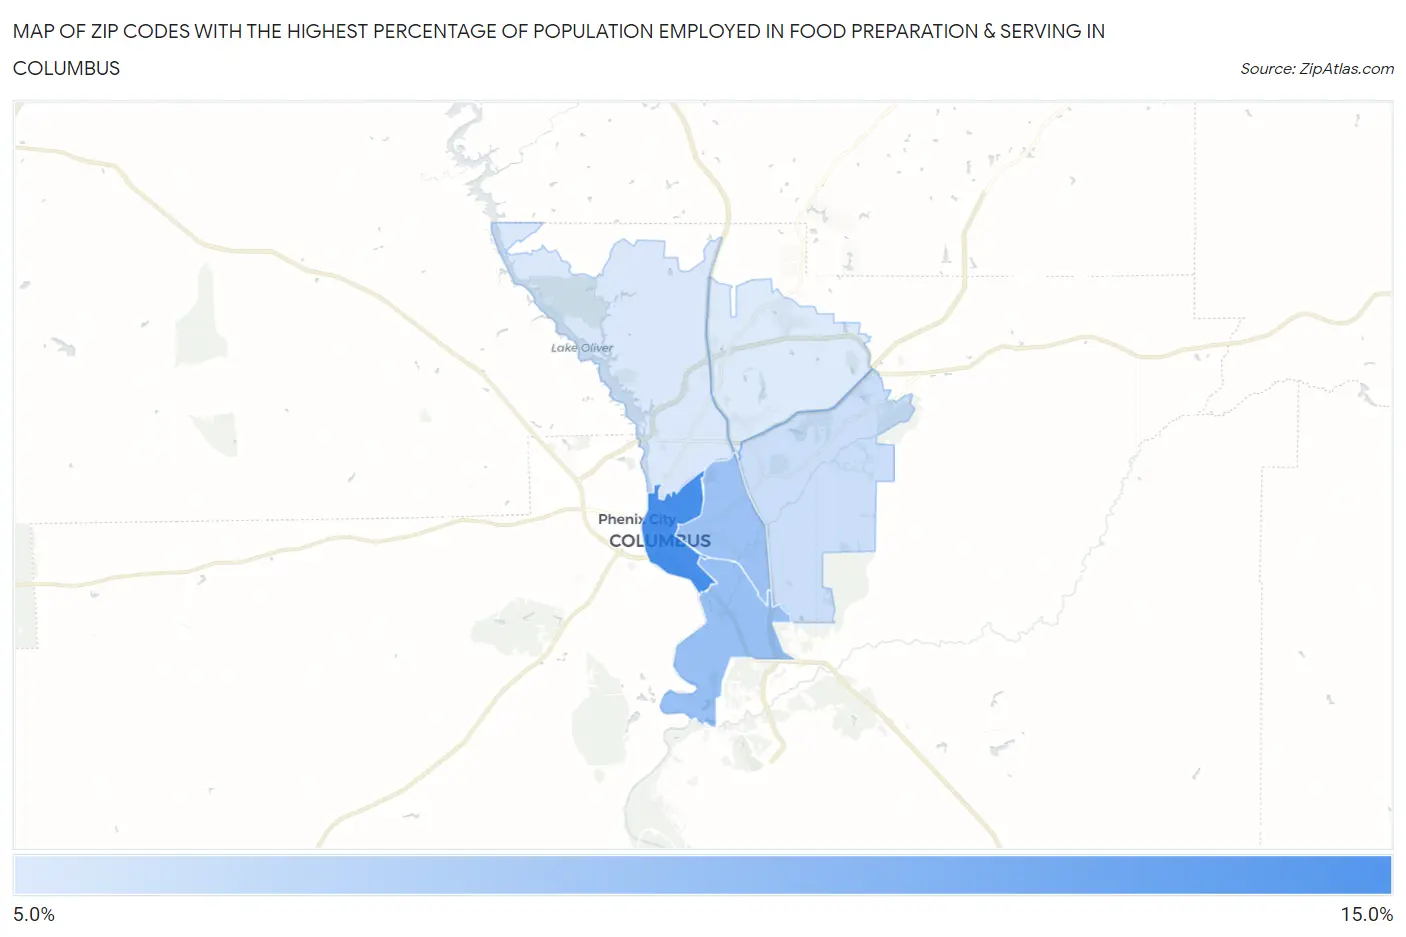
Map of Zip Codes with the Highest Percentage of Population Employed in Food Preparation & Serving in Columbus
0.0%
15.0%
Zip Codes with the Highest Percentage of Population Employed in Food Preparation & Serving in Columbus, GA
| Zip Code | % Employed | vs State | vs National | |
| 1. | 31901 | 14.4% | 5.1%(+9.27)#18 | 5.3%(+9.13)#1,076 |
| 2. | 31903 | 10.0% | 5.1%(+4.83)#52 | 5.3%(+4.69)#2,656 |
| 3. | 31906 | 9.6% | 5.1%(+4.50)#56 | 5.3%(+4.36)#2,929 |
| 4. | 31907 | 7.2% | 5.1%(+2.02)#124 | 5.3%(+1.88)#6,203 |
| 5. | 31904 | 6.4% | 5.1%(+1.24)#165 | 5.3%(+1.10)#8,177 |
| 6. | 31909 | 6.2% | 5.1%(+1.07)#188 | 5.3%(+0.930)#8,688 |
1
Common Questions
What are the Top 5 Zip Codes with the Highest Percentage of Population Employed in Food Preparation & Serving in Columbus, GA?
Top 5 Zip Codes with the Highest Percentage of Population Employed in Food Preparation & Serving in Columbus, GA are:
What zip code has the Highest Percentage of Population Employed in Food Preparation & Serving in Columbus, GA?
31901 has the Highest Percentage of Population Employed in Food Preparation & Serving in Columbus, GA with 14.4%.
What is the Percentage of Population Employed in Food Preparation & Serving in Columbus, GA?
Percentage of Population Employed in Food Preparation & Serving in Columbus is 7.2%.
What is the Percentage of Population Employed in Food Preparation & Serving in Georgia?
Percentage of Population Employed in Food Preparation & Serving in Georgia is 5.1%.
What is the Percentage of Population Employed in Food Preparation & Serving in the United States?
Percentage of Population Employed in Food Preparation & Serving in the United States is 5.3%.