Zip Codes with the Highest Percentage of Population Employed in Food Preparation & Serving in Macon, GA
RELATED REPORTS & OPTIONS
Food Preparation & Serving
Macon
Compare Zip Codes
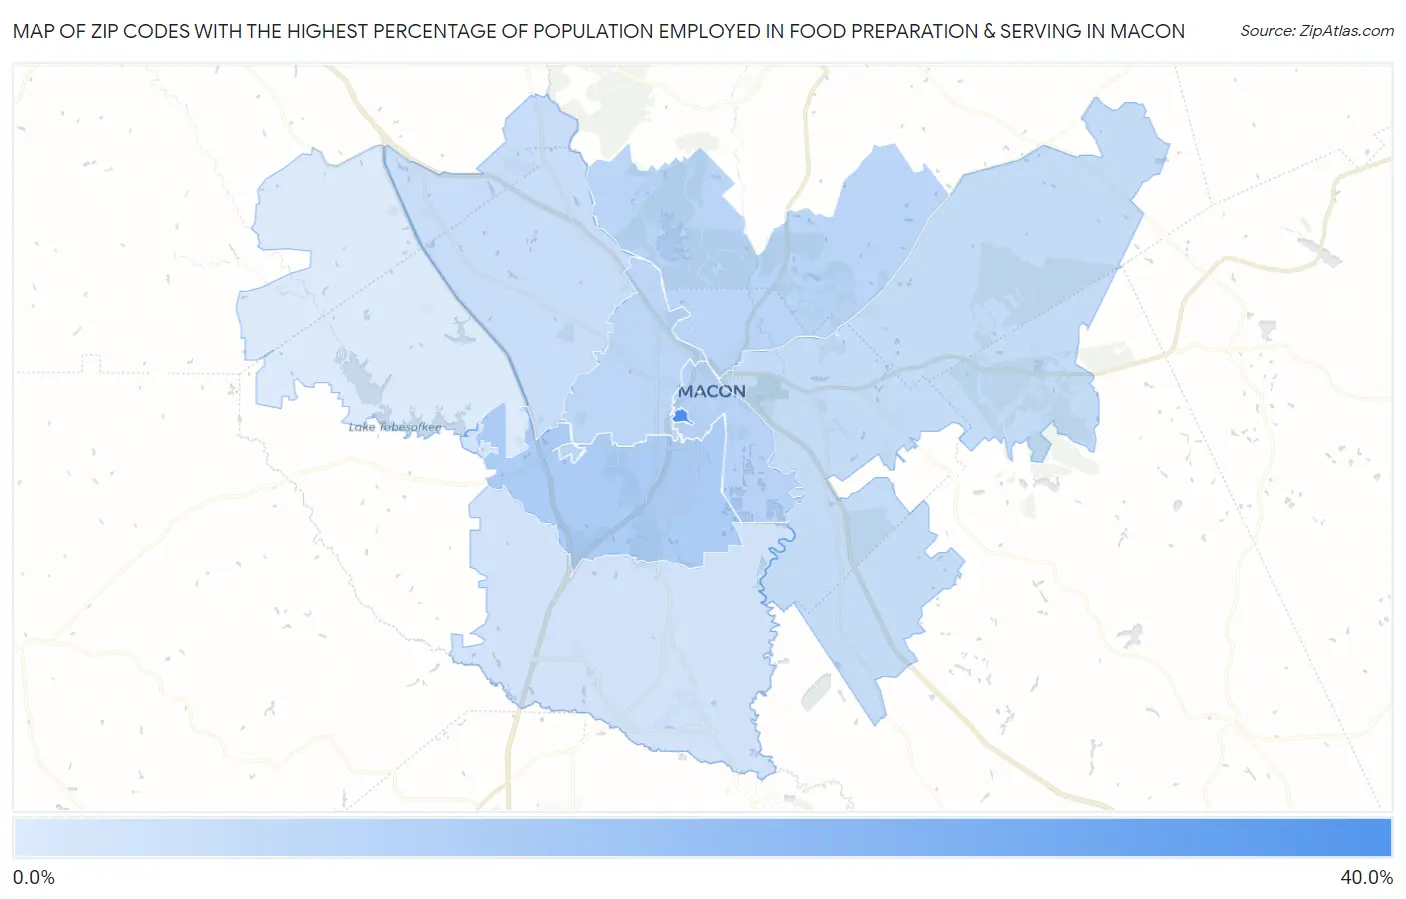
Map of Zip Codes with the Highest Percentage of Population Employed in Food Preparation & Serving in Macon
0.0%
40.0%
Zip Codes with the Highest Percentage of Population Employed in Food Preparation & Serving in Macon, GA
| Zip Code | % Employed | vs State | vs National | |
| 1. | 31207 | 32.5% | 5.1%(+27.4)#5 | 5.3%(+27.2)#178 |
| 2. | 31206 | 10.5% | 5.1%(+5.31)#45 | 5.3%(+5.17)#2,345 |
| 3. | 31201 | 8.3% | 5.1%(+3.17)#83 | 5.3%(+3.03)#4,299 |
| 4. | 31211 | 7.8% | 5.1%(+2.62)#100 | 5.3%(+2.47)#5,123 |
| 5. | 31204 | 7.6% | 5.1%(+2.41)#107 | 5.3%(+2.27)#5,458 |
| 6. | 31217 | 6.0% | 5.1%(+0.842)#201 | 5.3%(+0.701)#9,388 |
| 7. | 31210 | 5.1% | 5.1%(-0.002)#282 | 5.3%(-0.144)#12,390 |
| 8. | 31216 | 3.5% | 5.1%(-1.69)#465 | 5.3%(-1.83)#19,381 |
| 9. | 31220 | 1.5% | 5.1%(-3.61)#608 | 5.3%(-3.75)#25,912 |
1
Common Questions
What are the Top 5 Zip Codes with the Highest Percentage of Population Employed in Food Preparation & Serving in Macon, GA?
Top 5 Zip Codes with the Highest Percentage of Population Employed in Food Preparation & Serving in Macon, GA are:
What zip code has the Highest Percentage of Population Employed in Food Preparation & Serving in Macon, GA?
31207 has the Highest Percentage of Population Employed in Food Preparation & Serving in Macon, GA with 32.5%.
What is the Percentage of Population Employed in Food Preparation & Serving in Georgia?
Percentage of Population Employed in Food Preparation & Serving in Georgia is 5.1%.
What is the Percentage of Population Employed in Food Preparation & Serving in the United States?
Percentage of Population Employed in Food Preparation & Serving in the United States is 5.3%.