Zip Codes with the Highest Percentage of Population Employed in Food Preparation & Serving in Albany, GA
RELATED REPORTS & OPTIONS
Food Preparation & Serving
Albany
Compare Zip Codes
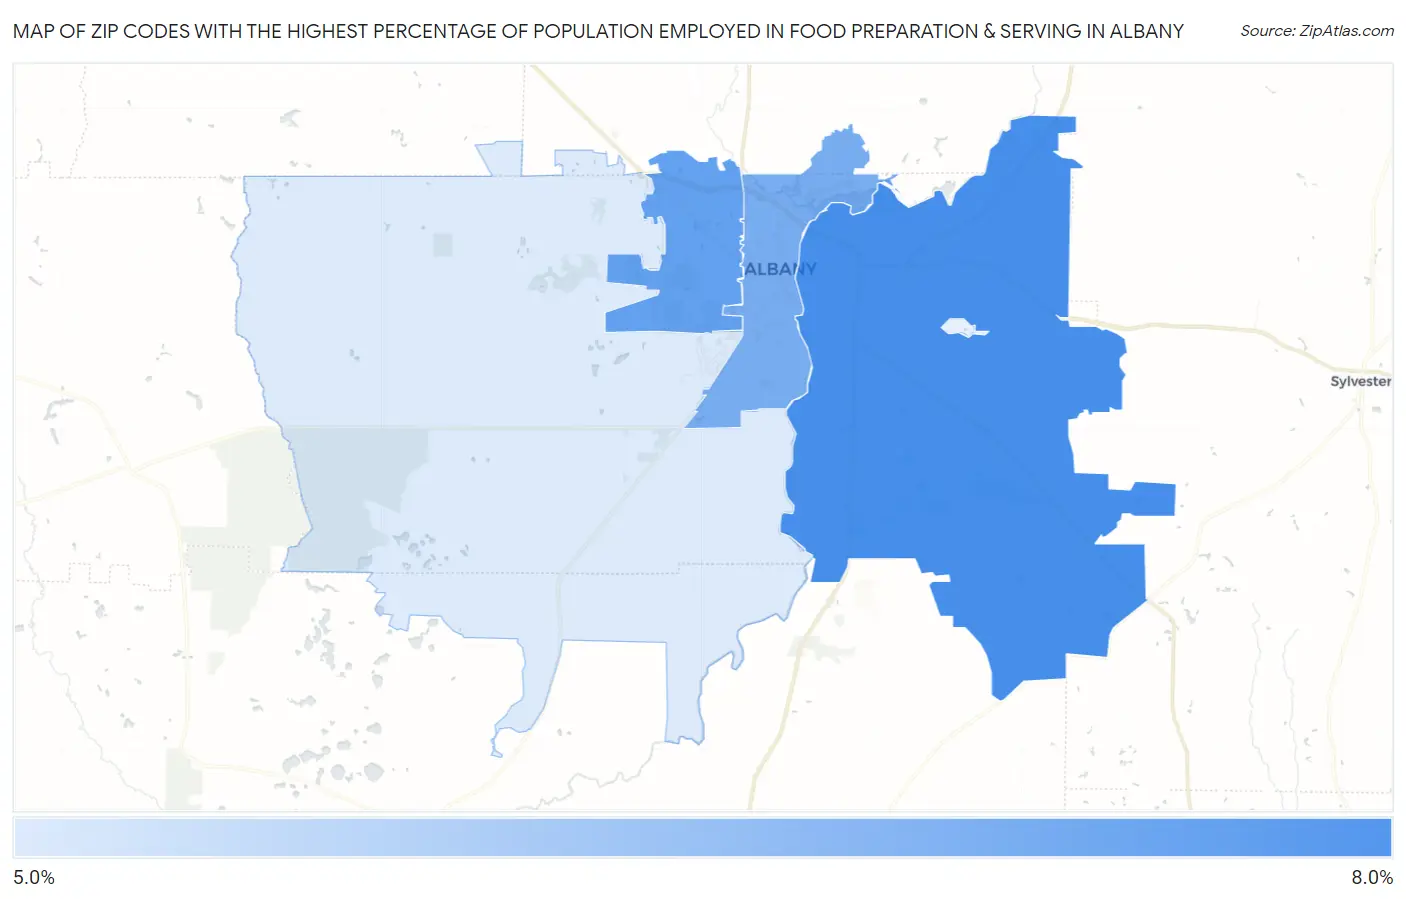
Map of Zip Codes with the Highest Percentage of Population Employed in Food Preparation & Serving in Albany
0.0%
8.0%
Zip Codes with the Highest Percentage of Population Employed in Food Preparation & Serving in Albany, GA
| Zip Code | % Employed | vs State | vs National | |
| 1. | 31705 | 6.4% | 5.1%(+1.30)#162 | 5.3%(+1.16)#8,021 |
| 2. | 31707 | 6.2% | 5.1%(+1.05)#189 | 5.3%(+0.910)#8,746 |
| 3. | 31701 | 6.0% | 5.1%(+0.842)#200 | 5.3%(+0.701)#9,387 |
| 4. | 31721 | 5.1% | 5.1%(-0.089)#293 | 5.3%(-0.230)#12,713 |
1
Common Questions
What are the Top 3 Zip Codes with the Highest Percentage of Population Employed in Food Preparation & Serving in Albany, GA?
Top 3 Zip Codes with the Highest Percentage of Population Employed in Food Preparation & Serving in Albany, GA are:
What zip code has the Highest Percentage of Population Employed in Food Preparation & Serving in Albany, GA?
31705 has the Highest Percentage of Population Employed in Food Preparation & Serving in Albany, GA with 6.4%.
What is the Percentage of Population Employed in Food Preparation & Serving in Albany, GA?
Percentage of Population Employed in Food Preparation & Serving in Albany is 7.1%.
What is the Percentage of Population Employed in Food Preparation & Serving in Georgia?
Percentage of Population Employed in Food Preparation & Serving in Georgia is 5.1%.
What is the Percentage of Population Employed in Food Preparation & Serving in the United States?
Percentage of Population Employed in Food Preparation & Serving in the United States is 5.3%.