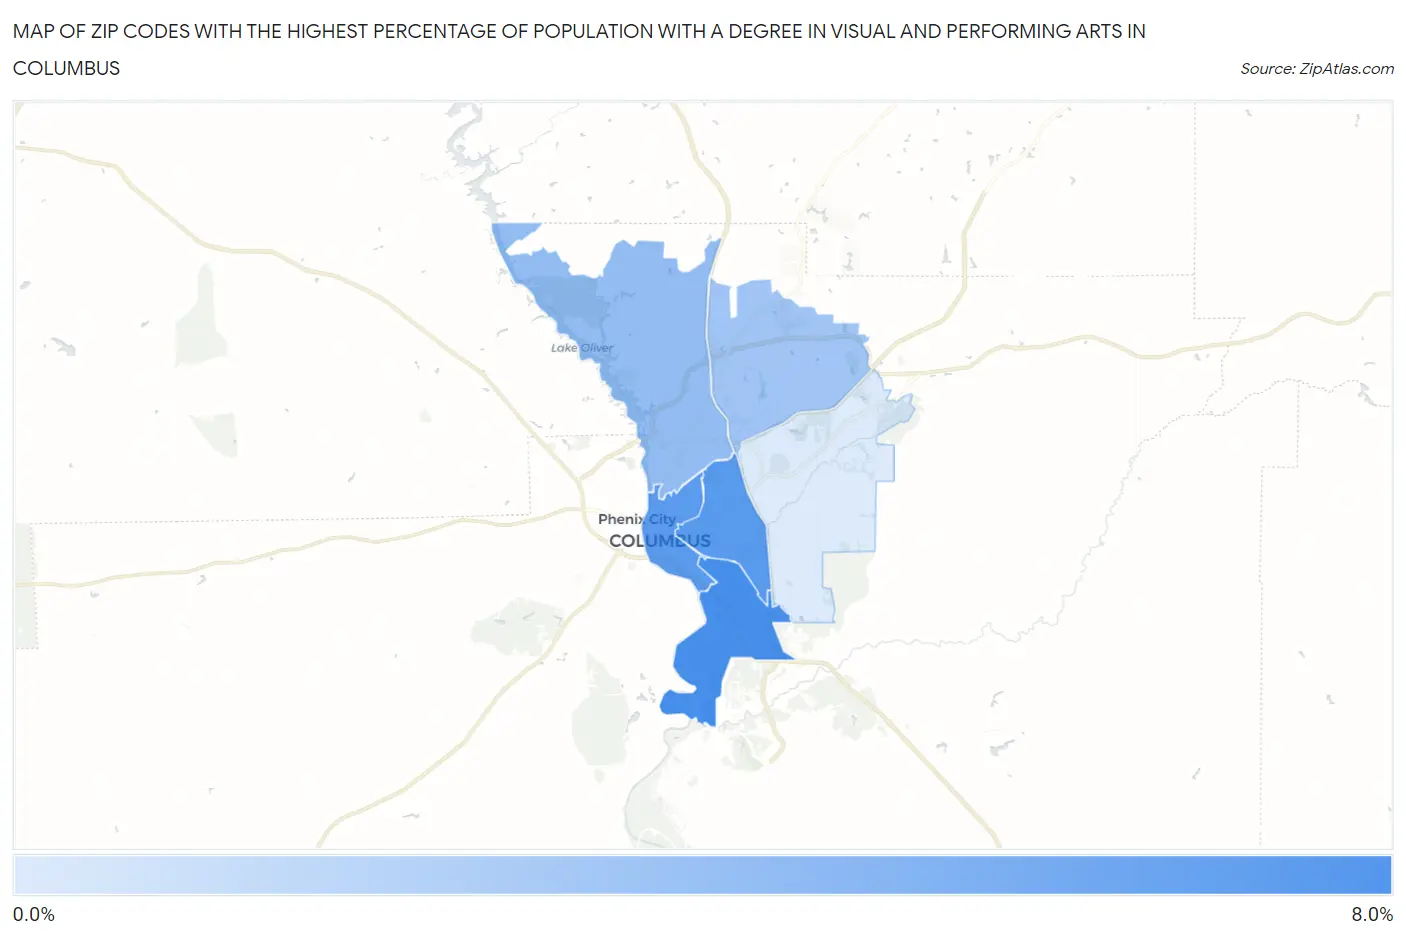
Zip Codes with the Highest Percentage of Population with a Degree in Visual and Performing Arts in Columbus, GA
RELATED REPORTS & OPTIONS
Visual and Performing Arts
Columbus
Compare Zip Codes
Map of Zip Codes with the Highest Percentage of Population with a Degree in Visual and Performing Arts in Columbus
0.0%
8.0%
Zip Codes with the Highest Percentage of Population with a Degree in Visual and Performing Arts in Columbus, GA
| Zip Code | % Graduates | vs State | vs National | |
| 1. | 31903 | 6.9% | 3.8%(+3.10)#60 | 4.3%(+2.64)#3,775 |
| 2. | 31906 | 6.2% | 3.8%(+2.41)#78 | 4.3%(+1.95)#4,589 |
| 3. | 31901 | 6.2% | 3.8%(+2.39)#79 | 4.3%(+1.92)#4,635 |
| 4. | 31904 | 3.8% | 3.8%(+0.033)#201 | 4.3%(-0.428)#9,800 |
| 5. | 31909 | 3.3% | 3.8%(-0.496)#242 | 4.3%(-0.957)#11,632 |
| 6. | 31907 | 0.91% | 3.8%(-2.88)#449 | 4.3%(-3.34)#19,914 |
1
Common Questions
What are the Top 5 Zip Codes with the Highest Percentage of Population with a Degree in Visual and Performing Arts in Columbus, GA?
Top 5 Zip Codes with the Highest Percentage of Population with a Degree in Visual and Performing Arts in Columbus, GA are:
What zip code has the Highest Percentage of Population with a Degree in Visual and Performing Arts in Columbus, GA?
31903 has the Highest Percentage of Population with a Degree in Visual and Performing Arts in Columbus, GA with 6.9%.
What is the Percentage of Population with a Degree in Visual and Performing Arts in Columbus, GA?
Percentage of Population with a Degree in Visual and Performing Arts in Columbus is 2.9%.
What is the Percentage of Population with a Degree in Visual and Performing Arts in Georgia?
Percentage of Population with a Degree in Visual and Performing Arts in Georgia is 3.8%.
What is the Percentage of Population with a Degree in Visual and Performing Arts in the United States?
Percentage of Population with a Degree in Visual and Performing Arts in the United States is 4.3%.